
Slide deck for performance report for Q1 2026/27: FSA Business Committee
Updated 18 September 2026
Applies to England, Northern Ireland and Wales

© Crown copyright 2026
This publication is licensed under the terms of the Open Government Licence v3.0 except where otherwise stated. To view this licence, visit nationalarchives.gov.uk/doc/open-government-licence/version/3 or write to the Information Policy Team, The National Archives, Kew, London TW9 4DU, or email: psi@nationalarchives.gov.uk.
Where we have identified any third party copyright information you will need to obtain permission from the copyright holders concerned.
This publication is available at https://www.gov.uk/government/publications/food-standards-agency-business-committee-meeting-september-2026/slide-deck-for-performance-report-for-q1-202627-fsa-business-committee
Slides deck for the Food Standards Agency (FSA) 8 June 2026 Business Committee meeting. This meeting took place at 64 Victoria Street, London.
Below you will find screenshots of each slide alongside descriptions of their contents.
Slide 1: cover page
A title slide with a dark green corporate background with the Food Standards Agency branding. Reads ‘Business Committee performance report, 2 September 2026. FSA BC 26-09-04. Data source: Executive performance dashboard 05 August 2026’.
Slide 2: contents
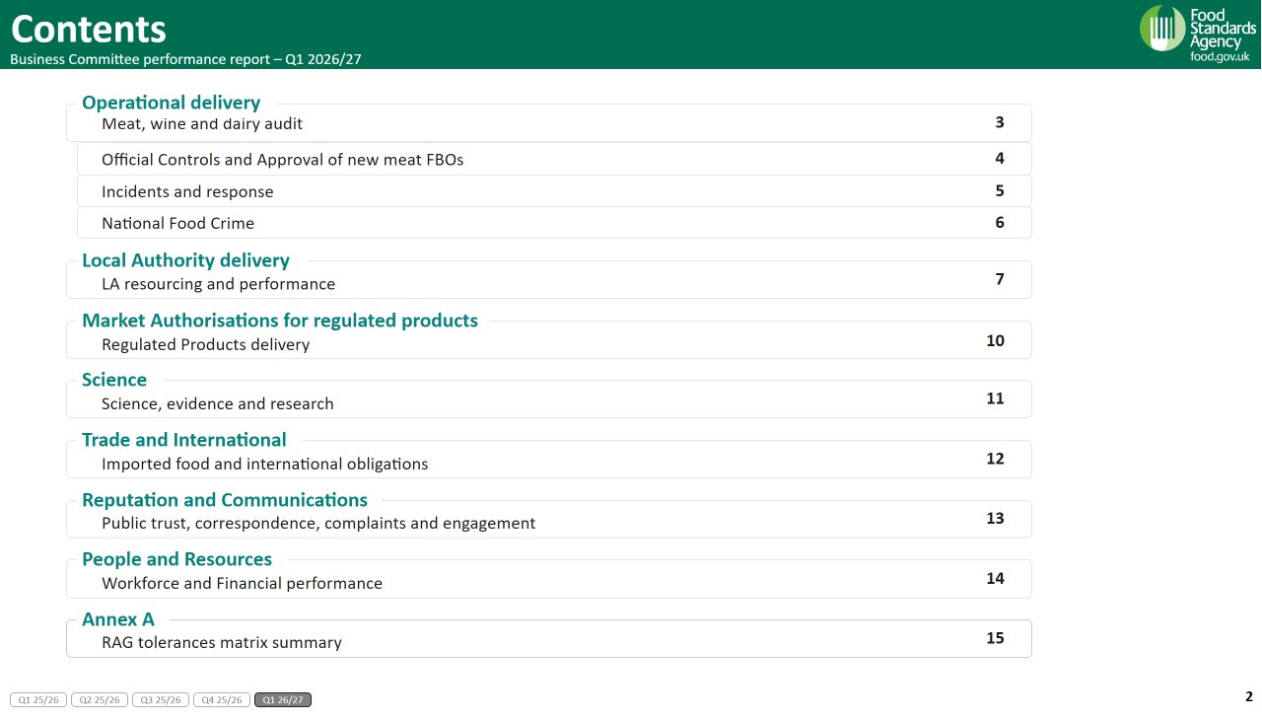
A contents or navigation slide presented as a dashboard menu. The slide contains numerous rectangular buttons arranged in a grid, each linking to a section of the report:
Operational delivery:
- Meat, wine and dairy audit
- Official Controls and Approval Of new meat FBOs
- Incidents and response
- National Food Crime
Local Authority delivery:
- LA resourcing and performance
Market Authorisations for regulated products:
- Regulated Products delivery
Science:
- Science, evidence and research
Trade and International:
- Imported food and international obligations
Reputation and Communications:
- Public trust, correspondence, complaints and engagement
People and Resources:
- Workforce and Financial performance
Annex A:
- RAG tolerances matrix summary
Slide 3: Operational delivery
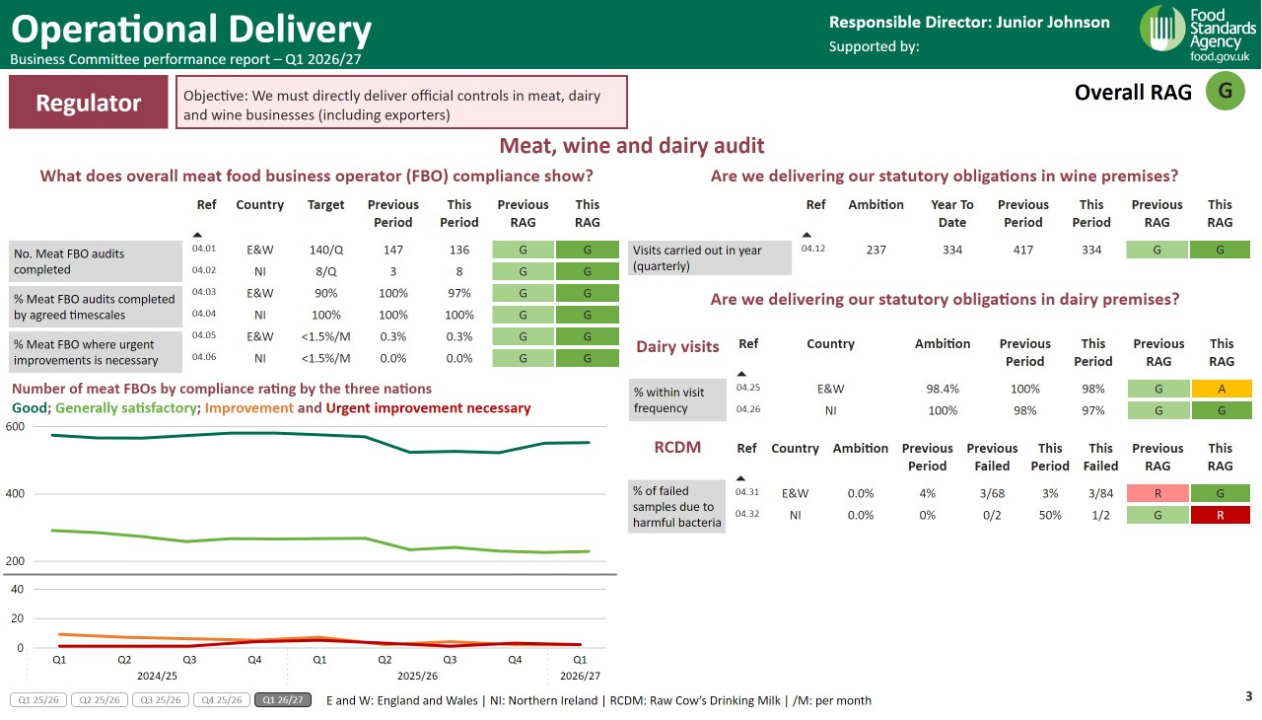
A densely populated dashboard slide containing multiple performance charts and tables. The layout includes:
- 2 line charts showing trends over time
- several key performance indicator (KPI) cards displaying headline figures
- multiple summary tables covering food business operators, wine and dairy measures
- text commentary boxes explaining performance
- an overall RAG (Red, Amber, Green) status indicator
Content is arranged in a multi-column structure with charts and tables occupying most of the slide.
Slide 4: Operational delivery
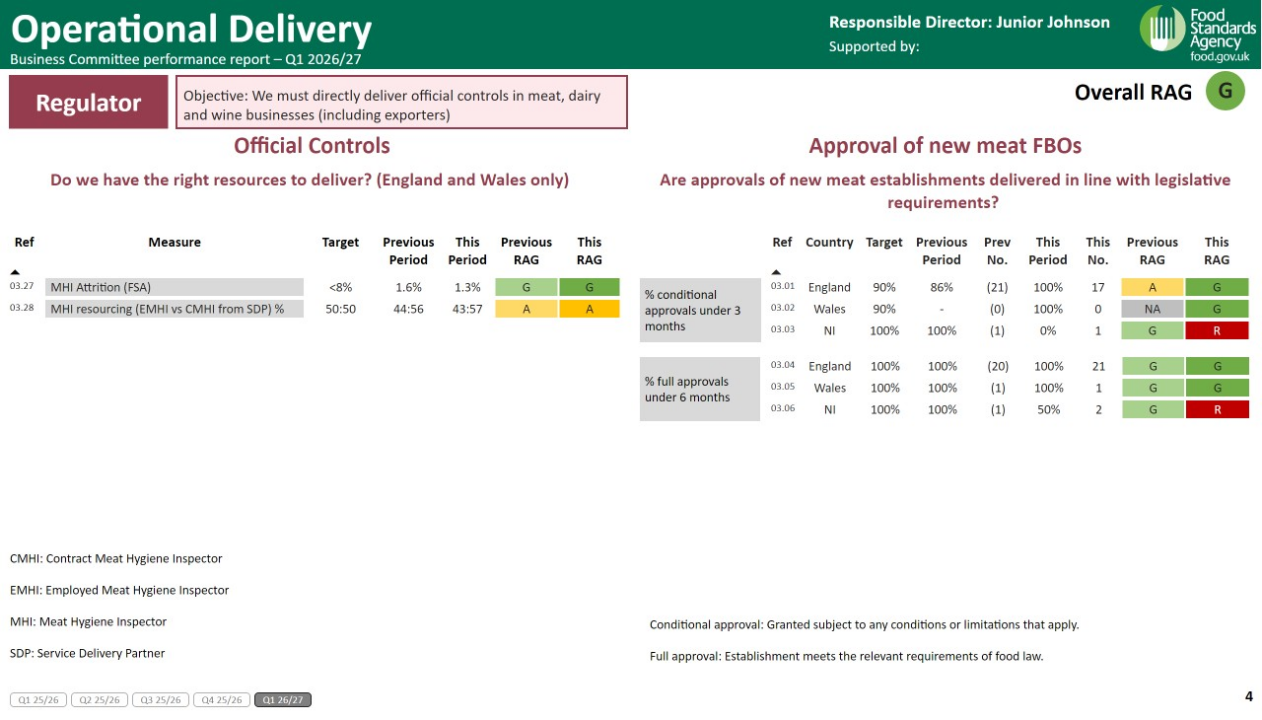
A dashboard slide with a dark green header and several pivot tables showing operational performance measures. The slide includes:
- an overall RAG status indicator
- multiple KPI cards
- explanatory text boxes
- 3 large table-style reports occupying the centre and lower portions of the slide.
The visual emphasis is on tabular performance reporting rather than charts.
Slide 5: Operational delivery
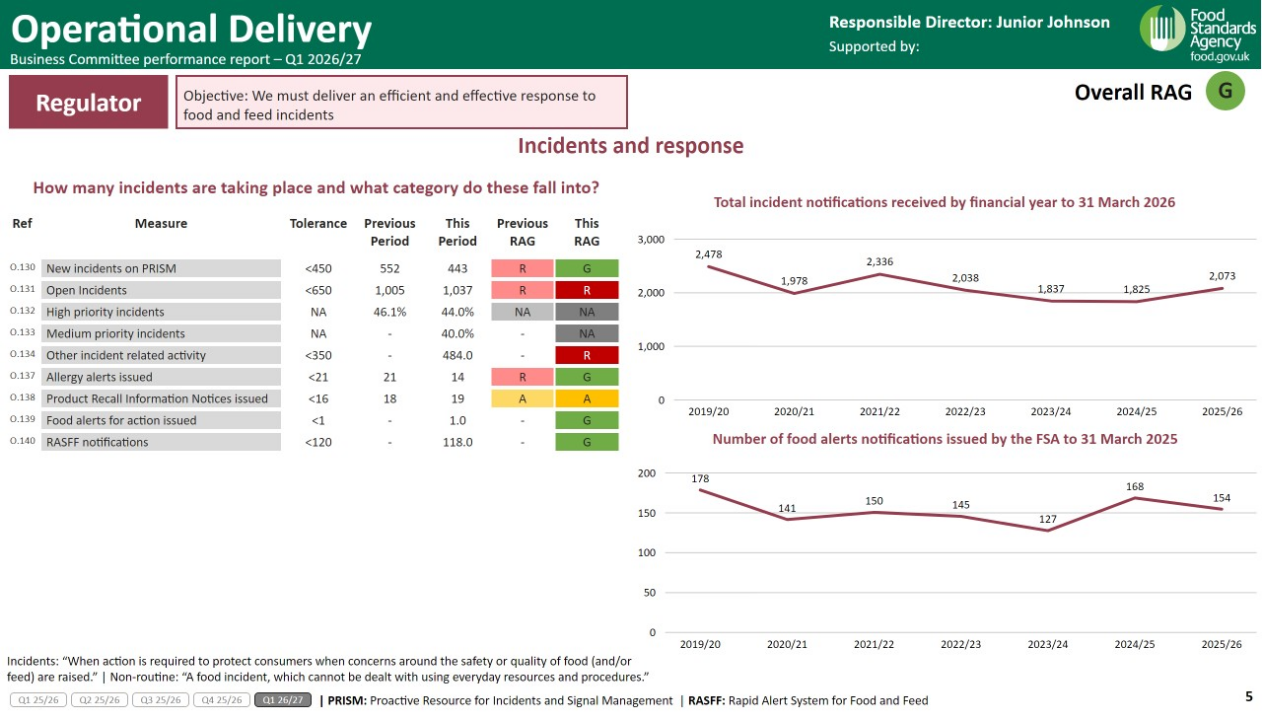
An operational performance dashboard containing:
- 2 line charts showing trends
- several KPI cards
- an overall RAG indicator
- explanatory narrative text boxes
- a performance table
The charts occupy the central area while narrative commentary and KPI summaries are distributed around the outside.
Slide 6: Operational Delivery
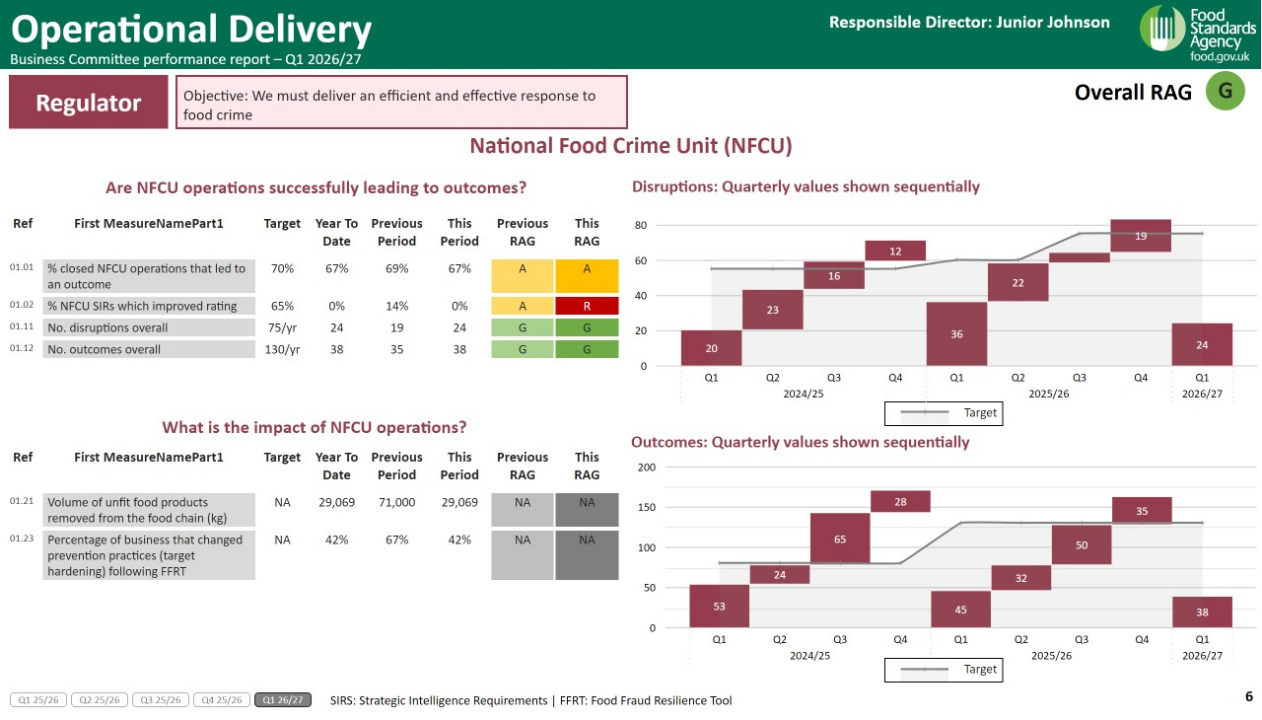
A highly detailed dashboard slide featuring:
- 2 combination column-and-line charts
- several KPI cards
- 2 pivot tables
- narrative text explaining performance measures
- an overall RAG status indicator
The layout is divided into multiple panels, providing operational performance information alongside trend analysis.
Slide 7: Local authority delivery
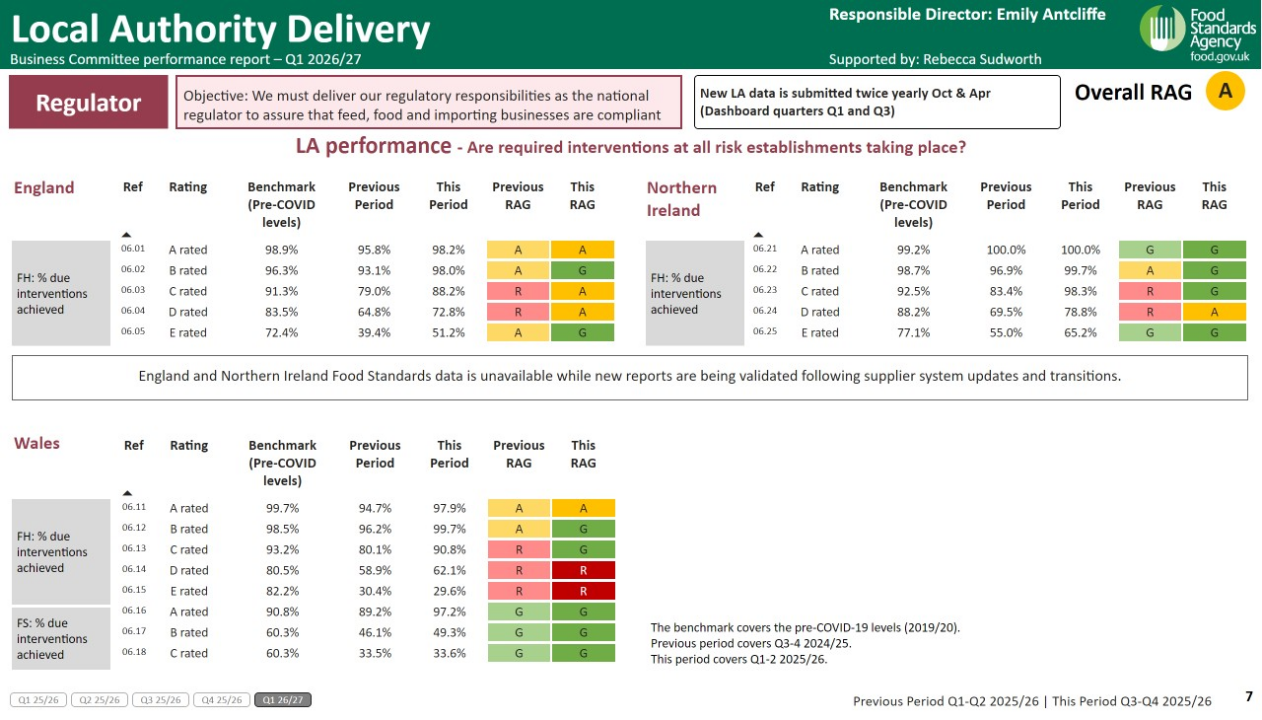
A local authority delivery dashboard containing:
- multiple KPI cards
- two pivot tables showing performance data
- an overall RAG status indicator
- explanatory narrative sections
- several coloured status boxes highlighting key measures
The design follows the same business intelligence dashboard style used throughout the presentation.
Slide 8: Local authority delivery
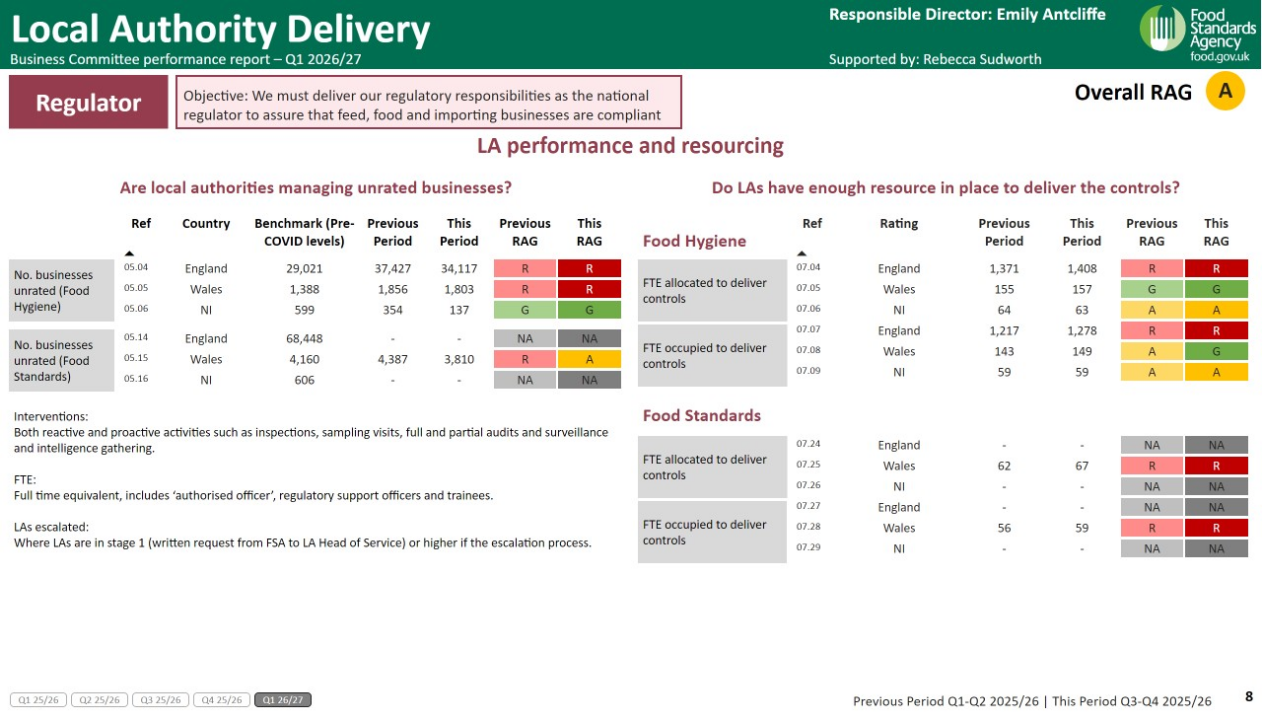
A dashboard focused on local authority performance relating to business registration and food hygiene measures. The slide contains:
- KPI cards
- performance tables
- percentage indicators
- a food hygiene-related matrix table
- narrative commentary boxes
- an overall RAG assessment
The content is presented using a mixture of tables, summary figures and supporting text.
Slide 9: Local authority delivery
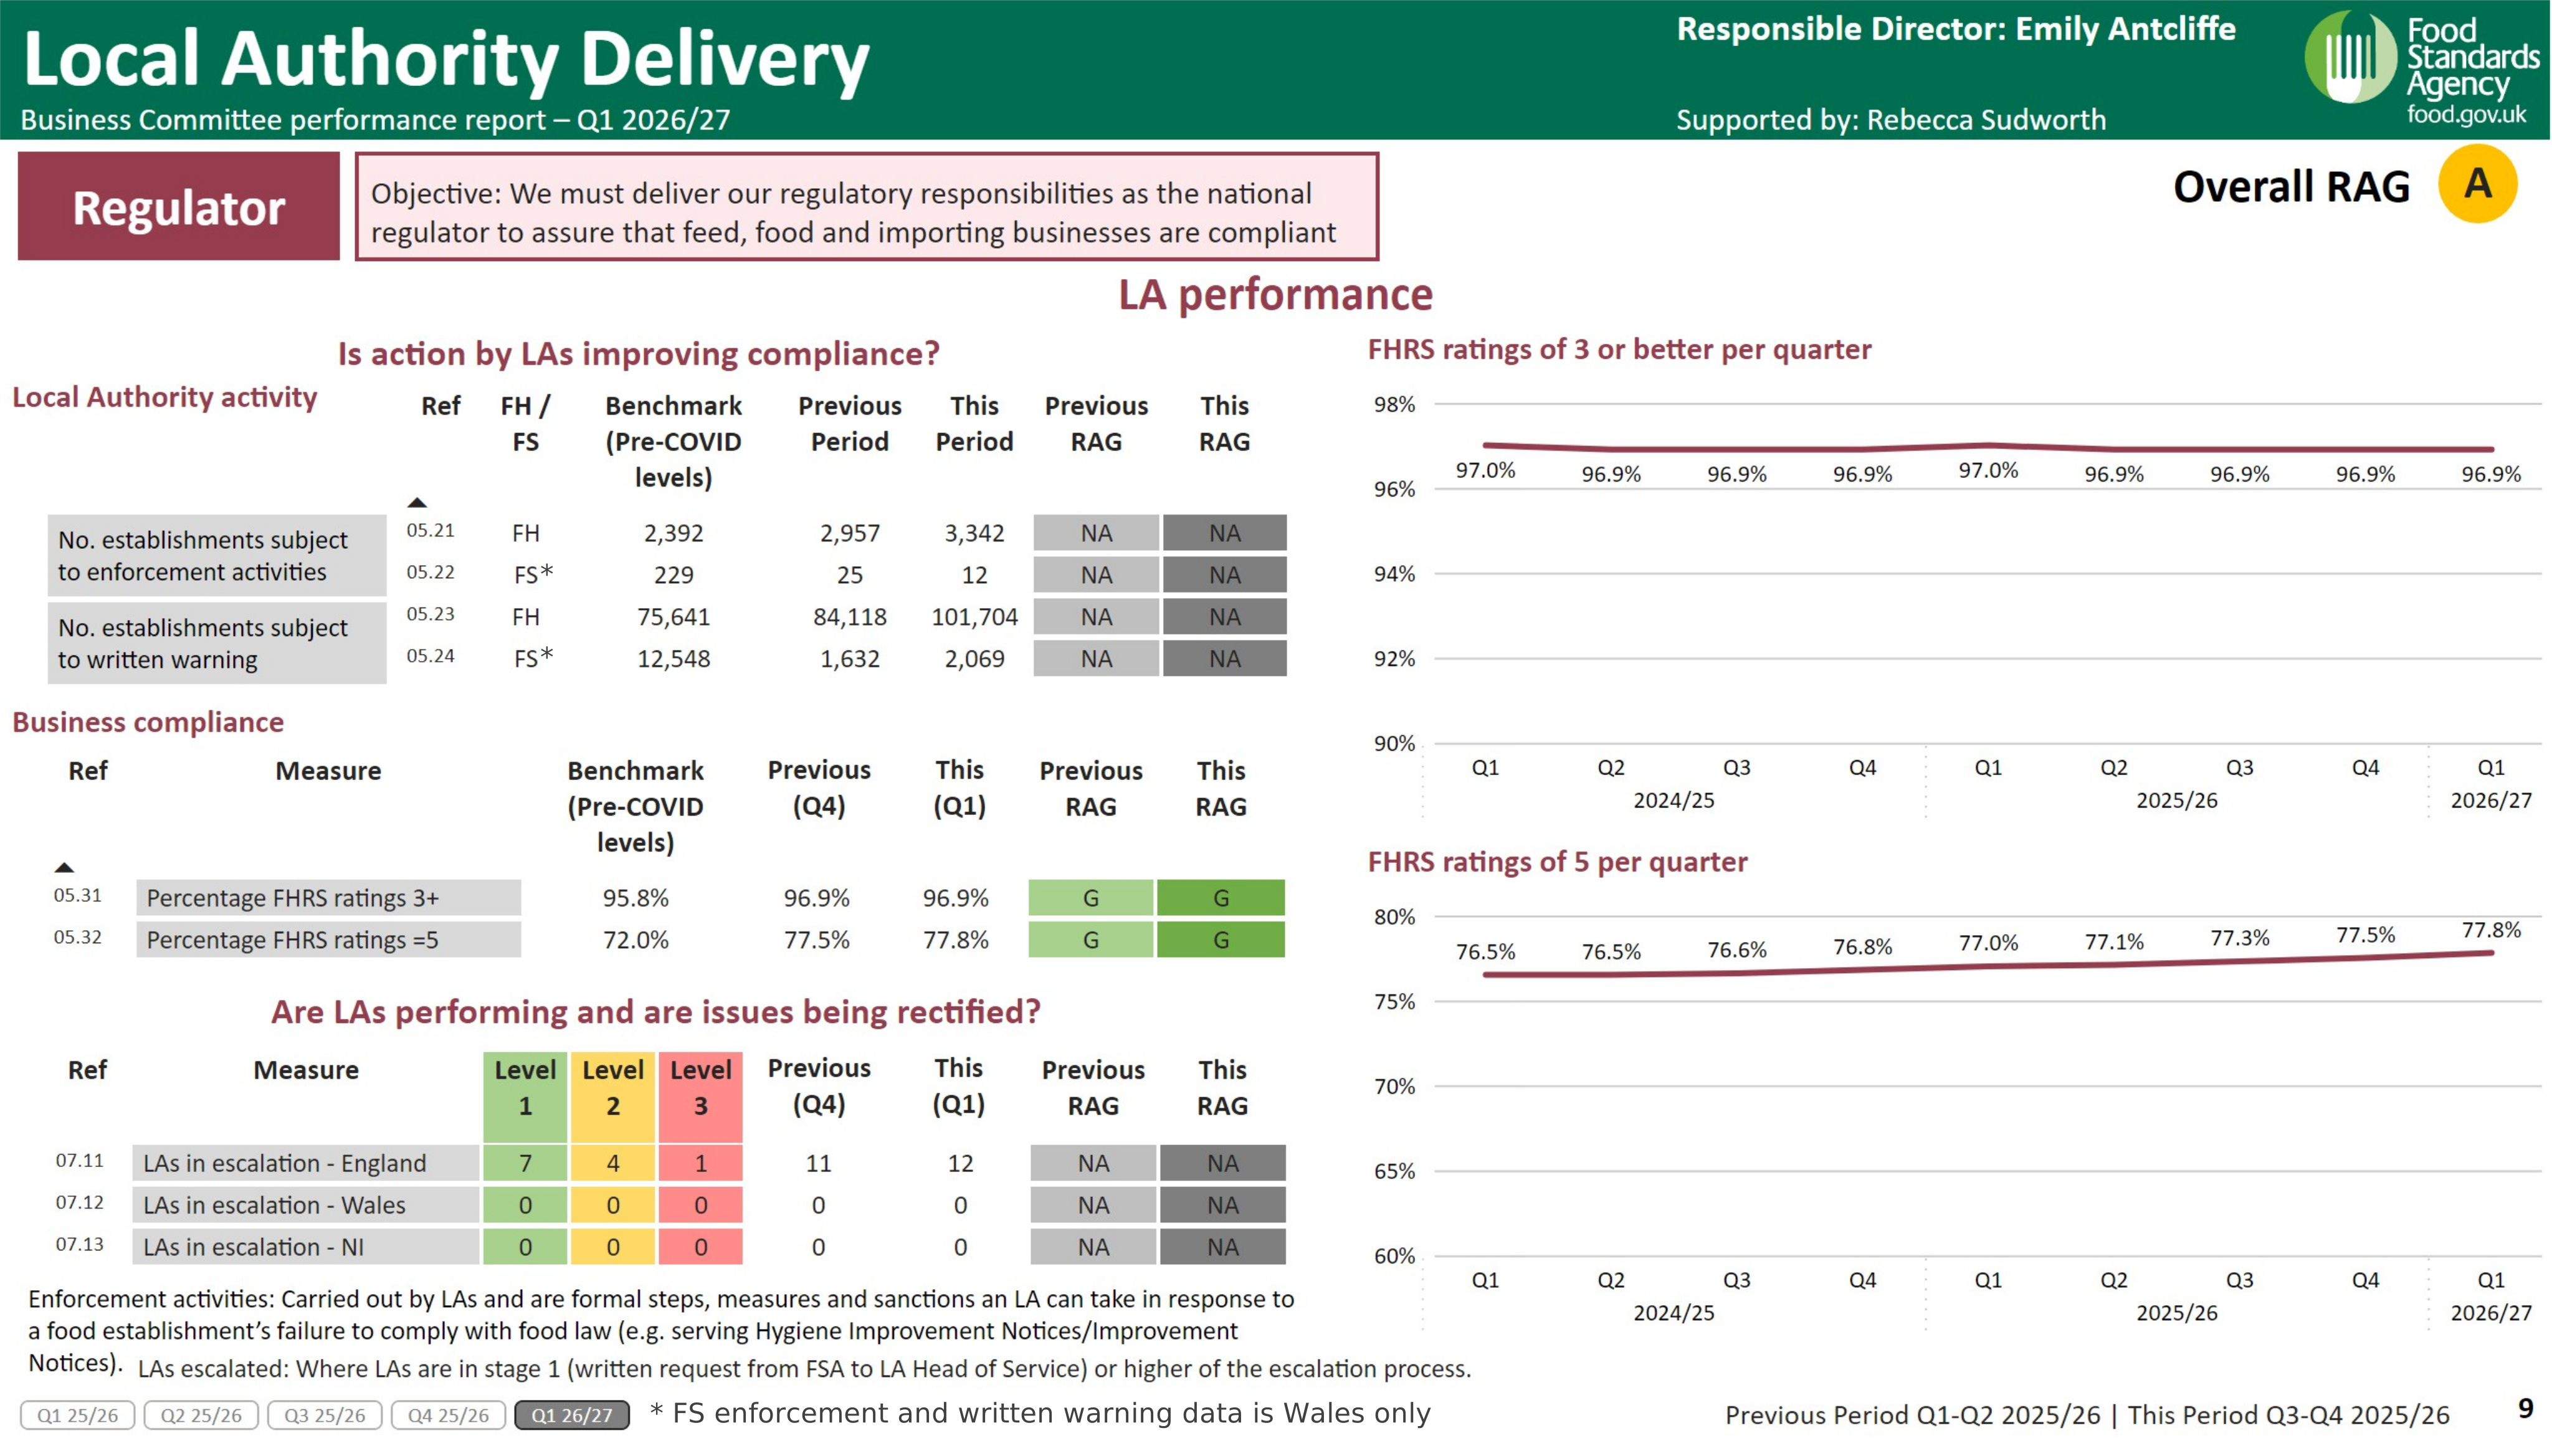
A large and detailed dashboard covering local authority enforcement and compliance activity. The slide includes:
- 2 line charts showing trends over time
- a compliance matrix
- multiple KPI cards
- tables showing local authority performance
- enforcement and written warning indicators
- narrative text explaining results
- an overall RAG rating
The slide combines trend data with enforcement activity metrics and compliance information.
Slide 10: Market Authorisations
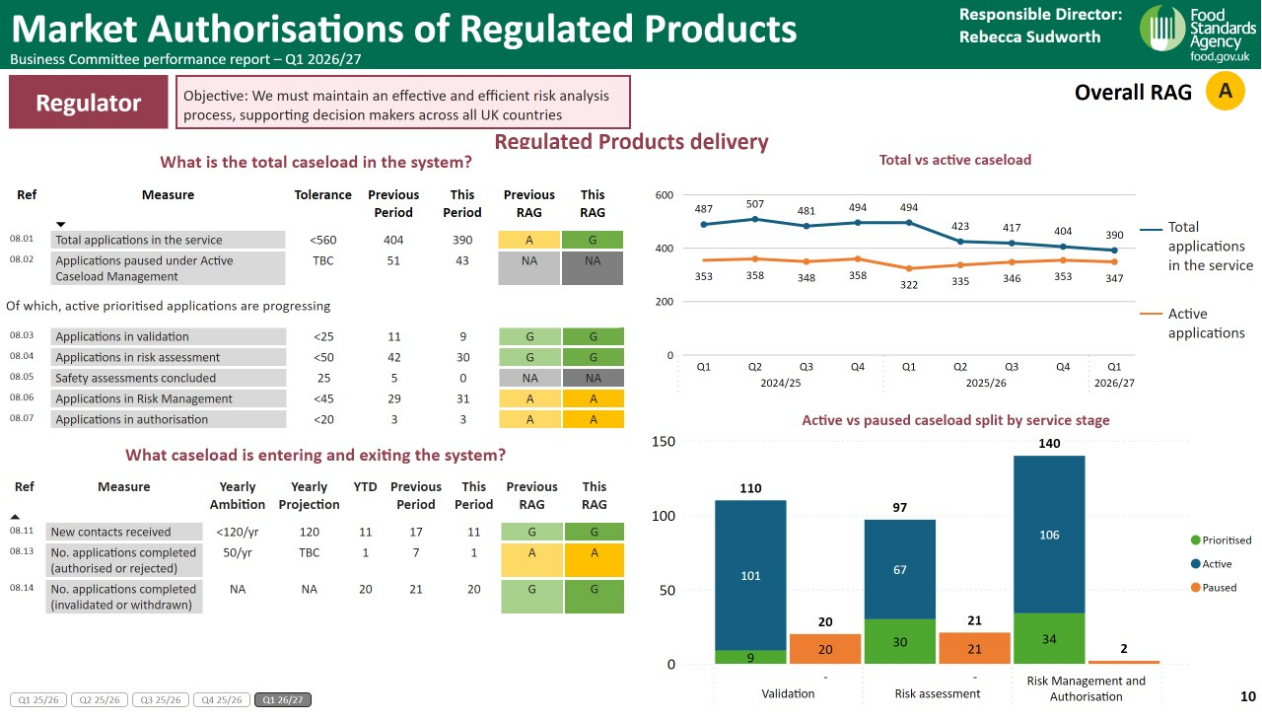
A dashboard-style performance report comprising:
- 2 line charts
- 1 column chart
- several performance tables
- KPI cards displaying headline measures
- narrative commentary
- an overall RAG indicator
The slide is arranged around a central set of charts showing performance trends and supporting analysis.
Slide 11: Science
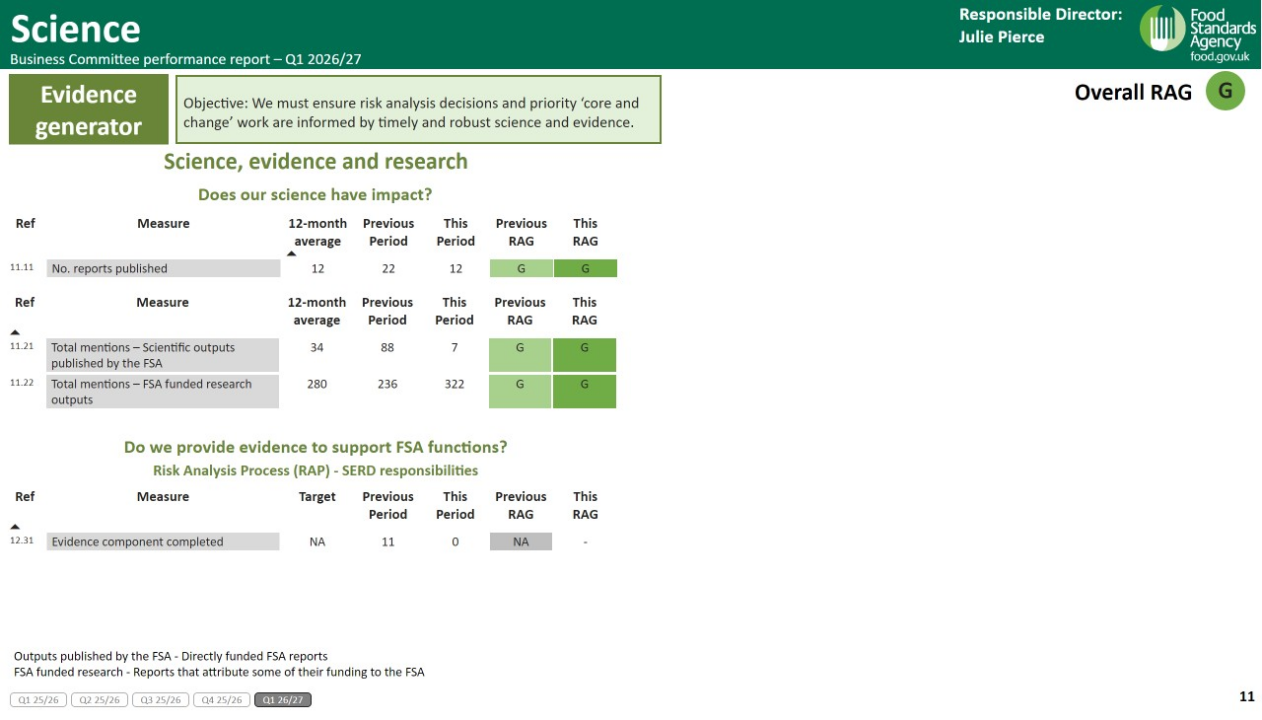
A science-focused performance dashboard containing:
- multiple pivot tables
- KPI cards
- narrative text boxes
- an overall RAG status
The visual emphasis is on tabulated performance information rather than graphical trend analysis.
Slide 12: Trade
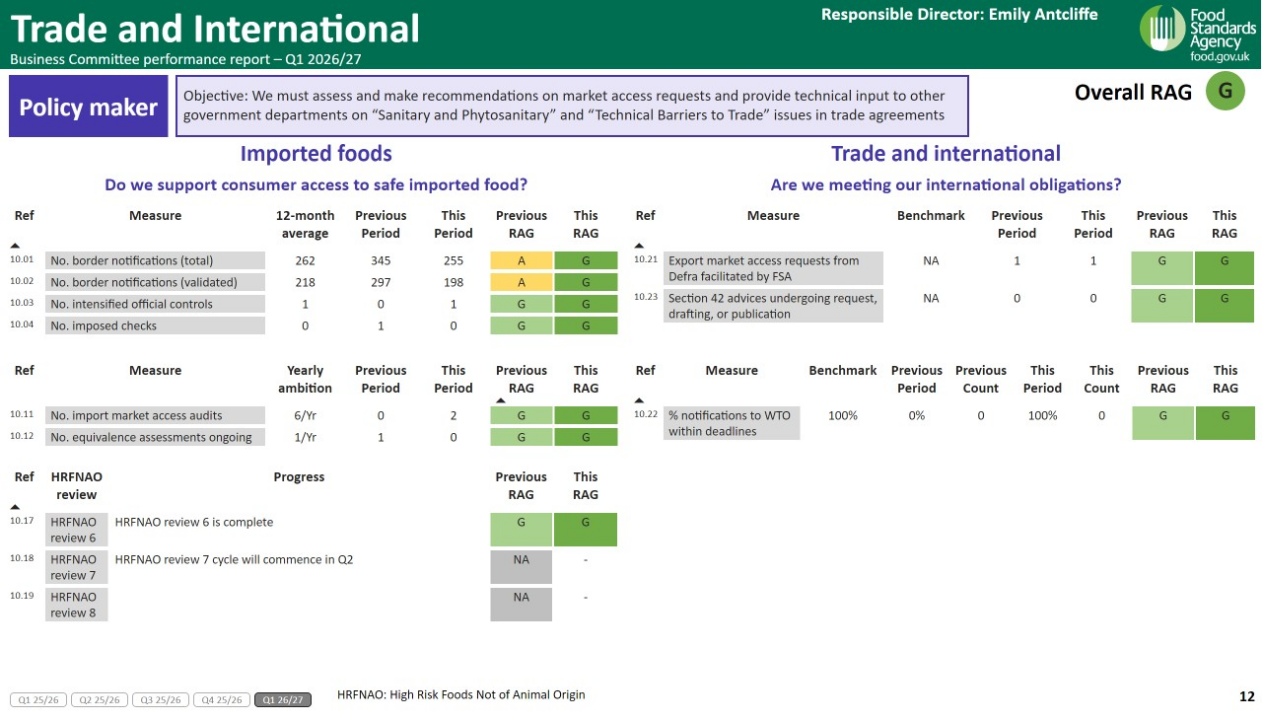
A dashboard reporting on trade-related performance measures. The slide includes:
- multiple KPI cards
- several pivot tables
- narrative text sections
- an overall RAG indicator
The layout presents performance data in a structured table-and-summary-card format with explanatory notes.
Slide 13: reputation and communications
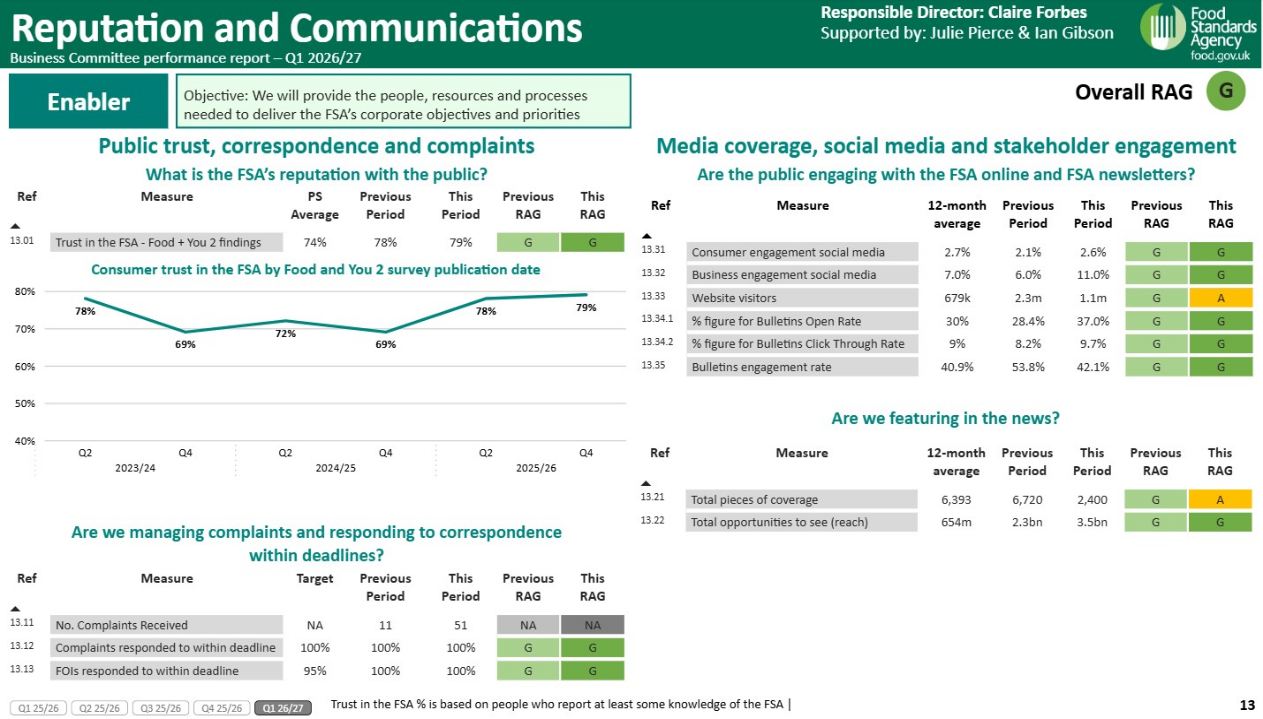
A dashboard-style performance reporting slide.
The slide contains multiple information panels arranged across the page, including several coloured status indicators, text areas and data-reporting sections. Content appears to be organised into distinct reporting categories.
Slide 14: People and resources
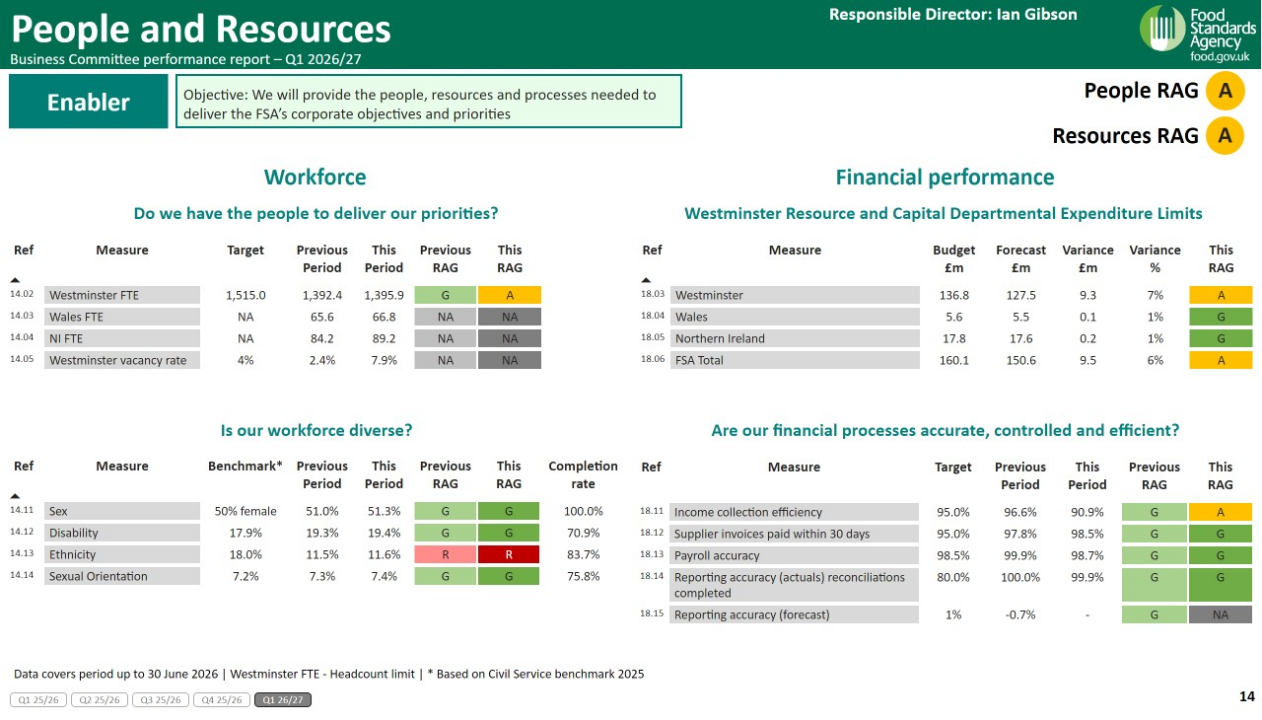
A performance dashboard containing:
- multiple pivot tables
- KPI cards
- Narrative commentary
- 2 overall RAG indicators
- supporting summary measures and performance data
The layout resembles other dashboard slides in the presentation, combining tabular reporting with written interpretation.
Slide 15: Annex
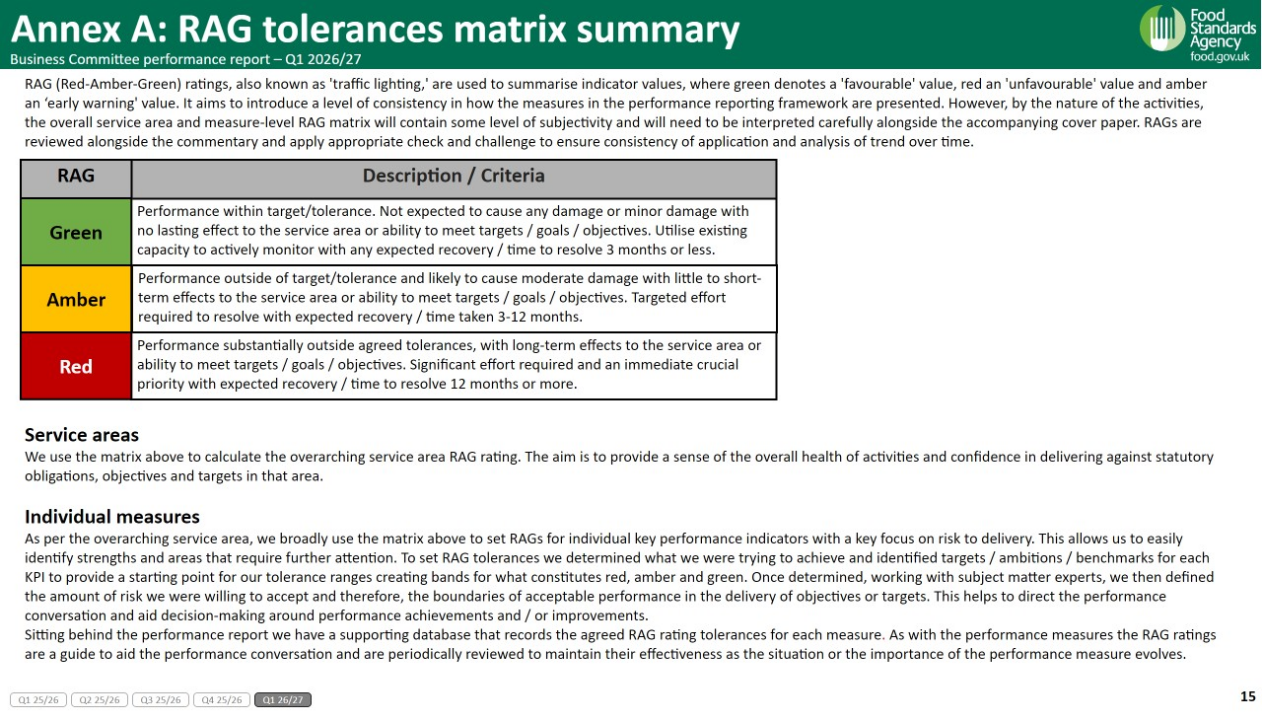
An annex slide containing explanatory text and supporting notes. The slide includes:
- multiple text boxes providing definitions or contextual information.
- several coloured shape elements used for grouping content.
- dashboard navigation elements.
- minimal quantitative data compared with previous slides
The purpose of the slide appears to be providing supplementary information or explanatory notes relating to the dashboard measures.