Discharges and Environmental Monitoring Annual Report 2019
Published 24 November 2020

© Crown copyright 2020
This publication is licensed under the terms of the Open Government Licence v3.0 except where otherwise stated. To view this licence, visit nationalarchives.gov.uk/doc/open-government-licence/version/3 or write to the Information Policy Team, The National Archives, Kew, London TW9 4DU, or email: psi@nationalarchives.gov.uk.
Where we have identified any third party copyright information you will need to obtain permission from the copyright holders concerned.
This publication is available at https://www.gov.uk/government/publications/discharges-and-environmental-monitoring-annual-report-2019/discharges-and-environmental-monitoring-annual-report-2019
1. Executive Summary
This 2019 report has been produced by Sellafield Ltd and covers the Sellafield site in Cumbria. It provides detailed information on radioactive discharges and disposals, monitoring of the environment and radiological impact, and also includes information on non-radioactive discharges and disposals.
It now includes information on beach monitoring, groundwater investigations, corporate carbon footprint and future effluent discharge projections.
The report provides a summary of the comprehensive data that are available for inspection by members of the public on the Public Registers maintained by the Environment Agency.
There were no instances in 2019 of non-compliance with the numerical limits of permits regulating discharges and disposals of radioactive wastes at Sellafield.
Radioactive discharges (aerial and liquid) were well below the permitted limits and were generally lower than those in 2018.
The estimated doses in 2019 are summarised in the table below. Doses due to discharges to sea from Sellafield to adult members of the critical group who consume fish and shellfish from the local area were about 37 microSieverts (µSv).
Taking into account doses due to beach occupancy and aerial pathways, the total dose to this group was about 75 µSv, lower than 2018. The most significant radionuclides contributing to this dose are Pu-alpha and americium-241 (32 µSv) - the environmental concentrations of these radionuclides are mostly due to historic discharges.
The estimated dose in 2019 due to discharges to the atmosphere to members of the critical group who consume terrestrial foodstuffs was about 5 µSv. Inclusion of dose contributions to this group from inhalation, immersion, external radiation from beach occupancy and marine food consumption results in a dose of about 8 µSv.
Doses due to direct radiation from plants on site were estimated as being up to 3.2 µSv to the most exposed members of the public who live nearby.
This is lower than in 2018. The total dose to the terrestrial critical group (adults) was about 11 µSv. This dose is similar to 2018 (12 µSv). The most significant radionuclide contributing to dose received from the consumption of terrestrial foodstuffs is caesium-137 in sheep (0.88 µSv).
The environmental concentrations of these radionuclides are also mostly due to historic rather than 2019 discharges.
The estimated doses for the marine (75 µSv) and terrestrial critical groups (11 µSv) are much lower than the dose constraint of 1000 µSv for exposure of members of the UK public to man-made controlled sources of radiation.
Groundwater investigations in 2019 have shown that the activity concentrations of tritium, technetium-99, strontium-90, total alpha and total beta all remain similar to 2018 results.
The monitoring of the wells located around the site perimeter which detect any migration of radioactivity from the site have shown consistent results over the last five years, 2015 – 2019, indicating no significant levels of radioactivity have reached the site perimeter over this time period.
In considering future effluent discharge projections, the operational liquid and gaseous discharges are projected to reduce substantially as reprocessing activities are completed. In particular, tritium discharges are dominated by operational activities and will virtually cease when reprocessing is completed.
The distributions of caesium-137 and americium-241 activities for particles and larger objects recovered in 2019 were within the ranges previously observed.
This provides reassurance that they are part of the same general population and are within the range of activities that were considered in the health risk assessment.
Sellafield Ltd’s carbon footprint was reduced by 12% from 2018/19. The emissions within the direct control of the company are dominated by the use of electricity and steam at the Sellafield site (>90%).
| Critical group doses from operations at Sellafield (µSv) | ||
|---|---|---|
| Pathway | 2018 | 2019 |
| Marine critical groups (adults) | ||
| seafood consumption | 43 | 37 |
| aerial pathways | 1.7 | 1.6 |
| external radiation from beach occupancy (marine) | 89 | 75 |
| Terrestrial critical groups (adults) | ||
| inhalation | 0.68 | 0.62 |
| immersion | 0.24 | 0.05 |
| external radiation from beach occupancy (terrestrial) | 2.0 | 1.6 |
| terrestrial foodstuff consumption | 4.4 | 4.6 |
| marine foodstuff consumption | 0.90 | 0.48 |
| direct radiation | 3.9 | 3.2 |
| Total dose to terrestrial critical group (adults) | 12 | 11 |
2. Introduction
2.1 Sellafield Ltd
Paragraph 1.
Sellafield Ltd is the company responsible for safely delivering decommissioning, reprocessing and nuclear waste management at Sellafield on behalf of the Nuclear Decommissioning Authority (NDA).
The company also has an engineering design capability based at Risley in Warrington and a number of satellite offices.
Since April 2016 Sellafield Ltd has been a wholly-owned subsidiary of the NDA. The strategy and focus of Sellafield Ltd is to deliver accelerated nuclear clean-up programmes safely and cost-effectively.
Paragraph 2.
Sellafield Ltd (established in April 2007) previously operated as British Nuclear Group Sellafield Ltd (BNGSL).
BNGSL was established following the restructuring of its parent company British Nuclear Fuels Limited (BNFL) in response to the formation of the NDA.
The NDA is the public body tasked by Her Majesty’s Government with taking strategic responsibility for the decommissioning of civil public sector nuclear sites in the UK.
Sellafield Ltd hold the Nuclear Site Licence and Environmental Permits for the Sellafield site and is regulated by UK independent regulators including the Office for Nuclear Regulation (ONR) and the Environment Agency (EA).
Paragraph 3.
Decommissioning of legacy buildings contributes to the safe and efficient acceleration of high hazard risk reduction on site.
Decommissioning has been underway for many years on the Sellafield site; such buildings include the Windscale Pile Chimneys, the Separation Purification Plant and fuel fabrication facilities.
Material resulting from decommissioning practices is appropriately categorised, processed and stored or disposed of. The majority of material from decommissioning efforts is in a solid phase which is either stored on site or transferred to the LLWR.
Any liquid or gaseous material resulting from decommissioning practices is accommodated within current liquid and aerial discharge permits.
2.2 Regulation of radioactive discharges and disposals
Paragraph 4.
The control of radioactive wastes is subject to the provisions of the environmental permit for radioactive substances.
Under this permit and its supporting requirements, operators are permitted to discharge and dispose of radioactive waste only in accordance with the terms issued by the EA in England and Wales, including a range of discharge limits and requirements.
Paragraph 5.
It is the policy of the EA to review permits regularly. In establishing discharge limits for permits, they take into account the radiation protection principles presented in the latest relevant Government White Paper¹ (table 1).
These principles are based on government policy and the advice of Public Health England (PHE) (Appendix A: in the context of critical group dose limits and constraints - paragraphs 5, 6, 7 and 8; collective doses - paragraphs 18, 19, 20 and 21).
Those parts of the Euratom Basic Safety Standards Directive (BSS) 1996 relating to dose limits (Appendix A: paragraph 8) were incorporated into UK law in the Radioactive Substances BSS Directive 2000, issued by the appropriate ministers to the EA. Other provisions of the BSS Directive were implemented through the Ionising Radiation Regulations 1999.
Paragraph 6.
Sellafield discharges are regulated through the Environmental Permit for Radioactive Substances². The Environmental Permitting Regulations were introduced on 6 April 2010 and superseded the Radioactive Substances Act 1993 in England and Wales.
The 2010 regulations were updated in December 2016. The permit covers all the discharge and disposal routes under a single permit.
Additional requirements are specified by the EA in a supplementary document, the ‘Compilation of Environment Agency Requirements, Approvals and Specifications’ (CEAR).
Paragraph 7.
As well as being subject to discharge limits, all discharges of radioactivity are subject to the requirement to use Best Available Technique (BAT) to limit the amount of radioactivity discharged.
To enable the EA to monitor the application of BAT, Quarterly Notification Levels (QNLs) apply at Sellafield to discharges of certain radionuclides. Exceeding a QNL requires the operator to submit a written justification of the BAT used to minimise discharges.
Paragraph 8.
The Food Standards Agency (FSA), which reports to health ministers, was formed on 1 April 2000. Its responsibilities include the food safety implications of discharges of radioactive waste, in support of which it undertakes a substantial radiological surveillance programme both for marine and terrestrial samples.
It has taken on the role, formerly exercised by the Ministry of Agriculture, Fisheries and Foods (MAFF), as statutory consultee to the EA in matters relating to radioactive discharge authorisations.
The ONR has a similar role as statutory consultee because it regulates the accumulation of radioactive waste on licensed sites and the exposure of the general public to direct radiation from those sites.
Paragraph 9.
The nuclear regulators employed by the EA regularly pay inspection visits to nuclear sites to critically review operations against radiological protection standards and the application of BAT. Thus, the authorisation process is one of continual review.
This process not only reviews operations, effluent control and treatment arrangements, on-site sampling and analytical methods, but also the results of environmental and groundwater monitoring, habits surveys and advances in the methodology for assessing radiological impacts.
The latest BAT assessment for environmental radioactivity monitoring was completed by Sellafield Ltd in September 2017 where many of the recommendations were incorporated into the 2018 sampling and monitoring programme.
Paragraph 10.
Therefore, the permit and inspection process embraces important aspects of radiation protection by:
- controlling, monitoring and recording discharges to the environment in accordance with BAT
- monitoring of the environment and groundwater to establish resultant radionuclide concentrations
- carrying out appropriate research, investigations and assessments to determine pathways for the transport of radioactivity through the environment
- assessing radiation doses to the public
- predictive assessment of radiation doses to the public arising from future discharges to the environment
Paragraph 11.
The company is involved in all these activities with respect to discharges from its site.
Under the terms of the environmental permits, there is a statutory obligation to carry out defined monitoring programmes, both for discharges and for environmental radioactivity.
In addition, the ONR requires the assessment of doses to members of the public from direct radiation.
Paragraph 12.
Agencies regulating sites which discharge radioactive material also take into account other international and national commitments and policies, such as the OSPAR Convention’s North-East Atlantic Environment Strategy and the UK Radioactive Discharges Strategy³.
These are also considered by Sellafield Ltd when making decisions relating to development of Sellafield’s forward looking plan and effluent management at site.
2.3 Regulation of non-radiological discharges and disposals
Paragraph 13.
The regulation of non-radioactive discharges and disposals is the responsibility of the EA and Local Authorities who regulate discharges under the Environmental Permitting (England and Wales) Regulations 2016².
In 2007 the EPR regulations combined the Pollution Prevention and Control (PPC) and Waste Management Licensing (WML) regulations.
Their scope has since been widened to include the discharges to controlled waters of sewage and trade effluent.
Paragraph 14.
Sellafield Ltd’s operations fall under these regulations in terms of operating Listed Activities, including Large Combustion Plant; Waste Operations (including exemptions and recovery operations) and Water Discharge Activities.
Sellafield Ltd also holds a Greenhouse Gas Permit, under the Greenhouse Gas Emissions Trading Scheme Regulations 2010⁴.
Paragraph 15.
Disposals of non-radioactive wastes are regulated through EPA 1990 and the Hazardous Waste Regulations 2005⁵.
Where wastes are transferred to another organisation for treatment or disposal, there is a legal duty of care on producers, carriers and disposers to ensure that waste is only disposed of under the terms of an environmental permit.
Where non-hazardous and inert waste is transferred, it is accompanied by a transfer note which includes a full written description of the waste.
Where hazardous waste is transferred in accordance with the Hazardous Waste Regulations 2005, it is accompanied by a consignment note. Landfill disposals are subject to Landfill Regulations which implement the requirements of the Landfill Directive (ref 6) and place additional requirements on both landfill site operators and waste consignors.
2.4 Monitoring of environmental radioactivity and dose assessment
Paragraph 16.
The structure of the Statutory Environmental Monitoring Programme (SEMP) reflects the emphasis placed on assessing radiation doses to the public in the areas local to Sellafield Ltd’s site.
The essential considerations are to:
- take account of the most important pathways by which radiation exposure of the public may occur
- conduct appropriate sampling and analysis to determine radionuclide concentrations or radiation levels relevant to those pathways
- combine the monitoring results with data on foodstuff consumption and other habits, and with data on the
biokinetic behaviour of radionuclides, to yield estimates of radiation dose to the public
Paragraph 17.
It should be noted that these dose estimates, being based on environmental concentrations, will include contributions from radionuclides discharged in earlier years.
They will therefore differ from those dose estimates in technical submissions to Radioactive Substances Regulations environmental permit reviews which relate to projected doses at expected future levels of discharge and at proposed discharge limits.
Paragraph 18.
A description of the concept of critical group doses and collective doses, referred to here and elsewhere within this report, is given in Appendix A along with dose per unit intake tables and manSv per Bq discharged tables.
Representative person dose calculations are given in Appendix C.
Paragraph 19.
Data identifying critical groups and their habits by pathway have been provided by the FSA, EA and the Centre for Environment, Fisheries and Aquaculture Science (Cefas), or their predecessors, based on published survey work⁷.
Site-specific habits data used in dose assessments may relate to single years or to 5-year averages as appropriate.
Generalised food consumption rates for use in radiological dose assessments (particularly for terrestrial pathways) are reviewed by PHE with current guidelines issued in 2003⁸.
Where appropriate, such generalised advice may be supplemented by other PHE advice⁹, or by information from local habits surveys.
Paragraph 20.
In assessing doses, the company takes account of research studies carried out both nationally and internationally, and also sponsors environmental research focusing specifically on the behaviour of radionuclides released from the Sellafield site.
In addition, throughout this report the guidance of PHE10, the National Dose Assessment Working Group 11 (NDAWG) and the most recent dose coefficients in the International Commission for Radiological Protection (ICRP) Publication 11912 are adopted where available and appropriate.
For the specific calculation of the dose from krypton-85, where PHE does not provide advice, a cloud immersion dose is calculated from the recommendations of the ICRP13.
In general, default values recommended by the ICRP for each radionuclide are assumed for the purpose of dose calculations unless specific studies indicate that an alternative is appropriate as discussed in Appendix A.
Paragraph 21.
In accordance with regulatory guidance 14, radiation dose rates in air (‘air kerma’) are generally measured in primary units of µGy h-1.
In order to express this as an effective dose rate, µSv h-1, a conversion factor of 1.07 µSv per µGy is appropriate in most cases (ref 14). This reflects the differing energy deposition of ionising radiation in differing media: in this case air and tissue.
By expressing the radiation dose rate in µSv h-1 and making allowance for background dose rates10,15 a direct estimate of the dose to man can be obtained.
Paragraph 22.
Independent environmental monitoring programmes and dose assessments in the areas both local to Sellafield Ltd’s site and further afield are carried out and reported by government agencies and other groups (ref 16-19).
Paragraph 23.
Collective doses have been calculated, using a 500 year integration period (Appendix A, paragraph 20), based on the most recent European Union (EU) methodology (ref 20,21).
2.5 Analytical measurements, limits of detection and rounding of data
Paragraph 24.
All measurements of radioactive discharges, concentrations of radionuclides in the environment and radiation dose rates are subject, as with any other type of measurement, to uncertainties arising from the measurement process itself.
These may become important when the quantities involved are very small compared with the measurement uncertainty, and the result is then quoted as a ‘limit of detection’ (i.e. with a ‘<’ sign).
This value is chosen to give a high degree of confidence that the actual result is less than that value.
Paragraph 25.
Results from the company’s environmental monitoring programmes are reported here as the arithmetic means of measurements taken throughout the year.
The concentrations of many radionuclides in the environment are now sufficiently low that most measurements are reported as limit of detection values, as explained above.
They continue to be included in the monitoring and analysis programmes for reassurance that new pathways involving, for example, remobilised historical materials, have not arisen.
Dose calculations either conservatively use such ‘limit of detection’ values, or use more realistic estimates of concentrations derived using environmental models.
For example, modelling techniques have been applied to derive the doses received by members of the critical group from the intake of ruthenium-106 in foodstuffs and iodine-131 in milk (Appendix B, table B9 and B11) rather than use limit of detection values.
Paragraph 26.
For clarity of presentation (and after calculations have been completed), discharges, concentration and dose rate data are normally rounded to 2 significant figures, or just one where the numbers are very small.
Dashes are shown in tables to indicate where data have not been collected.
Paragraph 27.
It should also be noted that measurements of ‘total alpha’ and ‘total beta’ activity do not necessarily equate to the sum of individually measured radionuclides.
This is because of differing counting efficiencies and the presence of naturally occurring radionuclides.
2.6 Protection of the environment
Paragraph 28.
In its 1990 Recommendations (ref 22), the ICRP considered that ‘the standard of environmental control needed to protect man to the degree presently thought desirable will ensure that other species are not put at risk.’
This view is defensible in most situations, particularly where critical groups are exposed in the areas of highest environmental concentrations, close to the point of discharge, through a variety of pathways.
However, ICRP acknowledges that the protection of the environment needs to be considered in the wider sense, and has performed work addressing this matter since the late 1990s.
The OSPAR North-East Atlantic Environment Strategy incorporates the guiding theme of an Ecosystem Approach and includes a requirement that effective action is to be taken when there are reasonable grounds for concern that radioactive substances introduced into the marine environment may harm living resources and marine ecosystems.
Sellafield Ltd has contributed to a number of initiatives that developed criteria for the protection of the environment.
In addition, Sellafield Ltd has carried out assessments of exposure against the guidelines given in national and international publications (ref 23-26) and on the basis of work to date there is no reason to believe that radioactive discharges from Sellafield Ltd are harming the environment.
2.7 Natural radioactivity
Paragraph 29.
To put into context the data presented in this report, it is important to recognise that natural radioactivity is the dominant source of radiation exposure to the population as a whole, including individuals living close to nuclear establishments.
In addition, the widespread radioactive fallout from the testing of nuclear weapons and from the Chernobyl accident make small contributions to overall doses.
The subject has been reviewed comprehensively by PHE10,15 and others (ref 27).
Paragraph 30.
Individual doses from natural radioactivity in the UK range broadly from 1000 µSv to 100,000 µSv per year (ref 15).
The upper end of the range stems from homes with particularly high indoor levels of radon and its decay products.
Dose limits set for the industry do not apply to natural background radiation, such as that from radon.
Nevertheless, it may be noted for comparative purposes only that these upper figures substantially exceed the dose limits to the public (and indeed the workforce) applicable to the operation of nuclear establishments (see paragraph 5 and table 1 and Appendix A, paragraph 8).
PHE recommends that measures be taken to reduce levels of radon in homes if the average annual indoor activity concentrations exceed 200 Bq m-3 and suggests that a radon-222 concentration of 20 Bq m-3 corresponds to an annual dose of 1200 µSv from the short-lived decay products of the gas (ref 15).
Paragraph 31.
The measurements in this report relate to environmental radioactivity that is mainly attributable to discharges from the Sellafield site.
However, natural radioactivity makes an appreciable contribution to the reported values in some instances. Where it is practicable to do so, the appropriate correction is made and noted. Thus, gamma dose rates quoted in this report are total dose rates including natural terrestrial background and cosmic ray contributions.
For dose assessment purposes, the natural contributions are deducted.
Paragraph 32.
A comparison of the most recently reviewed (2010) annually averaged doses to individuals in the UK population from all sources of radioactivity is presented in table 2 and figure 128.
Typically, natural background accounts for some 84% of the total dose and medical uses of radiation for a further 16%.
On this basis, the annual average dose is around 2700 µSv, of which 2300 µSv is derived from natural sources (mainly cosmic rays, rocks and soils, radon gas and foodstuffs - see table 2), 440 µSv from medical exposures, 0.4 µSv from occupational exposure, 5 µSv from nuclear weapons fallout and 0.19 µSv from discharges and disposals, including those from the nuclear industry 28.
In areas of higher natural background radiation (e.g. Cornwall), the average dose may exceed 7000 µSv per year (ref 15).
2.8 Environmental reporting by Sellafield Ltd
Paragraph 33.
This 2019 report has been produced by Sellafield Ltd and covers the Sellafield Ltd site in Cumbria. It provides detailed information on radioactive discharges and disposals, monitoring of the environment and radiological impact, groundwater investigations, beach monitoring and also includes information on non-radioactive discharges and disposals.
It may be noted that the report provides a summary of the comprehensive data that are available for inspection by members of the public on the Public Registers maintained by the EA.
This report is also available on the Sellafield Ltd website.
Paragraph 34.
Wherever practicable, this report continues to present annual discharge and disposal data over 5 years for all radionuclides specified in the environmental permit for radioactive substances; the results of environmental monitoring for the report year; information on trends; and radiological impact in terms of critical group and collective doses.
Any non-compliance with numerical limits is reported.
Paragraph 35.
For non-radioactive discharges, it would be impracticable to report the discharges of all chemical species and performance against every condition in all permits and consents, even more so for a 5-year period (many consent conditions relate to concentrations in individual samples).
Accordingly, discharges and disposals are normally reported for just the year of the report and other quantitative conditions, such as temperature, pH and volume, are only reported where non-compliances have occurred.
Paragraph 36.
All current permits and consents, as well as waste disposal and waste management licences, are available for inspection on the Public Registers referred to in paragraph 33.
2.9 Acknowledgements
This report was prepared, designed and produced by Sellafield Ltd’s Environmental Monitoring and Assessments Group, Land Quality and End State Group, Effluent management Strategy Group and Graphics Department.
The contributions of staff at Sellafield Ltd who collected the environmental and groundwater samples and measured environmental dose rates are acknowledged.
Analytical Services (Sellafield Ltd) and Cavendish Nuclear Laboratory at Westlakes Science Park, Cumbria, analysed the samples presented in this report.
Members of the public who co-operated with the staff collecting samples and making measurements are especially thanked.
2.10 References
- Cmnd 2919 (1995). Review of radioactive waste management policy: Final conclusions. HMSO, London.
- HMSO (2016). The Environmental Permitting (England and Wales) Regulations 2016. Her Majesty’s Stationery Office, London.
- Department for Business, Energy and Industrial Strategy (2018). UK strategy for radioactive discharges. 2018 review of the 2009 strategy. Department for Business, Energy and Industrial Strategy.
- HMSO (2010). The Aviation Greenhouse Gas Emissions Trading Scheme Regulations 2010, Her Majesty’s Stationery Office, London.
- HMSO (2005). Hazardous Waste (England and Wales) Regulations. 2005. Her Majesty’s Stationery Office, London.
- Official Journal of the European Union (2018). Directive (EU) 2018/850 of the European Parliament and of the Council of 30 May 2018 amending Directive 1999/31/ EC on the Landfill of waste. OJEU, Luxembourg.
- Moore K J, Greenhill B J and Clyne F J (2018). Radiological habits survey: Sellafield review, 2018. Environment Report RL08/18. Cefas, Lowestoft (under contract to the EA and the FSA).
- Smith K R and Jones, A L (2003). Generalised habit data for radiological assessments. NRPB Report W41.
- Cabianca T, Fayers C A, Mayall A, Robinson C A and Simmonds J R (1995). Peer review of BNFL radiological assessment methodologies. NRPB Report M815.
- Hughes J S and Shaw K B (1996). Radiation doses from natural radiation. NRPB Report M748.
- Allott R (2005). Assessment of compliance with the public dose limit. Principles for the assessment of total retrospective public doses. NDAWG/2/2005. National Dose Assessment Working Group.
- International Commission on Radiological Protection (2012). Compendium of dose coefficients based on ICRP Publication 60. ICRP Publication 119. Ann. ICRP 41 (Suppl.).
- International Commission on Radiological Protection (1979, 1980). Limits for intakes of radionuclides by workers. ICRP Publication 30, Parts 1 and 2. Ann. ICRP 2 (3/4) and 4 (3/4).
- Her Majesty’s Inspectorate of Pollution (1995). Routine measurement of gamma ray kerma rate in the environment. Technical Guidance Note (Monitoring) M5. HMSO, London.
- Watson S J, Jones A L, Oatway W B and Hughes J S (2005). Ionising radiation exposure of the UK population: 2005 Review. Health Protection Agency Report HPA-RPD-001, HMSO, London.
- McKay W A and Stephens B A (1990). A survey of fish and shellfish radioactivity levels in Cumbrian near- shore waters, 1989. AEA-EE-0041, Harwell.
- McKay W A and Walker M I (1990). Plutonium and americium behaviour in Cumbrian near-shore waters. J. Environ. Radioactivity 12: 49-77.
- Walker M I and McKay W A (1991). Radionuclide distributions in seawater around the Sellafield pipeline. Est. Coast. Shelf Sci. 32: 385-393.
- Isle of Man Government Laboratory (2011). Radioactivity monitoring on the Isle of Man 2010.
- Smith J, Oatway W, Brown I and Sherwood J (2009). PC- CREAM 08 user guide. RPD-EA-9-2009. Health Protection Agency.
- Smith G and Simmonds J R (2009). The methodology for assessing the radiological consequences of routine releases of radionuclides to the environment used in PC-CREAM 08. HPA-RPD-058. Health Protection Agency.
- International Commission on Radiological Protection (1991). The 1990 recommendations of the ICRP. ICRP Publication 60. Ann. ICRP 21 (1-3).
- Copplestone D, Bielby S, Jones S R, Patton D, Daniel P and Gize I (2001). Impact assessment of ionising radiation on wildlife. R&D Publication 128. Environment Agency.
- Brown J, Alfonso B, Avila R, Beresford N A, Copplestone D, Proehl G and Ulanovsky A (2008). The ERICA tool. Journal of Environmental Radioactivity 99(9): 1371-1383.
- International Atomic Energy Agency (1999). Protection of the environment from the effects of ionizing radiation. A report for discussion. IAEA-TECDOC-1091.
- International Commission on Radiological Protection (2008). Environmental Protection - the concept and use of reference animals and plants. ICRP Publication
- Ann. ICRP 38 (4-6).
- Saunders P (1990). Radiation and You. Banson.
- Oatway, W B, Jones, A L, Holmes, S, Watson, S and Cabianca, T (2016). Ionising radiation exposure of the UK population: 2010 review. Public Health England Report PHE-CRCE-026, Crown Copyright.
Table 1 - Summary of radiation protection principles in the government’s review of radioactive waste management policy (1995).
| Annual dose | Applicability | Comments |
|---|---|---|
| 1000 μSv | Limits the overall exposure to the general public from man-made controlled sources of radiation (excluding medical uses), including the effects of past and current discharges and summing across all relevant exposure pathways. | The previous flexibility to average exposure over more than one year is no longer considered necessary, and this limit is now a cap on annual exposure. |
| 500 μSv | A ‘site constraint’ to limit the aggregate exposure from a number of sources without contiguous boundaries at a singe location. | Applies irrespective of whether different sources on the site are owned or operated by the same or different organisations. |
| 300 μSv | A ‘dose constraint’ used as the principal criterion in determining applications for discharge authorisations from new facilities. It applies to the sum of all relevant exposures resulting from the operation of a single new source only. | Existing facilities may seek a higher dose constraint in certain circumstances. In most cases this should not be necessary and, in any case, the dose limit and the ALARA principle continue to apply. |
| 10 μSv | Threshold for optimisation below which the regulators will not seek further reduction in public exposures, provided they are satisfied that ‘Best Available Technique’ is being applied to safeguard the public. | The introduction of this concept is consistent with the current practice of the Heath and Safety Executive. |
Table 2 - Summary of doses to the UK population from ubiquitous radiation in the environment (ref 27)
| Source | Per caput dose (μSv) average |
|---|---|
| Radon and thoron | 1300 |
| Intake of natural radionuclides (excluding radon) | 270 |
| Terrestrial gamma radiation | 350 |
| Cosmic radiation | 330 |
| Weapons fallout | 5 |
| Other anthropogenic radioactivity in the environment * | 0.8 |
| Total | 2300 |
*Includes exposure to radionuclides routinely discharged or accidentally released into the environment Reproduced (with minor presentational changes) by kind permission of the PHE.
Figure 1- Breakdown of the per caput dose to the UK population in 2010 by source of exposure (ref 27)

Breakdown of the per caput dose to the UK population in 2010 by source of exposure
3. Radioactive and non-radioactive discharges and disposals
3.1 Operations at Sellafield
Paragraph 1
Sellafield is the most complex nuclear site in the UK, home to the Thermal Oxide Reprocessing plant (Thorp) and Magnox Reprocessing plants and a wide range of waste management and effluent treatment facilities.
As reprocessing nears completion, the emphasis is shifting to remediation, decommissioning and clean-up of the historical legacy.
Paragraph 2
During reprocessing operations, some effluents containing a small fraction of the radioactivity originally present in the used fuel are discharged to the sea and atmosphere, or disposed of as solid wastes to the Low Level Waste Repository (LLWR) near Drigg.
Discharges of radioactivity to sea have declined significantly since the 1970s as a result of considerable investments and improvements in effluent treatment plants that have been described in previous reports in this series.
Paragraph 3
Since 1990, a number of plants that encapsulate solid intermediate-level radioactive waste in stainless steel drums have been, and continue to be, brought on line.
Paragraph 4
Sellafield also operates the Waste Vitrification Plant (WVP) which converts both historical and current arisings of liquid high-level waste into a form of glass.
The molten glass is allowed to solidify inside stainless steel containers, which are then placed in a specially designed, self-cooling storage facility.
Paragraph 5
The Solvent Treatment Plant (STP), which was commissioned in 2002, treats arisings of solvent as well as historical solvent wastes currently stored at Sellafield.
Paragraph 6
Magnox reprocessing throughput in 2019 was 332 te slightly lower than in 2018 (339 te). Decommissioning work on older Magnox plants continued throughout the year.
Paragraph 7
Thorp reprocessing ceased in November 2018 therefore throughput in 2019 was close to zero (0.08 te compared to 370 te in 2018).
3.2 Radioactive liquid discharges via the pipeline
Paragraph 8
Radioactive liquid effluents arise from fuel reprocessing and storage operations, on-site decommissioning operations, and Sellafield Ltd and National Nuclear Laboratory (NNL) laboratories.
Liquors from the reprocessing plants that contain the highest levels of activity are routed directly to storage, pending incorporation into solid glass form in the Waste Vitrification Plant; they are not therefore discharged from the site.
Paragraph 9
Where practicable, the medium active waste streams from reprocessing are routed via the Medium Active Evaporator, or the Salt Evaporator, to interim decay storage pending treatment in the Enhanced Actinide Removal Plant (EARP) prior to discharge.
Where this is not possible, the effluents are routed directly to EARP or other plants for treatment prior to discharge.
Paragraph 10
The remaining low-level liquid effluents are discharged to sea, after monitoring, via the Sellafield pipeline. The main sources of such effluents are:
- Storage pond water from the old Magnox decanning plants and the Fuel Handling Plant (FHP). This water is treated in the Site Ion-Exchange Effluent Plant (SIXEP) to remove radioactive contaminants, principally caesium-137 and strontium-90
- Storage pond water from Thorp
- EARP bulk discharges, consisting of treated Magnox effluents and some effluents from Thorp and ‘EARP Concentrate’ discharges, consisting of treated batches of effluent from interim storage and other concentrates
- Remaining process liquors are routed to the Segregated Effluent Treatment Plant (SETP) where effluent is adjusted for pH and held for confirmation of its composition prior to discharge. Three discharge tanks are in operation, permitting flexible effluent management and the extended retention of effluent if required
- Minor waste streams, such as surface drainage water and laundry effluent
Paragraph 11
The liquid discharge Permit includes site limits for liquid effluents with rolling 12 month limits and Quarterly Notification Levels for ‘total alpha’ and ‘total beta’ activity as well as for individual radionuclides.
In addition, the permit has limits on individual plants. For this report, only performance against the site limits is considered. To comply with the permit, samples from each waste stream are analysed either daily (Thorp Receipt and Storage, SIXEP, laundry, surface drainage water) or prior to discharge (SETP, EARP Bulks and Concentrates) for ‘total alpha’ and ‘total beta’.
More detailed analyses for a wide range of radionuclides, including all those listed in the schedule to the Permit, are carried out on monthly or quarterly bulks of daily samples.
Paragraph 12
Data on discharges over the last five years are given in table 1 and provides a basis for comparison with current permitted limits.
All discharges during 2019 were within those limits. The discharges of actinides (and hence of ‘total alpha’) in 2019 were marginally lower than 2018 and have remained below 0.25 TBq since 2005.
Paragraph 13
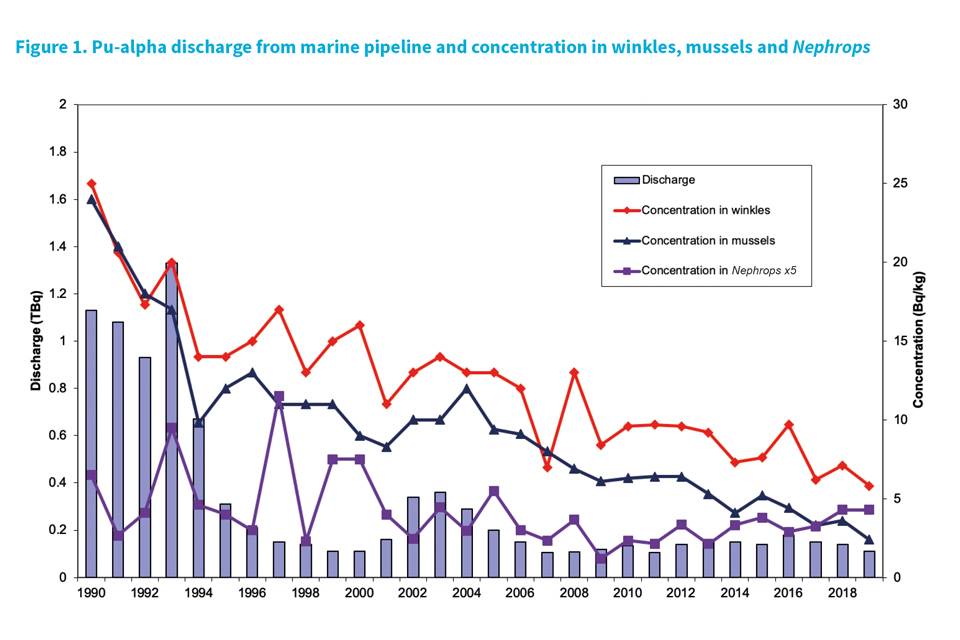
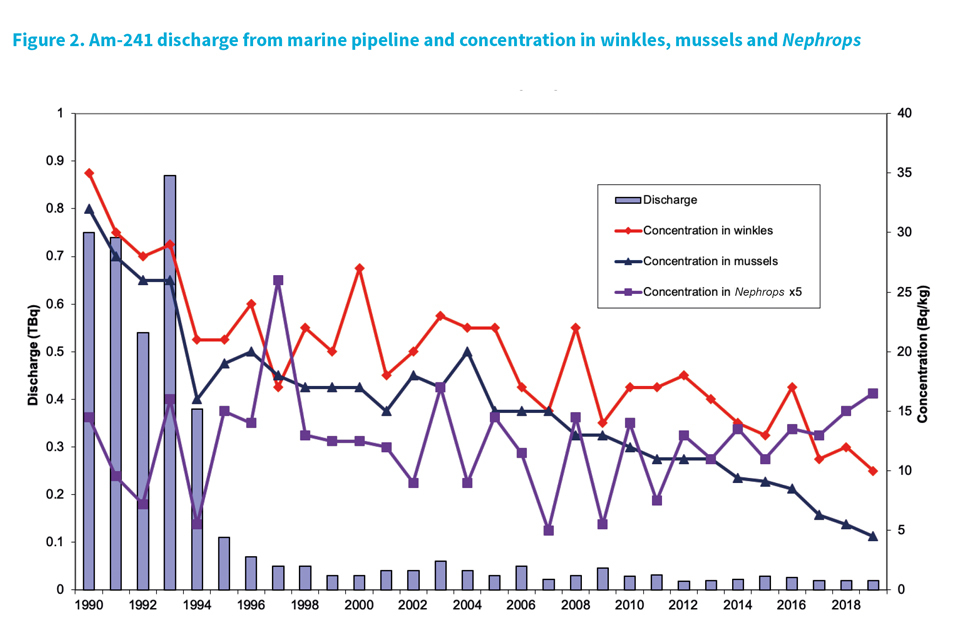
Trends in liquid effluent discharges between 1990 and 2019 from the Sellafield pipeline for radionuclides that contribute to the largest proportions of the marine critical group dose are illustrated in figures 1 and 2.
Maximum annual discharges of Pu-alpha and Am-241 occurred in 1973 (65 TBq) and 1974 (120 TBq) respectively. The 2019 annual discharges are orders of magnitude lower than peak discharge rates, Pu-alpha being 0.17% and Am-241 being 0.017% of peak discharge rates.
Indeed, even in more recent years, the 2019 Pu-alpha annual discharge rate is approximately 10 times lower and americium-241 40 times lower than the discharge rate in 1993 (table 1, figures 1 and 2).
3.3 Radioactive liquid discharges via the factory sewer
Paragraph 14
The factory sewer discharges into the confluence of the rivers Calder and Ehen. The primary source of the effluent is treated sewage and surface water drainage from areas of the Sellafield site to the north of the River Calder.
This water may contain trace amounts of radioactivity and therefore discharges are included in the Environmental Permit for Radioactive Substances for the Sellafield site. Total quantities of radioactivity discharged over the last 5 years and current permitted limits are shown in table 2.
Paragraph 15
All discharges during 2019 were within permitted limits. Compared to 2018, discharges of total alpha, total beta and tritium increased.
Paragraph 16
In March 2015 the Calder Interceptor Sewer was included in the site permit. Monitoring of this discharge route was performed throughout 2019 with no radioactive discharges being detected during this time.
3.4 Radioactive aerial discharges
Paragraph 17
Aerial effluents are discharged from a number of stacks (chimneys) on the Sellafield site. They mainly consist of ventilation air from the process plants.
Their radioactive constituents comprise of noble gases (e.g. krypton), other gases and vapours (e.g. hydrogen, water vapour, iodine and carbon dioxide) and suspended particulates.
Most release points are monitored continuously and fitted with appropriate abatement equipment, such as high efficiency particulate air filters or scrubbers.
Paragraph 18
The aerial discharge permit has annual site limits and individual stack limits. The individual stack discharges are summed to produce the site discharge. In this report, only performance against the site limits is presented (see table 3).
Paragraph 19
Discharges of radioactivity to the atmosphere also take place from open fuel storage ponds and other approved outlets (OFSPs and OOs) (previously MOOs, “Miscellaneous and Other Outlets”).
These are largely associated with the re-suspension of radioactivity from open fuel storage ponds and other approved places.
As in previous years, releases in 2019 from OFSPs and OOs were calculated by a methodology agreed with the EA using data on activity concentrations in air at the site perimeter. These data are included in the total alpha and total beta discharges detailed in table 3.
Paragraph 20
Discharges for the years 2015 to 2019 are summarised in table 3.
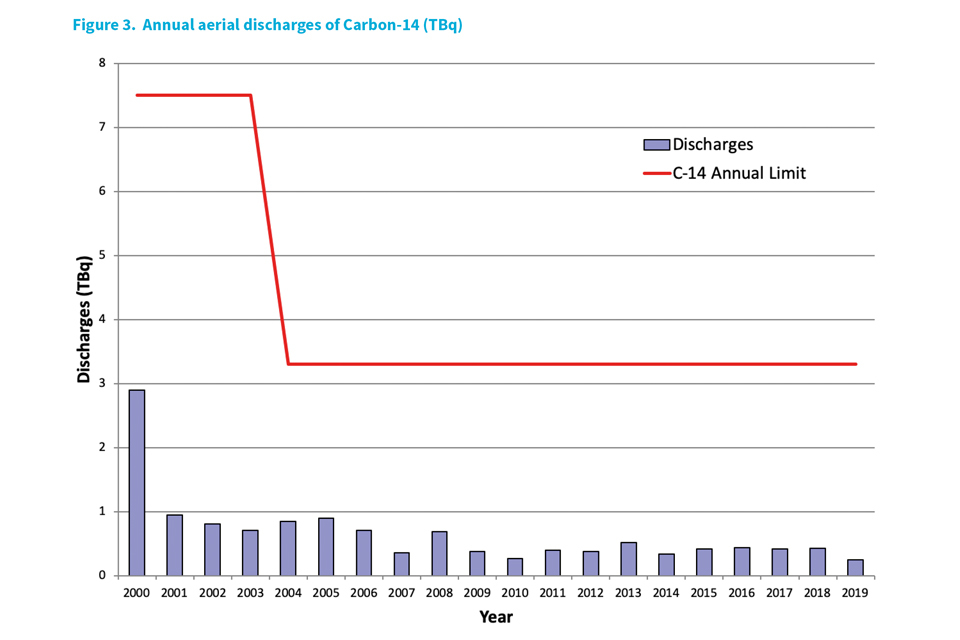
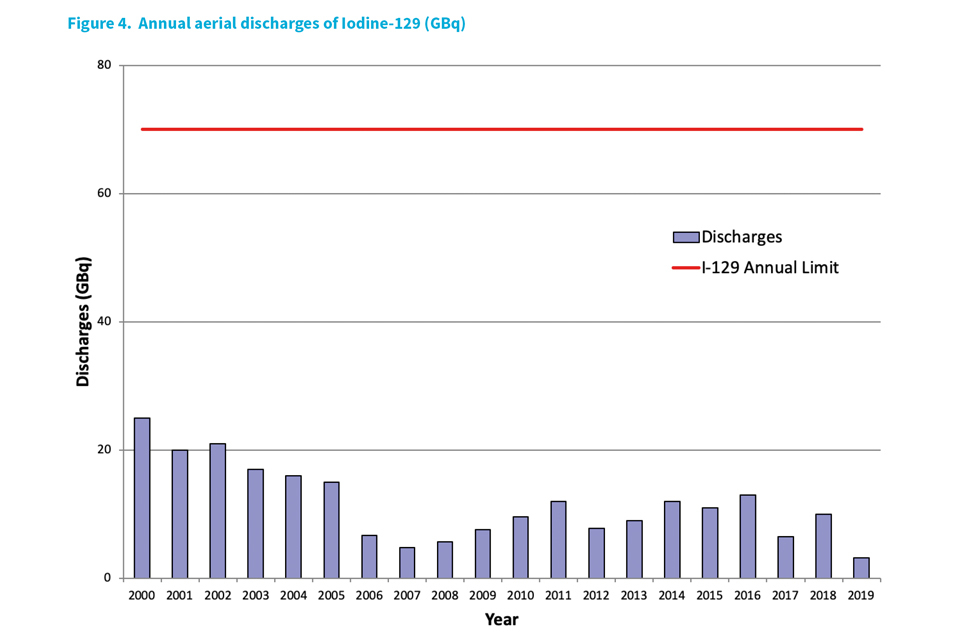
The discharges of krypton-85, iodine-129, tritium and carbon-14 generally reflect the reprocessing throughput (this chapter: paragraphs 6 and 7).
Most of the remaining radionuclides are associated with particulate material and their annual discharges are not directly related to annual reprocessing rates.
Paragraph 21
Figures 3 and 4 shows the annual aerial discharge trends for carbon-14 and iodine-129 since 2000. These trends will be used as a baseline record for future discharges during the post-reprocessing phase (beyond 2020) of the Sellafield site.
3.5 Solid low level radioactive wastes
Paragraph 22
A number of inter-site transfer authorisations cover the transfer of radioactive waste between Sellafield, the LLWR and other permitted disposal facilities. Details of these waste disposals are described below.
Paragraph 23
Solid low level radioactive waste arises on the Sellafield site from process operations and decommissioning.
Arisings of process wastes have been reduced in recent years to a fairly constant level so that fluctuations in total arisings now mainly reflect decommissioning operations.
The wastes are sent to the LLWR or diverted to other facilities under the LLWR Framework under the terms of the Environmental Permit, which also covers use of the Waste Monitoring and Compaction (WAMAC) facility at Sellafield.
This facility reduces the volume of waste being sent for disposal at the LLWR. It also offers a compaction service to other generators of low level radioactive waste across the UK.
Therefore, the Environmental Permit (and limits) also includes allowances for the transfer of non- Sellafield Ltd waste from WAMAC to the LLWR.
Paragraph 24
The Sellafield site seeks to minimise the amount of waste disposed to LLWR by applying the waste management hierarchy and by seeking to use other resources through the LLWR Framework.
In 2019, 6% of site LLW (10% in 2018) was disposed of to LLWR. The remaining 94% was reused/recycled or disposed of to other facilities, such as off-site Low-Active Low Level Waste (LA-LLW) facilities.
These routes include on-site disposal to the Calder Landfill Extension Segregated Area (CLESA) in addition to disposals to off-site specified landfills, metals recycling facilities, and thermal treatment facilities.
Routing of wastes to these facilities is carried out in accordance with a BAT decision tree, with disposal to LLWR always the last resort.
The low level radioactive waste and non-radioactive waste arisings from Sellafield for 2015 - 2019 are presented in table 4.
Paragraph 25
Historically, contaminated soil arising at Sellafield from construction and excavation was disposed of at permitted landfill sites on the Sellafield site.
Only one of these sites, CLESA, is now permitted. The previous landfill sites are now in closure and aftercare status. CLESA received 3,100 m³ in 2019.
These disposals are included in the Site’s Environmental Permit, which includes a specific activity limit of 200 Bq g-1, above which waste has to be disposed of at the LLWR as low level radioactive waste.
3.6 Disposals made under the terms of waste disposal or waste management licences
Paragraph 26
Radioactive wastes (including hazardous radioactive wastes) were historically disposed to the LLWR, now managed by LLWR Ltd.
CLESA is permitted to take a range of Very Low Level Radioactive Wastes (VLLW) / Low Active– Low Level Waste (LA-LLW), such as concrete, soil and stones with a specific activity limit of 200 Bq g-1.
Other LA-LLW and VLLW wastes (including hazardous wastes) are sent to off-site specified facilities. Where appropriate, some wastes arising on the site from both radiologically controlled areas and “non-active” areas, are carefully monitored and assessed (for example via intrusive sampling) to confirm that they are not radioactive.
These activities are carried out in accordance with the UK Nuclear Industry Guide1. Such wastes are ‘Out of Scope’ under the Environmental Permitting Regulations.
All wastes assessed as ‘Out of Scope’ under the Environmental Permitting Regulations 2016, as well as wastes deemed to be clean, are sent for disposal off- site as controlled wastes (paragraph 31).
3.7 Non-radioactive liquid and aerial discharges
Paragraph 27
Non-radioactive liquid effluent discharges between 2015 and 2019 are summarised in table 5 and include all discharges for which annual mass limits are specified. Aerial discharges between 2015 and 2019 are summarised in table 6 and 7.
Paragraph 28
There were four permit breaches in 2019 under the Environmental Permit for the Sellafield PPC installation. Three of these occurred at the Sewage Treatment Plant where suspended solids discharged in August (49.0 mg l-1) and September (58.8 and 74.8 mg l-1) exceeded the 45.0 mg l-1 daily limit.
Also in August, the Thorp R&S Cooling Tower Purge discharged suspended solids of 32.6 mg l-1 against the monthly bulk of 30.0 mg l-1.
Although there were no environmental consequences of these breaches, the EA was notified of their occurrence. Measures have now been taken to avoid a repeat of these events.
3.8 Ozone depleting substances and fluorinated greenhouse gases
Paragraph 29
The company is committed to minimising the use of ozone depleting substances and fluorinated greenhouse gases and replacing equipment containing them.
Routine releases are estimated from the amounts of refrigerants used to top-up systems on site. Site releases between 2015 and 2019 of ozone depleting substances and fluorinated greenhouse gases are summarised in table 8.
3.9 Carbon dioxide and other greenhouse gases
Paragraph 30
Sellafield’s discharges of carbon dioxide and methane are mainly from Fellside Combined Heat and Power plant (CHP), which is managed and operated by Sellafield Ltd and its emissions controlled by the Sellafield Environmental Permit and an Emissions Trading Permit.
Carbon dioxide may also be emitted from standby generators on Sellafield site which also have an Emissions Trading Permit. In addition, small amounts of carbon dioxide are released from the process plants (table 7).
Details of the corporate carbon footprint are given in a later chapter in this report.
3.10 Off-site disposals of solid waste
Paragraph 31
Non-radioactive (controlled) wastes consisting of, for example concrete, soil and stones, office/canteen or workshop waste (predominantly solid but including sludges and liquids) are disposed of off-site via the Site Waste Management Contractor, where possible, using the Waste Management Hierarchy. Such wastes are reused or recycled where possible.
Consideration is given by Sellafield Ltd to avoid the production of the waste in the first instance or whether the waste can be reduced in either classification or volume. Hazardous waste is usually unable to be reused/recycled, with some exceptions (e.g. fluorescent tubes, batteries and oil wastes for example), and are normally disposed of to specially licensed disposal facilities.
In 2019, 3.1% of Sellafield inert, non-hazardous and 9.2% of hazardous waste was reused or recycled (table 9).
The general increase in solid waste arisings in 2019 is due to the inclusion of waste soil and demolition rubble from new waste accounting routes.
3.11 Natural resources
Paragraph 32
Annual quantities of some natural resources used at the Sellafield site between 2015 and 2019 are given in table 10. Electricity is primarily generated at the Combined Heat and Power (CHP) Plant situated adjacent to the site.
Electricity consumption is relatively stable (site load is approximately 30 MW). Steam is also generated at the CHP Plant in the form of high pressure (HP) or low pressure (LP) supply.
Steam consumption varies with operational demands. LP steam in particular varies with fluctuating weather conditions.
Paragraph 33
Fresh water, which is abstracted under licence from the Environment Agency, is distributed as untreated and treated (potable and demineralised) and is consumed in operations and for staff welfare.
Paragraph 34
Electricity and steam consumption has been consistent over the last five years, whereas water demands in 2019 were at their lowest in 5 years. Measures are in place to continually improve natural resource consumption efficiencies.
3.12 Summary
Paragraph 35
There were no instances in 2019 of non-compliance with the numerical limits of permits regulating discharges and disposals of radioactive wastes at Sellafield.
Paragraph 36
Radioactive discharges (aerial and liquid) were generally lower than those in 2018 and were well below the permitted limits.
Paragraph 37
There were 4 permit breaches in 2019 under the Environmental Permit for the Sellafield PPC installation; 3 occurred at the Sewage Treatment Plant and one with Thorp R&S Cooling Tower Purge discharge.
Although there were no environmental consequences of these breaches, the EA was notified of their occurrence.
3.13 Reference
- NISDF (2017). The UK Nuclear Industry Guide to: Clearance and Radiological Sentencing: Principles, Process and Practices. Nuclear Industry Safety Director’s Forum, pp187.
Table 1 - Radioactive discharges to the Irish Sea via the pipeline, 2015-2019
| Radionuclides | Annual discharge (TBq) 2015 | Annual discharge (TBq) 2016 | Annual discharge (TBq) 2017 | Annual discharge (TBq) 2018 | Annual discharge (TBq) 2019 | Authorised Limits |
|---|---|---|---|---|---|---|
| Tritium | 1,500 | 2,000 | 1,300 | 1,300 | 420 | 18,000B |
| Carbon-14 | 4.9 | 4.8 | 3.6 | 2.9 | 2.8 | 21 |
| Cobalt-60 | 0.05 | 0.04 | 0.02 | 0.02 | 0.02 | 3.6 |
| Zinc-65 | 0.007 | 0.01 | 0.007 | 0.007 | 0.005 | |
| Strontium-90 | 1.6 | 2.0 | 2.1 | 1.3 | 1.2 | 45 |
| Zirconium-95 | 0.06 | 0.05 | 0.04 | 0.03 | 0.03 | 2.8 |
| Niobium-95 | 0.04 | 0.04 | 0.03 | 0.03 | 0.02 | 2.8 |
| Technetium-99 | 1.7 | 1.9 | 1.6 | 0.93 | 0.94 | 10 |
| Ruthenium-106 | 0.70 | 1.1 | 1.0 | 0.54 | 0.46 | 51 |
| Antimony-125 | 1.1 | 1.2 | 1.0 | 0.38 | 0.21 | |
| Iodine-129 | 0.36 | 0.52 | 0.26 | 0.30 | 0.04 | 2.0 |
| Caesium-134 | 0.07 | 0.07 | 0.04 | 0.04 | 0.02 | 1.6 |
| Caesium-137 | 3.1 | 3.7 | 3.3 | 4.4 | 1.6 | 34 |
| Cerium-144 | 0.19 | 0.21 | 0.12 | 0.09 | 0.07 | 4.0 |
| Europium-152 | 0.01 | 0.02 | 0.03 | 0.03 | - | |
| Europium-154 | 0.007 | 0.009 | 0.006 | 0.006 | - | |
| Europium-155 | 0.009 | 0.01 | 0.006 | 0.006 | - | |
| Neptunium-237 | 0.04 | 0.03 | 0.04 | 0.05 | 0.03 | 0.73 |
| Plutonium-alpha | 0.14 | 0.18 | 0.15 | 0.14 | 0.11 | 0.70 |
| Plutonium-241 | 2.4 | 3.0 | 2.1 | 1.9 | 1.2 | 25 |
| Americium-241 | 0.03 | 0.03 | 0.02 | 0.02 | 0.02 | 0.30 |
| Curium-243+244 | 0.001 | 0.003 | 0.002 | 0.001 | 0.001 | 0.05 |
| Total alpha^a | 0.19 | 0.25 | 0.18 | 0.16 | 0.13 | 0.90^b |
| Total beta^a | 9.5 | 13 | 12 | 10 | 6.8 | 180^c |
| Uranium (kg) | 330 | 340 | 350 | 310 | 260 | 2,000 |
a. ‘Total alpha’ and ‘Total beta’ are control measures relating to specified analytical determinations. They do not reproduce precisely the contributions from all individual isotopes.
b. Limit changed in March 2015 from 20,000 TBq for Tritium, 1.0 TBq for Total alpha.
c. Limit changed in December 2016 from 200 TBq for Total Beta.
Table 2 - Radioactive discharges to the Irish Sea via the Factory Sewer, 2015 – 2019
| Radionuclides | Annual discharge (TBq) 2015 | Annual discharge (TBq) 2016 | Annual discharge (TBq) 2017 | Annual discharge (TBq) 2018 | Annual discharge (TBq) 2019 | Authorised Limits (all sources) |
|---|---|---|---|---|---|---|
| Total alpha | 0.09 | 0.08 | 0.12 | 0.09 | 0.13 | 0.30 |
| Total beta | 2.6 | 5.2 | 3.5 | 3.4 | 4.2 | 60^a |
| Tritium | 7.4 | 7.9 | 6.4 | 7.3 | 11 | 68 |
a. Limit changed in December 2016 from 6.1 GBq for Total Beta.
Table 3 - Total airborne radioactive discharges, 2015 – 2019
| Radionuclides | Annual discharge (TBq) 2015 | Annual discharge (TBq) 2016 | Annual discharge (TBq) 2017 | Annual discharge (TBq) 2018 | Annual discharge (TBq) 2019 | Authorised Limits (all sources) |
|---|---|---|---|---|---|---|
| Tritium | 84 | 120 | 99 | 90 | 56 | 1,100 |
| Carbon-14 | 0.42 | 0.44 | 0.42 | 0.43 | 0.25 | 3.3 |
| Krypton-85 | 68,000 | 88,000 | 43,000 | 65,000 | 7,800 | 440,000 |
| Annual discharge (GBq) 2015 | Annual discharge (GBq) 2016 | Annual discharge (GBq) 2017 | Annual discharge (GBq) 2018 | Annual discharge (GBq) 2019 | ||
| Strontium-90 | 0.03 | 0.03 | 0.03 | 0.01 | 0.009 | 0.71 |
| Ruthenium-106 | 0.73 | 0.70 | 0.65 | 0.49 | 0.56 | 23 |
| Antimony-125 | 12 | 10 | 1.7 | 1.3 | 1.5 | 30 |
| Iodine-129 | 11 | 13 | 6.5 | 10 | 3.2 | 70 |
| Iodine-131 | 0.44 | 0.42 | 0.37 | 0.39 | 0.23 | 37 |
| Caesium-137 | 0.09 | 0.10 | 0.04 | 0.05 | 0.07 | 5.8 |
| Plutonium-alpha | 0.03 | 0.02 | 0.03 | 0.03 | 0.01 | 0.19 |
| Plutonium-241 | 0.29 | 0.15 | 0.33 | 0.23 | 0.10 | 3.0 |
| Americium-241 + Curium-242 | 0.02 | 0.01 | 0.02 | 0.02 | 0.01 | 0.12 |
| Total alpha | 0.08 | 0.11 | 0.11 | 0.10 | 0.08 | 0.88 |
| Total beta | 0.62 | 1.2 | 0.78 | 0.63 | 0.64 | 42 |
Table 4 - Solid low level waste arisings from Sellafield, 2015-2019
| Low Level Waste Arisings (m^3) | 2015 | 2016 | 2017 | 2018 | 2019 |
|---|---|---|---|---|---|
| LLW produced on site which has been reused, recycled or disposed of | 9,800 | 14,000 | 11,000 | 9,000 | 9,400 |
| LLW metal waste recycled | 2,300 | 2,300 | 2,000 | 3,100 | 2,900 |
| Combustible LLW treated | 1,300 | 1,200 | 2,100 | 2,200 | 2,100 |
| LLW disposed of directly to landfill (as LLW, HV-VLLW or exempt waste but excluding waste that is out of scope of regulation) | 370 | 770 | 1,600 | 580 | 850 |
| LLW disposed of on site | 4,100 | 8,200 | 4,000 | 2,300 | 3,100 |
| Volume of LLW disposed of at LLWR | 1,800^a | 1,600^a | 1,300^a | 880^a | 520^a |
a. Volume now includes volume of compactable LLW.
Table 5 - Non-radioactive liquid effluent discharges (kg), 2015 – 2019
| Substance | Release points | 2015 | 2016 | 2017 | 2018 | 2019 | Annual limit^a |
|---|---|---|---|---|---|---|---|
| Mercury | SETP, SIXEP, EARP, Laundry, Inactive Tank Farm Neutralising Pit, Thorp-C14 Removal Plant, Water Treatment Plant | 0.12 | 0.04 | 0.04 | 0.03 | - | 10 |
| Chromium | SIXEP, SETP, EARP | 47 | 110 | 120 | 40 | 5.6 | 1,200 |
| N as NO2 and NO3 | SETP, EARP | 900,000 | 1,000,000 | 1,000,000 | 1,000,000 | 1,000,000 | 4,080,000 |
| N as NO2 and NO3 | Thorp-C14 Removal Plant | 4,500 | 7,000 | 3,600 | 4,600 | 420 | 29,900 |
| Glycol | SETP, SIXEP, EARP, Lagoon | 530 | 590 | 290 | 1,500 | 7,600 | 12,000 |
a. Annual mass limits reported under the Environmental Permit.
Table 6 - Non-radioactive aerial effluent discharges (kg), 2015 – 2019
| Substance | Release points | 2015 | 2016 | 2017 | 2018 | 2019 | Annual limit^a |
|---|---|---|---|---|---|---|---|
| Oxides of nitrogen (as NO<2>) | Vitrification Test Rig | 20 | 54 | 29 | 33 | 40 | 1,100 |
| Oxides of nitrogen (as NO<2>) | NNL Central Laboratory | 30 | 54 | 11 | 14 | 11 | 500 |
| Particulate matter | Fellside CHP (as PM<10>) | 510 | 450 | 410 | 360 | 230 | - |
a. Annual mass limits reported under the Environmental Permit.
Table 7 - Non-radioactive aerial effluent discharges (tonne), 2015-2019^a
| Substance | Release points^b | 2015 | 2016 | 2017 | 2018 | 2019 |
|---|---|---|---|---|---|---|
| Oxides of nitrogen (as NO<2>) | Site Total | 530 | 450 | 420 | 330 | 250 |
| Carbon dioxide | Site Total | 430,000 | 390,000 | 360,000 | 320,000 | 260,000 |
| Carbon monoxide | Site Total | 430,000 | 390,000 | 360,000 | 320,000 | 260,000 |
| Non-Methane Volatile organic compounds (NMVOCs) | Site Total | 86 | 71 | 60 | 63 | 32 |
| Methane | Site Total | 27 | 23 | 18 | 17 | 15 |
a. No annual limits apply.
b. Site Total includes Fellside CHP plant.
Table 8 - Discharges of ozone depleting substances and fluorinated greenhouse gases (kg), 2015 - 2019
| Substance^a | 2015 | 2016 | 2017 | 2018 | 2019 |
|---|---|---|---|---|---|
| R22 HCFC | 1.4 | - | - | - | 4.0 |
| R134A HFC | 100 | 120 | 110 | 70 | 1000 |
| R407C HFC | 120 | 44 | 43 | 19 | 50 |
| R404A HFC | 0.10 | 0.10 | 33 | 5.3 | 3.6 |
| R410A HFC | 61 | 4.9 | 57 | 12 | 82 |
| R417A HFC | 5.0 | 8.1 | - | - | - |
a. HCFCs are ozone depleting substances and HFCs are fluorinated greenhouse gases. Note: the range of substances discharged varies each year depending on which equipment is topped up with refrigerants.
Table 9 - Non-radioactive solid waste arisings from Sellafield, 2015 – 2019
| Non-Radioactive Waste Arisings (te)^a | 2015 | 2016 | 2017 | 2018 | 2019 | |
|---|---|---|---|---|---|---|
| Non-Hazardous Waste Arisings | Non-hazardous waste produced on site | 12,000 | 12,000 | 63,000 | 38,000 | 92,000 |
| Non-Hazardous Waste Arisings | Non-hazardous waste reused or recycled | 9,600 | 8,500 | 39,000 | 9,300 | 2,800 |
| Non-Hazardous Waste Arisings | % of non-hazardous waste reused or recycled | 78% | 70% | 62% | 24% | 3.1% |
| Hazardous Waste Arisings | Hazardous waste produced on site | 370 | 590 | 1,300 | 1,200 | 1,100 |
| Hazardous Waste Arisings | Hazardous waste reused or recycled | 160 | 140 | 190 | 500 | 99 |
| Hazardous Waste Arisings | % of hazardous waste reused or recycled | 43% | 24% | 14% | 42% | 9.2% |
a. Whilst every effort is made to centrally record all Non-Rad waste arisings, some sub-contractors may not provide this information, so the actual quantity produced may be higher than the centrally recorded figure.
Table 10 - Summary of natural resources used at the Sellafield site, 2015 – 2019
| Resource | 2015 | 2016 | 2017 | 2018 | 2019 |
|---|---|---|---|---|---|
| Electricity (MWh) | 270,000 | 270,000 | 280,000 | 270,000 | 260,000 |
| Water (tonnes) | 6,700,000 | 7,200,000 | 7,200,000 | 7,100,000 | 6,200,000 |
| HP Steam (tonnes) | 370,000 | 380,000 | 380,000 | 360,000 | 350,000 |
| LP Steam (tonnes) | 260,000 | 270,000 | 240,000 | 220,000 | 260,000 |
Figure 1 - Pu-alpha discharge from marine pipeline and concentration in winkles, mussels and Nephrops
Pu-Alpha discharge from marine pipeline and concentration in winkles, mussle snd Nephrops
Figure 2 - Am-241 discharge from marine pipeline and concentration in winkles, mussels and Nephrops
Am-241 discharge from marine pipeline and concentration in winkles, mussels and Nephrops
Figure 3.- Annual aerial discharges of Carbon-14 (TBq)
Annual aerial discharges of Carbon-14 (TBq)
Figure 4 - Annual aerial discharges of Iodine-129 (GBq)
Annual aerial discharges of Iodine-129 (GBq)
4. Radiological and non-radiological monitoring of the environment
Paragraph 1
The results of the Sellafield Ltd environmental monitoring programme for 2019 are presented within this report alongside supplementary data, for foodstuffs and radionuclides pertinent to dose calculations, published by the FSA (tables 11 and 12).
Further background information relating to analytical measurements, limit of detection and rounding of data is given in the Introduction.
Paragraph 2
The main pathways identified by Sellafield Ltd, the EA and FSA as relevant to calculating critical group doses attributable to radioactive discharges from Sellafield are:
- Internal exposure from the high rate consumption of seafood (particularly crustaceans and shellfish) and of local agricultural produce
- External gamma radiation from exposed intertidal sediments, particularly the silts and muds of estuaries and harbours
- Inhalation of, and exposure to, airborne radioactivity
The habits and consumption rates relating to each pathway are kept under regular review1,2,3. The SEMP, as supplemented by data from the EA and FSA monitoring programmes, reflects these pathways.
In addition to pathways of radiation exposure, the monitoring programme also includes the analysis of ‘indicators’.
These are usually biological materials which accumulate radioactivity and therefore are more likely to produce positive analytical results and provide trends in environmental concentrations; examples are grass and seaweed.
Doses from direct radiation, as distinct from discharges, are discussed elsewhere (paragraphs 21 and 22).
Paragraph 3
Concentrations of radioactivity in the marine environment reflect discharges from the Sellafield pipelines, whereas radioactivity in the terrestrial environment generally reflects discharges to atmosphere.
Some overlap does occur however, with sea to land transfer processes4,5 and on tidally inundated pastures6. Concentrations of caesium-137, plutonium and americium-241 in most environmental materials are predominantly as a consequence of historical discharges between 1968 and 1984.
4.1 Marine pathways
Paragraph 4
The extent of the marine environmental monitoring programme is illustrated in figure 1. Samples are regularly collected from the Cumbrian coast.
The precise locations are reviewed periodically. In certain cases, additional samples are obtained through commercial suppliers, representing foodstuffs available for general consumption.
Foodstuffs
Paragraph 5
The concentrations of radionuclides in the edible parts of fish, molluscs and crustaceans from the Sellafield Area are given in tables 1, 2 and 3 and summarised in table 4.
Temporal trends are shown in the Discharge and Disposals chapter, figures 1 and 2 alongside the discharges from the sea pipeline.
Trends in seafood generally reflect the annual discharges from the pipeline and as such were generally similar to those in recent years.
Plutonium-alpha and americium-241 concentrations in mussels and winkles were similar to 2018. Overall, the general downward trend in actinide concentrations, in molluscs has continued, with concentrations in 2019 being around half the values reported in the early 1990s.
Paragraph 6
As Nephrops now contributes as much dose to the critical group as mussels (Radiological chapter, table 1), concentrations of plutonium-alpha and americium-241 in Nephrops have been included in the Discharge and Disposal chapter figures 1 and 2.
In general, concentrations of plutonium-alpha and americium-241 in Nephrops have remained constant since 1990. During that time plutonium-alpha concentrations peaked at 2.5 Bq kg-1 in 1997 and have been consistently below 1 Bq kg-1 since 2000.
Similarly, americium-241 concentrations peaked at 5 Bq kg-1 in 1997 with concentrations being below 3 Bq kg-1 since 2003.
The Nephrops concentration data for americium-241 have been compiled using Sellafield Ltd reported data. Data gaps exist for plutonium-alpha which have been filled using RIFE data and normalising to the Sellafield Ltd americium-241 data.
Paragraph 7
Data for carbon-14 presented in tables 1 to 4 are not corrected for the levels which are present naturally⁷.
However, background corrected values for carbon-14 in fish, molluscs and crustaceans have been used in the assessment of radiation doses to critical groups.
For these marine foodstuffs, the natural concentration of 218 Bq carbon-14 per kg carbon has been taken from data published by the EA and FSA¹.
Indicators
Paragraph 8
Seaweeds are useful marine indicators (see paragraph 2). Fucus vesiculosus is collected because it accumulates many radionuclides (particularly technetium-99) and is sensitive to fluctuations in their concentrations in seawater. Thus, the reduction in discharges from 2002 onwards was soon reflected in the levels in this species (Appendix B, figure B1).
Porphyra umbilicalis is also collected and monitored as an indicator species (Appendix B, table B1) due to its historical exposure pathway role for ruthenium-106.
Seawater and sediments
Paragraph 9
Sellafield Ltd routinely collects samples of seawater from the shore at locations close to Sellafield. Concentrations of radioactivity in seawater (Appendix B, table B2) were broadly similar to those of recent years.
Specific examples of concentration trends in seawater filtrate from 2000 are given for caesium-137 and plutonium- alpha at Sellafield beach in Appendix B, figures B2 and B3 respectively.
A gradual decrease over time is observed for caesium-137 whereas plutonium-alpha has remained at a consistently low level over this time period despite there being an increase in plutonium-alpha discharges between 2002 and 2004 due to increased pond water activity concentrations in the FHP.
Paragraph 10
Concentrations of radioactivity in sediments (Appendix B, table B3) were generally similar to those of recent years.
Redistribution of sub-surface sediments may have led to small fluctuations in radionuclide concentrations.
4.2 External pathways
Paragraph 11
Gamma dose rate surveys are carried out in the areas most often frequented by members of the public (table 5).
Particular attention is paid to areas where silt or mud accumulates, such as in harbours or estuaries, where dose rates tend to be higher because of the presence of finely-divided sediments.
Several measurements are made in each area allowing temporal and geographical trends to be observed. The gradual decline in external gamma dose rates at Newbiggin saltmarsh between 1993 and 2019 is shown in Appendix B, figure B4.
This decline is consistent with the decline in activity concentrations of cobalt-60, ruthenium-106 and caesium-137 reported in Newbiggin sediment (due to a combination of discharge trends and radioactive decay).
The major external gamma dose rate contributor in recent years is from caesium-137 due to the reduction in discharges and decay of cobalt-60 (5.27 year half life) and ruthenium-106 (373 day half life).
Consequently the external gamma dose rates here will now decrease according to the presence of caesium-137 (30.1 year half life) combined with potential burial rate due to sediment accretion.
Gamma dose rate surveys are also conducted around the site perimeter and the surrounding district (tables 6 and 7 and paragraph 21-22). In general dose rates are declining towards background levels.
Paragraph 12
Beta-gamma ground level monitoring is undertaken by the Groundhog monitoring system, just above the surface on local beaches to ascertain the general levels of radioactivity and to remove items of higher than normal activity if necessary.
4.3 Airborne and terrestrial pathways
Paragraph 13
The extent of the terrestrial environmental monitoring programme is illustrated in figure 2.
Airborne
Paragraph 14
High volume air sampling equipment, located close to the site perimeter (table 8) and in nearby centres of population (table 9), is used to sample airborne particulates for radiochemical analysis.
Levels off-site were generally below the limit of detection, with most positive values reflecting sea to land transfer from marine discharges.
Paragraph 15
Total deposition collectors are located in the vicinity of each of the five high volume air samplers close to the site perimeter.
Higher activity concentrations for beta- emitters are measured at North Gate (Appendix B, table B4), reflecting its close proximity to the open ponds.
Paragraph 16
Continuous sampling for atmospheric krypton-85 was analysed fortnightly at the Met. station on the edge of Sellafield site.
Concentrations ranged from 2.1 to 22 Bq m-3 and averaged 9 Bq m-3. This is equivalent to an immersion dose of <1 µSv a-1 for all age groups (Radiological impact chapter, table 3).
A significant drop in atmospheric krypton-85 concentrations was observed due to the cessation of reprocessing operations at Thorp in November 2018, resulting in the significant reduction in krypton-85 discharges in 2019 (table 3, Discharges and Disposals chapter).
Foodstuffs and water
Paragraph 17
Locations sampled for milk include local farms (in the range 0 to 4 km from the Sellafield site). The average concentrations of radioactivity in milk are summarised in table 10.
The figures include the residual effects of weapons testing and the 1986 Chernobyl reactor accident. Data for carbon-14 includes the contribution from natural background.
However, estimates of effective dose have been made by subtracting natural background levels of carbon-14. For milk and other terrestrial foodstuffs, vegetation and soil, a background level of 218 Bq carbon-14 per kg carbon is used1.
The milk results for 2019 are broadly similar to or lower than those observed for previous years, with many analyses at the limit of detection. In recent years, milk consumption was a main contributor to the critical group dose from terrestrial foodstuffs.
In 2019, this was not the situation due to Sr-90 activity concentrations being lower than previous years.
Paragraph 18
The results of the Sellafield terrestrial foodstuffs monitoring programme for 2019 are presented alongside supplementary data published by the FSA in tables 11 and 12.
The Sellafield Ltd samples were mainly collected from within 4 km of the Sellafield site as they became available throughout the year.
Direct comparison with the results of earlier years is difficult due to the relatively small numbers of samples and their locations. Data for carbon-14 are presented as total and net (background subtracted) values1.
For terrestrial foodstuffs no longer monitored by Sellafield Ltd, natural carbon-14 background concentrations have been taken from data published by the EA and FSA¹.
For 2019, the consumption of domestic fruit and sheep muscle have been calculated to be the main contributors to the critical group dose from terrestrial foodstuffs.
Paragraph 19
Water samples are collected from the River Calder and River Ehen, lakes and domestic supplies. The results (table 13) are all very low and rarely above the limits of detection, except for strontium-90 which is generally present in rain water and surface water at levels typical of those throughout the UK¹.
The higher strontium-90 concentration in the River Calder at Sellafield is due to the seepage of strontium-90 in groundwater from site to the river.
This transport route is considered within the groundwater assessment of site. The higher concentration of caesium-137 in the River Ehen, 5 m upstream from the Factory Sewer is a result of there being seawater present within the river water sample, despite samples being collected at low tide.
Indicators
Paragraph 20
Grass and soil sampling are included in the monitoring programme as they provide time trend data on environmental concentrations of radioactivity.
Grass samples (Appendix B, table B5) are collected quarterly from 5 locations on the Sellafield site. Soil samples (5 cm cores) are collected annually from the same locations (Appendix B, table B6). Concentrations in soil are similar to previous years.
4.4 Direct radiation
Paragraph 21
Some of the older Magnox buildings, including the Calder reactors, have lower levels of radiation shielding than the modern buildings, such as Thorp. Consequently, it is possible to measure radiation dose rates above natural background at the site perimeter fence.
These dose rates were largely due to direct radiation from the unshielded heat exchangers on the Calder reactors and therefore were dependent upon the amount of power being produced by the reactors (until they were shut down in March 2003).
The perimeter radiation levels are still affected by radiation from contamination within the heat exchangers but at a much lower level.
Paragraph 22
Gamma dose rates are monitored continuously and analysed quarterly using thermoluminescent detectors (TLDs) at 19 locations around the site perimeter (table 6) and at a further 7 locations in the surrounding district (table 7).
Dose rates at the site perimeter averaged 0.08 µSv h-1, significantly lower than when the Calder Hall reactors were fully operational.
Dose rates in the surrounding district averaged 0.06 µSv h-1. These are total dose rates, which include contributions from natural terrestrial background and cosmic rays. For dose assessment purposes the natural contributions are deducted.
4.5 Non-radiological monitoring of the environment
Paragraph 23
The Environmental Permit includes a non-radiological monitoring programme (see Monitoring chapter, figure 3).
Compared to the radiological environmental monitoring programme, its scope is limited and comprises local air sampling on the Sellafield site, water sampling from the Rivers Calder and Ehen and seawater sampling from local beaches.
A more comprehensive summary of non-radioactive releases to air, controlled waters, land and off-site transfers of waste is given in the pollution inventory supplied to the EA each year and is available from their website.
Air sampling
Paragraph 24
Measurements of nitrogen dioxide concentrations in air are made at five locations on the Sellafield site: West Ring Road, Meteorological Station, North Group roundabout, Calder Gate and South Side.
Measurements are made using passive diffusion tubes which are exposed for one month before being analysed.
Air sampling results are summarised in table 14.
Water sampling
Paragraph 25
Water samples are obtained from the Rivers Calder and Ehen at locations both upstream and downstream of the site (table 15). The downstream samples are taken above the confluence of the two rivers, and at times which minimise contamination with seawater.
Seawater samples are obtained from the shoreline areas given in table 16.
Monitoring of Sellafield’s landfill sites
Paragraph 26
The Waste Management Licences for the North Landfill Site and Calder Floodplain Landfill Extensions require that environmental monitoring be carried out in the vicinity of the two sites.
The monitoring comprises water sampling from the River Calder and New Mill Beck upstream and downstream of the landfills and gas monitoring over their surfaces. The results are summarised in tables 17 and 18.
4.6 Environmental impact of non-radioactive discharges
Paragraph 27
In this report, the impact of aerial discharges has been addressed (table 14) by comparing the measured environmental concentrations with the most stringent (annual mean) national air quality limit values (ref 8) for nitrogen dioxide.
The interpretation of these results is not straightforward since discharges are made not only from Sellafield but also from other industrial sites in West Cumbria and from natural sources.
The data in table 14 show that the measured concentrations in air on the Sellafield site were all below the air quality limit value.
Paragraph 28
The results in table 15 and 16 confirm that the liquid discharges from Sellafield are not causing the Environmental Quality Standards (EQS) and Environmental Assessment Levels (EAL) (ref 8) to be exceeded and therefore should be of negligible impact.
Paragraph 29
Environmental monitoring results (table 17 and 18) confirm that the impact of Sellafield’s landfill sites remains negligible. No significant concentrations of carbon dioxide or methane have been measured at these sites.
4.7 References
- Environment Agency, Food Standards Agency, Food Standards Scotland, Natural Resources Wales, Northern Ireland Environment Agency and Scottish Environment Protection Agency (2020). Radioactivity in food and the environment, 2019. RIFE-25. EA, FSA, FSS, NRW, NIEA and SEPA; Preston, London, Aberdeen, Cardiff, Belfast and Stirling.
- Food Standards Agency (2010). Radiological Habits Survey: Cumbrian coast beach occupancy, 2009. Environment Report RL 01/10.
- Moore K J, Clyne F J and Greenhill B J (2019). Radiological habits survey: Sellafield, 2018. Environment Report RL07/19. Cefas, Lowestoft (under contract to the EA and the FSA).
- Peirson DH (1988). Artificial radioactivity in Cumbria: A summary of an assessment by measurement and modelling. J. Env. Radioactivity 6: 61-75.
- Howarth JM and Eggleton AEJ (1988). Studies of environmental radioactivity in Cumbria. Part 12: Modelling of sea-to-land transfer of radionuclides and an assessment of the radiological consequences. AERE-R11733, HMSO, London.
- Howard BJ (1987). Cs137 uptake by sheep grazing tidally inundated and inland pastures near the Sellafield reprocessing plant. In: Coughtrey P J et al (Eds) Pollutant Transport and Fate in Ecosystems, pp 371-383. Blackwell Scientific Publications, Oxford.
- Cook GT and McKenzie AB (1996). Marine background of carbon-14. Project RP/GNSR/5003, Scottish Universities Research and Reactor Centre, East Kilbride.
- Environment Agency (2010). Horizontal Guidance Note H1- Environmental risk assessment. Environment Agency, Bristol.
Table 1 - Radioactivity in fish (Bq kg-1 wet weight), 2019
| Species | Location | ^14C^a | ^99Tc | ^106Ru | ^137Cs | Pu(a) | ^241Am |
|---|---|---|---|---|---|---|---|
| Cod^b | Seascale landed | - | - | - | - | - | - |
| Cod^b | Whitehaven landed | - | - | - | - | - | - |
| Plaice | Seascale landed | 88 | 2.0 | <0.19 | 1.6 | 0.005 | 0.01 |
| Plaice | Whitehaven landed | 82 | 2.6 | <0.18 | 1.5 | 0.01 | 0.02 |
a. 14C data include natural background.
b. No cod landed during 2019.
Table 2 - Radioactivity in molluscs (Bq kg-1 wet weight), 2019
Mean radionuclide concentration (Bq kg^-1 wet weight)
Species – Mussels
| Location | Total Alpha | Total Beta | ^14C^a | ^60Co | ^90Sr | ^99Tc | ^106Ru | ^125Sb | ^129I | ^137Cs | U(x) | ^237Np | Pu(x) | ^238Pu | ^239+240Pu | ^241Pu | ^241Am | Cm(x) |
|---|---|---|---|---|---|---|---|---|---|---|---|---|---|---|---|---|---|---|
| SCA (north) – Annual | - | - | 150 | - | 0.55 | 44 | - | - | - | - | 0.76 | - | 3.4 | 0.59 | 2.8 | 15 | 6.2 | - |
| SCA (north) – Biannual | 18 | 56 | - | 0.32 | - | - | 1.6 | 0.22 | - | 1.5 | - | - | - | - | - | - | - | - |
| SCA (north) – Biannual | 17 | 60 | - | 0.29 | - | - | 3.6 | - | - | 0.94 | - | - | - | - | - | - | - | - |
| SCA (north) – Average | 18 | 58 | 150 | 0.31 | 0.55 | 44 | 2.6 | 0.22 | - | 1.2 | 0.76 | - | 3.4 | 0.59 | 2.8 | 15 | 6.2 | - |
| Whitehaven – Annual | - | - | 79 | - | 0.22 | 16 | - | - | - | - | 0.56 | - | 1.4 | 0.24 | 1.2 | 5.5 | 2.8 | - |
| Whitehaven – Biannual | 16 | 54 | - | 0.10 | - | - | <0.72 | - | - | 0.88 | - | - | - | - | - | - | - | - |
| Whitehaven – Biannual | 11 | 49 | - | 0.07 | - | - | <0.68 | - | - | 0.61 | - | - | - | - | - | - | - | - |
| Whitehaven average | 14 | 52 | 79 | 0.09 | 0.22 | 16 | <0.70 | - | - | 0.75 | 0.56 | - | 1.4 | 0.24 | 1.2 | 5.5 | 2.8 | - |
| SCA Average | 16 | 55 | 110 | 0.20 | 0.39 | 30 | <1.7 | 0.22 | - | 0.98 | 0.66 | - | 2.4 | 0.42 | 2.0 | 10 | 4.5 | - |
Species – Winkles
| Location | Total Alpha | Total Beta | ^14C^a | ^60Co | ^90Sr | ^99Tc | ^106Ru | ^125Sb | ^129I | ^137Cs | U(x) | ^237Np | Pu(x) | ^238Pu | ^239+240Pu | ^241Pu | ^241Am | Cm(x) |
|---|---|---|---|---|---|---|---|---|---|---|---|---|---|---|---|---|---|---|
| SCA (north) – Quarterly | 23 | 91 | - | 0.38 | 3.5 | 63 | 1.8 | - | - | 8.3 | 1.9 | 0.009 | 6.5 | 0.99 | 11 | 24 | - | <0.06 |
| SCA (north) – Annual | - | - | 100 | - | - | - | - | 0.25 | <0.11 | - | - | - | - | - | - | - | 13 | <0.06 |
| SCA (north) – Quarterly | 31 | 110 | - | 0.51 | 0.61 | 18 | <1.1 | - | - | 3.8 | 1.5 | 0.01 | 10 | 1.3 | 5.9 | 29 | 17 | <0.06 |
| SCA (north) – Quarterly | 17 | 72 | - | 0.46 | <0.37 | 16 | <1.3 | - | - | 3.4 | 1.0 | 0.007 | 3.9 | 0.59 | 5.1 | 16 | 7.7 | 0.02 |
| SCA (north) – Quarterly | 15 | 79 | - | 0.40 | <0.39 | 21 | 1.3 | - | - | 1.6 | 1.5 | 0.007 | 3.8 | 0.58 | 2.8 | 13 | 7.0 | <0.07 |
| SCA (north) Average | 22 | 88 | 100 | 0.50 | <1.8 | 30 | <1.4 | 0.25 | <0.11 | 4.3 | 1.5 | 0.008 | 6.1 | 0.87 | 6.1 | 21 | 11 | <0.05 |
| SCA (south) – Annual | - | - | 100 | - | - | - | - | - | <0.14 | - | - | - | - | - | - | - | - | - |
| SCA (south) – Quarterly | 17 | 110 | - | 0.50 | 1.3 | 120 | - | - | 4.1 | 2.6 | 0.006 | 6.7 | 0.96 | 7.2 | 25 | 11 | <0.12 | |
| SCA (south) – Quarterly | 19 | 88 | - | 0.48 | <0.51 | 110 | 1.7 | - | - | 3.6 | 3.1 | 0.005 | 4.7 | 0.82 | 7.0 | 17 | 8.9 | <0.05 |
| SCA (south) – Quarterly | 21 | 65 | - | 0.60 | 0.37 | 60 | <1.1 | - | - | 2.0 | 1.8 | 0.007 | 4.7 | 0.68 | 4.4 | 17 | 8.0 | <0.05 |
| SCA (south) – Quarterly | 19 | 89 | - | 0.50 | 0.65 | 81 | 1.1 | - | - | 1.6 | 1.8 | 0.007 | 5.9 | 0.89 | 3.9 | 21 | 10 | <0.04 |
| SCA (south) Average | 19 | 88 | 100 | 0.52 | 0.71 | 93 | 1.5 | - | <0.14 | 1.7 | 2.3 | 0.007 | 5.5 | 0.84 | 4.7 | 20 | 9.5 | <0.07 |
| SCA Average | 20 | 88 | 100 | 0.43 | 1.1 | 46 | 1.4 | 0.25 | <0.13 | 2.8 | 1.9 | 0.008 | 5.8 | 0.85 | 4.9 | 20 | 10 | <0.06 |
a. 14C data include natural background.
Table 3 - Radioactivity in crustaceans (Bq kg-1 wet weight), 2019
Mean radionuclide concentration (Bq kg^-1 wet weight)
Species – Edible Crab
| Location | ^14C^a | ^90Sr | ^99Tc | ^106Ru | ^129I | ^137Cs | U Alpha | Pu(a) | ^241Am |
|---|---|---|---|---|---|---|---|---|---|
| SCA (north) – Early | 62 | 0.08 | 7.6 | <0.77 | - | 0.49 | 0.10 | 0.19 | 0.39 |
| SCA (north) – Late | 65 | <0.03 | 4.9 | <0.81 | - | 0.42 | 0.20 | 0.11 | 0.44 |
| SCA (north) – Average | 64 | <0.06 | 6.3 | <0.79 | - | 0.46 | 0.15 | 0.15 | 0.42 |
| SCA (south) – Early | 57 | 0.04 | 6.2 | <1.0 | - | 0.45 | 0.10 | 0.15 | 0.27 |
| SCA (south) – Late | 67 | 0.02 | 4.1 | <0.66 | - | 0.47 | 0.16 | 0.12 | 0.45 |
| SCA (south) – Average | 62 | 0.03 | 5.2 | <0.83 | - | 0.46 | 0.13 | 0.14 | 0.36 |
| SCA Average | 63 | 0.04 | 5.7 | <0.81 | - | 0.46 | 0.14 | 0.14 | 0.39 |
| Whitehaven landed – Early | 58 | 0.02 | 3.3 | <0.81 | - | 0.37 | 0.11 | 0.07 | 0.34 |
| Whitehaven landed – Late | 57 | <0.03 | 1.2 | <0.73 | - | 0.53 | 0.16 | 0.07 | 0.39 |
| Whitehaven landed – Average | 58 | <0.03 | 2.3 | <0.77 | - | 0.45 | 0.14 | 0.07 | 0.37 |
Species – Lobster
| Location | ^14C^a | ^90Sr | ^99Tc | ^106Ru | ^129I | ^137Cs | U Alpha | Pu(a) | ^241Am |
|---|---|---|---|---|---|---|---|---|---|
| SCA (north) – Early | 59 | - | 31 | - | <0.21 | 0.81 | 0.04 | 0.07 | 0.90 |
| SCA (north) - Late | 79 | - | 110 | - | <0.24 | 0.51 | 0.05 | 0.13 | 0.89 |
| SCA (north) – Average | 69 | - | 71 | - | <0.23 | 0.66 | 0.05 | 0.10 | 0.90 |
| SCA (south) – Early | 56 | - | 31 | - | <0.22 | 0.55 | 0.04 | 0.05 | 0.58 |
| SCA (south) – Late | 60 | - | 94 | - | <0.36 | 0.92 | 0.06 | 0.10 | 0.46 |
| SCA (south) – Average | 58 | - | 63 | - | <0.29 | 0.74 | 0.05 | 0.08 | 0.52 |
| SCA Average | 64 | - | 67 | - | <0.26 | 0.70 | 0.05 | 0.09 | 0.71 |
| Whitehaven landed – Early | 64 | - | 34 | - | <0.24 | 0.49 | 0.06 | 0.10 | 0.87 |
| Whitehaven landed – Late | 54 | - | 61 | - | <0.17 | 0.82 | 0.07 | 0.06 | 0.39 |
| Whitehaven landed – Average | 59 | - | 48 | - | <0.21 | 0.66 | 0.07 | 0.08 | 0.63 |
Species – Nephrops (Scampi)
| Location | ^14C^a | ^90Sr | ^99Tc | ^106Ru | ^129I | ^137Cs | U Alpha | Pu(a) | ^241Am |
|---|---|---|---|---|---|---|---|---|---|
| SCA – Annual | 72 | - | - | - | - | - | - | - | - |
| SCA – Early | - | - | 41 | - | - | 1.0 | - | 0.86 | 3.3 |
| SCA – Late^b | - | - | - | - | - | - | - | - | - |
| SCA Average | 72 | - | 41 | - | - | 1.0 | - | 0.86 | 3.3 |
| Whitehaven landed – Annual | 73 | - | - | - | - | - | - | - | - |
| Whitehaven landed – Early | - | - | 39 | - | - | 1.2 | - | 0.68 | 3.0 |
| Whitehaven landed – Late^b | - | - | - | - | - | - | - | - | - |
| Whitehaven landed – Average | 73 | - | 39 | - | - | 1.2 | - | 0.68 | 3.0 |
a. 14C data include natural background.
b. No sample available SCA – Sellafield coastal area.
Table 4 - Summary of radioactivity in marine seafood (Bq kg-1 wet weight), 2019
| Radionuclide | Cod^b | Plaice^c | Lobster^d | Crab^d | Nephrops^d | Winkles^d | Mussels^d |
|---|---|---|---|---|---|---|---|
| Carbon-14^a | - | 64 | 64 | 63 | 72 | 100 | 110 |
| Cobalt-60 | - | - | - | - | - | 0.43 | 0.20 |
| Strontium-90 | - | - | - | 0.04 | - | 1.1 | 0.39 |
| Technetium-99 | 2.3 | 67 | 5.7 | 41 | 46 | 30 | |
| Ruthenium-106 | - | 0.19 | - | <0.81 | - | 1.4 | <1.7 |
| Silver-110m | - | - | - | - | - | - | - |
| Antimony-125 | - | - | - | - | - | 0.25 | 0.22 |
| Iodine-129 | - | - | <0.26 | - | - | <0.13 | - |
| Caesium-137 | - | 1.6 | 0.70 | 0.46 | 1.0 | 2.8 | 0.98 |
| Neptunium-237 | - | - | - | - | - | 0.01 | - |
| Plutonium-alpha | - | 0.01 | 0.09 | 0.14 | 0.86 | 5.8 | 2.4 |
| Plutonium-241 | - | - | - | - | - | 20 | 10 |
| Americum-241 | - | 0.02 | 0.71 | 0.39 | 3.3 | 10 | 4.5 |
| Curium-alpha | - | - | - | - | - | <0.06 | - |
a. 14C data include natural background.
b. No cod landed during 2019.
c. Combined average for Sellafield coastal areas.
d. Sellafield coastal area average.
Table 5. Mean gamma dose rates measured in air in intertidal and other coastal areas of Cumbria, 2019
| Area of survey | Description | Nature of ground | Number of observations | Mean dose rate (uGy h^-1)^a |
|---|---|---|---|---|
| Whitehaven | North shore | sand | 1 | 0.13 |
| Whitehaven Harbour (north) | outer harbour | Mud/silt | 4 | 0.10 |
| Whitehaven Harbour (south) | outer harbour | Soft mud | 4 | 0.11 |
| St Bees (beach) | beach | sand | 1 | 0.10 |
| St Bees (groynes) | groynes | pebbles/rocks | 1 | 0.16 |
| St Bees | promenade and car park | concrete/grass | 1 | 0.12 |
| St Bees | Seamill Lane car park | car park | 1 | 0.12 |
| Coulderton | grassed areas/beach bungalows | grass banks | 1 | 0.13 |
| Nethertown | beach | pebbles/shingle | 1 | 0.15 |
| Nethertown | car park | concrete/grass | 1 | 0.11 |
| Nethertown | grassed area/beach bungalows | grass banks | 1 | 0.14 |
| Braystones | beach | pebbles/shingle | 1 | 0.15 |
| Braystones | grassed areas/beach bungalows | grass banks | 1 | 0.14 |
| Sellafield Beach | beach | 1 | 0.16 | |
| Sellafield Dunes | dunes | 1 | 0.13 | |
| Sellafield | pipeline 3 | sand | 12 | 0.10 |
| Sellafield | pipeline 4 | sand | 12 | 0.10 |
| Factory Sewer | outfall | rocks/boulders/sand/shingle | 4 | 0.13 |
| Seascale Beach | north of pipeline | sand | 4 | 0.09 |
| Seascale Beach | south of pipeline | rocks/sand | 4 | 0.09 |
| Seascale Dunes | dunes | 1 | 0.12 | |
| Drigg | Barn Scar | mussel beds/silt/rocks | 1 | 0.10 |
| Drigg Beach | beach | sand | 1 | 0.12 |
| Ravenglass | Raven Villa | saltmarsh | 1 | 0.15 |
| Ravenglass | River Mite Ford | 1 | 0.12 | |
| Ravenglass | small boat area | firm silt/pebbles | 1 | 0.13 |
| Ravenglass | Salmon Garth | mussel beds | 1 | 0.11 |
| Ravenglass | Salmon Garth (saltmarsh) | sand/firm silt | 1 | 0.14 |
| Ravenglass | grassed area | grass | 1 | 0.11 |
| Eskmeals Viaduct | saltmarsh | saltmarsh | 1 | 0.13 |
| Newbiggin | saltmarsh | saltmarsh | 4 | 0.16 |
| Muncaster Road Bridge | riverbank | grass | 1 | 0.14 |
| Hall Waberthwaite | saltmarsh | saltmarsh turf | 1 | 0.14 |
a. Figures include contributions from natural background, typically 0.05 μGy h-1 over sandy areas and 0.07 μGy h-1 over silt.
Table 6 - Mean gamma dose rates measured in air at Sellafield site perimeter, 2019
| Area of survey | Number of locations | Mean dose rate (uSv h^-1)^a |
|---|---|---|
| North | 4 | 0.008 |
| East | 5 | 0.03 |
| South | 3 | 0.003 |
| West | 4 | 0.04 |
| River Ehen | 2 | 0.01 |
| River Calder | 12 | 0.18 |
| Critical Group | 1 | 0.05 |
| Mean annual average | - | 0.02 |
a. Figures exclude contribution from natural background (approximately 0.06 μSv h-1).
Table 7 - Mean gamma dose rates measured in air in the vicinity of Sellafield, 2019
| Location | Mean dose rate (uSv h^-1)^a |
|---|---|
| Calderbridge | 0.08 |
| Seascale | 0.06 |
| Ravenglass | 0.06 |
| Braystones | 0.07 |
| Whitehaven | 0.05 |
| Gosforth | 0.06 |
| Brow Top | 0.07 |
a. Figures include contribution from natural background (approximately 0.06 μSv h-1).
Table 8. Radioactivity in air in the vicinity of Sellafield - Site Perimeter Locations, 2019
Mean Radionuclide concentration (mBq m^-3)
| Radionuclide | Calder Gate | Met. Station | North Gate | West Ring Road | South Side |
|---|---|---|---|---|---|
| Total Alpha | 0.03 | 0.02 | 0.02 | 0.02 | 0.02 |
| Total Beta | 0.24 | 0.25 | 0.26 | 0.21 | 0.22 |
| ^90Sr | 0.004 | 0.008 | 0.009 | 0.002 | 0.002 |
| ^106Ru | <0.04 | <0.04 | <0.04 | <0.04 | <0.04 |
| ^125Sb | <0.01 | <0.01 | <0.01 | <0.01 | <0.01 |
| ^134Cs | <0.005 | <0.005 | <0.005 | <0.005 | <0.004 |
| ^137Cs | 0.01 | 0.02 | 0.04 | <0.05 | <0.04 |
| Pu(a) | 0.0006 | 0.0007 | 0.0008 | 0.0002 | 0.0002 |
| ^241Pu | <0.02 | <0.02 | <0.02 | <0.02 | <0.02 |
| ^241Am | 0.0007 | 0.0009 | 0.0008 | 0.0003 | 0.0003 |
| ^234U | <0.0005 | <0.0005 | <0.0005 | <0.0005 | 0.0005 |
| ^235U | <0.00002 | 0.00001 | 0.00002 | 0.00001 | 0.00002 |
| ^236U | <0.00002 | <0.00001 | <0.00002 | <0.00002 | <0.00002 |
| ^238U | 0.0003 | 0.0003 | 0.0004 | 0.0002 | 0.0003 |
Table 9 - Radioactivity in air in the vicinity of Sellafield - Residential Locations, 2019
Mean Radionuclide concentration (mBq m^-3)
| Radionuclide | Brow Top | Braystones | Caderbridge | Gosforth | Ravenglass | Seascale | Whitehaven |
|---|---|---|---|---|---|---|---|
| ^90Sr | 0.0007 | 0.0004 | 0.0007 | 0.0008 | 0.0004 | 0.0006 | 0.0009 |
| ^125Sb | <0.01 | <0.01 | <0.01 | <0.01 | <0.01 | <0.01 | <0.01 |
| ^134Cs | <0.005 | <0.004 | <0.004 | <0.004 | <0.004 | <0.004 | <0.004 |
| ^137Cs | <0.004 | <0.004 | <0.004 | <0.004 | <0.004 | <0.004 | <0.004 |
| Pu(a) | <0.0001 | <0.0002 | 0.0001 | <0.0001 | 0.0001 | 0.0001 | 0.0001 |
| ^241Pu | <0.02 | <0.02 | <0.02 | <0.02 | <0.02 | <0.02 | <0.02 |
| ^241Am | 0.0001 | 0.0003 | 0.0001 | 0.00007 | 0.0002 | 0.002 | 0.0001 |
| ^234U | <0.0004 | <0.0004 | <0.0004 | <0.0004 | <0.0004 | <0.0007 | <0.0007 |
| ^235U | 0.000006 | 0.000007 | 0.000005 | 0.000006 | 0.000006 | 0.00001 | 0.00001 |
| ^236U | <0.000009 | <0.000009 | <0.000008 | <0.000009 | <0.000009 | <0.00002 | <0.00002 |
| ^238U | 0.0001 | 0.0001 | 0.0001 | 0.0001 | 0.0002 | 0.0003 | 0.0002 |
Table 10 - Radioactivity in milk from farms near Sellafield, 2019
Mean radionuclide concentration (Bq litre-1)
| Location | Total Alpha | Total Beta | 3H | 14C Total a | 14C Net b | 90Sr | 106Ru | 125Sb | 129I | 131I | 137Cs |
|---|---|---|---|---|---|---|---|---|---|---|---|
| Farm A | <0.17 | 41 | 2.0 | 15 | <0.58 | 0.03 | <0.35 | <0.09 | 0.01 | <0.04 | 0.07 |
| Farm Bc | <0.14 | 42 | <2.5 | 13 | <0.50 | 0.03 | <0.36 | <0.10 | <0.01 | <0.04 | <0.04 |
| Farm C | <0.15 | 38 | 2.2 | 13 | <0.53 | 0.03 | <0.35 | <0.09 | <0.009 | <0.04 | 0.08 |
a. Including natural background.
b. Excluding natural background.
c. Milk from Farm B has been used in the radiological assessment.
Table 11 - Radioactivity in animal produce from farms near Sellafield, 2019
Mean radionuclide concentration (Bq kg-1 wet weight)a
| Species | 3HTotal | 14C Total b | 14C Net c | 60Co | 90Sr | 99Tc | 106Ru | 125Sb | 129I | 134Cs | 137Cs | 238Pu | 239+240Pu | 241Pu | 241Am |
|---|---|---|---|---|---|---|---|---|---|---|---|---|---|---|---|
| Bovine muscle | <11 | 27 | - | <0.04 | <0.02 | <0.06 | <0.30 | <0.09 | <0.02 | <0.04 | 0.48 | <0.0001 | <0.0003 | - | 0.001 |
| Bovine liver | <4.9 | 31 | 4.0 | <0.04 | <0.02 | <0.13 | <0.28 | <0.08 | <0.02 | <0.03 | 0.17 | 0.003 | 0.02 | 0.30 | 0.02 |
| Bovine kidney | <9.2 | 20 | - | <0.09 | 0.02 | <0.09 | <1.0 | <0.27 | - | <0.11 | 0.44 | 0.0006 | 0.004 | - | 0.04 |
| Ovine muscle | <3.0 | 32 | - | <0.05 | <0.03 | <0.06 | <0.35 | <0.10 | <0.02 | <0.04 | 2.7 | 0.00006 | 0.0002 | - | 0.0003 |
| Ovine kidney/liver | <4.8 | 25 | - | <0.04 | 0.02 | <0.13 | <0.31 | <0.09 | <0.02 | <0.04 | 1.1 | 0.0004 | 0.003 | - | 0.003 |
| Deer | <2.9 | 41 | 8.0 | <0.04 | <0.04 | - | <0.27 | <0.09 | <0.02 | <0.03 | 2.0 | 0.0002 | 0.0001 | - | 0.0001 |
| Duck d | - | 35 | - | <0.07 | <0.05 | <0.21 | <0.58 | <0.13 | <0.06 | <0.05 | <0.09 | <0.0005 | <0.0002 | - | 0.00005 |
| Pheasant | <9.9 | 49 | 16 | <0.05 | <0.04 | <0.06 | <0.29 | <0.08 | <0.008 | <0.03 | <0.05 | <0.0001 | <0.0001 | - | 0.0002 |
| Wild wood pigeon | <5.3 | 34 | 1.0 | <0.06 | <0.04 | - | <0.40 | <0.11 | <0.01 | <0.05 | <0.06 | <0.0001 | 0.0001 | - | 0.0001 |
| Rabbit | <6.3 | 40 | 7.0 | <0.06 | <0.04 | - | <0.45 | <0.11 | <0.008 | <0.06 | 2.8 | <0.0002 | 0.00002 | - | 0.0002 |
| Eggs - Chicken | <4.8 | 33 | - | <0.04 | <0.03 | - | <0.26 | <0.08 | <0.02 | <0.03 | <0.06 | <0.00008 | <0.0002 | - | 0.0002 |
a. Values shown in pale blue boxes are from measurements performed by the FSA.
b. Including natural background.
c. Excluding natural background (values taken from RIFE-25). Measured concentrations that are smaller than background value are indicated by a hyphen.
d. Year sampled - 2014.
Table 12 - Radioactivity in fruit and vegetable produce collected near Sellafield, 2019
Mean radionuclide concentration (Bq kg-1 wet weight)a
| Species | 3H Total | 14C Total b | 14C Net c | 60Co | 90Sr | 99Tc | 106Ru | 125Sb | 129I | 134Cs | 137Cs | 238Pu | 239+240Pu | 241Pu | 241Am |
|---|---|---|---|---|---|---|---|---|---|---|---|---|---|---|---|
| Potato | <4.2 | 15 | <0.70 | <0.05 | <0.03 | <0.04 | <0.28 | <0.10 | <0.02 | <0.04 | 0.08 | - | - | - | - |
| Cabbage | <2.2 | <12 | <5.0 | <0.06 | 0.16 | - | <0.45 | <0.12 | <0.03 | <0.06 | <0.05 | 0.00003 | 0.00009 | - | 0.0002 |
| Broccoli | <2.6 | 17 | 10 | <0.07 | <0.06 | - | <0.55 | <0.09 | <0.02 | <0.07 | <0.06 | <0.0001 | <0.0002 | - | 0.0001 |
| Cauliflower d | <2.1 | 9.2 | 2.2 | <0.10 | - | - | <0.68 | <0.16 | <0.04 | <0.07 | 0.07 | - | - | - | - |
| Carrots | <2.0 | 11 | 4.0 | <0.04 | 0.03 | - | <0.28 | <0.09 | <0.02 | <0.03 | 0.07 | 0.00005 | 0.0003 | - | 0.0002 |
| Beetroot | <2.3 | <14 | <7.0 | <0.05 | 0.09 | <0.06 | <0.38 | <0.10 | <0.02 | <0.05 | <0.07 | - | - | - | - |
| Swede | - | 14 | 7.0 | <0.06 | 0.20 | - | <0.29 | <0.10 | <0.04 | <0.05 | 0.07 | - | - | - | - |
| Runner beans d | <2.0 | 17 | - | <0.06 | 0.33 | - | <0.52 | <0.11 | <0.06 | <0.06 | <0.06 | <0.0001 | 0.0003 | - | 0.0007 |
| Mushroom | <2.0 | 11 | 7.0 | <0.04 | 0.03 | - | <0.28 | <0.09 | <0.02 | <0.03 | 0.07 | 0.00005 | 0.0003 | - | 0.0002 |
| Apple | 7.9 | 20 | 11 | <0.07 | 0.07 | <0.06 | <0.50 | <0.14 | <0.02 | <0.06 | 0.16 | 0.0002 | 0.0005 | - | 0.001 |
| Blackcurrants d | <4.0 | 17 | 8.0 | <0.20 | 0.08 | - | <1.2 | <0.30 | <0.02 | - | 0.11 | 0.0002 | 0.0005 | - | 0.002 |
| Strawberries d | <2.0 | 15 | 6.0 | <0.06 | 0.14 | - | <0.64 | <0.16 | <0.05 | <0.07 | <0.06 | <0.0001 | <0.0003 | - | <0.0002 |
| Blackberries | <6.7 | 19 | 10 | <0.02 | 0.08 | - | <0.22 | <0.06 | <0.008 | <0.03 | 0.09 | 0.0004 | 0.01 | <0.34 | 0.006 |
| Elderberries d | <2.0 | 26 | 17 | <0.11 | 0.04 | - | <0.52 | <0.18 | <0.08 | <0.08 | 0.14 | 0.001 | 0.004 | - | 0.008 |
| Honey d | - | 78 | 10 | <0.02 | <0.04 | - | <0.31 | <0.08 | <0.02 | <0.03 | <0.06 | <0.0002 | <0.0002 | - | 0.0001 |
| Swede | - | 5.4 | - | <0.06 | 0.05 | - | <0.47 | <0.13 | <0.02 | <0.06 | <0.06 | - | - | - | - |
a. Values shown in pale blue boxes are from measurements performed by the FSA.
b. Including natural background.
c. Excluding natural background (values taken from RIFE-25). Measured concentrations that are smaller than background value are indicated by a hyphen.
d.Year sampled - cauliflower (2013); runner beans (2013); blackcurrants (2012); strawberries (2013); elderberries (2013); honey (2014).
Table 13 - Radioactivity in local waters, 2019
Mean radionuclide concentration (Bq litre-1)
| Location | Total alpha | Total beta | 3H | 90Sr | 99Tc | 137Cs | Pu(( ) | Am+Cm | |
| River water: | River Calder at Sellafield | 0.01 | 0.26 | <3.9 | 0.08 | <0.006 | <0.005 | <0.002 | - |
| River Calder at Calderbridge | 0.01 | <0.09 | <3.7 | 0.003 | <0.006 | <0.005 | <0.002 | - | |
| R Ehen, 5m upstream of Factory Sewer outfall | <0.04 | 0.39 | <4.2 | 0.003 | 0.01 | 0.01 | <0.0007 | - | |
| R Ehen, 100m north of pipeline | <0.01 | 0.11 | <4.4 | 0.003 | <0.01 | <0.005 | <0.002 | - | |
| Lake water: | Ennerdale Water | 0.007 | <0.11 | <4.2 | 0.003 | - | <0.006 | <0.0006 | - |
| Wastwater | 0.02 | 0.06 | <4.3 | 0.003 | - | <0.006 | <0.002 | - | |
| Tap water: | Domestic water - Calderbridge | <0.01 | <0.08 | <4.3 | 0.002 | - | <0.005 | <0.0009 | - |
| Domestic water - Sellafield | 0.02 | <0.06 | <4.3 | 0.002 | - | <0.005 | <0.0003 | - | |
| Domestic water - Ravenglass | <0.01 | <0.07 | <3.6 | 0.002 | - | <0.005 | <0.002 | - | |
| Domestic water - Seascale | <0.01 | <0.07 | <4.2 | 0.002 | - | <0.005 | <0.0008 | - | |
| Domestic Water - Whitehaven | <0.01 | <0.08 | <3.2 | 0.002 | - | <0.005 | <0.0008 | - | |
| Spring water: | Sellafield Beach (South) a | - | - | 180 | 0.04 | 0.71 | 4.8 | 0.09 | 0.27 |
| Sellafield Beach (Maximum) a | - | - | 330 | 0.04 | 1.3 | 4.8 | 0.09 | 0.27 | |
| Sellafield Beach (Average) a | - | - | 120 | 0.04 | 0.50 | 4.8 | 0009 | 0.27 |
a. Results corrected for seawater content.
Table 14 - Non-radioactive monitoring of air in the vicinity of Sellafield, 2019
| Mean concentration in air (µg m-3) NO 2 | |
|---|---|
| Calder Gate | 11 |
| Met. Station | 8.2 |
| North Gate | 9.9 |
| West Ring Road | 9.4 |
| South Side | 8.3 |
| NAQS Objective a | 40 |
a. National Air Quality Standard (annual mean) 8
Table 15 - Non-radioactive monitoring of river waters, 2019
|Location | pH mg l-1 NO 3| -| |Calder Gate | 11 | |Met. Station | 8.2 | |North Gate | 9.9 | |West Ring Road | 9.4 | |South Side | 8.3 | |NAQS Objective a |40 |
a. National Air Quality Standard (annual mean) 8
Table 16 - Non-radioactive monitoring of coastal waters, 2019
| Location | mg l-1 | |
|---|---|---|
| NO - 2 | NO - 3 | |
| St Bees | <0.005 | 0.18 |
| Sellafield | <0.006 | 0.11 |
| Seascale Neb | <0.006 | 0.15 |
| Drigg Barnscar | <0.005 | 0.06 |
Table 17 - Non-radioactive monitoring of surface water around Calder Landfill Extension Segregated Area, 2019
| Location | B.O.D. (mg l-1) | C.O.D. (mg l-1) | T.O.C. (mg l-1) | Dissolved O2 (ppm) | NH + 4 (mg l-1) | SO 2-4 (mg l-1) | Conductivity (microS cm-1) |
|---|---|---|---|---|---|---|---|
| River Calder upstream | <2.5 | 5.1 | 2.5 | 11 | 0.004 | 4.3 | 89 |
| New Mill Beck upstream | <2.5 | 25 | 6.9 | 11 | 0.06 | 11 | 230 |
| New Mill Beck overflow drain a | 3.4 | 31 | 11 | 11 | 0.09 | 9.9 | 220 |
| River Calder downstream | <2.6 | 5.9 | 4.2 | 11 | 0.007 | 4.8 | 100 |
a. Sample only available under flood conditions.
B.O.D. – Biological Oxygen Demand; C.O.D. – Chemical Oxygen Demand; T.O.C. – Total Organic Carbon.
Table 18 - Non-radioactive monitoring of gases on Sellafield’s landfill sites, 2019
Mean concentration (% volume)
| Gas spike probe monitoring | CH 4 | CO2 | O2 |
|---|---|---|---|
| Calder Landfill Complex Boreholes | 0.07 | 2.6 | 16 |
| Calder Landfill Complex Probes | 0.04 | 0.86 | 19 |
Figure 1- Marine environmental monitoring around Sellafield
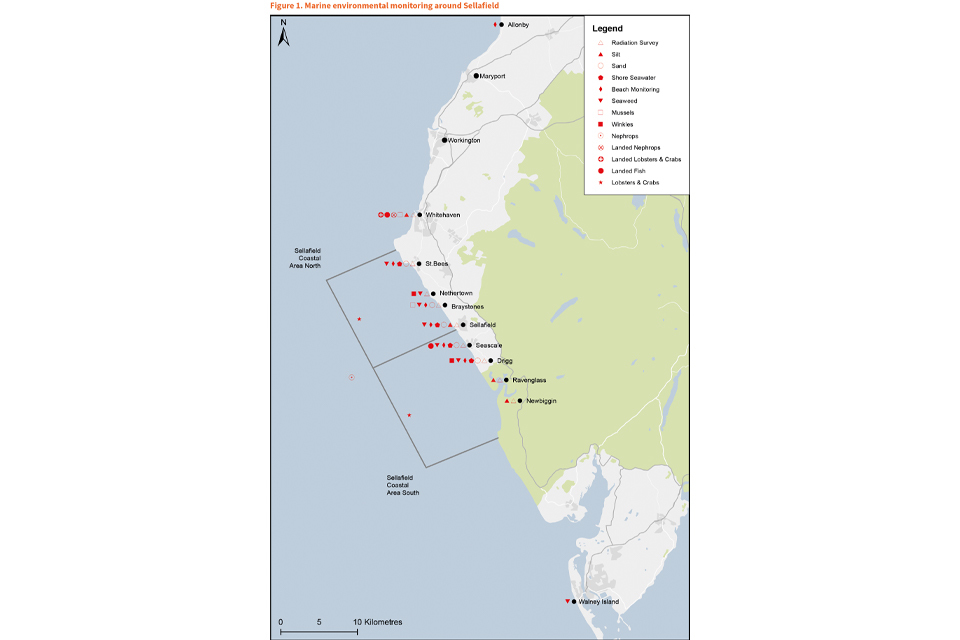
Figure 1. Marine environmental monitoring around Sellafield
Figure 2 - Terrestrial environmental monitoring around Sellafield
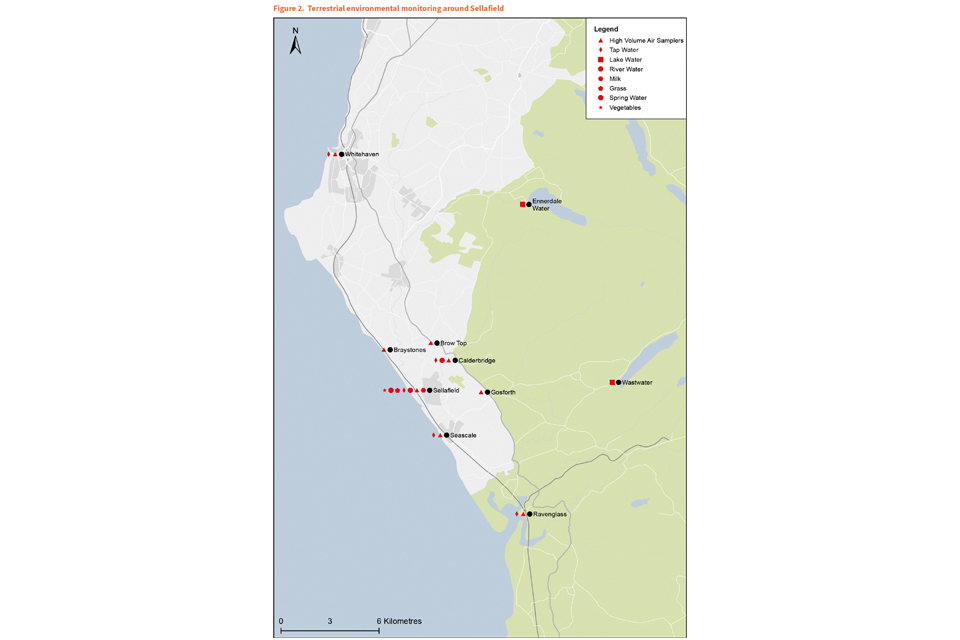
Terrestrial environmental monitoring around Sellafield
Figure 3 - Terrestrial environmental monitoring at Sellafield

Terrestrial environmental monitoring at Sellafield
5. Radiological impact of operations at Sellafield
5.1 Critical group doses
Paragraph 1
Critical group doses have been calculated following the Principles for Total Retrospective Dose Assessment1.
In 2005 several changes were made to the dose calculation methodology in order to make the Sellafield Ltd dose calculations more consistent with these principles, the methodology for which is presented in the NDAWG Paper 11-032. These changes in methodology include:
- Milk dose is based on the mean concentration at a nearby farm with the highest individual result
- The age groups considered for terrestrial critical group dose now include pre-natal (foetal) dose, which has been calculated as an extension to the adult dose assessment using relevant dose coefficients
- Dose per unit intake factors for ingestion and inhalation have been taken from the latest values published by the EA and FSA. These factors differ from those used in previous reports prior to 2013 because they include the presence of short-lived daughter radionuclides assumed to be in equilibrium with their parent at the time of ingestion, inhalation etc.
- The EA and FSA methodology does not use an Irish Sea specific dose per unit intake factor for technetium-99 in lobsters which was used in previous assessments
- Doses from inhaled and ingested tritium have been assessed using the more conservative dose factor for organically bound tritium, rather than that for tritiated water, which was used in previous reports.
Marine pathways
Paragraph 2
Using habits surveys, the FSA has identified the marine critical group for seafood consumption as a small number of people in the Cumbrian coastal community who are high-rate consumers of fish and shellfish obtained from the Sellafield area between St Bees and Selker.
Consumption and occupancy rates are kept under regular review and are published annually(ref 3). In this report, the consumption rates used by Sellafield Ltd for dose assessment purposes (Appendix A, table A1) are taken from the most recent data provided by FSA for the 5 years 2015-2019 with updated consumption rates for crustaceans and molluscs and occupancy rates from 2019.
In reports published prior to 2005 the consumption of ‘other molluscs’ was equally divided between limpets, mussels and cockles. Since 2005, they are all ascribed to mussels. For the dose assessment, “Other fish” reported by the FSA are assumed to be plaice.
Paragraph 3
The marine critical group is adult members consuming seafood caught locally between St Bees and Selker (table 1).
The estimated critical group dose to adults was about 37 µSv which is less than was estimated in 2018 (43 µSv) and is due to the change in the 5-year rolling average consumption rates between 2018 and 2019.
The annual doses to child, infant and foetal members of the marine critical group are calculated to be 9, 4 and 7 µSv respectively. The adult critical group may also receive doses from other pathways, such as inhalation and consumption of agricultural produce.
An assessment has shown that these would increase the dose by about 1.6 µSv. The doses from the consumption of molluscs are likely to be overestimated because no account has been taken of the effects of food preparation procedures, such as the soaking of winkles to eliminate their gut contents which contain most of the actinide radioactivity (adsorbed onto silt particles).
Doses to typical fish-eating members of the public were, as usual, very low (0.5 µSv). Doses to consumers associated with the Whitehaven fishery remained similar to last year (10 µSv).
Paragraph 4
Figures 1, 2 and 3 show doses to the marine critical group from seafood (for radionuclides contributing the highest proportions of dose) against the consumption rate of these foods.
Consumption of winkles fell between 2009 and 2014 and has since levelled off. This has resulted in a reduction in dose from plutonium-alpha and americium-241, despite stable discharges of these radionuclides and ncentrations in winkles from 2010.
Consumption of mussels increased steadily between the mid 1990s and mid 2000s. Therefore this resulted in an increased dose up to 2006 from plutonium-alpha and americium-241, despite stable discharges and concentrations of these radionuclides in mussels.
Since 2006/7 the dose has fallen sharply due to a combination of reduced consumption and reduced plutonium-alpha concentration in mussels. The consumption of Nephrops has risen steadily since 2011 to a highest 5-year average recorded rate in 2016 of 14.4 kg y-1 (figure 3).
Since then the consumption rate has fallen to lower levels. Currently, the dose contribution from Nephrops is now similar to the dose contributed from the consumption of mussels (table 1).
Paragraph 5
Figure 4 shows the contribution of individual radionuclides to the marine critical group’s dose. Over the last 21 years the main contributors to marine dose have been americium-241, plutonium-alpha and technetium-99.
The decrease in dose in the last decade has largely been caused by a reduction in technetium-99 dose resulting from decreased technetium-99 discharges and, more recently, from reduced consumption of molluscs leading to lower actinide dose.
Paragraph 6
Figure 5 shows the contribution of individual foodstuffs to the marine critical group’s dose. Over the last 21 years the main contributors to marine dose have been from mussels, winkles, Nephrops and lobster. Variations in the proportion of dose from each food reflect changes in both consumption rate and radionuclide concentrations.
In 2017, for the first time, Nephrops contributed a similar but higher dose to the critical group as mussels. Doses to adult, child, infant and foetal members of the critical group, through the consumption of seafood, are summarised in Appendix B, Table B7.
Paragraph 7
The FSA and the EA3,(ref 4) continue to keep under review the amount of time spent by members of the public on inter-tidal areas of the coastline bordering the north-east Irish Sea and more inland locations.
In particular it was assessed that members of the critical group received an external contribution to their radiation exposure from spending up to 818 hours each year on local beaches (Parton to Eskmeals) for 2015-2019.
This additional dose was estimated to be 36 µSv using the 818 hours beach occupancy habit data.
Airborne and terrestrial pathways
Paragraph 8
For some years Sellafield Ltd has used consumption rates obtained from the approach used by PHE5, whereby dose assessments are carried out to establish which foodstuffs contribute the maximum dose at higher critical group consumption rates.
Using this process, the 2 food groups identified as making the highest contribution to dose are assigned critical group (higher) consumption rates.
The remainder are assigned national mean consumption rates.
The 2 food groups assigned at critical group rates in recent years have been:
- milk and root vegetables in 2014
- beef and root vegetables in 2015
- domestic fruit and potatoes in 2016
- beef and domestic fruit in 2017, 2018
For 2019 these 2 food groups are domestic fruit and lamb (Appendix B, table B8). The consumption rates used for 2019 are summarised in Appendix A, table A2.
In addition to changes in food consumption rates, Sellafield Ltd has adopted the generic advice of PHE on parameters relating to external radiation pathways (Appendix A, table A3)6,7.
Since 2006, the dose from terrestrial foodstuffs has been based only on the foods sampled by Sellafield Ltd and FSA in that year. In the dose assessment reported here, where 2019 data were not collected, the most recent data available were used.
Paragraph 9
The doses from ruthenium-106 in all terrestrial foodstuffs and iodine-131 in milk, (shown in Appendix B table 9), are assessed using standard modelling techniques(ref 6,8,9) (as used by PHE and others) which are based on knowledge of the transfer of these radionuclides through the food chain.
This is considered to be more realistic than using the limits of detection from the radiochemical analysis. Modelled concentrations of ruthenium-106 in terrestrial foodstuffs and iodine-131 in milk are given in Appendix B, table 11.
Paragraph 10
Based on the average concentrations of radioactivity reported in air and in terrestrial foodstuffs (Monitoring chapter, tables 8 to 12), adults would have received an estimated dose of 4.6 µSv (3.9, 3.6 and 3.4 µSv for children, infants and foetuses) from all terrestrial foodstuffs and 0.62 µSv (0.34, 0.18 and 0.01 µSv for children, infants and foetuses) from inhalation.
The higher dose contributions to adults were 1.1 µSv from domestic fruit and 1.0 µSv from lamb (table 2). Detailed data are provided in Appendix B table B9 and summarised in tables 2, 3 and 4. Doses assessed as being less than 0.001 µSv have been presented as “<0.001”.
Paragraph 11
Figure 6 and Appendix B, table B9 show that between 1999 and 2013, the main radionuclides contributing to doses from consumption and inhalation are strontium-90, iodine-129 and caesium-137 (all dominated by consumption).
This is still the case for 2015 to 2019 and additions to this group are plutonium-alpha and americium-241. This is a direct result of the critical group member of interest changing from infant (1999 – 2013) to adult (2014 – present).
Doses from strontium-90, caesium-137, plutonium- alpha and americium-241 are dominated by pre-1980 discharges, the testing of nuclear weapons in the 1960s and (for caesium-137) the Chernobyl accident in 1986.
The relative proportions of radionuclides in recent years can largely be explained by changes in reprocessing rates and improvements in the analytical limits of detection.
Paragraph 12
Figure 7 shows the contribution of individual foodstuffs to the terrestrial critical group’s dose. Between 2002 and 2013 the highest critical group dose was estimated to be received by infants and hence the terrestrial dose was dominated by milk consumption. In 2015 to 2019, the highest terrestrial critical group dose was estimated to be received by adults.
This change has been a consequence of the reduction in dose received by infants from milk consumption and the increased dose received by adults from direct radiation (paragraph 16). In figure 7, the domestic fruit contribution is contained within the green ‘Other foodstuffs’ sections.
Paragraph 13
Members of the terrestrial critical group also received a dose of up to 2.1 µSv, arising from marine pathways. This dose contained an external component (up to 1.6 µSv) from radioactivity deposited on local beaches, based on an average beach occupancy of terrestrial practices published by the EA and FSA of 47 hours, and an internal component (0.5, 0.1, 0.06, 0.4 µSv respectively to adults, children, infants and foetuses) from an assumed consumption of locally caught fish (table 3 and in more detail in Appendix B, table B10). It is the external dose component for adults in 2019 that maintains the terrestrial critical group member being adult since 2014.
Paragraph 14
In addition to exposure from the consumption of local produce, the critical group also receives exposure from immersion in a plume containing krypton-85 discharged from the reprocessing plants.
The doses in 2019 to adults, children, infants and foetuses living near to Sellafield would have been respectively 0.05, 0.004, 0.04 and 0.05 µSv using modelling and dosimetry data published by the EU and the ICRP8,9 (table 3).
Paragraph 15
The doses to the terrestrial critical group are summarised in table 3. If all the above pathways are considered to be additive, the highest 2019 dose, of 7.4 µSv, was to adults.
The dose to child, infant and foetus were lower at 5.2, 3.9 and 5.5 µSv respectively. The changes to the dose assessment methodology (paragraph 1) are the reason that the terrestrial doses reported after 2005 increased.
These doses however are considerably lower than in earlier years when the Calder Hall reactors were operational. The reduction in dose from 2008 to 2013 (in infants) is a consequence of changes in farming practice, with those farms closest to the Sellafield site ceasing milk production.
Between 2013 and 2014 there is an increase in dose received by the critical group as the members changed from infants to adults. The direct radiation contribution is more evident for adults than infants (figure 7).
5.2 Direct radiation
Paragraph 16
Members of the terrestrial critical group are also exposed to direct radiation. Due to the closure of Calder Hall in March 2003 (Monitoring: paragraph 21), direct radiation doses to local residents have reduced significantly.
There was a change in methodology from recent years in the habit assumptions made in 2019. The upper bound of the dose range to adults living closest to the site has been assessed to be 3.2 µSv.
5.3 Collective doses
Paragraph 17
Collective doses resulting from the effects of discharges from Sellafield in 2019, integrated over 500 years, have been calculated in accordance with paragraphs 18 to 21 of Appendix A and Introduction paragraph 24.
The results (table 5) give collective dose commitments (combined aerial and marine) of about 1.0 manSv to the UK population, 3.3 manSv to the European population (including the UK) and 25 manSv to the world population.
Paragraph 18
Most of the collective dose commitment from Sellafield discharges results from carbon-14 because of its long radioactive half-life (5730 years) and its incorporation into the global carbon cycle.
However, concentrations of carbon-14 in the atmosphere which are attributable to Sellafield are indistinguishable from naturally occurring background concentrations at distance from the site.
The natural background results in collective doses that are many orders of magnitude higher than the doses resulting from Sellafield’s discharges. This reflects the fact that natural sources of radiation constitute the largest source of public radiation exposure on a national or global scale10.
5.4 Dose summary
Paragraph 19
The estimated dose in 2019 due to discharges to sea from Sellafield to members of the critical group who consume fish and shellfish from the local area was about 37 µSv (table 1).
Taking into account doses due to beach occupancy and aerial pathways, the total dose to this group was about 75 µSv, lower than in 2018.
Consideration of terrestrial exposure routes shows that doses due to direct radiation from plants on site were estimated as being 3.2 µSv to the most exposed members of the public who live nearby. This is lower than 2018.
This group may, in addition, have received up to 7.4 µSv from aerial discharge pathways.
5.5 Radiological impact perspective
Paragraph 20
In their most recent review of ionising radiation exposure to the UK population (ref 11), PHE provided information relating to the dose received due to cosmic radiation from return flights to popular global destinations from the UK.
Typically a return flight time of 2.5 hours, e.g. a return flight to Paris, provides an exposure of 10 µSv, comparable to the annual dose received by a terrestrial critical group member in the vicinity of Sellafield from authorised discharges.
A return flight of 24 hours, e.g. to Cape Town or Tokyo, provides an exposure of 100 µSv, similar to the annual dose received by a marine critical group member.
Paragraph 21
There are other typical practices in the UK that result in ionising radiation exposure similar to the rates above. A typical individual dose of 80 µSv is received through the use of conventional radiology (including dental examinations)(ref 11).
Paragraph 22
Such comparisons provide an interesting perspective in that some routine activities of the UK public (e.g. flying abroad on holidays, receiving medical and dental x-rays), result in as much ionising radiation exposure to that received by the marine and terrestrial critical group members in the vicinity of the Sellafield site in 2019.
5.6 References
- Allott R (2005) Principles for the assessment of total retrospective public doses, NDAWG/2/2005. Environment Agency, Food Standards Agency, NRPB, NII, Chilton
- NDAWG Paper 11-03 (2007) Use of measurements in determining retrospective dose assessments in RIFE
- Moore K J, Greenhill B J and Clyne F J (2018). Radiological habits survey: Sellafield review, 2018. Environment Report RL08/18. Cefas, Lowestoft (under contract to the EA and the FSA).
- Environment Agency, Food Standards Agency, Food Standards Scotland, Natural Resources Wales, Northern Ireland Environment Agency and Scottish Environment Protection Agency (2020). Radioactivity in food and the environment, 2019. RIFE-25. EA, FSA, FSS, NRW, NIEA and SEPA; Preston, London, Aberdeen, Cardiff, Belfast and Stirling.
- Byrom J, Robinson CA, Simmonds JR, Walters B and Taylor RR (1995). Food consumption rates for use in generalised radiological dose assessments. J. Radiol. Prot. 15(4): 335-342.
- Cabianca T, Fayers CA, Mayall A, Robinson CA and Simmonds JR (1995). Peer review of BNFL radiological assessment methodologies. NRPB Report M815.
- Smith KR and Jones AL (2003). Generalised habit data for radiological assessments. NRPB Report W41.
- Simmonds JR et al. (1995). Methodology for assessing the consequences of routine releases to the environment. EUR 15760. Office for the Publication of the European Communities.
- International Commission on Radiological Protection (1996). Age-dependent doses to members of the public from intakes of radionuclides: Part 5. Compilation of ingestion and inhalation dose coefficients. ICRP Publication 72. Ann. ICRP 26 (1).
- Watson SJ, Jones AL, Oatway WB and Hughes JS (2005). Ionising radiation exposure of the UK population: 2005 Review. Health Protection Agency Report HPA- RPD-001, HMSO, London. 11 Oatway, W B, Jones, A L, Holmes, S, Watson, S and Cabianca, T (2016). Ionising radiation exposure of the UK population: 2010 review. Public Health England Report PHE-CRCE-026, Crown Copyright.
Table 1 - Summary of adult doses associated with marine discharges (µSv), 2019
| Radionuclide | Cod a | Plaice | Lobster | Crab | Nephrops | Winkles | Mussels | Total for radionuclide |
|---|---|---|---|---|---|---|---|---|
| Carbon-14 | - | 1.3 | 0.34 | 0.24 | 0.29 | 0.33 | 0.24 | 2.7 |
| Cobalt-60 | - | - | - | - | - | 0.01 | 0.003 | 0.01 |
| Strontium-90 | - | - | - | 0.01 | - | 0.25 | 0.06 | 0.32 |
| Technetium-99 | - | 0.05 | 0.62 | 0.04 | 0.27 | 0.21 | 0.09 | 1.3 |
| Ruthenium-106 | - | 0.04 | - | 0.06 | - | 0.07 | 0.06 | 0.23 |
| Antimony-125 | - | - | - | - | - | 0.002 | 0.001 | 0.003 |
| Iodine-129 | - | - | 0.41 | - | - | 0.10 | - | 0.52 |
| Caesium-137 | - | 0.69 | 0.13 | 0.06 | 0.13 | 0.27 | 0.06 | 1.3 |
| Neptunium-237 | - | - | - | - | - | 0.006 | - | 0.006 |
| Plutonium-alpha | - | 0.06 | 0.33 | 0.37 | 2.2 | 4.2 | 2.8 | 10 |
| Plutonium-241 | - | - | - | - | - | 0.28 | 0.23 | 0.51 |
| Americium-241 | - | 0.10 | 2.1 | 0.83 | 6.8 | 5.8 | 4.2 | 20 |
| Curium-alpha | - | - | - | - | - | 0.07 | - | 0.07 |
| Total for species | 0.00 | 2.2 | 3.9 | 1.6 | 9.7 | 12 | 7.8 | 37 |
| Total for group | 37 | 37 |
a. No cod landed during 2019.
Table 2 - Summary of adult doses associated with aerial discharges (µSv), 2019
| Radionuclide | Milk | Beef Muscle | Beef Offal | Sheep Muscle | Sheep Offal | Poultry | Eggs | Game | Honey | Mushroom | Potato | Root Vegetables | Green Vegetables | Domestic Fruit | Wild Fruit | Legumes | Drinking Water | Inhalation | Total for radionuclide |
|---|---|---|---|---|---|---|---|---|---|---|---|---|---|---|---|---|---|---|---|
| Total tritium | 0.01 | 0.01 | <0.001 | 0.003 | <0.001 | - | 0.002 | 0.002 | - | <0.001 | 0.009 | <0.001 | 0.001 | 0.01 | 0.001 | 0.002 | 0.10 | - | 0.15 |
| Carbon-14 | 0.03 | - | 0.003 | - | - | - | - | 0.04 | 0.01 | 0.01 | 0.02 | 0.02 | 0.05 | 0.36 | 0.05 | - | - | - | 0.59 |
| Cobalt-60 | - | 0.002 | <0.001 | 0.004 | <0.001 | 0.002 | 0.001 | 0.001 | <0.001 | <0.001 | 0.01 | 0.002 | 0.004 | 0.03 | 0.002 | 0.004 | - | - | 0.07 |
| Strontium-90 | 0.09 | 0.01 | 0.002 | 0.02 | 0.002 | 0.02 | 0.01 | 0.007 | 0.003 | 0.003 | 0.05 | 0.02 | 0.05 | 0.22 | 0.01 | 0.20 | 0.04 | 0.002 | 0.76 |
| Technetium-99 | - | <0.001 | <0.001 | <0.001 | <0.001 | 0.001 | - | <0.001 | - | - | 0.001 | <0.001 | - | 0.003 | - | - | - | - | 0.01 |
| Ruthenium-106 | <0.001 | <0.001 | <0.001 | <0.001 | <0.001 | <0.001 | <0.001 | <0.001 | <0.001 | <0.001 | <0.001 | <0.001 | <0.001 | <0.001 | <0.001 | <0.001 | - | 0.01 | 0.03 |
| Antimony -125 | 0.01 | 0.001 | <0.001 | 0.003 | <0.001 | 0.001 | <0.001 | <0.001 | <0.001 | <0.001 | 0.006 | 0.001 | 0.002 | 0.02 | <0.001 | 0.002 | - | <0.001 | 0.05 |
| Iodine-129 | 0.10 | 0.03 | 0.006 | 0.006 | 0.006 | 0.07 | 0.02 | 0.008 | 0.006 | 0.007 | 0.11 | 0.02 | 0.05 | 0.25 | 0.03 | 0.13 | - | - | 0.90 |
| Iodine-131 | 0.001 | <0.001 | <0.001 | <0.001 | <0.001 | <0.001 | <0.001 | <0.001 | <0.001 | <0.001 | <0.001 | <0.001 | <0.001 | <0.001 | <0.001 | <0.001 | - | - | 0.02 |
| Caesium-134 | - | 0.01 | 0.004 | 0.020 | 0.002 | 0.01 | 0.01 | 0.005 | 0.001 | 0.002 | 0.04 | 0.01 | 0.02 | 0.09 | 0.007 | 0.02 | - | <0.001 | 0.25 |
| Caesium-137 | 0.05 | 0.09 | 0.01 | 0.88 | 0.04 | 0.01 | 0.007 | 0.13 | 0.002 | 0.003 | 0.05 | 0.009 | 0.01 | 0.11 | 0.01 | 0.02 | 0.04 | <0.001 | 1.5 |
| Plutonium-alpha | - | 0.001 | 0.009 | 0.002 | 0.002 | 0.002 | <0.001 | <0.001 | <0.001 | <0.001 | - | <0.001 | <0.001 | 0.01 | 0.010 | 0.002 | 0.18 | 0.21 | 0.43 |
| Plutonium-241 | - | - | 0.004 | - | - | - | - | - | - | - | - | - | - | - | 0.01 | - | - | 0.18 | 0.19 |
| Americium-241 | - | 0.003 | 0.02 | 0.002 | 0.002 | <0.001 | <0.001 | <0.001 | <0.001 | <0.001 | - | <0.001 | <0.001 | 0.02 | 0.01 | 0.003 | <0.001 | 0.21 | 0.28 |
| Total for item | 0.29 | 0.16 | 0.06 | 1.0 | 0.06 | 0.12 | 0.05 | 0.20 | 0.03 | 0.03 | 0.30 | 0.09 | 0.19 | 1.1 | 0.14 | 0.39 | 0.36 | 0.62 | 5.2 |
| Total for group | 5.2 |
Table 3 - Summary of doses to the terrestrial critical group (µSv), 2019
| Pathway | Adult | Child | Infant | Foetus |
|---|---|---|---|---|
| Food consumption: | ||||
| terrestrial foods | 4.6 | 3.9 | 3.6 | 3.4 |
| marine foods | 0.48 | 0.12 | 0.06 | 0.44 |
| Inhalation: | 0.62 | 0.34 | 0.18 | 0.01 |
| mmersion: | ||||
| Krypton-85 | 0.05 | 0.04 | 0.04 | 0.05 |
| External | 1.6 | 0.81 | 0.05 | 1.6 |
| Total | 7.4 | 5.2 | 3.9 | 5.5 |
Table 4 - Critical group doses from operations at Sellafield (µSv)
| Pathway | 2018 | 2019 |
|---|---|---|
| Marine critical group (adults) | ||
| seafood consumption | 43 | 37 |
| aerial pathways | 1.7 | 1.6 |
| external radiation from beach occupancy (marine) | 44 | 36 |
| Total dose to marine critical group (adults) | 89 | 75 |
| Terrestrial critical group (adults) | ||
| inhalation | 0.68 | 0.62 |
| immersion | 0.24 | 0.05 |
| external radiation from beach occupancy (terrestrial) | 2.3 | 1.6 |
| terrestrial foodstuff consumption | 4.4 | 4.6 |
| marine foodstuff consumption | 0.90 | 0.48 |
| direct radiation | 3.9 | 3.2 |
| Total dose to terrestrial critical group (adults) | 12 | 11 |
Table 5. Collective doses from Sellafield’s discharges, 2019
Collective Dose (manSv)
| Radionuclide | Aerial Discharges | Marine Discharges | ||||
|---|---|---|---|---|---|---|
| UK | Europe | World | UK | Europe | World | |
| Tritium | 0.04 | 0.07 | 0.09 | 0.0002 | 0.0008 | 0.01 |
| Carbon-14 | 0.05 | 0.25 | 3.1 | 0.56 | 1.8 | 19 |
| Krypton-85 | 0.03 | 0.12 | 2.0 | - | - | - |
| Technetium-99 | - | - | - | 0.002 | 0.007 | 0.009 |
| Iodine-129 | 0.14 | 0.67 | 0.94 | 0.0009 | 0.003 | 0.01 |
| Caesium-137 | 0.0009 | 0.003 | 0.003 | 0.03 | 0.07 | 0.12 |
| Plutonium-alpha | 0.09 | 0.01 | 0.01 | 0.03 | 0.09 | 0.11 |
| Americium-241 | 0.002 | 0.002 | 0.002 | 0.02 | 0.05 | 0.06 |
| Other nuclides | 0.0008 | 0.001 | 0.001 | 0.05 | 0.13 | 0.15 |
| Total | 0.28 | 1.1 | 6.2 | 0.69 | 2.2 | 19 |
Figure 1 - Dose to marine critical group from Pu-alpha and Am-241 in winkles and consumption rate
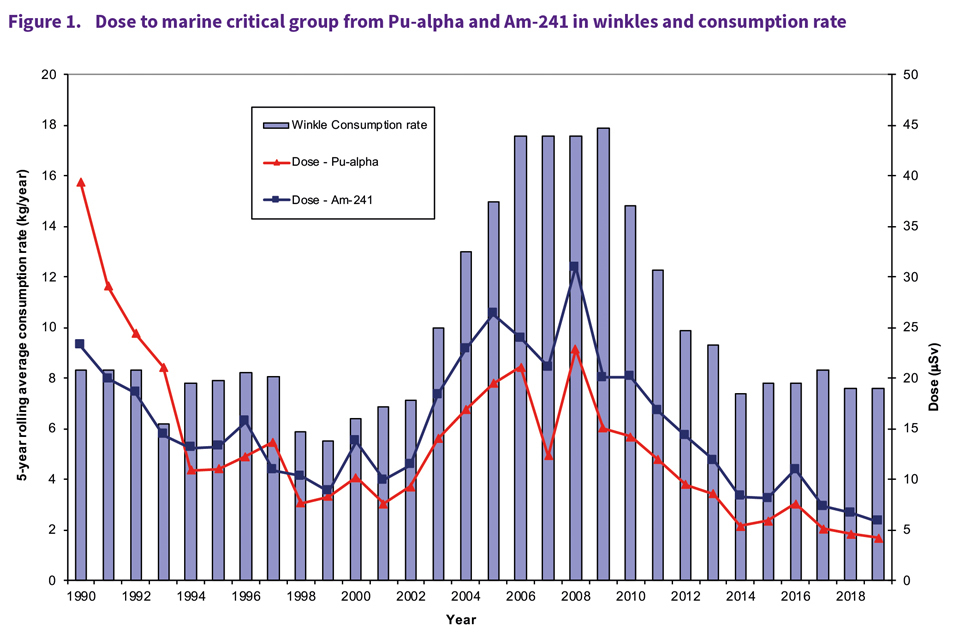
Figure 1. Dose to marine critical group from Pu-alpha and Am-241 in winkles and consumption rate
Figure 2 - Dose to marine critical group from Pu-alpha and Am-241 in mussels and consumption rate
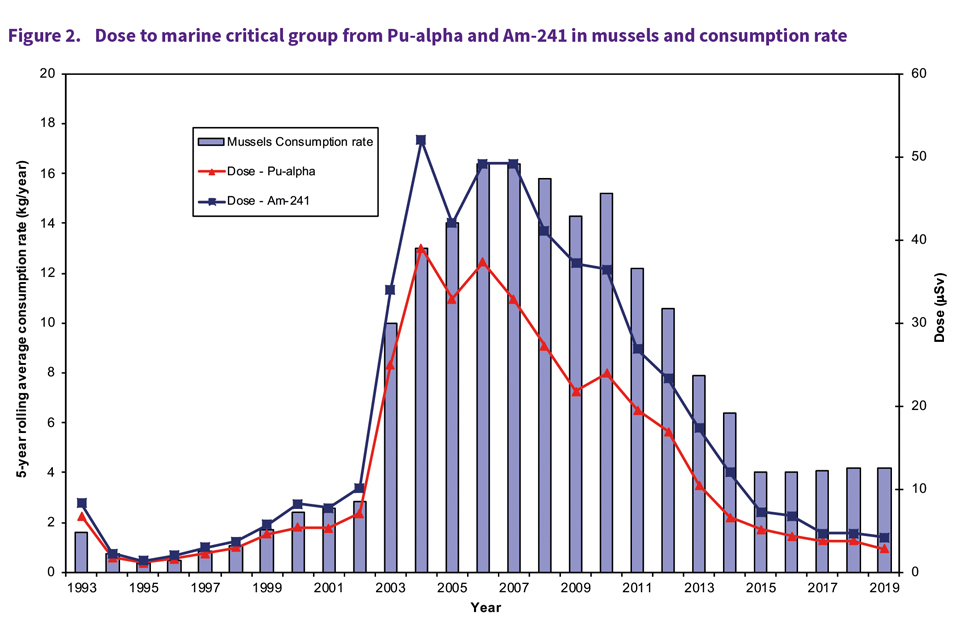
Figure 2. Does of marine critical group from Pu-alpha and Am-241 in mussels and consumption rate
Figure 3 - Dose to marine critical group from Pu-alpha and Am-241 in Nephrops and consumption rate
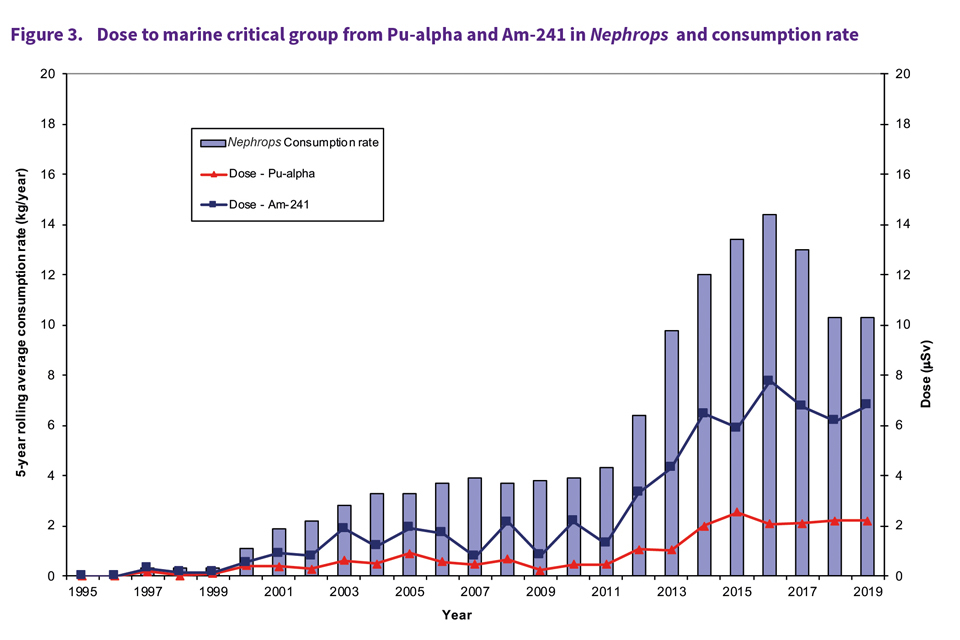
Figure 3. Dose to marine critical group from Pu-alpha and Am-241 in Nephrops and consumption rate
Figure 4 - Marine Critical Group Dose (Adult) (Consumption pathways) by Radionuclide
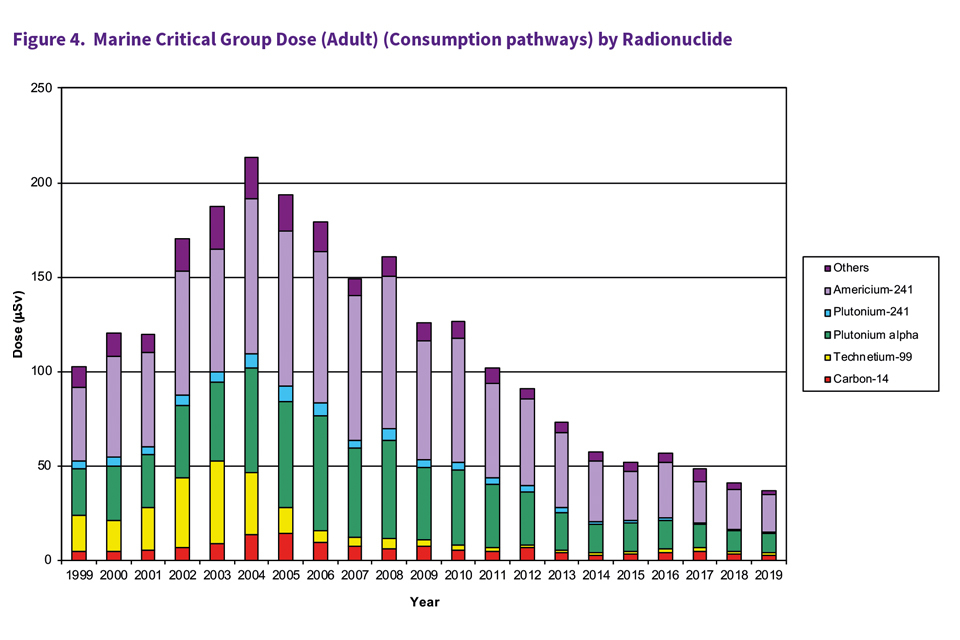
Figure 4. Marine critical group dose (adult) (consumptions pathways) by Radionuclide
Figure 5 - Marine Critical Group Dose (Adult) by Pathways
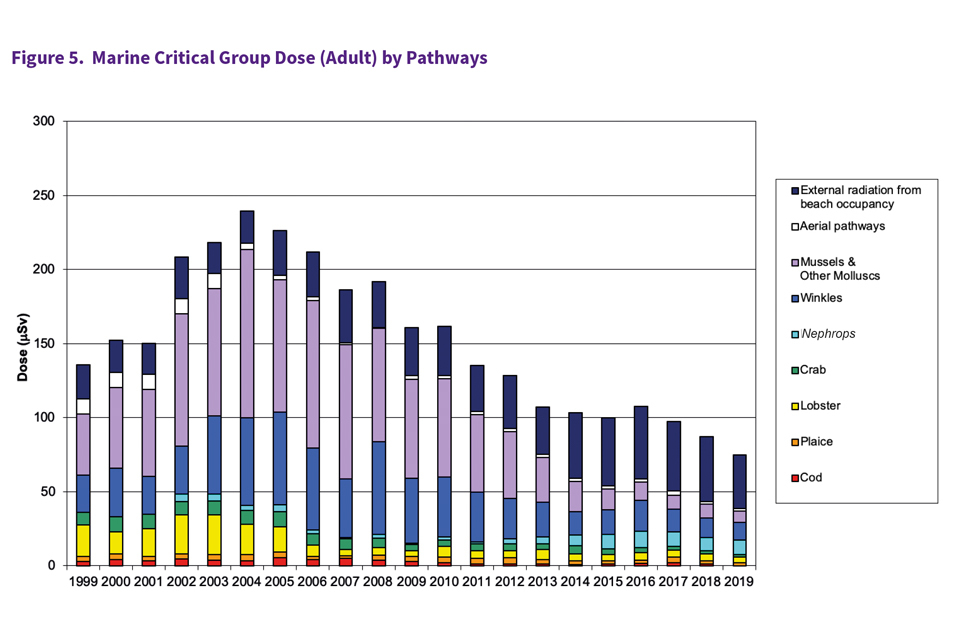
Figure 5. Marine critical group dose (adult) by pathways
Figure 6 - Terrestrial Critical Group Dose (Consumption pathways) by Radionuclide
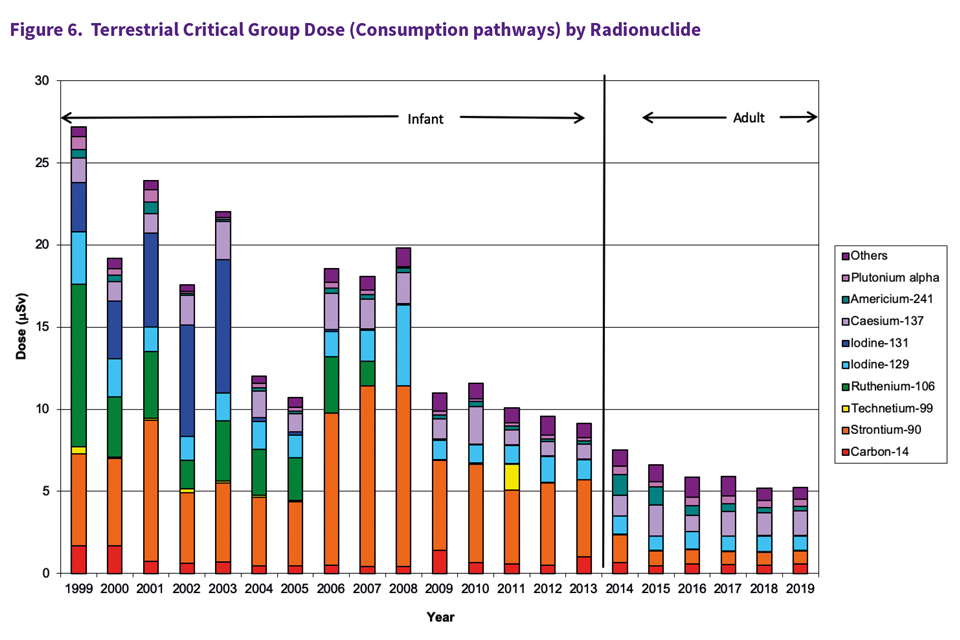
Figure 6. Terrestrial critical group dose (consumption pathways) by Radionuclide
Figure 7 - Terrestrial Critical Group by Pathways
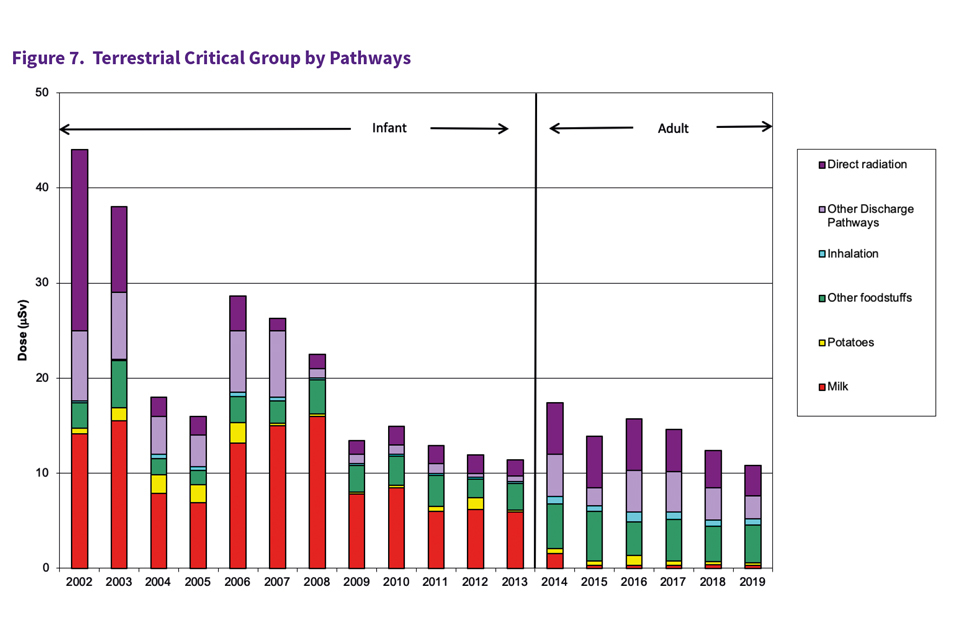
Figure 7. Terrestrial critical group by pathways
6. Beach monitoring
Paragraph 1
Monitoring of beaches has been part of the routine environmental monitoring programme at Sellafield since 1983. In 2003, during a routine survey, a radioactive particle was found which prompted a review of beach monitoring.
Following agreement with the Environment Agency an intensive programme of beach monitoring commenced in 2006 using a vehicle mounted array of radiation detectors.
Paragraph 2
The monitoring programme is determined by taking account of the find rates in previous years and the occupancy information for each beach.
The programme is reviewed annually to ensure it represents the Best Available Technique (BAT) with its scope and extent being agreed with the Environment Agency1,(ref 2). The Nuvia Ltd. Groundhog Synergy2 system is currently used for particle detection on the beaches.
It has an array of five 76 x 400 mm sodium iodide (NaI) detectors for the detection of beta rich and other radionuclide items and an additional 8 Field Instrument for the Detection of Low Energy Radiation (FIDLER) detectors for the enhanced detection of americium-241.
The detection system is mounted in a carbon fibre casing with thin windows beneath the detectors to improve the transmission of beta radiation and to further improve detection of strontium-90 and its daughter product yttrium-90.
Paragraph 3
The results from the monitoring programme have been used by Public Health England (PHE) to determine the risks to members of the public that are either high consumers of locally caught seafood or spend time on activities that might potentially bring them into contact with the types of finds being recovered from the coastal environment around the Sellafield site(ref 3,4).
The EA have published an Intervention Plan5 that takes account of the PHE risk assessment conclusions and explains how the different organisations will work together to:
- protect the public and environment from any harm caused by radioactive objects on west Cumbrian beaches
- respond to a discovery of radioactive objects near the Sellafield site – a single find or an overall change in the find rate, activity or trends
Paragraph 4
The reader is directed to the comprehensive Sellafield Ltd Particles in the Environment, Annual Report and Forward Programme series of reports for a more detailed history and analysis of the work undertaken to understand the background and processes behind the current monitoring programme (ref 6).
6.1 Monitoring
Paragraph 5
In 2019, a total area of 157 hectares (ha) of Cumbrian beaches was surveyed meeting the programme’s specification (table 1).
This identified 119 radioactive items, of which 113 were classified as particles (less than 2 mm in size) and 6 as larger objects (greater than 2 mm in size) (table 2).
A total of 108 of the finds were designated alpha rich, with higher americium-241 activity than caesium-137 activity and 11 were designated as beta rich, where caesium-137 was the major radionuclide.
All of the larger objects were designated beta rich. As observed previously, the majority of finds were recovered from Sellafield beach (71%). Further details of the numbers of radioactive items found are given in table 3.
Paragraph 6
The distributions of caesium-137 and americium-241 activities for particles recovered in 2019 were within the range observed since the programme began in 2006 and were comparable to the activity distribution for 2015 - 2018, shown in figure 1.
This provides reassurance that they are part of the same general population and are within the range of activities that were considered in the PHE health risk assessment.
Paragraph 7
None of the particles or larger objects that were recovered during 2019 exceeded the characterisation criteria specified by the EA5 and therefore there was no requirement for further laboratory analysis.
Paragraph 8
The find rates in 2019 were consistent with those used in the latest PHE risk assessment(ref 3,4). These rates did not trigger the EA intervention criteria(ref 5).
Paragraph 9
PHE has advised the EA on the particle risks associated with using the beaches around Sellafield. The current advice is reproduced below (ref 4) “we concluded that the risks from radioactive objects in the environment near to the Sellafield site are very low, and we advise that measures to control those risks to protect the public’s health are not needed.”
Paragraph 10
The beach monitoring programme shown in table 4 will be implemented in 2020. This has been agreed following consultation with key stakeholders including the EA, PHE, Food Standards Agency (FSA), West Cumbria Site Stakeholder Group (WCSSG) and the Department of Health and Social Care Committee on Medical Aspects of Radiation in the Environment (COMARE).
6.2 References
- Sellafield Ltd, BAT assessment for monitoring particles in the environment. June 2014, SSEM/2014/22, Nuclear Decommissioning Authority.
- Sellafield Ltd, BAT Assessment of Monitoring for Particles in the Environment, SSEM/2017/29, Nuclear Decommissioning Authority.
- Oatway, W. & Brown, J., 2015. Supporting document: Parameter values for PHE assessment of health risks to seafood consumers. Note for environment agency, Public Health England, CRCE-RA-2-2015.
- Oatway, W. & Brown, J., 2015. Health risk to seafood consumers from radioactive particles in the marine environment near Sellafield, PHE-CRCE-021, Public Health England.
- Environment Agency, 2017. Sellafield radioactive objects intervention plan: available online at https://www.gov. uk/government/publications/sellafield-radioactive- objects-intervention-plan, Penrith: Environment Agency.
- Sellafield Ltd, 2018. Particles in the Environment, Annual Report for 2018 and Forward Programme, EM/2019/15, June 2019, Nuclear Decommissioning Authority.
Table 1 - Beach monitoring conducted during 2019
| Programme | Planned Monitoring | Area monitored (ha) |
|---|---|---|
| Sellafield | 80 | 81 |
| Northern Beaches | 40 | 42 |
| Southern Beaches | 20 | 25 |
| Allonby | 10 | 10 |
| Total | 150 | 157 |
Table 2 - Particle and larger object beach finds recovered during 2019
| No. of particles foundᵃ | No. of larger objects foundᵇ | ||||||
|---|---|---|---|---|---|---|---|
| Programme | Alpha richᶜ | Beta richᵈ | Otherᵉ | Alpha rich | Beta rich | Other | Total finds |
| Sellafield | 74 | 5 | 0 | 0 | 6 | 0 | 85 |
| Northern Beaches | 31 | 0 | 0 | 0 | 0 | 0 | 31 |
| Southern Beaches | 2 | 0 | 0 | 0 | 0 | 0 | 2 |
| Allonby | 1 | 0 | 0 | 0 | 0 | 0 | 1 |
| Total | 108 | 5 | 0 | 0 | 6 | 0 | 119 |
a. Particles (less than 2 mm in size).
b. Larger objects (greater than 2 mm in size).
c. Alpha rich, higher americium-241 activity than caesium-137 activity d Beta rich, where caesium-137 was the major radionuclide.
e. Other, principal radionuclide is neither americium-241 activity or caesium-137, for example cobalt-60.
Table 3 - Total area monitored and finds by category, beach and calendar year (2015 - 2019)
| Beach | Year | Area (ha) | Alpha rich particle | Beta rich particle | Beta rich Larger Object | Other Finds |
| Sellafield | 2015 | 80 | 198 | 22 | 38 | 0 |
| 2016 | 82 | 117 | 19 | 67 | 0 | |
| 2017 | 80 | 114 | 24 | 34 | 0 | |
| 2018 | 81 | 88 | 6 | 17 | 0 | |
| 2019 | 81 | 74 | 5 | 6 | 0 | |
| Northern Beaches | 2015 | 41 | 51 | 2 | 0 | 0 |
| 2016 | 47 | 51 | 0 | 0 | 1a | |
| 2017 | 44 | 43 | 0 | 0 | 0 | |
| 2018 | 44 | 22 | 1 | 0 | 0 | |
| 2019 | 42 | 31 | 0 | 0 | 0 | |
| Southern Beaches | 2015 | 20 | 8 | 0 | 0 | 0 |
| 2016 | 29 | 3 | 0 | 0 | 0 | |
| 2017 | 23 | 9 | 0 | 0 | 0 | |
| 2018 | 25 | 10 | 0 | 0 | 0 | |
| 2019 | 25 | 2 | 0 | 0 | 0 | |
| Allonby | 2015 | 13 | 0 | 0 | 0 | 0 |
| 2016 | 11 | 0 | 0 | 0 | 0 | |
| 2017 | 5 | 1 | 0 | 1 | 0 | |
| 2018 | 10 | 1 | 0 | 0 | 0 | |
| 2019 | 10 | 1 | 0 | 0 | 0 |
a. ‘Other Finds’ was a cobalt-60 rich particle.
Table 4 - Beach monitoring programme for 2020
| Programme | Planned Monitoring |
|---|---|
| Sellafield | 52 |
| Northern Beaches | 32 |
| Southern Beaches | 16 |
| Allonby | 5 |
| Total | 105 |
Figure 1 - Radioactivity of finds classified as alpha-rich particles (upper) and beta rich particles (lower) between 2015 – 2018 (shown in blue) compared to data from 2019 shown in red)
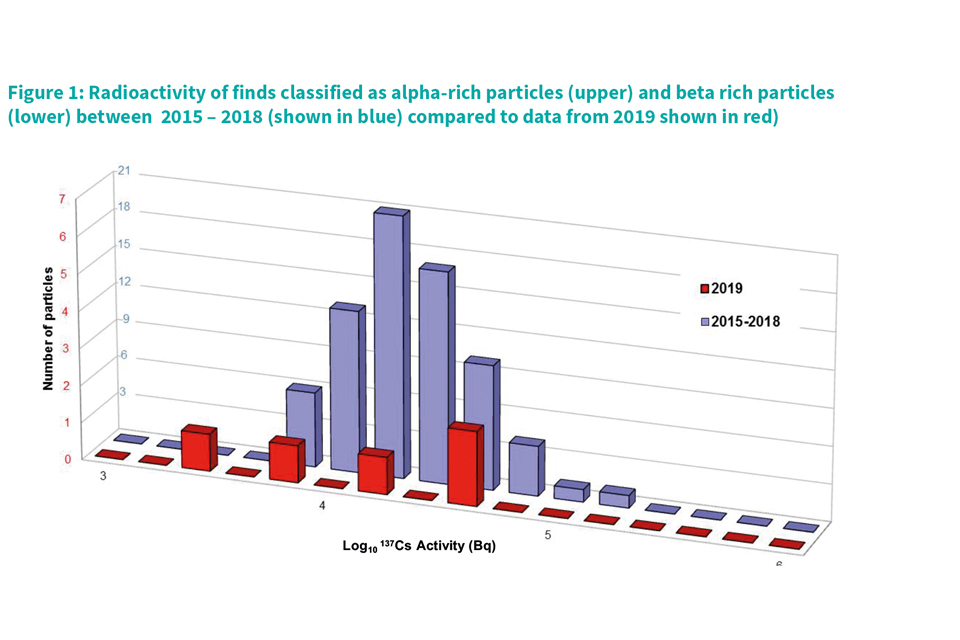
Figure 1. Radioactivity of finds classified as alpha-rich particles (upper) and beta rich particles (lower) between 2015-2018 (shown in blue) compared to data from 2019 shown in red.
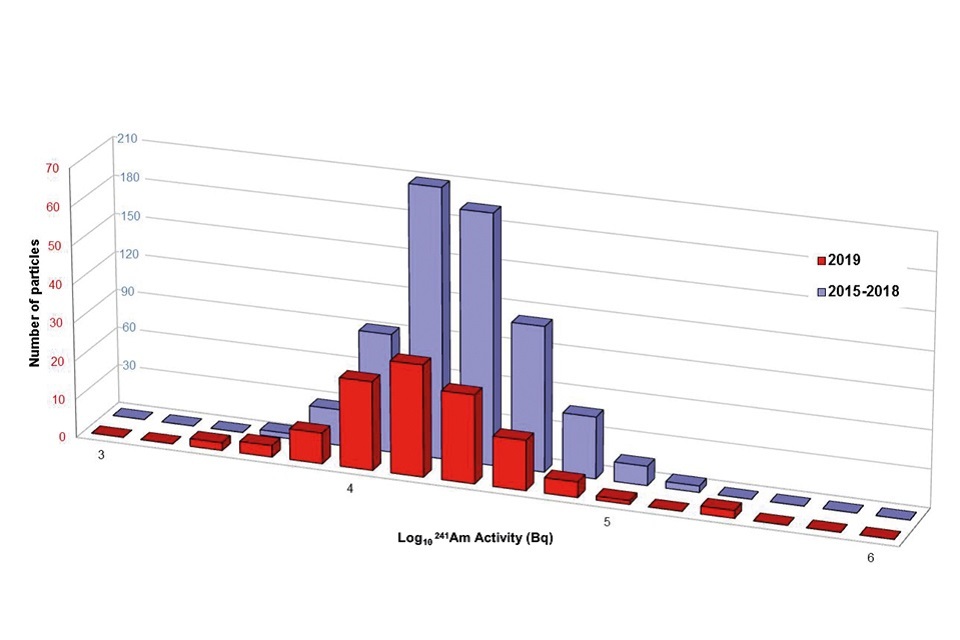
Figure 1: Radioactivity of finds classified as alpha-rich particles (upper) and beta rich particles (lower) between 2015 – 2018 (shown in blue) compared to data from 2019 shown in red) 2nd graph
7. Groundwater monitoring
Paragraph 1
During the industrial history of the Sellafield site, there has been radioactive contamination of soils and groundwater.
A programme of contaminated land and groundwater management has been performed since the late 1970s at and around the site to ensure protection of the Sellafield site work force, the public and the environment.
Paragraph 2.
This section describes the status of the Sellafield Ltd groundwater monitoring programme carried out in the calendar year 2019.
The purpose of this review is to evaluate analytical data for groundwater and identify any significant year on year changes in quality, both underlying and in the vicinity of the Sellafield site.
7.1 Geology and hydrogeology
Paragraph 3
The geology beneath the Sellafield site is Triassic sandstone bedrock covered with more recent glacial deposits of sand, gravel, clay and silts (referred to as drift).
Figure 1 shows a schematic representation that broadly describes the geology and hydrogeology at Sellafield site.
Paragraph 4
The source of regional and local groundwater is mainly rainfall and surface water from rivers, streams, lakes and tarns that enter the ground. The water consolidates into laterally continuous aquifers within porous geological material subsurface.
Paragraph 5
In the Sellafield area there is the upper aquifer in the drift and the main, regional aquifer in the sandstone. The upper surface of an aquifer approximately follows the land contours, with the direction of groundwater flow passing from recharge areas at higher elevations toward discharge areas at lower elevations.
Paragraph 6
In general the groundwater flows from the Cumbrian fells towards the coast in a south-westerly direction. Typical travel times are considered to be between 10 and 20 years from the northern site boundary to the coast, chemical interactions may increase or inhibit these travel times for contaminants.
Paragraph 7
The distribution of groundwater contamination at Sellafield is a complicated superposition of multiple ‘plumes’ which originate from multiple sources on site and are transported to the west and southwest in the direction of groundwater flow.
These ‘plumes’ exist at different depths in the regional water table in different areas of the site. The contamination becomes diluted, and the ‘plumes’ merge together as they migrate and disperse slowly down-gradient.
Paragraph 8
The principal radionuclides that comprise the migrating contamination are the most mobile with a sufficiently slow decay rate e.g., tritium, technetium-99 and, the slightly less mobile, strontium-90.
The individual radionuclide components migrate and decay at different rates, therefore, the composition of the ‘plume’ changes both with time and distance from the source.
Other radionuclides are assumed to be strongly bound to sediments and be geochemically held up nearer to their source.
Paragraph 9
There is no evidence that there has been significant migration of alpha emitters in groundwater therefore migration may be assumed to be very slow or highly retarded.
Paragraph 10
The groundwater monitoring network for 2019 included 222 sample points (figure 2). 650 individual groundwater samples were successfully collected during 2019.
Each groundwater sample was analysed for up to 24 radiological determinands depending on the location and monitoring requirements at each sample point. The results for the principle radionuclides are presented below.
Paragraph 11
There are 15 monitoring wells located around the site perimeter to detect any significant migration of radioactivity in groundwater. These groundwater monitoring wells are shown in figure 3, Terrestrial environmental monitoring at Sellafield.
Table 1 shows the results from these over the last five years have remained consistent.
7.2 Radiological monitoring of groundwater
Paragraph 12
In order to assess general variations in groundwater radionuclide concentrations across site, datasets have been considered at a monitoring well scale, ignoring depth variations where dual piezometers are installed.
Groundwater sample results have been compared against the World Health Organisation (WHO) drinking water guideline levels1 to provide a context for the radionuclide concentrations measured within groundwater.
Average results above WHO drinking water guidelines are indicated by larger diameter points on each figure. WHO drinking water guidelines are used because they define values for a comprehensive list of radionuclides and they are considered to be the most conservative, however it should be noted that these guidelines are not used as compliance targets.
Paragraph 13
Three wells located along the northern perimeter of Sellafield site measure the regional groundwater condition entering the site. Results from monitoring wells situated across Sellafield site are compared against those from the northern perimeter wells to provide an indication of how the groundwater condition changes as it flows through the site.
Assessment shows the results from the down gradient wells on the Sellafield site are in line with, or above, those from the northern perimeter wells.
Total alpha
Paragraph 14
Total alpha screening results are presented in figure 3.
The activity concentrations for total alpha remain similar to previous years’ results. The results show that measured total alpha concentrations in the majority of groundwater samples were below the limit of detection (LOD) of 0.03 Bq l-1.
The WHO drinking water guideline level for total alpha of 0.50 Bq l-1 was exceeded in groundwater samples collected from three monitoring wells, with a maximum annual average result of 49 Bq l-1.
All 3 wells were located within the Separation Area. These wells are adjacent to buildings associated with nuclear fuel reprocessing activities, some of which have had historical incidents of radioactive liquor leakages and/or spills.
7.3 Alpha-emitting radionuclides
Analyses for individual alpha-emitting radionuclides that contribute to the total alpha activity were measured at 23 piezometers across Sellafield site in 2019.
Results show that uranium isotopes (specifically uranium-238 and uranium-234) dominated the total alpha activity measured, with low levels of uranium-235 and uranium-236 found in a small number of wells.
Plutonium isotopes (plutonium-238 and plutonium-239+240) were analysed at three locations and americium-241 at two location.
All plutonium annual average results were below LOD except for one location in Separation Area which had low levels of detectable plutonium. Americium-241 was measured and detected at the same location, however levels were again low.
7.4 Total beta
Paragraph 16
Total beta screening results across the Sellafield site are presented in figure 4. These results indicate the activity concentrations for total beta remain similar to previous years’ results.
Many groundwater monitoring wells had annual average total beta results above the WHO drinking water guideline level of 1.00 Bq l-1.
The majority of samples that exceeded the WHO drinking water guideline values were from monitoring wells located within the Separation Area, with a smaller number located outside of this area to the south and north-west of the Separation Area. Figure 4 shows the highest annual average total beta results in 2019 (maximum annual average result 131,000 Bq l-1) were from wells located in the south-east of the Separation Area, adjacent to buildings associated with legacy waste storage activities.
Significant leaks to ground occurred in this general area in the 1970s.
Paragraph 17
Analyses for the individual beta-emitting radionuclides that contribute to total beta activity found in groundwater samples have been made in selected locations.
These results show that strontium-90 is the dominant beta- emitting radionuclide in groundwater on site and has a similar spatial distribution to total beta activity, figure 5. Fewer results exceeded the WHO drinking water guideline for strontium-90 than total beta.
Tritium
Paragraph 18.
Average tritium concentrations measured during 2019 are presented in figure 6. The activity concentrations for tritium remain similar to previous years’ results.
Tritium concentrations greater than the LOD were measured in monitoring wells both within the Separation Area and in a predominantly south-westerly direction towards the coast. Four monitoring wells had an annual average concentration above the WHO drinking water guideline value (10,000 Bq l-1).
The highest annual average activities were recorded at monitoring wells located in and downgradient from the south-west corner of the Separation Area (highest annual average result 63,000 Bq l-1). Figure 7 shows annual average tritium concentration from 6986p1.
This monitoring well is situated south-west of the Separation Area close to the site boundary. The figure shows a decreasing trend over the last 10 years of annual average concentrations.
Technetium
Paragraph 19
Technetium-99 concentrations measured during 2019 are presented in figure 8. The figure shows technetium-99 activity concentrations remain similar to previous years’ results.
Results show that technetium-99 was detectable at low concentrations in groundwater samples collected across the Separation Area and to the south and West of the Separation Area.
No annual average results exceed the WHO drinking water guideline value of 100 Bq l-1.
The highest technetium-99 concentrations were from monitoring wells located south-west of the Separation Area, with a highest annual average result of 54 Bq l-1.
7.5 Non-radiological monitoring of groundwater
Paragraph 20
The Environmental Permit2 requires that Sellafield Ltd record any changes to the groundwater quality throughout the life of the permit.
The overall aim is to maintain a good groundwater quality status as the environmental protection infrastructure on the site is developed and enhanced.
Environmental Permit monitoring locations are shown in figure 2. Table 2 summarises the average concentration for the Environmental Permit analytes in the non-radiological dataset over the last 5 years.
Paragraph 21
Table 2 shows that the majority of results have remained broadly consistent between 2015 and 2019. All average results were below the Environmental Screening Criteria (ESC) where applicable (there is no ESC for gadolinium) apart from Total Petroleum Hydrocarbons (TPH C6 - C40) (ESC 0.03 mg l-1).
Major ion analysis
Paragraph 22
Determining the ionic composition of groundwater yields information that provides a picture of the hydrogeological and chemical conditions at a particular monitoring well at that specified point in time.
Variation in ionic composition of groundwater occurs naturally due to a number of factors across the Sellafield site.
The primary factors include: the source and chemical composition of recharge water, the lithological properties of the geological unit, the chemical reactions that occur within the geological unit and the residence time of the groundwater.
Paragraph 23
The ionic composition of water samples is used to classify the groundwater into types based on the dominant cations and anions present, a summary of which is shown in figure 9 for groundwater samples collected between April and June 2019.
Paragraph 24
The assessment of groundwater types was based on major ion data (classification based on the ions that make up greater than 95% of the ionic balance of water) and included minor ion data (ions that make up the remaining 5% of the ionic balance of water) where data is available.
Ionic balances were calculated and examined for each groundwater sample as a quality assurance check of the chemical analyses.
As part of this check, samples with an ionic balance greater than 10% were excluded from the dataset. During 2019, eight samples had an ionic balance greater than 10% and so were excluded, which represents 5% of the dataset.
The vast majority of the groundwater can be classified as mixed with bicarbonate, calcium, chloride and sodium being the dominant ions at most locations.
Paragraph 25.
Four locations were mixed as above but also with nitrate. 18 sample locations can be classed as sodium-chloride type and eight locations as calcium-bicarbonate. These results have remained relatively unchanged since 2011.
7.6 References
- WHO (2011). Guidelines for drinking-water quality, fourth edition. World Health Or ganization, Geneva, Switzerland.
- HMSO (2016). The Environmental Permitting (England and Wales) Regulations 2016. Her Majesty’s Stationery Office, London.
Table 1 - Radioactivity in groundwater at Sellafield, 2015-2019 (Bq l-1)
| Borehole number | Total alpha | Total beta | 3H | 90Sr | 99Tc | ||||||||||||||||||||
|---|---|---|---|---|---|---|---|---|---|---|---|---|---|---|---|---|---|---|---|---|---|---|---|---|---|
| 2015 | 2016 | 2017 | 2018 | 2019 | 2015 | 2016 | 2017 | 2018 | 2019 | 2015 | 2016 | 2017 | 2018 | 2019 | 2015 | 2016 | 2017 | 2018 | 2019 | 2015 | 2016 | 2017 | 2018 | 2019 | |
| 6909p1 | <0.03 | <0.02 | <0.02 | 0.02 | <0.02 | <0.23 | <0.24 | <0.25 | <0.25 | <0.26 | 14 | 23 | 15 | 15 | 16 | 0.08 | <0.08 | 0.09 | <0.07 | 0.16 | <0.05 | <0.05 | 0.05 | 0.05 | 0.04 |
| 6960p1 | <0.02 | 0.02 | <0.02 | 0.02 | 0.02 | <0.23 | <0.24 | <0.24 | <0.25 | <0.25 | 9.7 | 7.7 | 6.0 | 5.3 | <5.1 | <0.07 | <0.09 | <0.09 | <0.09 | <0.07 | <0.05 | <0.03 | - | - | - |
| 10007 | <0.02 | <0.01 | <0.01 | 0.01 | <0.42 | <0.24 | <0.24 | 0.25 | <0.24 | <0.25 | <4.8 | <4.2 | <4.8 | 4.9 | 5.1 | <0.06 | - | - | - | - | <0.03 | - | - | - | - |
| 6948p1 | 0.03 | <0.02 | <0.02 | 0.02 | 0.02 | 11 | 7.5 | 11 | 19 | 24 | 15 | 22 | 16 | 20 | 27 | 5.9 | 4.0 | 5.7 | 9.5 | 14 | 0.15 | 0.26 | 0.17 | 0.27 | 0.20 |
| 6979p1 | 0.03 | 0.03 | <0.02 | 0.02 | 0.03 | <0.23 | <0.24 | <0.25 | 0.24 | <0.24 | 15 | 13 | 11 | 13 | 11 | <0.08 | 0.10 | <0.07 | 0.09 | 0.10 | 0.32 | 0.23 | 0.29 | 0.30 | 0.19 |
| 10339 | 0.03 | 0.04 | 0.03 | 0.03 | 0.05 | <0.22 | <0.24 | <0.24 | <0.23 | <0.25 | 850 | 810 | 790 | 770 | 720 | 0.09 | 0.10 | <0.06 | <0.06 | <0.06 | 7.5 | 6.7 | 6.2 | 7.1 | 6.9 |
| 9118p1 | <0.03 | 0.02 | 0.03 | <0.02 | <0.17 | 0.34 | 0.29 | 0.37 | 0.40 | 0.33 | <5.5 | 7.8 | 6.6 | 5.9 | 5.9 | 0.13 | 0.09 | 0.16 | <0.08 | 0.14 | <0.04 | <0.04 | <0.06 | <0.04 | <0.03 |
| 793p3 | 0.17 | 0.14 | 0.07 | 0.15 | 0.10 | 0.39 | 0.41 | 0.40 | 0.45 | 3.9 | 8.1 | 9.1 | 10 | 7.9 | 10 | <0.09 | 0.09 | 0.07 | 0.13 | 7.8 | <0.05 | <0.04 | <0.04 \ 0.03 | <0.03 | |
| 6951p1 | <0.01 | 0.02 | 0.01 | 0.01 | 0.01 | <0.23 | <0.24 | <0.31 | 0.29 | <0.24 | 5.1 | <4.0 | <5.0 | <4.8 | <4.9 | 0.12 | 0.09 | <0.08 | <0.06 | <0.07 | <0.04 | <0.04 | <0.03 | <0.05 | <0.03 |
| 6920p1 | <0.01 | <0.01 | <0.01 | 0.02 | <0.01 | <0.23 | <0.25 | <0.24 | <0.26 | <0.25 | 41 | 66 | 85 | 86 | 75 | - | <0.07 | <0.08 | <0.06 | <0.04 | 14 | 11 | 12 | 14 | 7.2 |
| 6953p1 | 0.04 | 0.03 | 0.03 | 0.04 | 0.04 | <0.24 | <0.26 | <0.26 | 0.31 | <0.27 | 11 | 9.2 | 6.9 | 6.8 | 6.7 | <0.08 | 0.06 | <0.08 | <0.07 | <0.07 | <0.04 | <0.03 | - | - | - |
| 6949p1<0.02 | <0.02 | <0.02 | <0.02 | <0.21 | <0.24 | <0.25 | <0.24 | <0.27 | <0.26 | <4.6 | <5.0 | <4.6 | <4.7 | <4.9 | <0.08 | - | - | - | - | <0.03 | <0.05 | <0.04 | <0.04 | <0.02 | |
| 6228p1 | <0.03 | <0.03 | <0.03 | 0.03 | 0.03 | <0.23 | <0.25 | 0.29 | 0.29 | <0.26 | 280 | 500 | 340 | 550 | 140 | - | <0.07 | <0.06 | <0.07 | <0.06 | 25 | 17 | 17 | 21 | 12 |
| 4996p1 | 0.02 | <0.02 | 0.02 | 0.02 | 0.02 | <0.24 | <0.25 | 0.26 | 0.32 | <0.26 | 50 | 42 | 28 | 21 | 18 | - | <0.07 | <0.06 | <0.06 | <0.06 | 0.39 | 0.34 | 0.28 | 0.29 | 0.20 |
| 6986p1 | 0.04 | 0.07 | 0.10 | 0.06 | 0.11 | <0.25 | <0.27 | 0.30 | 0.38 | 0.29 | 160 | 88 | 100 | 140 | 41 | <0.08 | <0.07 | 0.07 | <0.07 | 0.08 | 1.3 | 0.82 | 0.57 | 0.61 | 0.25 |
Table 2 - Environmental Permit Determinands Summary Table showing annual average results (mg l-1)
| Analyte | 2015 | 2016 | 2017 | 2018 | 2019 |
|---|---|---|---|---|---|
| Ammonium | 0.004 | 0.06 | 0.04 | 0.03 | 0.03 |
| Barium | 0.07 | 0.07 | 0.07 | 0.07 | 0.07 |
| Chloride | 35 | 36 | 36 | 40 | 41 |
| Chromium | 0.002 | 0.002 | 0.001 | 0.001 | 0.002 |
| Gadolinium | <0.001 | <0.001 | <0.001 | <0.001 | <0.001 |
| Iron | 0.31 | 0.27 | 0.40 | 0.67 | 0.30 |
| Magnesium | 6.6 | 7.1 | 7.4 | 7.6 | 6.1 |
| Nitrate | 14 | 14 | 13 | 14 | 15 |
| Potassium | 2.8 | 2.5 | 2.3 | 2.6 | 2.5 |
| Sodium | 34 | 32 | 31 | 32 | 33 |
| Sulphate | 31 | 31 | 33 | 31 | 27 |
| TPH (C6-C40) | 0.04 | 0.20 | 0.13 | 0.21 | 0.13 |
Figure 1 - Schematic representation of Sellafield site geology and hydrogeology
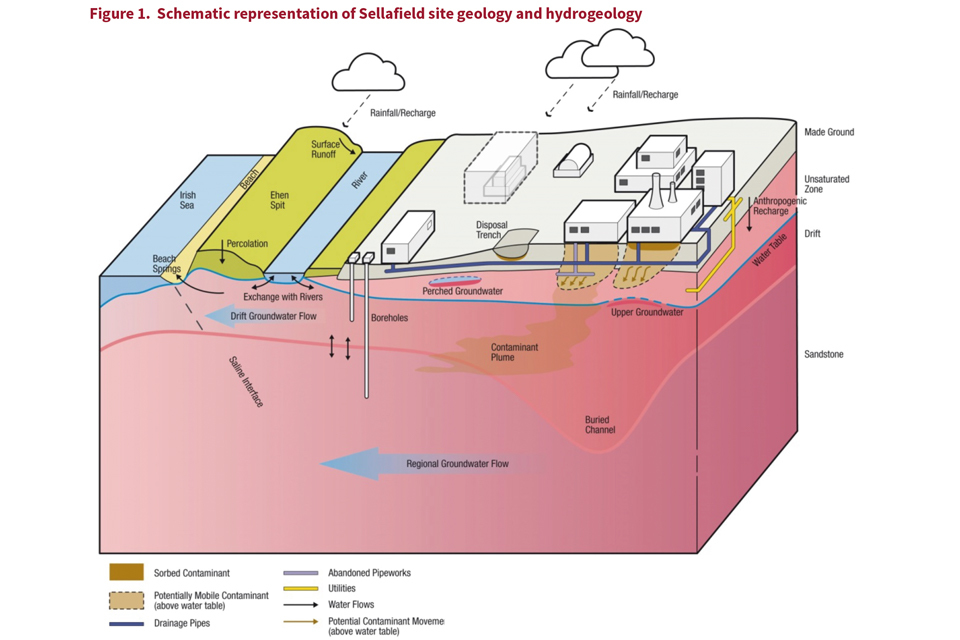
Figure 1. Schematic representation of Sellafield site geology and hydrogeology
Figure 2 - 2019 Groundwater Monitoring Network
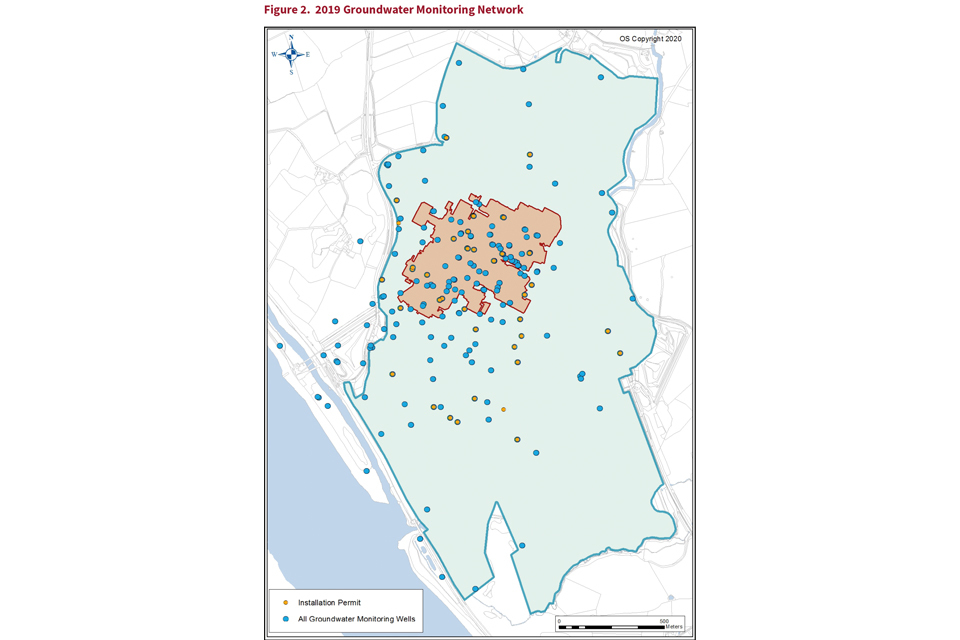
Figure2. 2019 Groundwater Monitoring Network
Figure 3 - Average Total Alpha Concentrations (results below the CEAR target LOD of 0.03 Bq l-1 are displayed on the figure as <LOD)
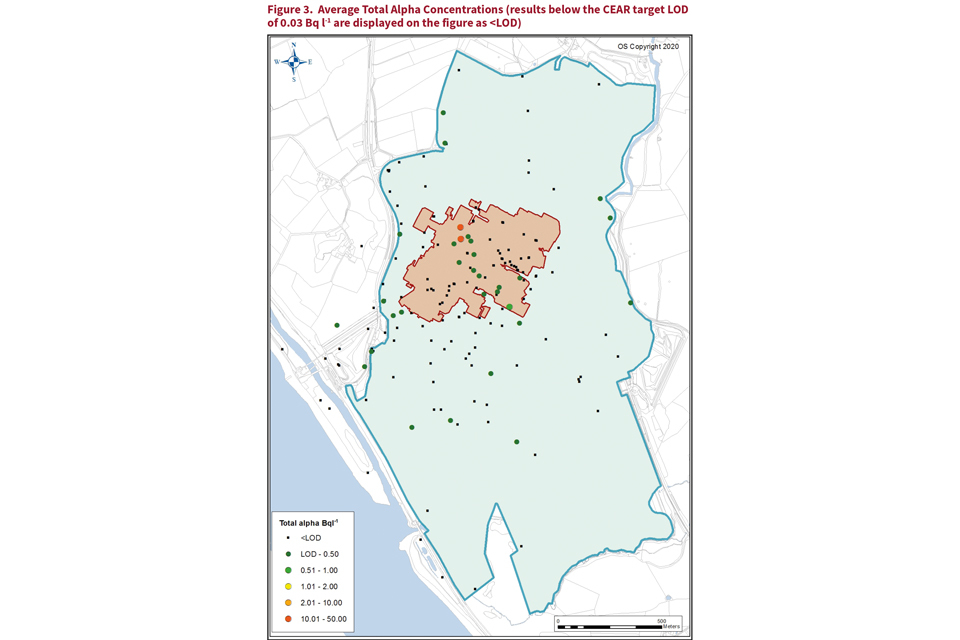
Figure 3. Average total Alpha Concentration (results below the CEAR target LOD of 0.03 Bql are displayed on the figure as <LOD)
Figure 4 - Average Total beta Concentrations (results below the CEAR target LOD of
0.30 Bq l-1 are displayed on the figure as <LOD)
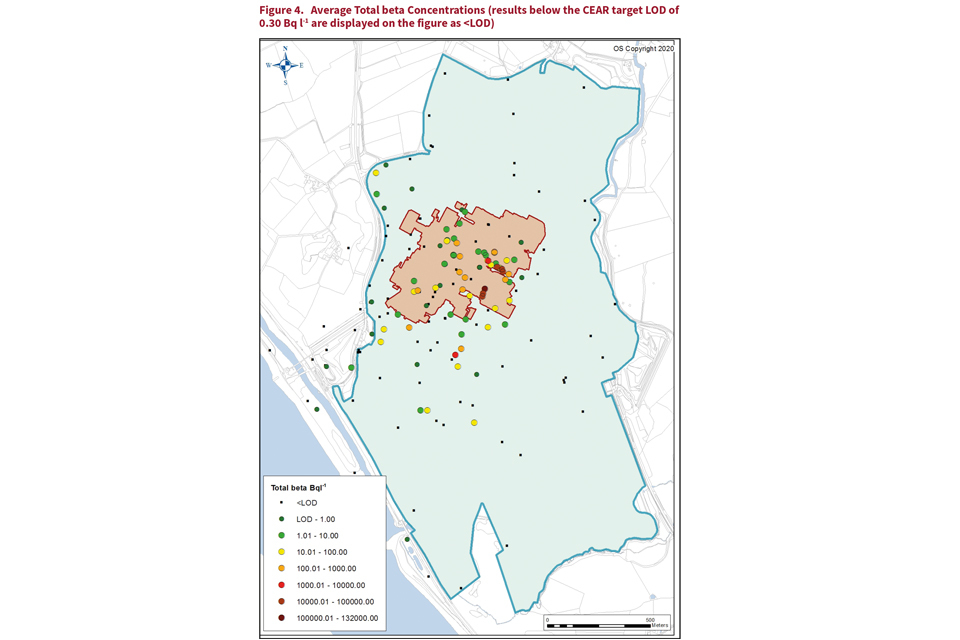
Figure 4. Average total beta concentrations (results below the CEAR target LOD of 0.30 Bql are displayed on the figure as <LOD)
Figure 5 - Average Strontium-90 Concentrations (results below the CEAR target LOD of 0.12 Bq l-1 are displayed on the figure as <LOD)
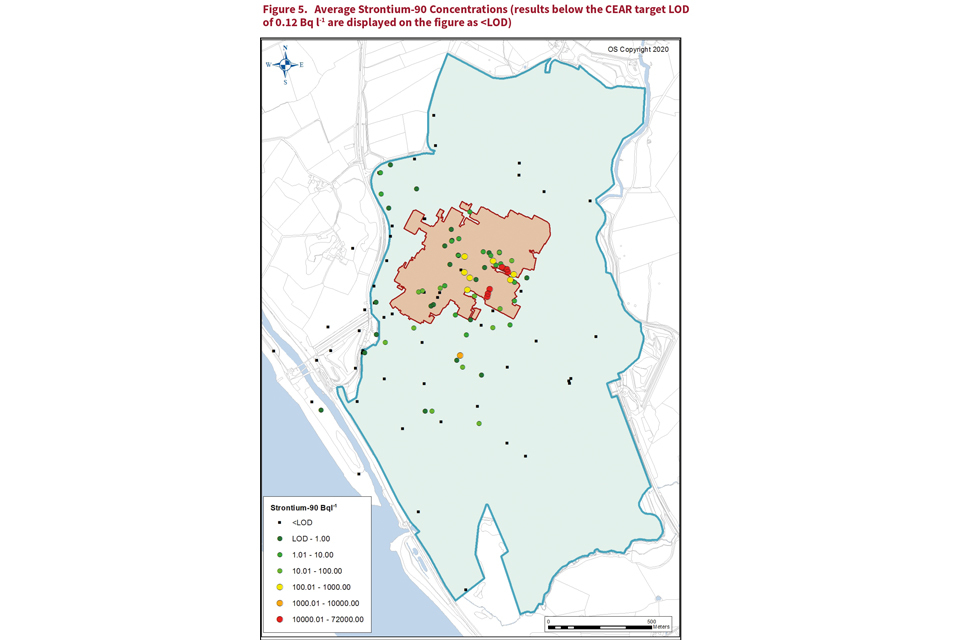
Figure 5. Average Strontium-90 Concentration (results below the CEAR target LOD of 0.12 Bql are displayed on the figure as <LOD)
Figure 6 - Average Tritium Concentrations (results below the CEAR target LOD of 7.5 Bq l-1 are displayed on the figure as <LOD)
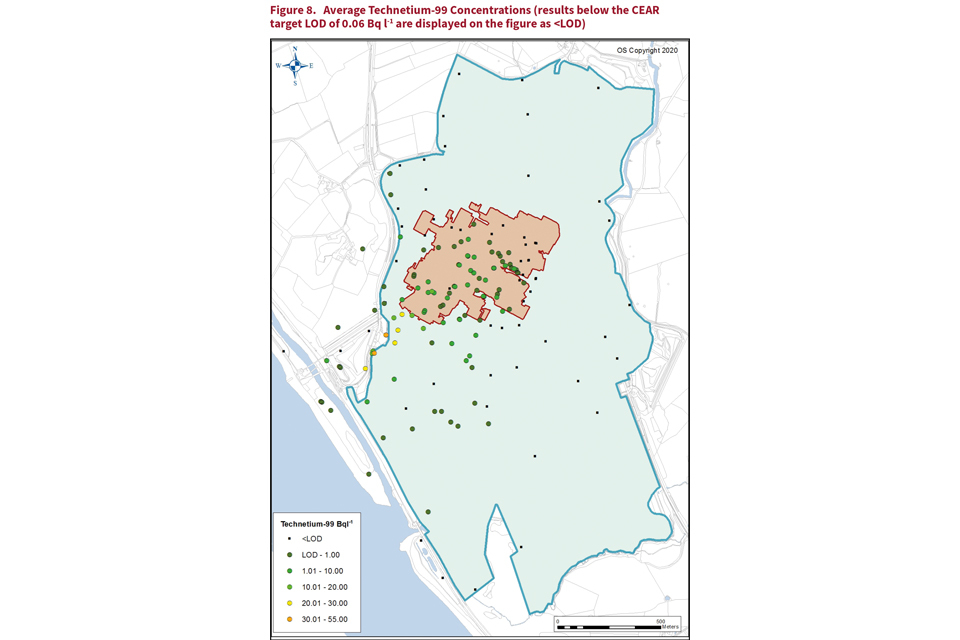
Figure 6. Average Tritium concentration (results below the CEAR target LOD of 7.5 Bql are displayed ont he figure as <LOD)
Figure 7 - Annual average tritium at 6986p1
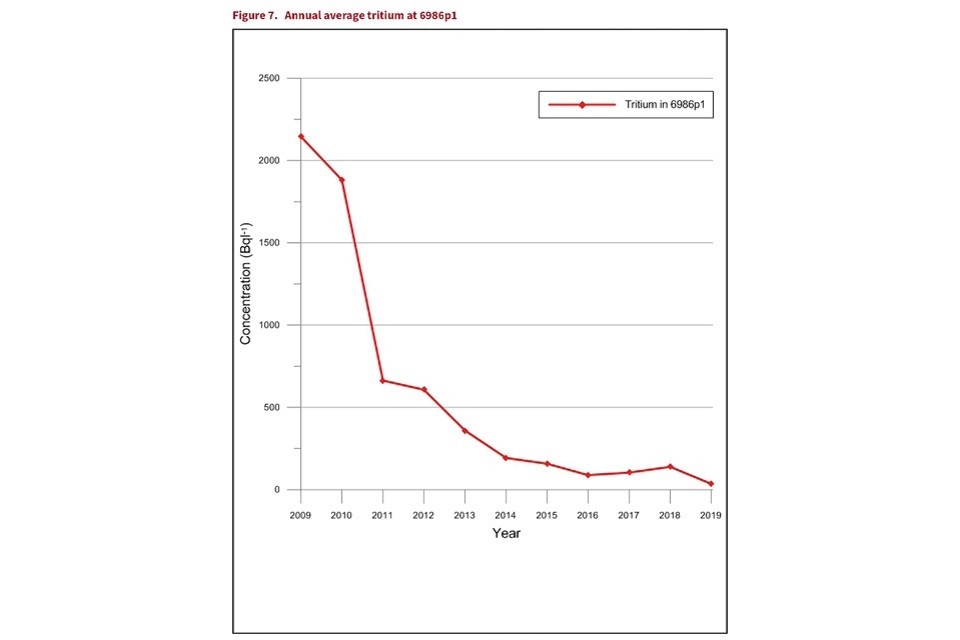
Figure 7. Annual average tritium at 6986p1
Figure 8 - Average Technetium-99 Concentrations (results below the CEAR target LOD of 0.06 Bq l-1 are displayed on the figure as <LOD)
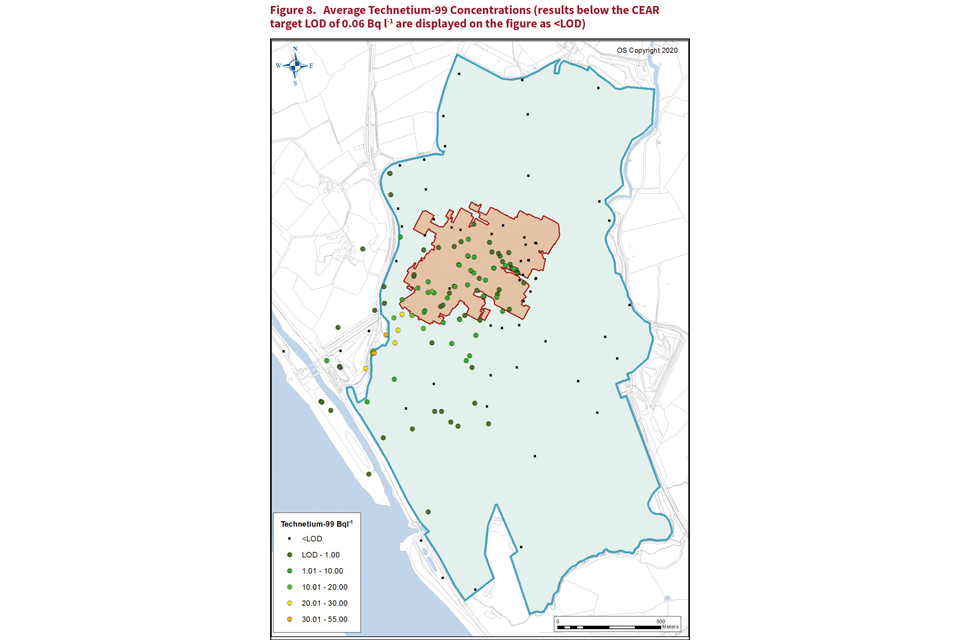
Figure 8. Average Technetium-99 concentration (results below the CEAR target LOD of 0.06 Bql are displayed on the figure as <LOD)
Figure 9 - Groundwater Types Identified from Samples Collected between April 2019 and June 2019 (where multi-depth installations are included the deeper piezometer-P1- is shown)
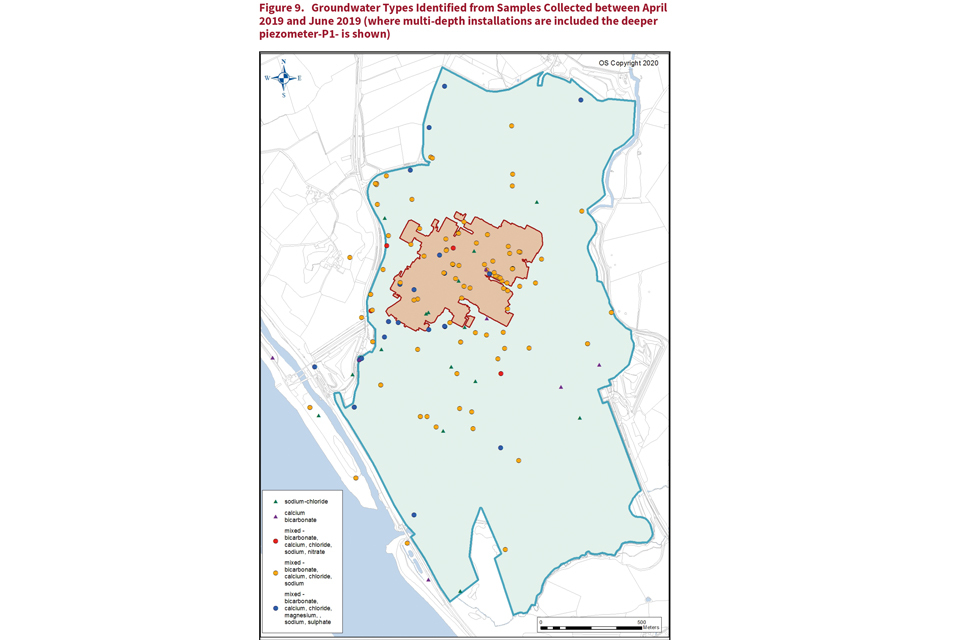
Figure 9. Groundwater types identified from samples collected between April 2019 and June 2019 (where multi-depth installation are included the deeper piexometer-P1-is shown)
8. Corporate carbon footprint 2019/20
8.1 Sellafield Ltd’s Carbon Footprint
Paragraph 1
From 2018/19 Sellafield Ltd has assessed its carbon footprint following the UK Government’s Environmental Reporting Guidelines (ref 1).
From FY 19/20 onwards, Sellafield Ltd is required to report its carbon footprint in the Company Annual Report under the government’s Streamlined Energy and Carbon Reporting requirements (ref2).
Paragraph 2
Sellafield Ltd must comply with both domestic and international legislation concerning energy use and the emission of greenhouse gases.
The European Union Greenhouse Gas Emissions Trading Scheme (EUETS)(ref 8) is the most significant of these obligations and requires Sellafield Ltd to purchase sufficient allowances to cover certain carbon dioxide (CO₂) emissions due to the combustion of fossil fuels.
Further obligations include: the Climate Change Levy (CCL) main rate and carbon price support (CPS)4; and conditions within Sellafield Ltd’s EPR Installation environmental permit (ref 5).
Sellafield Ltd has also adopted an internal greenhouse gas emissions reduction target with the initial aim of introducing the concept of carbon management in the context of high hazard risk reduction.
Paragraph 3
Greenhouse gas emissions are measured in carbon dioxide equivalent, CO₂e. The main greenhouse gases include carbon dioxide, nitrous oxide, methane and refrigerant gases.
Carbon dioxide has a global warming potential (GWP) of 1, whereas methane has a GWP of 25, meaning that methane has 25 times more impact than the same mass of CO₂.
To calculate Sellafield Ltd’s overall carbon footprint, the weighted contributions of all greenhouse gases6 have been included using the appropriate conversion factors (ref 1).
Paragraph 4
CO₂e emissions are assessed for direct emissions that arise from activities owned or controlled by Sellafield Ltd, these are termed Scope 1 Emissions in the DEFRA Environmental Reporting Guidelines.
In addition, emissions released into the atmosphere associated with Sellafield Limited’s consumption of purchased electricity are included and these are termed Scope 2.
Finally, emissions that are a consequence of Sellafield’s actions which occur at sources not under the organisation’s ownership are assessed and these are termed Scope 3.
Paragraph 5
The Carbon Trust has independently verified the carbon footprint of Sellafield Ltd for 2018/19 and 2019/20 (ref 7, 8) as meeting the requirements of ISO 14064-36.
The carbon footprints have been derived according to a location- based approach. The location-based approach calculates carbon emissions from procured electricity using the national grid average.
Paragraph 6
Corporate contributions to the 3 scopes are presented in table 1 and figure 1. The greenhouse gas footprint for 2019/20 was 280,000 tCO₂(e), 12% lower than in 2018/19.
Paragraph 7
The carbon footprint is dominated by the use of electricity and steam on site (table 1). To operate the Sellafield site, essential utilities and services are needed 24 hours a day, 365 days a year.
These include electricity, steam, compressed air, water, transport for materials and people, rail transport for fuel receipts and flask maintenance.
Providing these services requires energy which results in the emission of CO₂ and other greenhouse gases which contribute to climate change.
Paragraph 8
The following have contributed towards a reduction in the CO₂e emissions from 2018/19:
- Overall site electricity consumption reduced by ~8,000 MWh (this includes the impact from cessation of reprocessing in Thorp late 2018)
- Fellside Combined Heat and Power (CHP) emissions decreased due to a reduction in electricity generated and an improvement in equipment efficiency
- More electricity was imported from the national grid. This electricity has lower CO₂e emissions than the equivalent gas-generated electricity from the Fellside CHP
Paragraph 9
Sellafield Ltd aspires to be a “generative” organisation. The Energy Institute (ref 9) defines a “generative” approach to energy management as: “Energy management is how the organisation does business.
It is valued as much as cost reduction or production. Energy management is one of the business drivers of the organisation”.
8.2 References
- UK Government (2019). Environmental Reporting Guidelines: Including streamlined energy and carbon reporting.
- UK Government (2018). The Companies (Directors’ Report) and Limited Liability Partnerships (Energy and Carbon Report) Regulations 2018.
- European Parliament (2003). Greenhouse Gas Emissions Allowances Trading Scheme (EUETS) – Directive 2003/87/EC.
- UK Government (2018). Climate Change Levy – The Climate Change Levy (General) (Amendment) Regulations 2018.
- HMSO (2016). The Environmental Permitting (England and Wales) Regulations 2016. Her Majesty’s Stationery Office, London.
- ISO (2019). Greenhouse gases – Part 3: Specification with guidance for the verification and validation of greenhouse gas statements. ISO 14064-3, International Standardization Organization, Geneva
- Carbon Trust (2020). Organisational Carbon Footprint, Verification Report, Sellafield Ltd, 1 April 2018 – 31 March 2019, ISO 14064-3.
- Carbon Trust (2020). Organisational Carbon Footprint, Verification Report, Sellafield Ltd, 1 April 2019 – 31 March 2020, ISO 14064-3
- Energy Institute (2017). Understanding your energy culture. Hearts & Minds toolkit.
Table 1 - Sellafield Ltd contributions to the carbon dioxide (e) emissions in Scope 1 - 3 categories
| Emission Source | Scope | CO2 Emissions (tCO2e) | |
|---|---|---|---|
| 2018/19 | 2019/20 | ||
| Electricity (for the Sellafield Site) | 1 | 140,000 | 110,000 |
| Electricity (exported from Sellafield Site) | 1 | 42,000 | 14,000 |
| Steam (for the Sellafield Site) | 1 | 120,000 | 120,000 |
| Offsite Gas Consumption | 1 | 160 | 170 |
| Fuels (Transport +Other) | 1 | 2,300 | 3,500 |
| Process Emissions (organics, N₂O, SF₆ , refrigerants) | 1 | 3,700 | 5,900 |
| Electricity Grid Consumption | 2 | 13,000 | 20,000 |
| Business Travel | 3 | 1,400 | 1,400 |
| Coach and Buses | 3 | 970 | 950 |
| Commuter Travel | 3 | 890 | 770 |
| Total | 320,000 | 280,000 |
The above figures have been verified by the Carbon Trust.
Figure 1 - Schematic representations of corporate contributions to the carbon use in Scope 1 - 3 categories
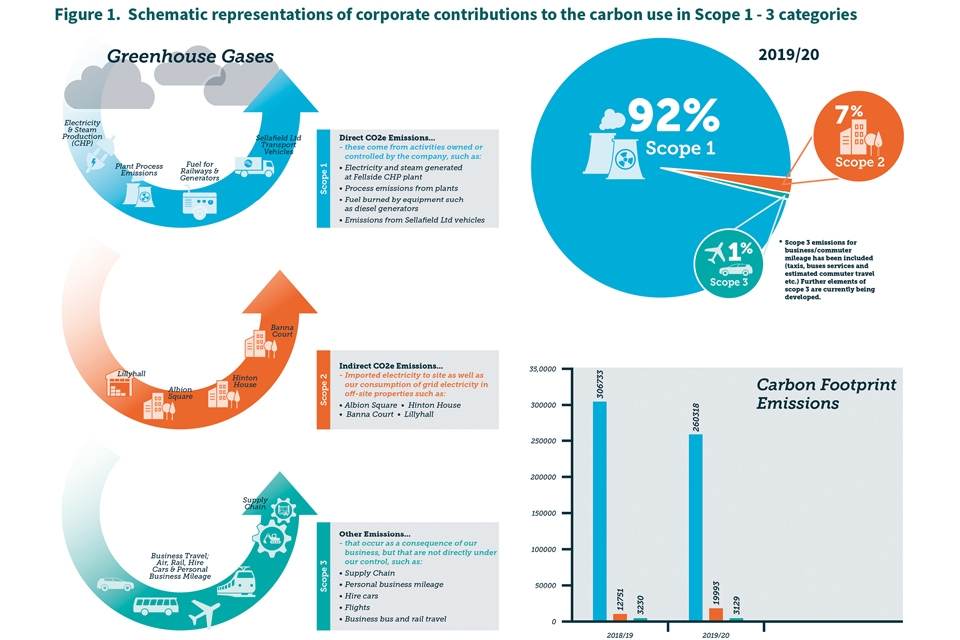
Figure 1. Schematic representations of corporate contributions to the carbon use in scope 1 - 3 categories
9. Future effluent discharge projections
Paragraph 1
Liquid and gaseous radioactive and non-radioactive effluents are generated during activities undertaken at the Sellafield Site.
The Sellafield Effluent Management Strategy outlines current and future requirements and recommendations for managing such effluents.
Paragraph 2
Sellafield Ltd produce annual reports containing a summary of estimates of current and future site gaseous and aqueous waste discharges by main activities in response to Environmental Permit requirements and in support of Her Majesty’s Government’s obligations under the OSPAR Convention.
Paragraph 3
In this report, discharges are split into two main categories: Operational; and Historic/Legacy.
These categories align to the OSPAR definitions (ref 4):
- Operational - Discharges from existing or planned production operations associated directly with the generation of a ‘product’ for which there are clear benefits, such as reprocessing
- Historic/Legacy - Discharges from existing and legacy facilities that clearly are not associated with the carrying on of production operations at those facilities, such as remediation, decommissioning and clean-up of the historical legacy
Paragraph 4
As reprocessing nears completion, the emphasis at Sellafield is shifting to environmental remediation, decommissioning and clean-up of the historic legacy with an increasing degree of uncertainty.
The Overall Effluent Strategy Model (OESM) at Sellafield has been developed to predict current and future discharges from the Sellafield site.
This model deals with a complex and varying set of interacting source terms, and is of increasing importance in forward predictions and identifying associated BAT arrangements.
There is continual improvement in source data and forward predictions.
A better understanding of uncertainties relating to future discharges is an ongoing aspect of preparation for the retrieval and associated treatment plant capabilities.
This is reflected in the OESM predicting to within 20% for well understood flowsheets which have predictable performance parameters, (confirmed by comparison with historic data), to greater uncertainty associated with longer time period predictions.
Paragraph 5
The expected outcomes and forward discharge profiles are based on assumptions about future activities and plant performance at the time of writing.
Such forecasting uncertainties are related either to schedule, plant performance, or challenge, such as:
- Time taken to empty a legacy waste store
- Performance of new treatment capabilities.
- Success of Post Operational Clean Out in removing or fixing radioactive contamination
Future scheduling changes are inevitable as risks are managed – including opportunities to accelerate plans
Paragraph 6
Reduction of forecasting uncertainties is an ongoing task aimed at increasing confidence, transparency, visibility and management of flowsheet uncertainties and expected outcomes. Some uncertainties cannot be fully resolved until work to deal with these legacies is well underway.
Paragraph 7
Past and projected environmental discharge profiles of key individual and groups of radionuclides are presented in figures 1 to 3 (liquid discharges) and figures 4 to 6 (gaseous discharges).
On these figures, discharges up to and including 2019 are categorised as ‘Past’ and represent data reported to the Environment Agency.
Discharges from 2020 onwards represent data projected from the OESM. 2017 values have been amended from the 2017 Annual Report as values have now been aligned to the correct CEAR report and discharges.
Paragraph 8
Operational liquid and gaseous discharges are projected to reduce substantially as reprocessing activities are completed. In particular, tritium discharges are dominated by operational activities and will virtually cease when reprocessing is completed.
Paragraph 9
Historic / legacy liquid and gaseous total alpha and total beta discharges have increased recently due to commencement of removing fuels and sludges from legacy storage, and are projected to continue at these levels while high hazard risk reduction activities proceed.
Paragraph 10
Sellafield Ltd staff have continued to address requirements relating to the OSPAR Radioactive Substances Strategy (RSS), as part of the UK’s commitments under the OSPAR Convention.
Paragraph 11
The UK (BEIS) seeks progressive and substantial reductions in radioactive discharges, whilst acknowledging the need for flexibility during periods of future uncertainties.
Better understanding of these uncertainties is an ongoing aspect for the preparation of retrievals, POCO, decommissioning and associated treatment plant capabilities.
Paragraph 12
The UK Strategy for Radioactive Discharges² states that the UK is making good progress in reducing radioactive discharges and continues to apply Best Available Techniques (BAT).
Paragraph 13
Current understanding and assumptions indicate that discharges pose no threat to current permitted discharge limits, are not expected to compromise the UK Strategy for Radioactive Discharges expected outcomes and are not expected to impact adversely on Sellafield Ltd’s plans, so long as Sellafield Ltd continues to demonstrate the application of BAT.
9.1 References
- OSPAR Commission. Reporting Formats for the Collection of Data on Liquid Discharges from Nuclear Installations. OSPAR Agreement 2013-10, 2014 Update.
- Department for Business, Energy and Industrial Strategy (2018). UK strategy for radioactive discharges. 2018 review of the 2009 strategy. Department for Business, Energy and Industrial Strategy.
Figure 1 - Past and projected total alpha discharges from liquid effluents
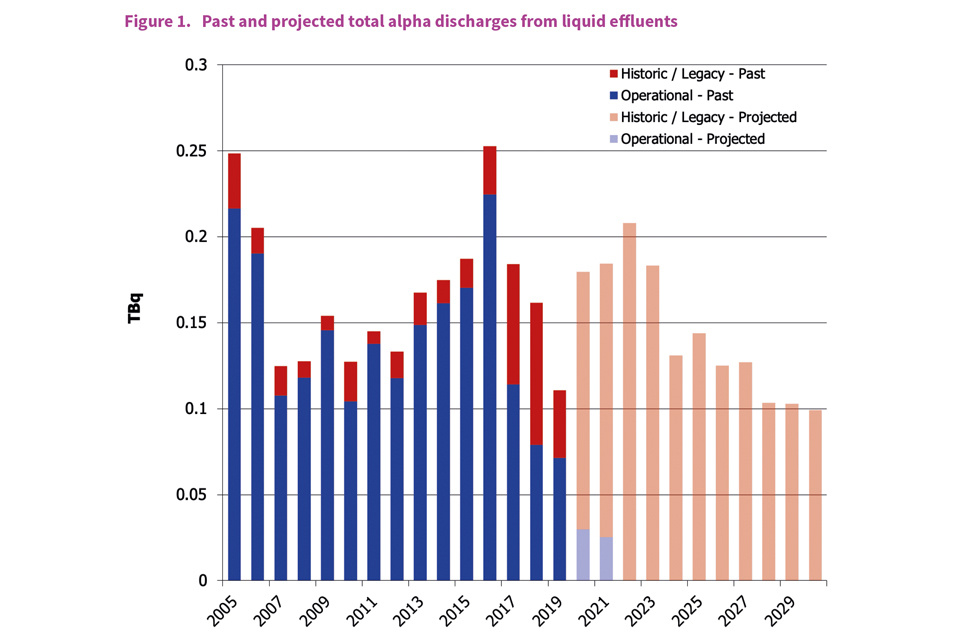
Figure 1. Past and projected total alha discharges from liquid effluents
Figure 2 - Past and projected total beta (excluding tritium) discharges from liquid effluents
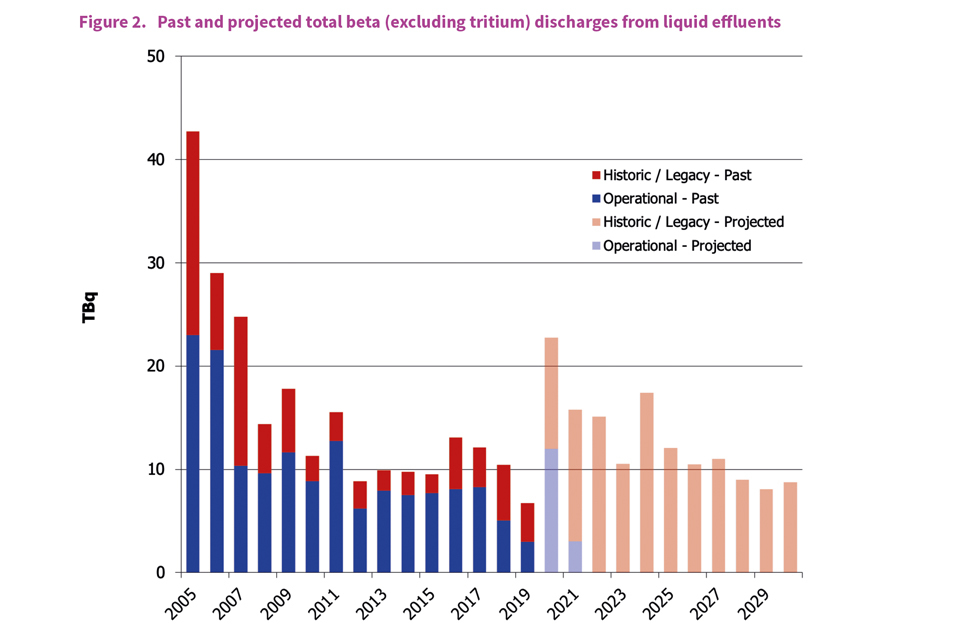
Figure 2. Past and projected total beta (excluding tritium) discharges from liquid effluents
Figure 3 - Past and projected tritium discharges from liquid effluents
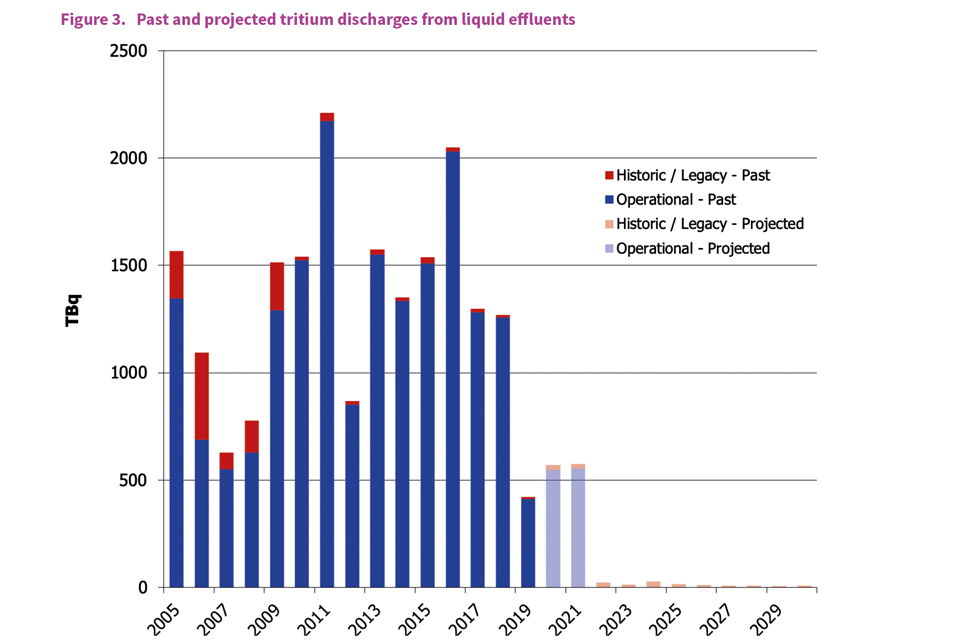
Figure 3. Past and projected tritiium discharges from liquid effluents
Figure 4 - Past and projected total alpha discharges associated with particulates from gaseous effluents
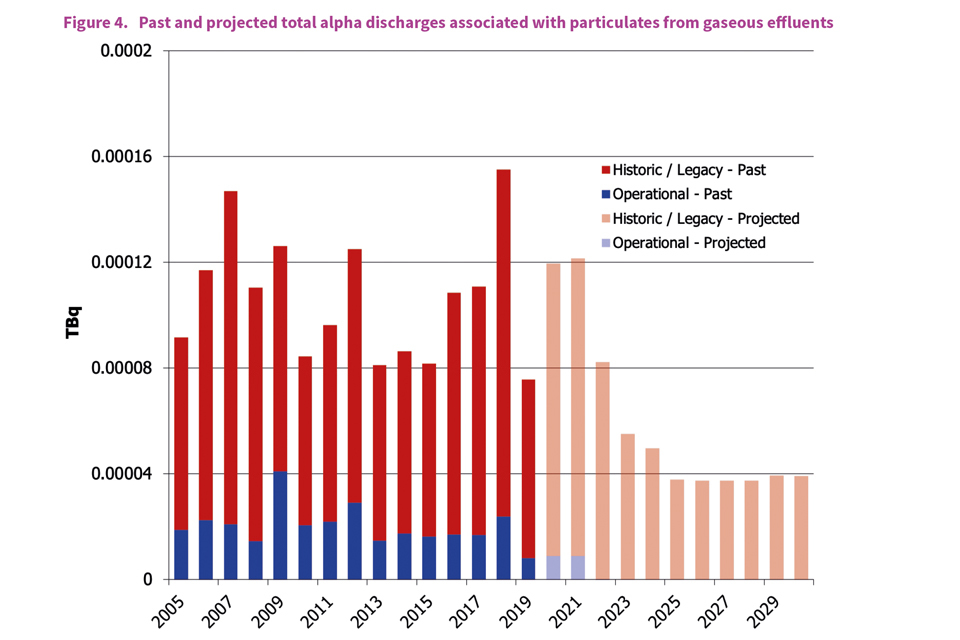
Figure 4. Past and projected total alpha discharges associated with particulates form gaseous effluents
Figure 5 - Past and projected total beta discharges associated with particulates from gaseous effluents
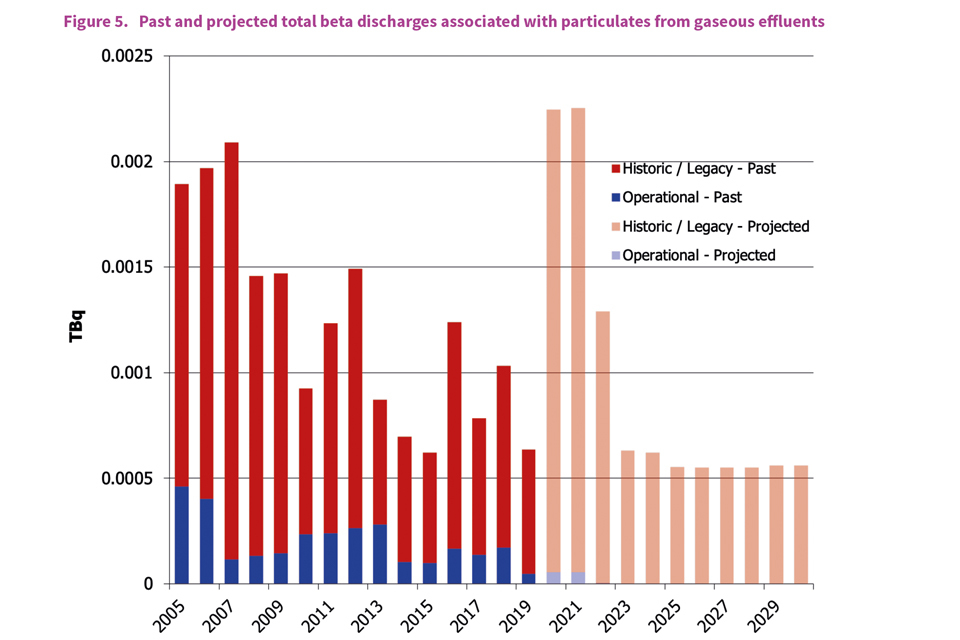
Figure 5. Past and projected total beta discharges associated with particulates from gaseous effluents
Figure 6.- Past and projected tritium discharges from gaseous effluents
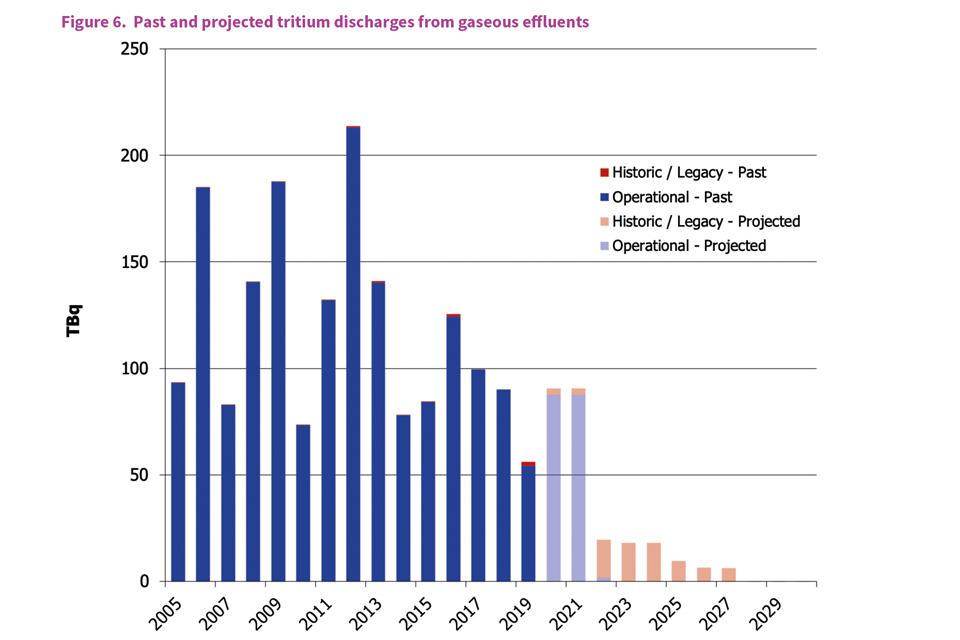
Figure 6. Past and projected tritium discharges from gaseous effluents
10. Appendix A
10.1 Dosimetric considerations for individual and collective doses
10.2 Critical group doses
Paragraph 1
A key concept for assessment of dose to the public is the ‘critical group’: the individual members of a population who can realistically be expected to receive the highest dose due to their lifestyle, location and habits (ref 1,2).
This term is equivalent to the term ‘representative person’, used by the ICRP 3,4. A description of the ‘representative person’ approach using recent monitoring data is given in Appendix C.
The dose to members of a critical group is assessed as the mean of the sums of committed effective doses from intakes of radionuclides during the year and their effective doses from external irradiation (see Introduction paragraph 21).
These sums are for convenience termed Effective Doses (see Glossary). Effective doses are calculated by combining dose per unit intake data with estimates of annual radionuclide intake by ingestion and inhalation, taking into account all relevant pathways, such as consumption of specific foods at high rates and inhalation during occupancy of certain areas (ref 5,6).
Paragraph 2
In determining the critical group appropriate to a particular site, it is recognised that the relative doses from different pathways will depend on the habits of particular groups of individuals.
Such doses should be summed as required to obtain the critical group dose. Therefore a high rate consumer of seafood may receive only a minor exposure via pathways such as milk consumption or proximity to the site perimeter.
For another group, consumption of locally produced meat and milk may combine to result in an elevated exposure.
Accordingly, it is common practice to define exposure groups in terms of a dominant pathway or habit (e.g. seafood consumers, boat dwellers, anglers, inhalation pathways etc.).
For simplicity, these may at times be referred to in this report as ‘critical groups’, although strictly speaking PHE (ref 2) defines only the most exposed group at any given time as the critical group.
Paragraph 3
This report focuses mainly on doses to members of critical groups; the small groups of people that are most exposed to radiation from the Sellafield Ltd site.
The doses received by the rest of the population, from operations at Sellafield Ltd site, will be very much less than those received by critical groups.
Paragraph 4
Details of the critical group consumption habits used in this 2019 report are given in table A1 (seafood consumption) and table A2 (terrestrial food consumption). Other details relating to the calculation of plume immersion and inhalation dose are given in table A3.
Critical group dose limits and constraints
Paragraph 5
UK dose limits and constraints, which are applicable to controlled releases of radioactivity, are based on the ‘1990 Recommendations’ of the ICRP¹ in which it reviewed the quantities used in radiological protection, the biological effects of radiation relevant to radiological protection, the conceptual framework of radiological protection and recommendations on dose limitation.
Under these recommendations, the primary dose quantity was redefined as effective dose (see paragraph 1 and the Glossary), taking into account ‘weighting factors’ which reflect the sensitivity of different body organs to induction of cancer following exposure to radiation.
For members of the public, the ICRP recommended an annual limit on effective dose of 1000 µSv.
Paragraph 6
The ‘1990 Recommendations’ also placed emphasis on the optimisation of radiological protection (see paragraph 21) and on the concept of source-related restrictions on individual dose, relating to the optimisation process, termed ‘dose constraints’.
A dose constraint is an upper bound on the annual dose to the overall critical group, summed over all exposure pathways, from the planned operation of a controlled source1. Dose constraints may introduce additional restrictions within the overall dose limit.
Paragraph 7
In 1993, the then National Radiological Protection Board (NRPB) published guidance based on ICRP’s ‘1990 Recommendations’ and recommended that for proposed new controlled sources, the maximum dose constraint should be 300 µSv per year (ref 2).
Constraints lower than this could be set where such doses are readily achievable. Existing facilities are expected to operate within the appropriate constraints but where it is not possible to comply with the recommended dose constraint, PHE advise that the operating regime be reviewed with the regulatory body to ensure that doses are ‘as low as reasonably achievable’.
Exposures arising from past controlled releases should be included in any comparison with the 1000 µSv dose limit but not in comparison with the dose constraint of 300 µSv.
PHE advice includes the caveat that doses should in any case be below the 1000 µSv limit on annual dose.
Paragraph 8
The 1000 µSv dose limit was incorporated into the Euratom Basic Standards Directive 1996 and implemented in UK law through Radioactive Substances (Basic Safety Standards) Direction 2000 (Introduction paragraph 5).
Ministers have directed the EA, when discharging their duties under RSA 1993, to ensure that the Directive limit on annual dose to the public is not exceeded, and that a maximum source constraint of 300 µSv and a site constraint of 500 µSv are applied for authorising radioactive discharges.
The annual dose limit of 1000 µSv should be compared with the sum of doses from the sites, from discharges from all other sources and from any historical accumulation of radionuclides in the environment from past discharges.
Critical group dose considerations
Paragraph 9
Radionuclides taken into the body, either by ingestion or by inhalation, cause exposure both to the local tissue and to the whole body. For the purposes of dosimetry, monitoring and control, it is the whole-body exposure which is often of prime concern.
The actual exposure will depend on many factors, such as the solubility of the radionuclide and its characteristic retention time in the body.
Paragraph 10
The dose coefficients in tables A4 and A5 reflect the most recent advice of the ICRP7. They represent the committed effective dose (CED) that would be incurred by an individual up to the age of 70 years following the uptake of a unit amount of a radionuclide.
Since biokinetic behaviour (and hence dose incurred) may change with age, differing values are presented depending on the age of the individual at the time of intake.
The methods and parameter values used for the radiological assessments generally follow the values and relationships given in Annexes II and III to the Council Directive 96/29/Euratom of 13 May 1996.
Paragraph 11
In determining the dose arising from ingestion of material containing radioactivity, it is necessary to consider the fraction of the radioactivity which is likely to be absorbed across the wall of the gastro-intestinal tract.
Such absorption is referred to as the gut uptake factor (f1) and varies with the physical and chemical form of the radionuclide and with the metabolism and physiology of the individual. In general, young infants absorb some molecular species more readily than older children or adults and f1 values tend to be correspondingly larger for infants in a number of cases.
In general, more soluble elements such as caesium or tritium tend to be absorbed more readily than less soluble elements, such as plutonium, across all age ranges.
Paragraph 12
With respect to intakes of radionuclides by ingestion, a number of studies (ref 8,9,10) have established more appropriate gut uptake values for the actinides present in winkles and other molluscs in the Sellafield area for use in critical group studies.
For winkles, these values have been endorsed by PHE11 and supported by other studies (ref 12). These values are presented here and are used in this report to estimate doses arising from consuming winkles from the West Cumbrian coast.
For seafood other than winkles close to Sellafield, PHE considers that using a gut transfer factor of 0.0005 for both plutonium and americium will not lead to underestimates of critical group doses10,13. These approaches are consistent with the dose assessments performed within RIFE-2514.
Paragraph 13
Dose per unit intake values for the inhalation of radionuclides are derived from the most recent recommendations of ICRP (ref 1). The dose following intake of radionuclides by inhalation depends upon a number of factors in addition to the radioactive properties of the nuclide(s) involved.
Important factors include the particle size of the inhaled material (which influences the extent and distribution of deposition within the respiratory tract) and the rate at which deposited material can be absorbed into body fluids within the respiratory tract and subsequently enter general systemic circulation.
A significant proportion of particulate material deposited in the respiratory tract is cleared directly via the gastro-intestinal tract in swallowed mucus, therefore the proportion of this swallowed material which is absorbed across the gut wall also influences the dose.
Regarding particle size, ICRP recommends the calculation of doses to members of the public assuming an activity median aerodynamic diameter of 1 micron (10-6 m) for the inhaled material (ref 7).
For most radionuclides, this maximises the resulting dose by maximising deposition in the alveolar region of the respiratory tract.
Paragraph 14
ICRP has derived a standard classification for inhaled material (the ‘lung absorption type’) based on the rate of absorption of different chemical forms of radionuclides into body fluids.
These absorption types are denoted as V, F, M and S, type V being the most rapidly absorbed and type S the slowest. For each absorption type ICRP recommends an appropriate factor (the ‘f1 value’) for the fraction of swallowed material which is absorbed through the gut wall.
Paragraph 15
ICRP has provided calculated values for the committed effective dose to members of the public of different ages, for inhalation of airborne particles with a median diameter of 1 micron for all the radionuclides of relevance to this report (ref 7).
Several values are generally cited for each radionuclide, reflecting the range of absorption types which may be encountered. However, for most radionuclides, ICRP recommends a default absorption type which may be assumed in the absence of specific information about absorption behaviour; in most cases the dose per unit intake values corresponding to those default absorption types are used in the dose assessments in this report.
For some radionuclides, ICRP does not specify a default absorption type and in these instances the absorption type producing the highest value of dose per unit intake is assumed for dose assessments.
Paragraph 16
Sellafield Ltd has considered the information in ICRP Publication 8815, which provides dose coefficients for the embryo and foetus after intakes of radionuclides by the mother, but does not advise on dose limitation or dose constraints for the embryo (ref 16).
A report produced by PHE17 provides guidance on the use of the ICRP dose coefficients and advice regarding the situations for which the assessment of foetal dose is required. In consulting this document, the foetal dose has been calculated by multiplying the adult dose by the ratio of the foetus to adult dose conversion factors (ref 17).
Paragraph 17
Only radionuclides which are known to be present in Sellafield Ltd discharges from Sellafield and are listed in the discharge authorisations are included here.
In the case of krypton-85 which is present in aerial discharges, no dose per unit intake value is presented since exposure for this nuclide is determined by external rather than internal dosimetry.
10.3 Collective doses
Paragraph 18
In addition to estimating doses to critical groups, doses to populations as a whole can be estimated. This involves the concept of ‘collective dose’: the summation of all individual radiation doses received by a population over a defined period of time.
Since radionuclides persist in the environment, subject to processes of dilution, dispersion, radioactive decay and ingrowth of daughter products, the public will continue to receive radiation doses (generally at a decreasing rate) for some time after a discharge is made.
Calculating the collective dose therefore involves predicting the behaviour of radionuclides over extended periods following the discharge.
Paragraph 19
In practice, collective doses are often dominated by the summation of a large number of exceedingly small doses received by individuals who are remote, in both space and time, from the point of discharge.
Consequently, the calculation of collective dose relies heavily on the use of theoretical models that predict the dispersion of radionuclides over large geographical areas and long timescales.
The unit for collective dose is the man Sievert (man Sv) which emphasises that the value quoted is the sum of doses received by a number of individuals.
Paragraph 20
The time and geographical area over which a collective dose is integrated is necessarily stated with the estimated value. Current PHE advice emphasises a 500 year integration period4 and this is used throughout this report. Doses are generally calculated to the populations of UK, Europe (including the UK) and the World.
The EU population chosen is 12 countries which allow a consistent presentation between the aerial and marine model results (Belgium, Luxembourg, Denmark, France, Germany, Greece, Ireland, Italy, Netherlands, Portugal, Spain, and United Kingdom; EU12 population of 360 million) (ref 18,19).
Paragraph 21
Collective doses play an important role in the optimisation of radiological protection using the ALARA (As Low As Reasonably Achievable) principle.
This is recognised by PHE2 as being a useful technique for aiding decisions between different options for radiological protection.
Its advice gives monetary values for unit collective doses, which allows the cost of collective doses to be compared with the capital and operating costs of preventing those doses from arising.
Collective dose considerations
Paragraph 22
The collective committed effective dose estimates resulting from Sellafield discharges have been calculated using the 2008 upgrade of the PHE model PC CREAM (ref 18).
This is based on the methodology for assessing the radiological consequences of routine releases to the environment published by the European Commission (ref 19).
Paragraph 23
Generally, the PC CREAM default dose per unit intake values have been applied. Where required, the pulmonary retention classes for radionuclides have been modified on a site-specific basis.
Paragraph 24
The values presented in tables A6 and A7 for Sellafield are site specific and are given as man Sieverts per Becquerel discharged. Only radionuclides which are known to be present in Sellafield Ltd discharges from Sellafield and are listed in the discharge authorisations, are included here.
10.4 Worked example of committed effective dose calculation for an individual member of a critical group
CED received by an adult member of the seafood consuming critical group from Am-241 in winkles
| Parameter | Value | Location in report | |
| A | Am-241 activity concentration in winkles | 10 Bq kg-1 | Monitoring chapter, Table 4 |
| B | Consumption rate of winkles by adults | 7.3 kg y-1 | Appendix A, Table A1 |
| C | Committed effective dose per unit intake value for ingestion for Am-241 in Cumbrian winkle consumed by an adult | 8.0E-08 Sv Bq-1 | Appendix A, bottom of Table A4 for the Cumbrian Winkle data |
CED received by an adult member of the seafood consuming critical group from Am-241 in winkles is: CED = A x B x C in units of Sv per year; CED = 10 Bq kg (ref 1) x 7.3 kg y (ref 1) x 8.0E-08 Sv Bq-1 = 5.84E-06 Sv y (ref 1), which is equivalent to 5.8 μSv y-1, as reported in Radiological Impact chapter, Table 1.
This approach is repeated for all radionuclides of interest in each seafood species of interest, through the incorporation of the appropriate consumption rates and committed effective dose per unit intake values.
Care is needed in using the correct dose per unit intake values for Cumbrian winkles as a specific set of data for transuranic radionuclides are available (Appendix A, table A4). All other seafood species consumed use the generic data given in A4.
10.5 References
- International Commission on Radiological Protection (1991). The 1990 recommendations of the ICRP. ICRP Publication 60. Ann. ICRP 21 (1-3).
- National Radiological Protection Board (1993). Occupational, public and medical exposure: Guidance on the 1990 recommendations of ICRP. Documents of the NRPB 4 (2).
- International Commission on Radiological Protection (2007). The 2007 Recommendations of the International Commission on Radiological Protection. ICRP Publication 103. Ann. ICRP 37 (2-4).
- Health Protection Agency (2009). Application of the 2007 Recommendations of the ICRP to the UK: Advice from the Health Protection Agency. Documents of the Health Protection Agency.
- Hunt G J and Shepherd J G (1980). The identification of critical groups. Fifth International Congress of IRPA. Jerusalem. III: 149-152.
- International Commission on Radiological Protection (1977). Recommendations of the ICRP. ICRP Publication
- Ann. ICRP 1 (3).
- ICRP (2012). Compendium of Dose Coefficients based on ICRP Publication 60. ICRP Publication 119. Ann. ICRP 41 (Suppl).
- Hunt G J, Leonard D R P and Lovett M B (1986). Transfer of environmental plutonium and americium across the human gut. Sci. Tot. Environ. 53: 89-109.
- Hunt G J, Leonard D R P and Lovett M B (1990). Transfer of environmental plutonium and americium across the human gut: a second study. Sci. Tot. Environ. 90: 273-282.
- Hunt G J (1998). Transfer across the human gut of environmental plutonium, americium, cobalt, caesium and technetium: studies with cockles (Cerastoderma edule L.) from the Irish Sea. J. Radiol. Prot. 18: 101-110.
- Harrison J D and Stather J W (1990). Gut transfer factors - plutonium and americium in shellfish and ‘best estimates’ for activities in food. Documents of the NRPB 1(2): 17-26.
- McKay W A and Halliwell C M (1994). The levels of particulate associated nuclides in Irish Sea shellfish and the implications for dose assessment. J. Radiol. Prot. 14: 43-53.
- Harrison J D (1998). Gut transfer and doses from environmental plutonium and americium. J. Radiol. Prot. 18: 73-76.
- Environment Agency, Food Standards Agency, Food Standards Scotland, Natural Resources Wales, Northern Ireland Environment Agency and Scottish Environment Protection Agency (2020). Radioactivity in food and the environment, 2019. RIFE-25. EA, FSA, FSS, NRW, NIEA and SEPA; Preston, London, Aberdeen, Cardiff, Belfast and Stirling.
- ICRP (2001). Doses to the embryo and fetus from intakes of radionuclides by the mother. ICRP Publication 88. Ann. ICRP 31 (1-3).
- Jones S R (2002). Foetal dosimetry - is the ICRP dosimetric system for humans now complete? J. Radiol. Prot. 22: 1-4.
- Cooper J R, Bailey M R, Fry F A, Harrison J D, McDonnell C E, Meara J R, Phipps A W, Simmonds J R, Stather J W and Tattersall P J (2005). Guidance on the application of dose coefficients for the embryo and fetus from intakes of radionuclides by the mother. Documents of the NRPB 16(2).
- Smith J, Oatway W, Brown I and Sherwood J (2009). PC- CREAM 08 user guide. RPD-EA-9-2009. Health Protection Agency.
- Smith G and Simmonds J R (2009). The methodology for assessing the radiological consequences of routine releases of radionuclides to the environment used in PC-CREAM 08. HPA-RPD-058. Health Protection Agency.
- Smith K R and Jones A L (2003). Generalised habit data for radiological assessments. NRPB Report W41.
- Moore K J, Greenhill B J and Clyne F J (2020). Radiological habits survey: Sellafield review, 2019. Environment Report RL03/20. Cefas, Lowestoft (under contract to the EA and the FSA).
10.6 Appendix Tables
Table A1 - Seafood consumption rates from people associated with marine discharges (2015– 2019 average data)
| Seafood | Consumption rates (kg y-1) critical group (Sellafield fishing community) ref 21 | Consumption rates (kg y-1) consumers associated with Whitehaven fishery ref 14 | Consumption rates (kg y-1) typical seafood consumers (Whitehaven) ref b |
|---|---|---|---|
| Cod | 17.8 | 20 | 7.5 |
| Plaice | 34 | 20 | 7.5 |
| Crabs | 10.6 | 0 | 0 |
| Lobsters | 14.5 | 0 | 0 |
| Nephrops | 10.3 | 9.7 | 0 |
| Winkles | 7.3 | 0 | 0 |
| Mussels | 4.7 | 0 | 0 |
Table A2 - Consumption rates of critical group consumers associated with aerial discharges, 2019
| Foodstuff | Consumption rate (kg y-1)(ref bc) adult | Consumption rate (kg y-1)(ref bc) child | Consumption rate (kg y-1)(ref bc) infant |
|---|---|---|---|
| milk | 95 | 110 | 130 |
| beef | 15 | 15 | 3 |
| beef liver | 2.75 | 1.5 | 0.5 |
| mutton | 25 | 10 | 3 |
| poultry | 10 | 5.5 | 2 |
| game | 6 | 4 | 0.8 |
| fish (cod and plaice) | 15 | 3 | 0.75 |
| leafy vegetables | 15 | 6 | 3.5 |
| potatoes | 50 | 45 | 10 |
| root vegetables | 10 | 6 | 5 |
| legumes | 20 | 8 | 3 |
| domestic fruit | 75 | 50 | 35 |
| wild fruit | 7 | 3 | 1 |
| mushrooms | 3 | 1.5 | 0.6 |
| honey | 2.5 | 2 | 2 |
| eggs | 8.5 | 6.5 | 5 |
a. Based on PHE/FSA recommendations b. Consumption rates for foetal exposure taken to be same as those of adults c. Domestic fruit and beef as high rate consumers
Table A3 - Parameters for calculation of plume immersion and inhalation doses (ref a)
| Adult | Child | Infant | |
|---|---|---|---|
| Occupancy (%) | 100% | 100% | 100% |
| Time indoors % | 50% | 90% | 90% |
| Cloud shielding factor | 0.2 | 0.2 | 0.2 |
| Ground shielding factor | 0.1 | 0.1 | 0.1 |
| Breathing rate (m ref3 a ref 1) | 9,860 | 5,600 | 1\900 |
| Drinking water (l a ref 1) | 600 | 350 | 260 |
a. Foetal dose is calculated from the adult dose multiplied by the ratio of the foetus to the adult dose conversion factors (following NRPB, 2003)(ref 20)
Table A4 - Committed effective doses per unit intake for ingestion
Dose per unit intake (Sv Bq-1)
| Radionuclide | f ref a foetus | 1 y | 10 y | Adult | |
|---|---|---|---|---|---|
| H-3 organic | 1E+00 | 6.3E-11 | 1.2E-10 | 5.7E-11 | 4.2E-11 |
| C-14 | 1E+00 | 8.0E-10 | 1.6E-09 | 8.0E-10 | 5.8E-10 |
| Co-60 | 1E-01 | 1.9E-09 | 2.7E-08 | 1.1E-08 | 3.4E-09 |
| Sr-90 | 3E-01 | 4.6E-08 | 9.3E-08 | 6.6E-08 | 3.1E-08 |
| Zr-95 | 1E-02 | 7.6E-10 | 8.8E-09 | 3.0E-09 | 1.5E-09 |
| Nb-95 | 1E-02 | 3.7E-10 | 3.2E-09 | 1.1E-09 | 5.8E-10 |
| Tc-99 | 5E-01 | 4.6E-10 | 4.8E-09 | 1.3E-09 | 6.4E-10 |
| Ru-106 | 5E-02 | 3.8E-10 | 4.9E-08 | 1.5E-08 | 7.0E-09 |
| Ag-110m | 5E-02 | 2.1E-09 | 1.4E-08 | 5.2E-09 | 2.8E-09 |
| Sb-125 | 1E-01 | 4.7E-10 | 6.1E-09 | 2.1E-09 | 1.1E-09 |
| I-129 | 1E+00 | 4.4E-08 | 2.2E-07 | 1.9E-07 | 1.1E-07 |
| I-131 | 1E+00 | 2.3E-08 | 1.8E-07 | 5.2E-08 | 2.2E-08 |
| Cs-134 | 1E+00 | 8.7E-09 | 1.6E-08 | 1.4E-08 | 1.9E-08 |
| Cs-137 | 1E+00 | 5.7E-09 | 1.2E-08 | 1.0E-08 | 1.3E-08 |
| U-234 | 2E-02 | 1.5E-08 | 1.3E-07 | 7.4E-08 | 4.9E-08 |
| U-235 | 2E-02 | 1.4E-08 | 1.3E-07 | 7.1E-08 | 4.7E-08 |
| U-238 | 2E-02 | 1.3E-08 | 1.5E-07 | 7.5E-08 | 4.8E-08 |
| Np-237 | 5E-04 | 3.6E-09 | 2.1E-07 | 1.1E-07 | 1.1E-07 |
| Pu-238 | 5E-04 | 9.0E-09 | 4.0E-07 | 2.4E-07 | 2.3E-07 |
| Pu-239 | 5E-04 | 9.5E-09 | 4.2E-07 | 2.7E-07 | 2.5E-07 |
| Pu-240 | 5E-04 | 9.5E-09 | 4.2E-07 | 2.7E-07 | 2.5E-07 |
| Pu-241 | 5E-04 | 1.1E-10 | 5.7E-09 | 5.1E-09 | 4.8E-09 |
| Am-241 | 5E-04 | 2.7E-09 | 3.7E-07 | 2.2E-07 | 2.0E-07 |
| Cm-242 | 5E-04 | 4.7E-10 | 7.6E-08 | 2.4E-08 | 1.2E-08 |
| Cm-243 | 5E-04 | 1.5E-07 | 3.3E-07 | 1.6E-07 | 1.5E-07 |
| Cm-244 | 5E-04 | 2.2E-09 | 2.9E-07 | 1.4E-07 | 1.2E-07 |
| Plutonium and americium values for application to the consumption of Cumbrian winkles | |||||
|---|---|---|---|---|---|
| Pu-238 | 2E-04 | 3.6E-09 | 1.6E-07 | 9.6E-08 | 9.2E-08 |
| Pu-239 | 2E-04 | 3.8E-09 | 1.7E-07 | 1.1E-07 | 1.0E-07 |
| Pu-240 | 2E-04 | 3.8E-09 | 1.7E-07 | 1.1E-07 | 1.0E-07 |
| Pu-241 | 2E-04 | 4.4E-11 | 2.3E-09 | 2.0E-09 | 1.9E-09 |
| Am-241 | 2E-04 | 1.1E-09 | 1.5E-07 | 8.8E-08 | 8.0E-08 |
a. The gastro-intestinal absorption factor does not apply to neonates or infants aged below about one year.
Table A5 - Committed effective doses per unit intake for inhalation
Dose per unit intake (Sv Bq-1)|
| Radionuclide | Lung absorption type | f a 1 | Foetus | 1 y | 10 y | Adult | Basis for choice of lung absorption type |
|---|---|---|---|---|---|---|---|
| H-3 organic | V | 1E+00 | 6.3E-11 | 1.1E-10 | 5.5E-11 | 4.1E-11 | Organically bound tritium |
| C-14 | M | 1E-01 | 6.6E-11 | 6.6E-09 | 2.8E-09 | 2.0E-09 | ICRP recommended default |
| Co-60 | M | 1E-01 | 1.2E-09 | 3.4E-08 | 1.5E-08 | 1.0E-08 | ICRP recommended default |
| Sr-90 | M | 1E-01 | 1.0E-08 | 1.2E-07 | 5.4E-08 | 3.8E-08 | ICRP recommended default |
| Zr-95 | M | 1E-03 | 4.6E-10 | 2.1E-08 | 9.0E-09 | 6.3E-09 | ICRP recommended default |
| Nb-95 | M | 1E-02 | 1.6E-10 | 5.2E-09 | 2.2E-09 | 1.5E-09 | ICRP recommended default |
| Tc-99 | M | 1E-01 | 8.3E-11 | 1.3E-08 | 5.7E-09 | 4.0E-09 | ICRP recommended default |
| Ru-106 | M | 5E-02 | 4.1E-10 | 1.1E-07 | 4.1E-08 | 2.8E-08 | ICRP recommended default |
| Ag-110m | M | 5E-02 | 1.5E-09 | 2.8E-08 | 1.2E-08 | 7.6E-09 | ICRP recommended default |
| Sb-125 | M | 1E-02 | 2.6E-10 | 1.6E-08 | 6.8E-09 | 4.8E-09 | ICRP recommended default |
| I-129 | F | 1E+00 | 1.5E-08 | 8.6E-08 | 6.7E-08 | 3.6E-08 | ICRP recommended default |
| I-131 | F | 1E+00 | 8.1E-09 | 7.2E-08 | 1.9E-08 | 7.4E-09 | ICRP recommended default |
| Cs-134 | F | 1E+00 | 3.0E-09 | 7.3E-09 | 5.3E-09 | 6.6E-09 | ICRP recommended default |
| Cs-137 | F | 1E+00 | 2.0E-09 | 5.4E-09 | 3.7E-09 | 4.6E-09 | ICRP recommended default |
| U-234 | M | 2E-02 | 4.9E-08 | 1.1E-05 | 4.8E-06 | 3.5E-06 | ICRP recommended default |
| U-235 | M | 2E-02 | 4.5E-08 | 1.0E-05 | 4.3E-06 | 3.1E-06 | ICRP recommended default |
| U-238 | M | 2E-02 | 4.4E-08 | 9.4E-06 | 4.0E-06 | 2.9E-06 | ICRP recommended default |
| Pu-238 | M | 5E-04 | 1.1E-06 | 7.4E-05 | 4.4E-05 | 4.6E-05 | ICRP recommended default |
| Pu-239 | M | 5E-04 | 1.2E-06 | 7.7E-05 | 4.8E-05 | 5.0E-05 | ICRP recommended default |
| Pu-240 | M | 5E-04 | 1.2E-06 | 7.7E-05 | 4.8E-05 | 5.0E-05 | ICRP recommended default |
| Pu-241 | M | 5E-04 | 1.4E-08 | 9.7E-07 | 8.3E-07 | 9.0E-07 | ICRP recommended default |
| Am-241 | M | 5E-04 | 3.2E-07 | 6.9E-05 | 4.0E-05 | 4.2E-05 | ICRP recommended default |
| Cm-242 | M | 5E-04 | 5.1E-08 | 1.8E-05 | 7.3E-06 | 5.2E-06 | ICRP recommended default |
| Cm-243 | M | 5E-04 | 3.1E-05 | 6.1E-05 | 3.1E-05 | 3.1E-05 | ICRP recommended default |
| Cm-244 | M | 5E-04 | 2.6E-07 | 5.7E-05 | 2.7E-05 | 2.7E-05 | ICRP recommended default |
a. The gastro-intestinal absorption factor does not apply to neonates or infants aged below about one year.
Table A6 - Collective dose commitment from Sellafield Ltd site (man Sv per Bq discharged, integrated to 500 years): atmospheric discharges
| Radionuclide | Sellafield | ||
|---|---|---|---|
| UK | EUa | World | |
| H-3 | 6.7E-16 | 1.2E-15 | 1.5E-15 |
| C-14 | 2.0E-13 | 1.0E-12 | 1.3E-11 |
| Kr-85 | 4.3E-18 | 1.5E-17 | 2.6E-16 |
| Sr-90 | 1.9E-12 | 8.8E-12 | 8.8E-12 |
| Ru-106 | 3.1E-13 | 4.2E-13 | 4.2E-13 |
| Sb-125 | 1.2E-13 | 1.7E-13 | 1.7E-13 |
| I-129 | 4.5E-11 | 2.1E-10 | 2.9E-10 |
| I-131 | 7.8E-13 | 4.8E-13 | 4.8E-13 |
| Cs-137 | 1.8E-12 | 6.1E-12 | 6.1E-12 |
| Pu-239 Pu-240 | 1.7E-10 | 2.4E-10 | 2.4E-10 |
| Pu-241 | 3.0E-12 | 4.4E-12 | 4.4E-12 |
| Am-241 | 1.4E-10 | 2.0E-10 | 2.0E-10 |
a. EU is defined as the population of the EU12 member states, 360 million 19
Table A7 - Collective dose commitment from Sellafield Ltd site (man Sv per Bq discharged, integrated to 500 years): liquid dischargesᵃ
| Radionuclide | Sellafield | ||
|---|---|---|---|
| UK | EU b | World | |
| H-3 | 4.6E-19 | 1.9E-18 | 3.5E-17 |
| C-14 | 2.0E-13 | 6.6E-13 | 6.8E-12 |
| Co-60 | 6.7E-14 | 1.9E-13 | 2.4E-13 |
| Sr-90 | 7.0E-16 | 1.8E-15 | 3.0E-15 |
| Zr-95 | 7.3E-17 | 1.5E-16 | 1.6E-16 |
| Nb-95 | 1.7E-17 | 3.5E-17 | 3.8E-17 |
| Tc-99 | 2.5E-15 | 7.6E-15 | 9.5E-15 |
| Ru-106 | 1.9E-14 | 5.1E-14 | 5.6E-14 |
| I-129 | 1.9E-14 | 5.7E-14 | 2.2E-13 |
| Cs-134 | 1.3E-14 | 3.0E-14 | 4.6E-14 |
| Cs-137 | 1.6E-14 | 4.1E-14 | 7.1E-14 |
| Ce-144 | 6.9E-17 | 1.8E-16 | 2.0E-16 |
| Pu-239 Pu-240 | 3.0E-13 | 8.4E-13 | 9.8E-13 |
| Pu-241 | 2.5E-14 | 7.1E-14 | 7.9E-14 |
| Am-241 | 1.3E-12 | 3.6E-12 | 3.9E-12 |
| Cm-242 | 2.3E-15 | 6.1E-15 | 6.8E-15 |
| Cm-243 Cm-244 | 4.3E-14 | 1.1E-13 | 1.2E-13 |
a. The collective dose factors include the contribution from the first decay product where appropriate. b. EU is defined as the population of the EU12 member states, 360 million 19
11. Appendix B
11.1 Supporting monitoring and dose data
Table B1 - Radioactivity in seaweed, 2019
Mean radionuclide concentration (Bq kg-1 wet weight)
| Species | Location | Total Alpha | Total Beta | 14Ca | 60Co | 90Sr | 99Tc | 106Ru | 125Sb | 129I | 134Cs | 137Cs | U(() | Pu(() | 241Am |
|---|---|---|---|---|---|---|---|---|---|---|---|---|---|---|---|
| Fucus vesiculosis | Nethertown | 15 | 270 | 34 | 0.17 | 0.46 | 820 | <0.48 | - | 2.3 | <0.06 | 2.0 | 3.3 | 9.2 | 2.7 |
| Drigg Barnscar | 30 | 310 | 98 | 0.33 | 1.0 | 1,300 | <0.65 | 0.19 | 6.7 | <0.07 | 1.9 | 4.3 | 18 | 4.9 | |
| Walney Island | 13 | 250 | 33 | 0.09 | 0.51 | 720 | <0.47 | - | <2.0 | <0.06 | 1.8 | 3.3 | 5.8 | 1.3 | |
| Porphyra umbilicalis | St Bees | 3.2 | 150 | 36 | - | 0.22 | 2.7 | <0.78 | - | - | <0.06 | 0.57 | 0.17 | 1.1 | 1.9 |
| Braystones | 6.2 | 170 | 33 | 0.06 | 0.20 | 2.0 | 1.6 | - | - | <0.06 | 0.70 | 0.23 | 2.5 | 2.9 | |
| Sellafield | 5.9 | 160 | 65 | 0.04 | 0.24 | 4.4 | 1.0 | - | - | <0.05 | 0.57 | 0.17 | 1.8 | 2.8 | |
| Seascale Neb | 15 | 150 | 52 | 0.11 | 0.57 | 4.6 | 1.5 | - | - | <0.07 | 1.2 | 0.24 | 3.0 | 4.9 | |
| St. Bees - Selker (Av) | 6.5 | 160 | 47 | 0.07 | 0.31 | 3.4 | 1.2 | - | - | <0.06 | 0.77 | 0.20 | 2.1 | 3.1 |
a. 14C data include natural background
Table B2 - Radioactivity in coastal samples of seawater from the Irish Sea, 2019
Mean radionuclide concentration (Bq litre 1)
| Location | Total Alpha | Total Beta | 3H | 14C | 90Sr | 99Tc | 129I | 137Cs | U(() | 237Np | Pu(( ) | 241Pu | 241Am | |
|---|---|---|---|---|---|---|---|---|---|---|---|---|---|---|
| St Bees | filtrate | <2.9 | 10 | 4.1 | <0.65 | 0.02 | 0.01 | <0.03 | 0.04 | 0.12 | <0.0007 | 0.004 | 0.06 | 0.002 |
| solids | 0.20 | 0.13 | - | - | 0.007 | - | - | 0.02 | 0.002 | 0.00005 | 0.04 | 0.15 | 0.06 | |
| Sellafield filtrate | <2.6 | 9.3 | 6.5 | <0.57 | 0.03 | 0.02 | <0.04 | 0.04 | 0.10 | <0.0007 | 0.004 | <0.06 | 0.002 | |
| solids | 0.26 | 0.18 | - | - | 0.009 | - | - | 0.03 | 0.003 | 0.00008 | 0.06 | 0.21 | 0.10 | |
| Seascale Neb | filtrate | <3.1 | 9.6 | 3.9 | <0.65 | 0.03 | 0.01 | <0.03 | 0.04 | 0.11 | <0.0007 | 0.004 | 0.07 | 0.002 |
| solids | 0.29 | 0.18 | - | - | 0.01 | - | - | 0.03 | 0.004 | 0.00009 | 0.07 | 0.25 | 0.12 | |
| Drigg Barnscar | filtrate | <3.1 | 9.1 | 4.7 | <0.66 | 0.03 | 0.01 | <0.03 | 0.04 | 0.11 | <0.0007 | 0.004 | <0.06 | 0.002 |
| solids | 0.41 | 0.28 | - | - | 0.02 | - | - | 0.05 | 0.005 | 0.00001 | 0.11 | 0.43 | 0.19 |
Table B3 - Radioactivity in sediment from the West Cumbrian Coast, 2019
Mean radionuclide concentration (Bq kg-1 dry weight)
| Location | Total Alpha | Total Beta | 60Co | 90Sr | 99Tc | 106Ru | 134Cs | 137Cs | U(( ) | Pu(( ) | 241Pu | 241Am | ||
|---|---|---|---|---|---|---|---|---|---|---|---|---|---|---|
| Sand | St Bees | 430 | 400 | 0.37 | - | - | <1.2 | <0.12 | 48 | - | 120 | - | 130 | |
| Braystones | 470 | 500 | 0.31 | - | - | <1.1 | <0.12 | 31 | - | 100 | - | 130 | ||
| Sellafield | 420 | 340 | 0.30 | - | - | <1.0 | <0.11 | 24 | - | 98 | - | 110 | ||
| Seascale Neb | 350 | 360 | 0.26 | - | - | <1.0 | <0.12 | 21 | - | 87 | - | 100 | ||
| Drigg Barnscar | 400 | 470 | 0.27 | - | - | <0.96 | <0.11 | 15 | - | 83 | - | 100 | ||
| Silt | Ravenglass Ford | 1,000 | 570 | <1.4 | 14 | 12 | <16 | <1.5 | 66 | 40 | 210 | 730 | 300 | |
| Ravenglass Garth | 1,000 | 510 | <1.7 | 14 | 18 | <19 | <1.8 | 80 | 51 | 180 | 530 | 220 | ||
| Ravenglass Opp Raven Villa | 1,200 | 840 | <1.6 | 20 | 17 | <16 | <1.8 | 91 | 49 | 240 | 830 | 340 | ||
| Eskmeals, R Esk south bank downstream of viaduct | 1,400 | 1,100 | <1.6 | 21 | 23 | <17 | <1.7 | 130 | 48 | 310 | 950 | 460 | ||
| Eskmeals Newbiggin Marsh | 1,500 | 1,100 | <1.4 | 42 | 30 | <16 | <1.5 | 210 | 59 | 380 | 1,300 | 620 | ||
| R Esk Muncaster Rd Bridge; Downstream | 1,800 | 900 | 1.8 | 37 | 30 | <16 | <1.6 | 260 | 59 | 420 | 1,400 | 640 | ||
| Whitehaven Outer Harbour (south) | 1,000 | 370 | <0.61 | 1.2 | 6.2 | <6.7 | <0.69 | 54 | 25 | 110 | 340 | 170 | ||
| Silt from R Calder | 450 | 590 | <0.73 | 2.7 | 1.7 | <9.0 | <0.88 | 46 | 37 | 79 | 210 | 71 | ||
| Silt from R Ehen | 2,100 | 780 | <1.3 | 14 | 16 | <16 | <1.6 | 500 | 71 | 710 | 1,800 | 990 | ||
| Waberthwaite | 1,900 | 700 | <1.4 | 27 | 14 | <15 | <1.6 | 100 | 52 | 300 | 970 | 700 |
Table B4 - Radioactivity in total deposition, 2019
Mean radionuclide concentration (Bq m-3)
| Location | Total Alpha | Total Beta | 3H | 90Sr | 106Ru | 125Sb | 134Cs | 137Cs | Pu(() | 241Am |
|---|---|---|---|---|---|---|---|---|---|---|
| Calder Gate | 18 | <170 | 3,700 | 2.1 | <48 | <13 | <5.5 | <7.7 | 0.56 | 0.70 |
| Met Station | 24 | 220 | 4,500 | 31 | <46 | <12 | <5.3 | 110 | 0.86 | 1.1 |
| North Gate | 18 | 400 | 7,100 | 85 | <46 | <13 | <5.3 | 98 | 0.66 | 1.1 |
| South Side | 21 | <480 | <4,100 | 1.3 | <43 | <11 | <5.0 | <4.3 | 0.63 | 0.87 |
| West Ring Road | 22 | 240 | <4,500 | 15 | <53 | <13 | <6.1 | 9.5 | 0.55 | 1.1 |
Table B5 - Radioactivity in grass, 2019
Mean radionuclide concentration (Bq kg-1 wet weight)
| Location | Total alpha | Total beta | 3H | 14C Total a | 14C Net b | 90Sr | 99Tc | 106Ru | 125Sb | 134Cs | 137Cs | U(() | Pu(() | 241Am |
|---|---|---|---|---|---|---|---|---|---|---|---|---|---|---|
| Calder Gate | 6.9 | 110 | 4.9 | 30 | 2.5 | 2.2 | 1.1 | <0.98 | <0.46 | <0.12 | 5.9 | 0.28 | 0.30 | 0.40 |
| Met Station | 5.6 | 130 | 6.9 | 30 | <1.1 | 10 | 1.8 | <0.99 | <0.30 | <0.11 | 9.3 | 0.23 | 0.61 | 0.41 |
| North Gate | 3.8 | 130 | 14 | 30 | 2.0 | 30 | 2.1 | <1.0 | <0.37 | <0.11 | 32 | 0.16 | 0.51 | 0.22 |
| South Side | 4.5 | 110 | 7.2 | 22 | <0.83 | 0.82 | 1.1 | <0.97 | <0.26 | <0.11 | 1.2 | 0.29 | 0.10 | 0.09 |
| West Ring Road | 3.4 | 130 | 3.8 | 28 | <1.1 | 1.7 | 2.0 | <0.89 | <0.25 | <0.11 | 2.2 | 0.20 | 0.33 | 0.37 |
a. 14C data includes background. b. Excluding natural background calculated assuming 218 Bq natural 14C per kg carbon.
Table B6. Radioactivity in soil, 2019
Mean radionuclide concentration (Bq kg-1 wet weight)
| Location | Total alpha | Total beta | 3H | 14C Total a | 14C Net b | 90Sr | 106Ru | 125Sb | 134Cs | 137Cs | U(() | Pu(() | 241Am |
|---|---|---|---|---|---|---|---|---|---|---|---|---|---|
| Calder Gate | 720 | 530 | 2.0 | 5.1 | 1.7 | 2.3 | <9.9 | <2.7 | <1.0 | 42 | 52 | 19 | 4.5 |
| Met Station | 650 | 900 | 3.0 | 5.1 | 0.57 | 11 | <12 | <3.6 | <1.2 | 230 | 69 | 140 | 50 |
| North Gate | 790 | 900 | 3.2 | 5.9 | 1.8 | 22 | <15 | <5.0 | <1.5 | 370 | 65 | 230 | 41 |
| South Side | 640 | 580 | 4.9 | 8.8 | <0.40 | 2.4 | <16 | <4.0 | <1.5 | 53 | 75 | 8.5 | 13 |
| West Ring Road | 410 | 580 | 2.1 | 4.0 | <0.20 | 1.9 | <12 | <3.2 | <1.4 | 49 | 91 | 26 | 12 |
a. 14C data includes background. b. Excluding natural background calculated assuming 218 Bq natural 14C per kg carbon.
Table B7 - Summary of doses to marine critical group from marine foodstuffs (µSv), 2019
| Cod a | Plaice | Lobsters | Crabs | |||||||||||||
|---|---|---|---|---|---|---|---|---|---|---|---|---|---|---|---|---|
| Radionuclide | Adult | Child | Infant | Foetus | Adult | Child | Infant | Foetus | Adult | Child | Infant | Foetus | Adult | Child | Infant | Foetus |
| Carbon-14b | - | - | - | - | 1.3 | 0.35 | 0.17 | 1.7 | 0.34 | 0.09 | 0.05 | 0.46 | 0.24 | 0.07 | 0.03 | 0.33 |
| Cobalt-60 | - | - | - | - | - | - | - | - | - | - | - | - | - | - | - | - |
| Strontium-90 | - | - | - | - | - | - | - | - | - | - | - | - | 0.01 | 0.006 | 0.002 | 0.02 |
| Technetium-99 | - | - | - | - | 0.05 | 0.02 | 0.02 | 0.04 | 0.62 | 0.25 | 0.23 | 0.45 | 0.04 | 0.02 | 0.01 | 0.03 |
| Ruthenium-106 | - | - | - | - | 0.04 | 0.02 | 0.02 | 0.002 | - | - | - | - | 0.06 | 0.03 | 0.02 | 0.003 |
| Silver-110m | - | - | - | - | - | - | - | - | - | - | - | - | - | - | - | - |
| Antimony-125 | - | - | - | - | - | - | - | - | 0.41 | 0.14 | 0.04 | 0.17 | - | - | - | - |
| Iodine-129 | - | - | - | - | - | - | - | - | - | - | - | - | - | - | - | |
| Caesium-137 | - | - | - | - | 0.69 | 0.11 | 0.03 | 0.30 | 0.13 | 0.02 | 0.006 | 0.06 | 0.06 | 0.01 | 0.003 | 0.03 |
| Neptunium-237 | - | - | - | - | - | - | - | - | - | - | - | - | - | - | - | - |
| Plutonium-alpha | - | - | - | - | 0.06 | 0.01 | 0.005 | 0.002 | 0.33 | 0.07 | 0.03 | 0.01 | 0.37 | 0.08 | 0.03 | 0.01 |
| Plutonium-241 | - | - | - | - | - | - | - | - | - | - | - | - | - | - | - | - |
| Americium-241 | - | - | - | - | 0.10 | 0.02 | 0.009 | 0.001 | 2.1 | 0.45 | 0.19 | 0.03 | 0.83 | 0.18 | 0.08 | 0.01 |
| Curium-alpha | - | - | - | - | - | - | - | - | - | - | - | - | - | - | - | - |
| Total | - | - | - | - | 2.2 | 0.53 | 0.25 | 2.1 | 3.9 | 1.0 | 0.54 | 1.2 | 1.6 | 0.38 | 0.18 | 0.43 |
Table B7. Summary of doses to marine critical group from marine foodstuffs (µSv), 2019 Cont.
| Nephrops | Winkles | Mussells | ||||||||||
|---|---|---|---|---|---|---|---|---|---|---|---|---|
| Radionuclide | Adult | Child | Infant | Foetus | Adult | Child | Infant | Foetus | Adult | Child | Infant | Foetus |
| Carbon-14b | 0.29 | 0.08 | 0.04 | 0.40 | 0.33 | 0.09 | 0.05 | 0.46 | 0.24 | 0.07 | 0.03 | 0.33 |
| Cobalt-60 | - | - | - | - | 0.01 | 0.007 | 0.004 | 0.006 | 0.003 | 0.002 | 0.001 | 0.002 |
| Strontium-90 | - | - | - | - | 0.25 | 0.11 | 0.04 | 0.37 | 0.06 | 0.02 | 0.009 | 0.08 |
| Technetium-99 | 0.27 | 0.11 | 0.10 | 0.19 | 0.21 | 0.09 | 0.08 | 0.15 | 0.09 | 0.04 | 0.03 | 0.06 |
| Ruthenium-106 | - | - | - | - | 0.07 | 0.03 | 0.03 | 0.004 0.06 | 0.02 | 0.02 | 0.003 | |
| Silver-110m | - | - | - | - | - | - | - | - | - | - | - | - |
| Antimony-125 | - | - | - | - | 0.002 | 0.0008 | 0.0006 | 0.0009 | 0.001 | 0.0004 | 0.0003 | 0.0005 |
| Iodine-129 | - | - | - | - | 0.10 | 0.04 | 0.01 | 0.04 | - | - | - | - |
| Caesium-137 | 0.13 | 0.02 | 0.006 | 0.06 | 0.27 | 0.04 | 0.01 | 0.12 | 0.06 | 0.009 | 0.003 | 0.03 |
| Neptunium-237 | - | - | - | - | 0.006 | 0.001 | 0.0006 | 0.0002 | - | - | - | - |
| Plutonium-alpha | 2.2 | 0.48 | 0.19 | 0.08 | 4.2 | 0.91 | 0.39 | 0.16 | 2.8 | 0.61 | 0.24 | 0.11 |
| Plutonium-241 | - | - | - | - | 0.28 | 0.06 | 0.02 | 0.006 | 0.23 | 0.05 | 0.01 | 0.005 |
| Americium-241 | 6.8 | 1.5 | 0.63 | 0.09 | 5.8 | 1.3 | 0.62 | 0.08 | 4.2 | 0.93 | 0.39 | 0.06 |
| Curium-alpha | - | - | - | - | 0.07 | 0.01 | 0.008 | 0.07 | - | - | - | - |
| Total | 9.7 | 2.2 | 0.96 | 0.82 | 12 | 2.7 | 1.1 | 1.5 | 7.8 | 1.8 | 0.74 | 0.68 |
a. No cod landed during 2019. Total adult dose from cod in 2018 was 1.1 microSv. b. Calculated using background corrected activity concentrations (see Monitoring chapter, paragraph 18).
Table B8 - Summary of doses to terrestrial critical group from terrestrial foodstuffs and inhalation (µSv)a, 2019
| Milk | Beef Muscle | Beef Offal | Sheep Muscle | |||||||||||||
|---|---|---|---|---|---|---|---|---|---|---|---|---|---|---|---|---|
| Radionuclide | Adult | Child | Infant | Foetus | Adult | Child | Infant | Foetus | Adult | Child | Infant | Foetus | Adult | Child | Infant | Foetus |
| Total tritium | 0.01 | 0.02 | 0.04 | 0.01 | 0.007 | 0.009 | 0.004 | 0.01 | <0.001 | <0.001 | <0.001 | 0.001 | 0.003 | 0.002 | 0.001 | 0.005 |
| Carbon-14 b | 0.03 | 0.04 | 0.10 | 0.04 | - | - | - | - | 0.003 | 0.002 | 0.002 | 0.004 | - | - | - | - |
| Cobalt-60 | - | - | - | - | 0.002 | 0.007 | 0.003 | 0.001 | <0.001 | 0.001 | <0.001 | <0.001 | 0.004 | 0.006 | 0.004 | 0.002 |
| Strontium-90 | 0.09 | 0.22 | 0.36 | 0.13 | 0.009 | 0.02 | 0.006 | 0.01 | 0.002 | 0.002 | <0.001 | 0.003 | 0.02 | 0.02 | 0.008 | 0.03 |
| Technetium-99 | - | - | - | - | <0.001 | 0.001 | <0.001 | <0.001 | <0.001 | <0.001 | <0.001 | <0.001 | <0.001 | <0.001 | <0.001 | <0.001 |
| Ruthenium-106c | <0.001 | <0.001 | <0.001 | <0.001 | <0.001 | <0.001 | <0.001 | <0.001 | <0.001 | <0.001 | <0.001 | <0.001 | <0.001 | <0.001 | <0.001 | <0.001 |
| Antimony-125 | 0.01 | 0.02 | 0.08 | 0.004 | 0.001 | 0.003 | 0.002 | <0.001 | <0.001 | <0.001 | <0.001 | <0.001 | 0.003 | 0.002 | 0.002 | 0.001 |
| Iodine-129 | 0.10 | 0.21 | 0.29 | 0.04 | 0.03 | 0.06 | 0.01 | 0.01 | 0.006 | 0.006 | 0.002 | 0.002 | 0.06 | 0.04 | 0.01 | 0.02 |
| Iodine-131ᶜ | 0.001 | 0.004 | 0.02 | 0.001 | <0.001 | <0.001 | <0.001 | <0.001 | <0.001 | <0.001 | <0.001 | <0.001 | <0.001 | <0.001 | <0.001 | <0.001 |
| Caesium-134 | - | - | - | - | 0.01 | 0.008 | 0.002 | 0.005 | 0.004 | 0.001 | <0.001 | 0.002 | 0.02 | 0.006 | 0.002 | 0.009 |
| Caesium-137 | 0.05 | 0.04 | 0.06 | 0.02 | 0.09 | 0.07 | 0.02 | 0.04 | 0.01 | 0.005 | 0.002 | 0.005 | 0.88 | 0.27 | 0.10 | 0.38 |
| Plutonium-alpha | - | - | - | - | 0.001 | 0.002 | <0.001 | <0.001 | 0.009 | 0.006 | 0.003 | <0.001 | 0.002 | <0.001 | <0.001 | <0.001 |
| Plutonium-241 | - | - | - | - | - | - | - | - | 0.004 | 0.002 | <0.001 | <0.001 | - | - | - | - |
| Americium-241 | - | - | - | - | 0.003 | 0.003 | 0.001 | <0.001 | 0.02 | 0.01 | 0.006 | <0.001 | 0.002 | <0.001 | <0.001 | <0.001 |
| Total | 0.29 | 0.56 | 0.95 | 0.25 | 0.16 | 0.19 | 0.05 | 0.08 | 0.06 | 0.04 | 0.02 | 0.03 | 1.0 | 0.35 | 0.13 | 0.45 |
Table B8 - Summary of doses to terrestrial critical group from terrestrial foodstuffs and inhalation (µSv)a, 2019 Cont.
| Sheep offal | Poultry | Eggs | Game | |||||||||||||
|---|---|---|---|---|---|---|---|---|---|---|---|---|---|---|---|---|
| Radionuclide | Adult | Child | Infant | Foetus | Adult | Child | Infant | Foetus | Adult | Child | Infant | Foetus | Adult | Child | Infant | Foetus |
| Total tritium | <0.001 | <0.001 | <0.001 | <0.001 | - | - | - | - | 0.002 | 0.002 | 0.003 | 0.003 | 0.002 | 0.001 | <0.001 | 0.002 |
| Carbon-14b | - | - | - | - | - | - | - | - | - | - | - | - | 0.04 | 0.03 | 0.01 | 0.05 |
| Cobalt-60 | <0.001 | <0.001 | <0.001 | <0.001 | 0.002 | 0.004 | 0.004 | 0.001 | 0.001 | 0.003 | 0.005 | <0.001 | 0.001 | 0.002 | 0.001 | <0.001 |
| Strontium-90 | 0.002 | 0.002 | <0.001 | 0.003 | 0.02 | 0.02 | 0.009 | 0.02 | 0.008 | 0.01 | 0.01 | 0.01 | 0.007 | 0.01 | 0.003 | 0.01 |
| Technetium-99 | <0.001 | <0.001 | <0.001 | <0.001 | 0.001 | 0.002 | 0.002 | <0.001 | - | - | - | - | <0.001 | <0.001 | <0.001 | <0.001 |
| Ruthenium-106c | <0.001 | <0.001 | <0.001 | <0.001 | <0.001 | <0.001 | <0.001 | <0.001 | <0.001 | <0.001 | <0.001 | <0.001 | <0.001 | <0.001 | <0.001 | <0.001 |
| Antimony-125 | <0.001 | <0.001 | <0.001 | <0.001 | 0.001 | 0.002 | 0.002 | <0.001 | <0.001 | 0.001 | 0.002 | <0.001 | <0.001 | <0.001 | <0.001 | <0.001 |
| Iodine-129 | 0.006 | 0.006 | 0.002 | 0.002 | 0.07 | 0.06 | 0.03 | 0.03 | 0.02 | 0.02 | 0.02 | 0.007 | 0.008 | 0.009 | 0.002 | 0.003 |
| Iodine-131c | <0.001 | <0.001 | <0.001 | <0.001 | <0.001 | <0.001 | <0.001 | <0.001 | <0.001 | <0.001 | <0.001 | <0.001 | <0.001 | <0.001 | <0.001 | <0.001 |
| Caesium-134 | 0.002 | <0.001 | <0.001 | <0.001 | 0.01 | 0.004 | 0.002 | 0.004 | 0.005 | 0.003 | 0.002 | 0.002 | 0.005 | 0.002 | <0.001 | 0.002 |
| Caesium-137 | 0.04 | 0.02 | 0.007 | 0.02 | 0.01 | 0.005 | 0.002 | 0.005 | 0.007 | 0.004 | 0.004 | 0.003 | 0.13 | 0.06 | 0.02 | 0.06 |
| Plutonium-alpha | 0.002 | 0.001 | <0.001 | <0.001 | 0.002 | <0.001 | <0.001 | <0.001 | <0.001 | <0.001 | <0.001 | <0.001 | <0.001 | <0.001 | <0.001 | <0.001 |
| Plutonium-241 | - | - | - | - | - | - | - | - | - | - | - | - | - | - | - | - |
| Americium-241 | 0.002 | <0.001 | <0.001 | <0.001 | <0.001 | <0.001 | <0.001 | <0.001 | <0.001 | <0.001 | <0.001 | <0.001 | <0.001 | <0.001 | <0.001 | <0.001 |
| Total | 0.06 | 0.04 | 0.02 | 0.03 | 0.12 | 0.10 | 0.06 | 0.07 | 0.05 | 0.05 | 0.05 | 0.03 | 0.20 | 0.12 | 0.04 | 0.13 |
| Honey | Mushroom | Potato | Root Vegetables | |||||||||||||
|---|---|---|---|---|---|---|---|---|---|---|---|---|---|---|---|---|
| Radionuclide | Adult | Child | Infant | Foetus | Adult | Child | Infant | Foetus | Adult | Child | Infant | Foetus | Adult | Child | Infant | Foetus |
| Total tritium | - | - | - | - | <0.001 | <0.001 | <0.001 | <0.001 | 0.009 | 0.01 | 0.005 | 0.01 | <0.001 | <0.001 | 0.001 | 0.001 |
| Carbon-14 b | 0.01 | 0.02 | 0.03 | 0.02 | 0.01 | 0.008 | 0.007 | 0.02 | 0.02 | 0.02 | 0.009 | 0.02 | 0.02 | 0.02 | 0.03 | 0.03 |
| Cobalt-60 | <0.001 | <0.001 | 0.001 | <0.001 | <0.001 | <0.001 | <0.001 | <0.001 | 0.009 | 0.02 | 0.01 | 0.005 | 0.002 | 0.003 | 0.007 | <0.001 |
| Strontium-90 | 0.003 | 0.005 | 0.007 | 0.005 | 0.003 | 0.003 | 0.002 | 0.004 | 0.05 | 0.09 | 0.03 | 0.07 | 0.02 | 0.02 | 0.03 | 0.03 |
| Technetium-99 | - | - | - | - | - | - | - | - | 0.001 | 0.002 | 0.002 | <0.001 | <0.001 | <0.001 | 0.001 | <0.001 |
| Ruthenium-106c | <0.001 | <0.001 | <0.001 | <0.001 | <0.001 | <0.001 | <0.001 | <0.001 | <0.001 | 0.001 | <0.001 | <0.001 | <0.001 | <0.001 | <0.001 | <0.001 |
| Antimony-125 | <0.001 | <0.001 | <0.001 | <0.001 | <0.001 | <0.001 | <0.001 | <0.001 | 0.006 | 0.009 | 0.006 | 0.002 | 0.001 | 0.001 | 0.003 | <0.001 |
| Iodine-129 | 0.006 | 0.008 | 0.009 | 0.002 | 0.007 | 0.006 | 0.003 | 0.003 | 0.11 | 0.17 | 0.04 | 0.04 | 0.02 | 0.02 | 0.02 | 0.009 |
| Iodine-131c | <0.001 | <0.001 | <0.001 | <0.001 | <0.001 | <0.001 | <0.001 | <0.001 | <0.001 | <0.001 | <0.001 | <0.001 | <0.001 | <0.001 | <0.001 | <0.001 |
| Caesium-134 | 0.001 | <0.001 | <0.001 | <0.001 | 0.002 | <0.001 | <0.001 | <0.001 | 0.04 | 0.03 | 0.006 | 0.02 | 0.009 | 0.004 | 0.004 | 0.004 |
| Caesium-137 | 0.002 | 0.001 | 0.001 | <0.001 | 0.003 | 0.001 | <0.001 | 0.001 | 0.05 | 0.04 | 0.01 | 0.02 | 0.009 | 0.004 | 0.004 | 0.004 |
| Plutonium-alpha | <0.001 | <0.001 | <0.001 | <0.001 | <0.001 | <0.001 | <0.001 | 0.001 | - | - | - | - | <0.001 | <0.001 | <0.001 | <0.001 |
| Plutonium-241 | - | - | - | - | - | - | - | - | - | - | - | - | - | - | - | - |
| Americium-241 | <0.001 | <0.001 | <0.001 | <0.001 | <0.001 | <0.001 | <0.001 | <0.001 | - | - | - | - | <0.001 | <0.001 | <0.001 | <0.001 |
| Total | 0.03 | 0.04 | 0.05 | 0.04 | 0.03 | 0.03 | 0.02 | 0.04 | 0.30 | 0.39 | 0.12 | 0.19 | 0.09 | 0.08 | 0.10 | 0.09 |
| Green Vegetables | Domestic Fruit | Wild Fruit | Legumes | |||||||||||||
|---|---|---|---|---|---|---|---|---|---|---|---|---|---|---|---|---|
| Radionuclide | Adult | Child | Infant | Foetus | Adult | Child | Infant | Foetus | Adult | Child | Infant | Foetus | Adult | Child | Infant | Foetus |
| Total tritium | 0.001 | <0.001 | <0.001 | 0.002 | 0.01 | 0.01 | 0.02 | 0.02 | 0.001 | <0.001 | <0.001 | 0.002 | 0.002 | <0.001 | <0.001 | 0.003 |
| Carbon-14 b | 0.05 | 0.03 | 0.03 | 0.07 | 0.36 | 0.33 | 0.47 | 0.50 | 0.05 | 0.03 | 0.02 | 0.08 | - | - | - | - |
| Cobalt-60 | 0.004 | 0.005 | 0.007 | 0.002 | 0.03 | 0.06 | 0.10 | 0.02 | 0.002 | 0.002 | 0.002 | <0.001 | 0.004 | 0.005 | 0.005 | 0.002 |
| Strontium-90 | 0.05 | 0.04 | 0.04 | 0.08 | 0.22 | 0.32 | 0.31 | 0.33 | 0.01 | 0.01 | 0.006 | 0.02 | 0.20 | 0.17 | 0.09 | 0.30 |
| Technetium-99 | - | - | - | - | 0.003 | 0.004 | 0.01 | 0.002 | - | - | - | - | - | - | - | - |
| Ruthenium-106 c | <0.001 | <0.001 | <0.001 | <0.001 | <0.001 | <0.001 | <0.001 | <0.001 | <0.001 | <0.001 | <0.001 | <0.001 | <0.001 | <0.001 | <0.001 | <0.001 |
| Antimony-125 | 0.002 | 0.002 | 0.003 | <0.001 | 0.02 | 0.02 | 0.04 | 0.007 | <0.001 | <0.001 | <0.001 | <0.001 | 0.002 | 0.002 | 0.002 | 0.001 |
| Iodine-129 | 0.05 | 0.03 | 0.02 | 0.02 | 0.25 | 0.29 | 0.23 | 0.10 | 0.03 | 0.03 | 0.01 | 0.01 | 0.13 | 0.09 | 0.04 | 0.05 |
| Iodine-131 c | <0.001 | <0.001 | <0.001 | <0.001 | <0.001 | <0.001 | 0.002 | <0.001 | <0.001 | <0.001 | <0.001 | <0.001 | <0.001 | <0.001 | <0.001 | <0.001 |
| Caesium-134 | 0.02 | 0.006 | 0.004 | 0.009 | 0.09 | 0.05 | 0.04 | 0.04 | 0.007 | 0.002 | <0.001 | 0.003 | 0.02 | 0.007 | 0.003 | 0.01 |
| Caesium-137 | 0.01 | 0.004 | 0.003 | 0.005 | 0.11 | 0.06 | 0.05 | 0.05 | 0.01 | 0.003 | 0.001 | 0.005 | 0.02 | 0.005 | 0.002 | 0.007 |
| Plutonium-alpha | <0.001 | <0.001 | <0.001 | <0.001 | 0.01 | 0.008 | 0.009 | <0.001 | 0.01 | 0.006 0.003 | <0.001 | 0.002 | <0.001 | <0.001 | <0.001 | |
| Plutonium-241 | - | - | - | - | - | - | - | - | 0.01 | 0.005 | 0.002 | <0.001 | - | - | - | - |
| Americium-241 | <0.001 | <0.001 | <0.001 | <0.001 | 0.02 | 0.01 | 0.01 | <0.001 | 0.01 | 0.005 | 0.003 | <0.001 | 0.003 | 0.001 | <0.001 | <0.001 |
| Total | 0.19 | 0.12 | 0.11 | 0.19 | 1.1 | 1.2 | 1.3 | 1.1 | 0.14 | 0.10 | 0.05 | 0.13 | 0.39 | 0.28 | 0.15 | 0.38 |
Table B8 - Summary of doses to terrestrial critical group from terrestrial foodstuffs and inhalation (µSv)a, 2019 Cont.
| Drinking water | Inhalation | |||||||
|---|---|---|---|---|---|---|---|---|
| Radionuclide | Adult | Child | Infant | Foetus | Adult | Child | Infant | Foetus |
| Total tritium | 0.10 | 0.08 | 0.12 | 0.15 | - | - | - | - |
| Carbon-14 b | - | - | - | - | - | - | - | - |
| Cobalt-60 | - | - | - | - | - | - | - | - |
| Strontium-90 | 0.04 | 0.05 | 0.05 | 0.06 | 0.002 | 0.001 | <0.001 | <0.001 |
| Technetium-99 | - | - | - | - | - | - | - | - |
| Ruthenium-106c | - | - | - | - | 0.01 | 0.009 | 0.008 | <0.001 |
| Antimony-125 | - | - | - | - | <0.001 | <0.001 | <0.001 | <0.001 |
| Iodine-129 | - | - | - | - | - | - | - | |
| Iodine-131 c | - | - | - | - | - | - | - | - |
| Caesium-134 | - | - | - | - | <0.001 | <0.001 | <0.001 | <0.001 |
| Caesium-137 | 0.04 | 0.02 | 0.02 | 0.02 | <0.001 | <0.001 | <0.001 | <0.001 |
| Plutonium-alpha | 0.18 | 0.11 | 0.13 | 0.007 | 0.21 | 0.12 | 0.06 | 0.004 |
| Plutonium-241 | - | - | - | - | 0.18 | 0.09 | 0.04 | 0.002 |
| Americium-241 | <0.001 | <0.001 | <0.001 | <0.001 | 0.21 | 0.12 | 0.07 | 0.001 |
| Total | 0.36 | 0.26 | 0.32 | 0.24 | 0.62 | 0.34 | 0.18 | 0.01 |
a. Values in pale blue boxes have been calculated using FSA monitoring data. b. Calculated using background corrected activity concentrations (see Monitoring chapter, paragraph 24). c. Ru-106 in foodstuffs and I-131 in milk derived from standard modelling techniques.
Table B9 - Summary of radionuclide doses to the terrestrial critical group from terrestrial pathways and inhalation, 2019
Total dose per radionuclide (µSv)
| Radionuclide | Adult | Child | Infant | Foetus |
|---|---|---|---|---|
| Total tritium | 0.15 | 0.14 | 0.20 | 0.22 |
| Carbon-14a | 0.59 | 0.53 | 0.71 | 0.83 |
| Cobalt-60 | 0.07 | 0.12 | 0.15 | 0.04 |
| Strontium-90 | 0.76 | 1.0 | 0.96 | 1.1 |
| Technetium-99 | 0.01 | 0.01 | 0.02 | 0.01 |
| Ruthenium-106 b | 0.03 | 0.03 | 0.02 | 0.02 |
| Antimony-125 | 0.05 | 0.07 | 0.15 | 0.03 |
| Iodine-129 | 0.90 | 1.1 | 0.74 | 0.35 |
| Iodine-131ᵇ | 0.02 | 0.02 | 0.04 | 0.02 |
| Caesium-134 | 0.25 | 0.13 | 0.07 | 0.11 |
| Caesium-137 | 1.5 | 0.61 | 0.31 | 0.65 |
| Plutonium-alpha | 0.43 | 0.26 | 0.22 | 0.03 |
| Plutonium-241 | 0.19 | 0.10 | 0.04 | 0.004 |
| Americium-241 | 0.28 | 0.16 | 0.10 | 0.02 |
| Total overall dose | 5.2 | 4.2 | 3.7 | 3.4 |
a. Calculated using background corrected activity concentrations. b. Ru-106 in foodstuffs and I-131 in milk derived from standard modelling techniques
Table B10 - Summary of doses to the terrestrial critical group from seafood consumption (Sv) in 2019
| Radionuclide | Adult | Child | Infant | Foetus |
|---|---|---|---|---|
| Carbon-14 a | 0.27 | 0.07 | 0.04 | 0.37 |
| Technetium-99 | 0.01 | 0.005 | 0.005 | 0.009 |
| Ruthenium-106 | 0.009 | 0.004 | 0.003 | 0.0005 |
| Caesium-137 | 0.15 | 0.02 | 0.007 | 0.06 |
| Plutonium-alpha | 0.02 | 0.004 | 0.002 | 0.0007 |
| Americium-241 | 0.03 | 0.007 | 0.003 | 0.0004 |
| Total | 0.48 | 0.12 | 0.06 | 0.44 |
a. Calculated using background corrected activity concentrations.
Table B11 - Modelled concentrations of Ru-106 and I-131 in terrestrial foodstuffs (Bq kg-1 or Bq l-1) in 2019
| Radionuclide | Milk | Beef | Mutton | Liver | Green Veg. | Root Veg. | Fruit | Poultry | Eggs |
|---|---|---|---|---|---|---|---|---|---|
| Ruthenium-106 | 2E-07 | 1E-04 | 2E-04 | 2E-04 | 7E-04 | 7E-06 | 7E-05 | 5E-08 | 5E-08 |
| Iodine-131 | 7E-04 | - | - | - | - | - | - | - | - |
Figure B1 – Technetium-99 in Fucus vesiculosus at Nethertown
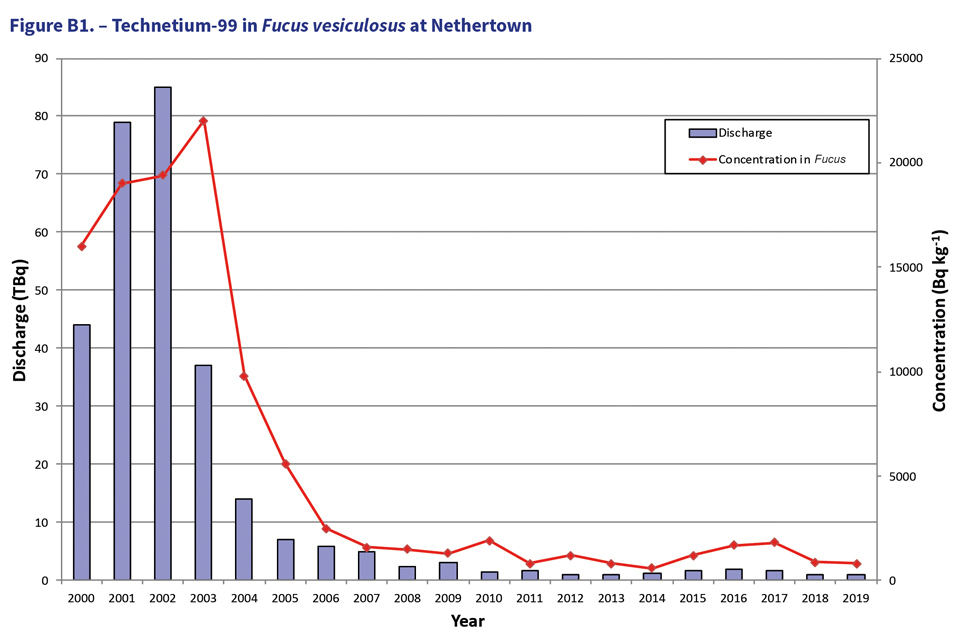
Figure B1. Technetium-99 in fucus vesiculosus at Nethertown
Figure B2 – Caesium-137 in seawater filtrate at Sellafield beach
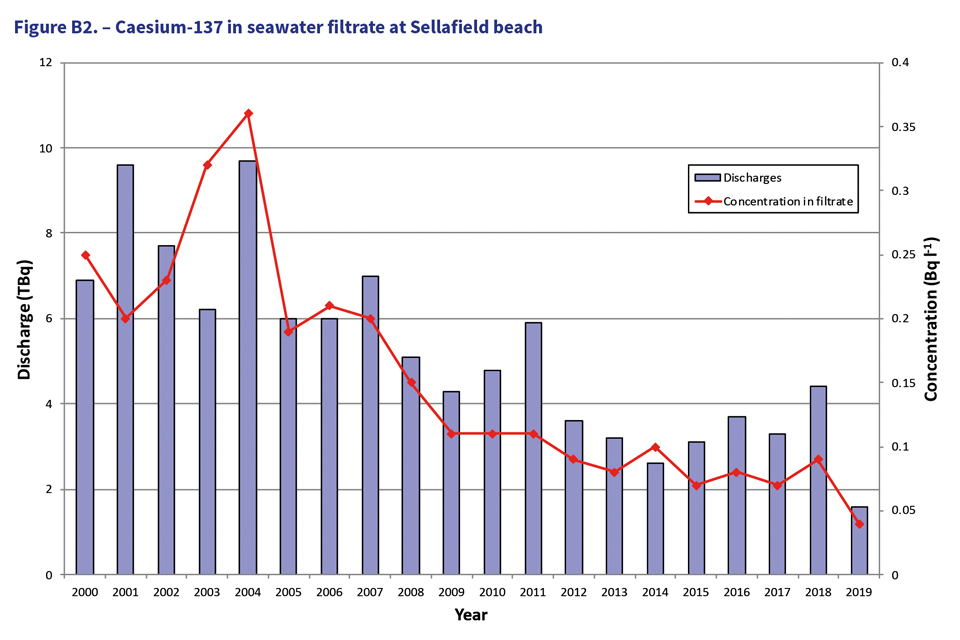
Figure B2. Caesium-137 in seawater filtrate at Sellafield beach
Figure B3 – Plutonium-alpha in seawater filtrate at Sellafield beach
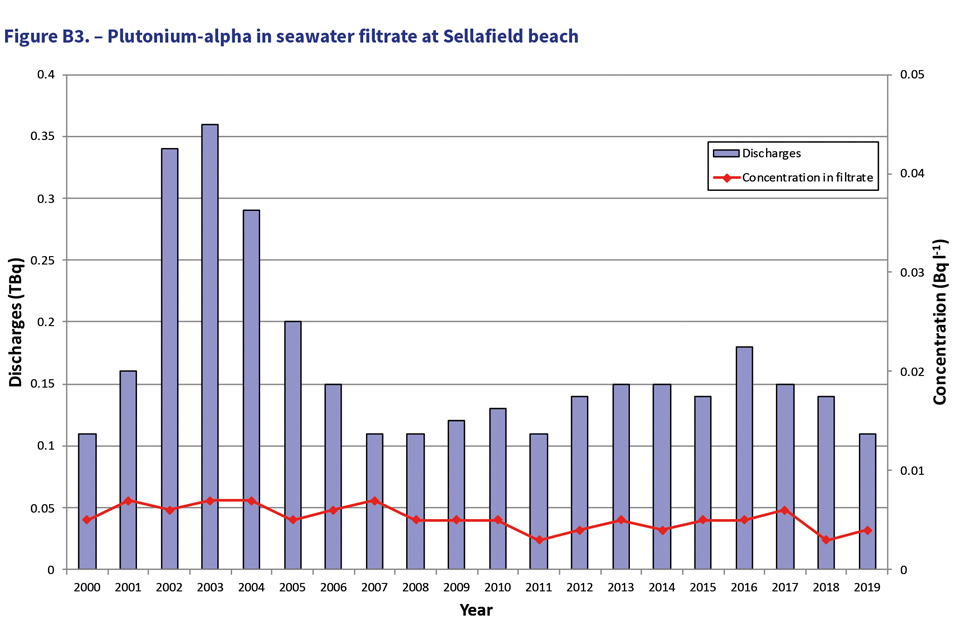
Figure B3. Plutonium-alpha in seawater filtrate at Sellafield beach
Figure B4 – External gamma dose rates at Newbiggin compared to sediment
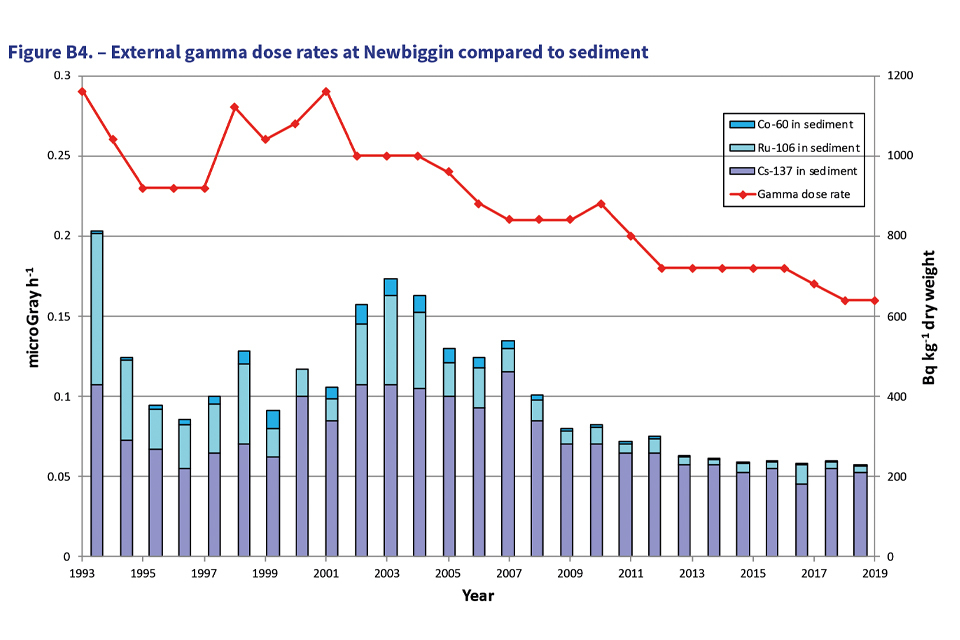
Figure 84. External gamma dose rates at Newbiggin compared to sediment
12. Appendix C
12.1 Representative person dose calculations
Paragraph 1
A Representative Person is defined as an individual receiving a dose that is representative of the more highly exposed individuals in the population (ref 1).
This term is the equivalent of, and replaces, ‘average member of the critical group’ described in previous ICRP Recommendations.
Paragraph 2
The Representative Person approach is applied in the Radioactivity in Food and the Environment (RIFE) series of publications.
This approach applies habit data, collected by Cefas through surveys of the local population, to identify realistic profiles of foodstuff consumption and occupancy habits (e.g. time spent over sediment) for groups of individuals in the local population.
The profiles are deliberately aligned to the habits and locations where groups of individuals may be expected to receive the highest radiological doses.
Terrestrial dose profiles are based on the five-yearly comprehensive habit survey, the latest of which was in 20182. Marine dose profiles are based on the annual habit data provided by Cefas between 2015 and 2019 (as applied in RIFE 213 - RIFE 25(ref 4)).
Paragraph 3
An assessment was conducted for this report applying the RIFE dose profiling methodology. The data for concentrations in foodstuffs, external dose rates and direct shine were taken from the relevant Sellafield Ltd Discharges and Environmental Monitoring reports.
This assessment of dose profiles therefore differs from that presented in RIFE as it more closely represents the doses attributed to the Sellafield site as it does not include the contributions from naturally occurring radioactivity or from anthropogenic radionuclides released from other industries.
The results from the dose profiling can therefore be directly compared with those obtained from the calculations of doses to members of the critical group used in the Sellafield Ltd reports.
Paragraph 4
It should be noted that, in line with dose calculations applied elsewhere in this report, the representative persons dose calculations assumed that concentrations at the limit of detection (e.g. < 10 Bq kg-1, indicating the range 0 - 10 Bq kg-1) were at the upper limit of this range (i.e. 10 Bq kg-1).
The doses therefore represent an upper bound to those that would actually be received by the more highly exposed individuals in the population. A summary of the calculated representative person doses for 2019 are presented in table C1 and discussed below.
Paragraph 5
Doses to adults are shown in figure C1 and demonstrate that the two highest dose profiles overall were Mollusc Consumers and Occupants over Saltmarsh.
Doses in 2019 for Occupants over Saltmarsh were 40 µSv with 95% of this dose being from exposure to external gamma irradiation whilst on saltmarsh and the remainder being from exposure whilst on sediments.
Doses to the Mollusc Consumers in 2019 were 77 µSv with 30% of this dose being from external gamma irradiation whilst on sediments.
The consumption of molluscs accounted for 53% of the total. The difference in dose from 2018 (47 µSv) is due to a small increase in seafood consumption between these years.
The Radiological Impact of Operations at Sellafield section of this report presents the dose to adult members of the marine Critical Group as 37 µSv through marine foodstuff consumption, and a total dose, including exposure on sediments, terrestrial pathways and direct shine as 75 µSv.
This demonstrates that the dose assessment methodology applied in the Radiological Impact of Operations at Sellafield section of this report provides a similar estimate.
Paragraph 6
Doses from terrestrial exposure pathways in 2019 to adult representative persons were highest for the profile Local Inhabitants (0.25 – 0.5 km). This group received a dose of 6.0 µSv in total.
The dose that was received was dominated by direct shine from the site (54%) and sheep meat consumers (28%) with other terrestrial foodstuff pathways and exposure to marine sediments accounting for the remainder.
The estimated dose to adults in the terrestrial critical group, presented in the Radiological Impact of Operations at Sellafield section of this report, was 11 µSv which is higher than the estimates for the representative person and demonstrates that the methodology in the Radiological Impact of Operations at Sellafield section provides conservative results.
Paragraph 7
Figure C2 presents the doses to children using the Representative Persons methodology. As found for adults the 2 highest groups overall were Mollusc Consumers and Occupants over Saltmarsh.
The doses received by representative persons in the child age group were approximately half those estimated for adults (27 µSv being received by Mollusc Consumers and 20 µSv received by Occupants over Saltmarsh in 2019).
Doses to children where terrestrial pathways dominated were highest for Local Inhabitants (0.25 – 0.5 km), with a total dose of 5 µSv being estimated for 2019 with 65% due to direct shine.
It should be noted that the Representative Persons methodology assumes that adults, children and infants have the same direct shine exposure. The dose to a child member of the terrestrial critical group, detailed in the Radiological Impact of Operations at Sellafield section of this report, was 6 µSv.
Although the Cefas habit data2 did not identify any children living close to the site for the sake of completeness an additional 3 µSv due to direct shine from the site could be determined based on child habit data.
The total dose of 9 µSv is in close agreement with that estimated for the representative person (5 µSv), noting the differences in the assumption regarding direct shine exposure, and demonstrates that the methodology in the Radiological Impact of Operations at Sellafield section provides conservative results.
Paragraph 8
Figure C3 presents the doses to infants using the Representative Persons methodology. The two highest groups overall were Mollusc Consumer and Local Inhabitants (0 - 0.25 km).
The doses to infants in 2019 were less than 7 µSv and therefore considerably lower than the doses to adult or child representative persons.
The Mollusc Consumer and Local Inhabitants (0.25 - 0.5 km) pathways dominated with total doses of 5.9 µSv and 4.6 µSv, respectively, being received in 2019.
The dose assessment in the Radiological Impact of Operations at Sellafield section of this report calculated a dose to infant members of the terrestrial critical group of 4 µSv with an additional 3 µSv being calculated from direct shine from the site based on Cefas habit data (ref 2).
The doses from the different methodologies are in close agreement, noting the differences in the assumption regarding direct shine exposure, although demonstrate that the methodology in the Radiological Impact of Operations at Sellafield section provides conservative results.
Paragraph 9
In conclusion, the Representative Persons methodology, as applied in the RIFE series of reports, provides realistic estimates of peak doses to the most exposure individuals in the population and the Critical Group approach applied by Sellafield Ltd is more conservative.
There is therefore no requirement to modify the Critical Group methodology applied in this report for determining radiological doses to the public.
12.2 References
- International Commission on Radiological Protection (2006). Assessing dose of the representative person for the purpose of radiation protection of the public and the optimisation of radiological protection: Broadening the process. ICRP Publication 101. Ann. ICRP 36 (3).
- Moore K J, Clyne F J and Greenhill B J (2019). Radiological habits survey: Sellafield, 2018. Environment Report RL07/19. Cefas, Lowestoft (under contract to the EA and the FSA).
- Environment Agency, Food Standards Agency, Food Standards Scotland, Natural Resources Wales, Northern Ireland Environment Agency and Scottish Environment Protection Agency (2016). Radioactivity in food and the environment, 2015. RIFE-21. EA, FSA, FSS, NRW, NIEA and SEPA; Preston, London, Aberdeen, Cardiff, Belfast and Stirling.
- Environment Agency, Food Standards Agency, Food Standards Scotland, Natural Resources Wales, Northern Ireland Environment Agency and Scottish Environment Protection Agency (2020). Radioactivity in food and the environment, 2019 . RIFE-25. EA, FSA, FSS, NRW, NIEA and SEPA; Preston, London, Aberdeen, Cardiff, Belfast and Stirling.
Table C1 - Summary of representative person dose calculations for various age groups, 2019. Values in pale blue boxes denote top two dose contributions
| Pathway | Adult Dose (microSv) | Child Dose (microSv) | Infant Dose (microSv) | ||||||
|---|---|---|---|---|---|---|---|---|---|
| Marine | Terrestrial | Total Dose | Marine | Terrestrial | Total Dose | Marine | Terrestrial | Total Dose | |
| Crustacean Consumers | 29 | 1.1 | 30 | 9.2 | 1.1 | 10 | 2.7 | 1.1 | 3.8 |
| Occupants for Direct Radiation | 2.8 | 3.6 | 6.4 | 1.3 | 3.5 | 4.9 | 0.11 | 3.5 | 3.6 |
| Egg Consumers | 0.17 | 2.2 | 2.4 | 0.09 | 1.8 | 1.8 | - | 1.8 | 1.8 |
| Freshwater Fish Consumers | - | 1.6 | 1.6 | - | 1.4 | 1.4 | - | 1.1 | 1.1 |
| Sea Fish Consumers | 18 | 0.40 | 19 | 6.8 | 0.40 | 7.2 | 1.3 | 0.40 | 1.7 |
| Domestic Fruit Consumers | 2.7 | 2.7 | 5.4 | 1.3 | 2.8 | 4.1 | 0.10 | 3.5 | 3.6 |
| Wild Fruit and Nut Consumers | 0.47 | 2.0 | 2.4 | 0.16 | 1.7 | 1.9 | - | 1.8 | 1.9 |
| Occupants over Saltmarsh | 40 | - | 40 | 20 | - | 20 | 1.2 | - | 1.2 |
| Occupants over Sediment | 37 | 0.68 | 38 | 18 | 0.68 | 18 | 1.3 | 0.70 | 2.0 |
| Honey Consumers | - | 1.6 | 1.6 | - | 1.4 | 1.4 | - | 1.1 | 1.1 |
| Consumers of Marine Plants and Algae | 11 | - | 11 | 5.4 | - | 5.4 | 0.54 | - | 0.54 |
| Cattle Meat Consumers | 0.09 | 2.5 | 2.5 | - | 2.2 | 2.2 | - | 2.0 | 2.0 |
| Game Meat Consumers | 2.4 | 1.6 | 4.0 | 0.75 | 1.0 | 1.8 | 0.28 | 0.61 | 0.90 |
| Poultry Meat Consumers | 15 | 2.8 | 18 | 7.6 | 2.6 | 10 | 0.52 | 2.4 | 2.9 |
| Sheep Meat Consumers | 0.08 | 3.0 | 3.0 | - | 2.3 | 2.3 | - | 2.1 | 2.1 |
| Wildfowl Consumers | 1.9 | 0.50 | 2.4 | 1.0 | 0.41 | 1.4 | 0.06 | 0.31 | 0.36 |
| Milk Consumers | - | 1.2 | 1.2 | - | 1.4 | 1.4 | - | 2.1 | 2.1 |
| Mollusc Consumers | 77 | - | 77 | 27 | - | 27 | 5.9 | - | 5.9 |
| Mushroom Consumers | 0.61 | 2.6 | 3.2 | 0.29 | 2.5 | 2.7 | - | 2.5 | 2.5 |
| Occupants In Water | 1.0 | - | 1.0 | 0.49 | - | 0.49 | - | - | - |
| Occupants On Water | 6.8 | - | 6.8 | 2.8 | - | 2.8 | 0.49 | - | 0.49 |
| Local Inhabitants (0 - 0.25km) | 0.13 | 4.7 | 4.8 | 0.06 | 4.4 | 4.5 | - | 4.2 | 4.2 |
| Local Inhabitants (0.25 - 0.5km) | - | 6.0 | 6.0 | - | 4.9 | 4.9 | - | 4.6 | 4.6 |
| Local Inhabitants (0.5 - 1km) | 1.2 | 4.2 | 5.3 | 0.56 | 4.1 | 4.7 | - | 4.1 | 4.1 |
| Green Vegetable Consumers | 4.8 | 3.4 | 8.2 | 2.4 | 3.3 | 5.6 | 0.15 | 3.4 | 3.6 |
| Other Domestic Vegetable Consumers | 5.3 | 3.3 | 8.6 | 2.6 | 3.2 | 5.8 | 0.17 | 3.3 | 3.5 |
| Potato Consumers | - | 1.6 | 1.6 | - | 1.6 | 1.6 | - | 1.6 | 1.6 |
| Root Vegetable Consumers | 4.9 | 3.6 | 8.5 | 2.4 | 3.5 | 5.9 | 0.16 | 3.9 | 4.0 |
Figure C1- Radiological doses to adult representative persons (2015-2019)
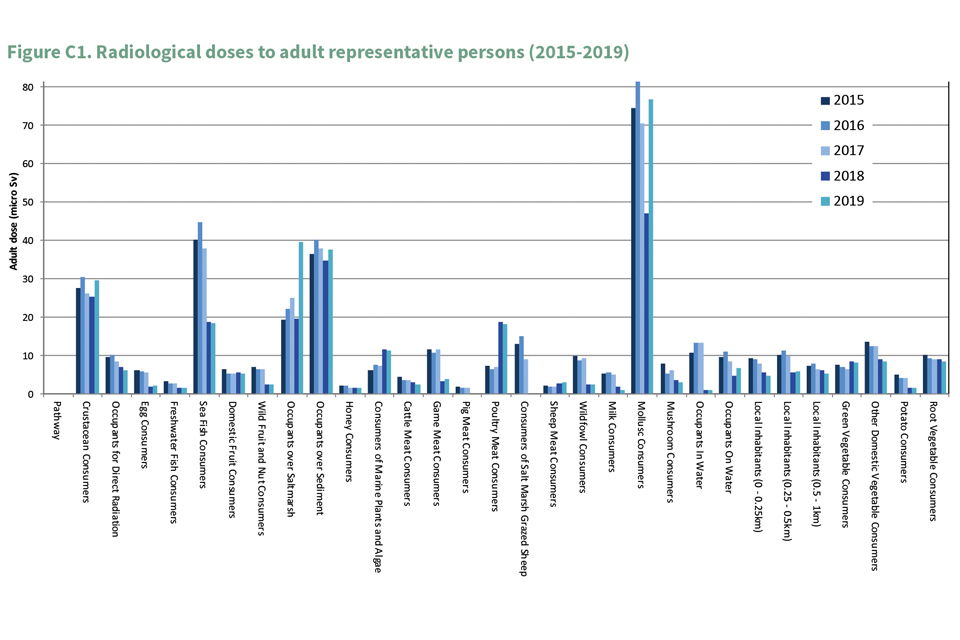
Figure C1. Radiological doses to adult representative persons (2015-2019)
Figure C2 - Radiological doses to child representative persons (2015-2019)
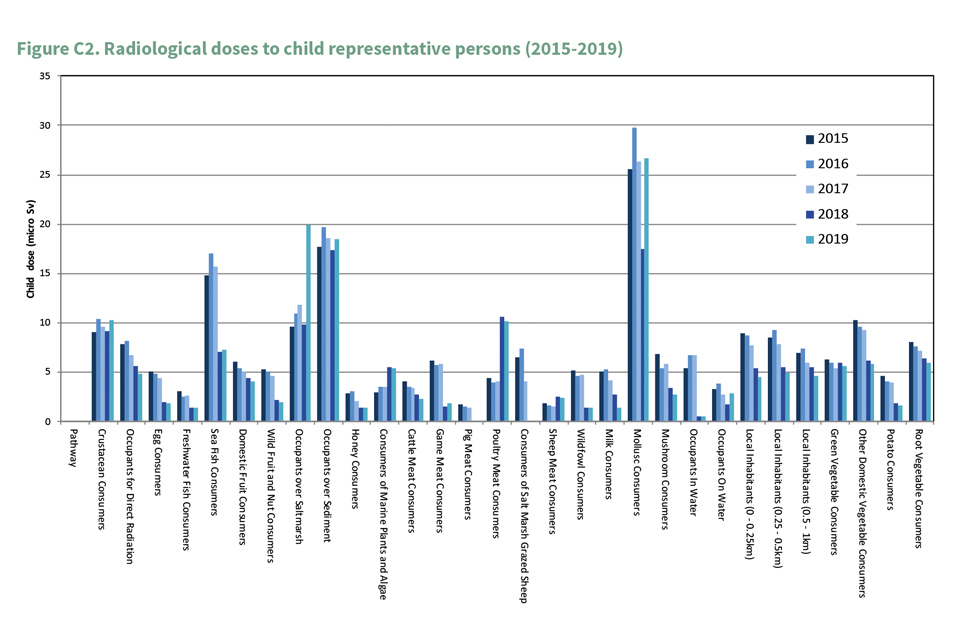
Figure C2. Radiological doses to child representative persons (2015-2019)
Figure C3 - Radiological doses to infant representative persons (2015-2019)
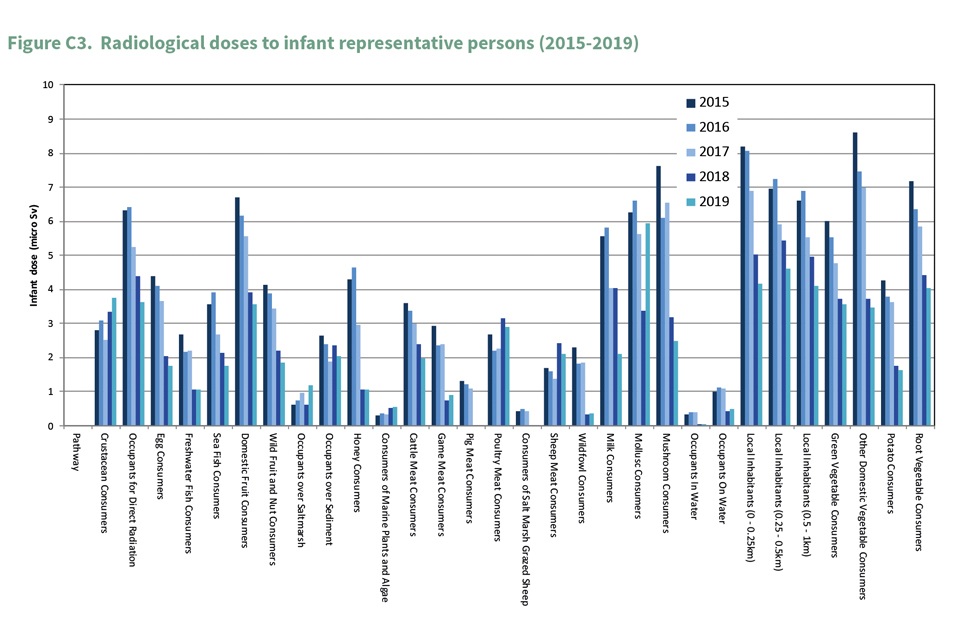
Figure C3. Radiological doses to infant representative persons (2015-2019)
13. Glossary
13.1 Glossary of terms and abbreviations
Absorbed radiation dose - Quantity of energy imparted by ionising radiation to unit mass of matter such as tissue. The unit is the Gray (Gy). 1 Gy = 1 joule per kilogram.
Activation - products Radionuclides produced by the interaction of neutrons with stable nuclides.
Activity - See radioactivity.
Alpha activity - Radionuclides that decay by emitting an alpha particle. The latter consists of two protons and two neutrons.
ALARA (As Low as Reasonably Achievable) - Radiation doses from a source of exposure are ALARA when they are consistent with the relevant dose or target standard and have been reduced to a level that represents a balance between radiological and other factors, including social and economic. The level of protection may then be said to be optimised.
Aquifer - A body of permeable rock which can transmit and allow abstraction of groundwater.
Authorisation - Permission given by regulatory authority under the Radioactive Substances Act or Environmental Protection Act to dispose of respectively radioactive and non-radioactive waste, subject to conditions.
Basic Safety Standards Directive (BSS)- European Community Directive 80/836/Euratom, Basic Safety Standards for the Health Protection of the General Public and Workers against the Dangers of Ionising Radiation.
These standards were adopted as European Law in 1980. A revised Directive 96/29/Euratom was adopted in May 1996 for implementation in Member States by May 2000.
The Radioactive Substances (Basic Safety Standards) Direction 2000 is the means by which the BSS Directive has been implemented in England and Wales, and in Scotland, with respect to the Radioactive Substances Act 1993. Other provisions of the BSS Directive were implemented through the Ionising Radiation Regulations 1999.
Becquerel - The SI unit of radioactivity equal to one transformation per second.
BAT (Best Available Technique) “Best” – means the most effective techniques for achieving a high level of protection of the environment as a whole. “Available” – means techniques developed on a scale which allows them to be used in the relevant industrial sector, under economically and technically viable conditions, taking into account of the costs and advantages. “Techniques” – includes both the technology and the way the installation is designed, built, maintained, operated and decommissioned. Application of BAT is central to PPC compliance and guidance on what constitutes BAT is provided by the EA.
Beta activity - Radionuclides that decay by emitting a beta particle (an electron with high energy).
Borehole - A hole that is drilled into the ground, generally used to locate water or oil and to characterise ground conditions.
CPS - Carbon Price Support.
Cefas - The Centre for Environment, Fisheries and Aquaculture Science is a scientific research and advisory centre for fisheries management and environmental protection. It is an Agency of the UK Government’s Department for Environment, Food and Rural Affairs (Defra). It was formed in 1997 from the Fisheries Research Laboratory of MAFF and its Lowestoft laboratory carries out habit surveys and monitoring of radioactivity in the environment on behalf of the Food Standards Agency.
CHP - Combined Heat and Power Plant.
CCL - Climate Change Levy.
Collective dose - See dose.
Committed effective dose - See dose.
Critical group - A group of members of the public whose radiation exposure is reasonably homogeneous and is typical of the people receiving the highest dose from a radiation source. The critical group dose is calculated as the mean effective dose to members of the group. The average member of the critical group is equivalent to the ‘representative person’.
Defra (Department for Environment, Food and Rural Affairs) - Formed in 2001 from MAFF and is the environmental section of the Department of Environment, Transport and the Regions (DETR). It is the sponsoring department for the EA, and is responsible inter alia for environmental policy in England, including that for the management and disposal of radioactive wastes.
Direct radiation - Term used to refer to radiation direct from a nuclear site as distinct from the radiation emitted from discharged radioactive wastes.
Dose - A measure of radiation received, which may be quantified in several different ways. The dose quantities most commonly referred to are defined below. In this document it is used primarily to mean the ‘effective dose’ received by members of critical groups.
Absorbed dose - The mean energy imparted by ionising radiation to matter in a given volume divided by the mass of the matter. Normally used in the context of the dose averaged over an organ or tissue. The unit is the Gray (Gy) (see inside front cover).
Equivalent dose - The absorbed dose in a tissue or organ weighted by the radiation weighting factor (e.g. alpha particles = 20, beta particles = 1, gamma rays = 1) which allows for the different effectiveness of various types of ionising radiations in causing harm to tissues. The unit is the Sievert (Sv) (see inside front cover).
Effective dose - The sum of the equivalent doses in all tissues and organs of the body from internal and external radiation multiplied by the tissue weighting factor (e.g. skin = 0.01, thyroid = 0.05, red bone marrow = 0.12, gonads = 0.20). It allows the various equivalent doses in the body to be represented by a single number giving a broad indication of the detriment to the health of an individual from exposure to ionising radiation, regardless of the energy and type of radiation. For comparison with dose limits, the term takes on a specific meaning (see below).
Committed effective dose - The time integral of the effective dose from ingested and inhaled radioactivity delivered over 50 years (adults, who are cautiously assumed to be 20 years old at the time of intake) or to age 70 years (children). For a particular radionuclide, it is a function of the distribution within and clearance from the body and also the radioactive half-life. For radionuclides which are cleared quickly from the body (e.g. caesium-137) or which have a short half-life (e.g. sulphur-35), most of the committed effective dose is delivered in the year in which the intake of activity took place. For others, such as plutonium, the committed dose is delivered over the remaining lifetime of the individual and so the dose in the year of intake is much lower than the committed dose.
Effective dose - (definition used for calculation of critical group doses and for comparison with dose limits) The overall annual effective dose is the sum of committed effective doses from intakes of radionuclides in a given year and the effective dose from external irradiation in that year. It is this quantity that should be compared with the annual limit on effective dose (dose limit).
Collective dose - The summation of individual effective doses received by the population of a defined geographical area over a defined period of time. A 500 year integration period is used in this report (see paragraph 20 of Appendix A). The unit is the man sievert (man Sv).
Dose constraint- A restriction on annual dose to an individual from a single source, applied at the design and planning stage of any activity in order to ensure that when aggregated with doses from all sources, excluding natural background and medical procedures, the dose limit is not exceeded.
Dose limit - For the purpose of discharge authorisations, since 1986 the UK has applied a dose limit of 1 mSv (1000 µSv) per annum to members of the public from all man-made sources of radiation (other than medical exposure). This limit is now incorporated into UK law (see Basic Safety Standards Directive).
Drift Soil - deposits left after the retreat of glaciers and ice- sheets.
EA (Environment Agency) - The leading public body for protecting and improving the environment in England and Wales (see Defra).
Effective dose- See dose.
EUETS - European Union Emissions Trading Scheme.
Environment Act 1995 - The legislation giving the EA its powers, aims and objectives.
Environmental Permitting (England and Wales) Regulations (2016) - The Environmental Permitting (England and Wales) Regulations 2016 extend the permitting regime introduced in 2010 which included water discharge consents, groundwater permits and radioactive substances regulations.
ESC Environmental Screening Criteria - A concentration, generally defined by regulation, of a hazardous or non- hazardous chemical in an environmental sample(s), that if exceeded could result in harm to human health or the environment.
Equivalent dose - See dose.
Fission products - Nuclear fission is the splitting of a heavy atomic nucleus such as uranium into (usually) two nuclei, either spontaneously or under the impact of another particle, with resulting increase of energy. The two nuclei are called fission products.
Fluorinated Greenhouse Gases - Fluorinated greenhouse gases are powerful greenhouse gases that trap heat in the atmosphere and contribute to global warming. The most commonly used fluorinated greenhouse gases belong to a class of chemicals known as hydrofluorocarbons (HFCs) and are being used to replace ozone depleting substances, an example being refrigeration and air conditioning equipment.
Food Standards Agency - Formed in April 2000 from parts of MAFF and the Department of Health. It is responsible for food safety issues in the UK. Although it is a government agency it does not report to a specific minister and is free to publish any advice it issues. It is accountable to Parliament through Health Ministers and to the devolved administrations in Scotland, Wales and Northern Ireland for its activities within their respective areas.
Gray - The SI unit of absorbed dose.
Groundwater - Groundwater is the term for water that completely fills cracks and voids within rock or soil below the ground surface and which, in principle, can be extracted from a well or discharged to a spring.
Groundwater Monitoring - Well A borehole into which a piezometer and headworks have been installed. The purpose of which is to provide controlled access to groundwater in order to obtain quality samples and hydrogeological data.
GWP - Global Warming Potential
Half-life (radioactive) - The time taken for the radioactivity of a radionuclide to decrease to one half of its initial value by radioactive decay. Half-lives range from fractions of a second to millions of years. Half-life (biological) The effective half-life in the human body of a quantity of ingested radioactivity is a function of the radioactive half-life and biokinetic behaviour.
High Level Waste (HLW) - Waste that is sufficiently radioactive that the generation of heat needs to be taken into account in the design of disposal or storage facilities.
Historic/Legacy discharges - Effluent discharges from existing and legacy facilities that are not associated with the carrying on of production operations at those facilities, such as remediation, decommissioning and clean-up of the historical legacy.
HPA (Health Protection Agency) - A non-departmental public body established in 2003 to provide an integrated approach to protecting UK public health. Merged with the NRPB on 1 April 2005 to form the HPA Radiation Protection Division. Became part of Public Health England on 1 April 2013.
Intermediate Level Waste (ILW) - Waste with radioactivity levels exceeding the upper boundaries for low level waste but which does not require heat generation by the waste to be accounted for in the design of disposal or storage facilities.
ICRP - International Commission on Radiological Protection. An independent group of experts founded in 1928 which provides guidance on principles and criteria in the field of radiological protection. The recommendations are not legally binding but are accepted as the basis for national legislation in most countries including the UK.
Ionising Radiation Regulations 1999 (IRRs 1999) - These regulations under the Health and Safety at Work Act 1974 in part implement the European Basic Safety Standards Directive of 1996.
LOD - Limit of Detection.
Low level waste (LLW) - Waste containing levels of radioactivity greater than those acceptable for dustbin disposal but not exceeding 4 GBq per tonne of alpha- emitting radionuclides or 12 GBq per tonne of beta-emitting radionuclides.
LLWR - The UK’s national low level radioactive waste facility, located close to the West Cumbrian coastline in the north-west of England.
LQ - Land Quality group at Sellafield Ltd.
MAFF (Ministry of Agriculture, Fisheries and Food) - Superseded by Defra. MAFF’s statutory responsibilities for food safety issues in the UK have been passed to the Food Standards Agency.
Magnox - A magnesium/aluminium alloy that is used in the manufacture of the canister for uranium fuel metal (‘Magnox fuel’) used in a type of nuclear reactor (‘Magnox reactor’).
m AOD - metres Above Ordnance Datum (height relative to the average sea level at Newlyn, Cornwall, UK).
meq - Milliequivalents.
National Dose Assessment Working Group (NDAWG) - Publishes guidance on the assessment of public dose from past, present and future discharges and direct radiation from the nuclear industry and minor users of radioactivity. Membership comprises UK Government agency, nuclear industry and independent experts.
NDA (Nuclear Decommissioning Authority) - The public body set up in 2005, tasked by Her Majesty’s Government with taking strategic responsibility for the decommissioning of civil public sector nuclear sites in the UK. The NDA owns the 20 nuclear legacy sites in the UK including the operating and decommissioning plants at Sellafield in West Cumbria. The NDA does not carry out the operations or clean-up work itself but places contracts with Sellafield Ltd who are responsible for operations on site.
NIEA - Northern Ireland Environment Agency.
NNL - National Nuclear Laboratory.
NRPB (National Radiological Protection Board) - Merged with the Health Protection Agency on 1 April 2005 forming its new Radiation Protection Division. An independent statutory body set up by the Radiological Protection Act 1970 to advance the acquisition of knowledge about the protection of mankind from radiation hazards and to provide information and advice on matters relating to radiological protection and radiation hazards, including the interpretation of ICRP recommendations.
NRW - Natural Resources Wales.
ONR (Office for Nuclear Regulation) - Part of the Health and Safety Executive. It is responsible for enforcing legislation relating to nuclear safety under the Nuclear installations Act 1965.
OSPAR Convention - The Oslo Paris Convention. Contracting parties (including the UK) have signed up to deliver the North- East Atlantic Environment Strategy which includes the OSPAR Radioactive Substances Strategy. This includes a strategic objective, with regard to radioactive substances, to prevent pollution of the OSPAR maritime area from ionising radiation. The Radioactive Substances strategy includes numerous different elements, relating to discharges, concentrations and application of BAT.
Ozone Depleting Substances (ODS) - Substances that, if allowed to escape, damage the ozone layer in the upper atmosphere. Ozone depleting substances include chlorofluorocarbons (CFCs) and hydrochlorofluorocarbons (HCFCs). Many ODS are banned or are being phased out by the Fluorinated Greenhouse Gases Regulations 2009.
PHE (Public Health England) - An executive agency of the Department of Health established 1 April 2013 to bring together public health specialists, including those in the Health Protection Agency, to form a single organisation tasked with public health protection. PHE’s Centre for Radiation, Chemical and Environmental Hazards provides expert advice on all aspects of radiological protection.
Piezometer - Individual boreholes that contain multi-level installations are made up of a number of individual access pipes that incorporate a screen interval that monitors a selected depth.
These individual access pipes are referred to as piezometers. In the Sellafield site numbering system the deepest piezometer in an individual borehole is labelled as “p1”. Successively shallower piezometers are labelled as “p2”, “p3”, and “p4” (as appropriate) with the highest number representing the shallowest piezometer interval in that individual borehole.
PPC - Pollution Prevention and Control Regulations 2000.
Quarterly Notification Level (QNL) - Quarterly discharge or disposal levels that the EA may specify in RSA authorisations. They enable the application of BAT to be monitored by the EA. Exceeding a QNL requires the operator to submit a written justification of the BPM used to limit discharges.
Radioactive Substances Act (RSA) 1960, 1993 - Statutory legislation to control the keeping and use of radioactive substances and the accumulation discharge or disposal of radioactive waste.
Radioactive waste Material that contains radioactivity above the appropriate levels specified in the Radioactive Substances Act 1993 and which meets the definition of waste given in the Act.
Radioactivity - The spontaneous disintegration of atomic nuclei. Radioactive substances or the radiation they emit (e.g. alpha particles, beta particles, gamma rays); the rate of radioactive decay. Measured in the standard international (SI) unit, Becquerels (Bq) or their multiples or sub-multiples (see inside front cover).
Radionuclide - A radioactive isotope of an element.
Recharge - Generally where rainwater moves downward from the surface towards the water table. Recharge may be influenced by the nature of surface cover, i.e. at Sellafield site recharge in some areas may be low due to hard standing, roads etc.
Representative - person An individual receiving a dose that is representative of the more highly exposed individuals in the population. This term is equivalent to ‘average member of the critical group’.
SEMP - Statutory Environmental Monitoring Programme.
SEPA - Scottish Environment Protection Agency.
Separation Area - Radiologically classified area of Sellafield site.
Sievert - The SI unit of equivalent dose and effective dose.
Thorp (Thermal Oxide Reprocessing Plant) - A plant at Sellafield where oxide fuels from Advanced Gas Cooled Reactors and Light Water Reactors have been reprocessed since 1995.
TPH - Total Petroleum Hydrocarbons.
Triassic Period - A geological period of time spanning 50.9 million years and running from 252.17 million years ago to 201.3 million years ago.
UKAEA - United Kingdom Atomic Energy Authority.
Waste hierarchy - The waste hierarchy is a useful framework which sets out the order in which options for waste management should be considered, based on environmental impact. The framework is based on trying to avoid the creation of waste in the first instance, if this is not possible then working down the hierarchy trying to minimise, re-use/recycle as much of the waste as possible. The last resort is to dispose of the waste to landfill.
WHO - World Health Organisation.