
Cross-Government Fraud Landscape Report 2022/23 and 2023/24 (HTML)
Published 16 February 2026

© Crown copyright 2026
This publication is licensed under the terms of the Open Government Licence v3.0 except where otherwise stated. To view this licence, visit nationalarchives.gov.uk/doc/open-government-licence/version/3 or write to the Information Policy Team, The National Archives, Kew, London TW9 4DU, or email: psi@nationalarchives.gov.uk.
Where we have identified any third party copyright information you will need to obtain permission from the copyright holders concerned.
This publication is available at https://www.gov.uk/government/publications/cross-government-fraud-landscape-report-202223-and-202324/cross-government-fraud-landscape-report-202223-and-202324-html
Introduction
The UK Government aims to be the most transparent administration globally in its efforts to combat fraud within the public sector. As part of this commitment, the Public Sector Fraud Authority (PSFA) publishes the Fraud Landscape Report (FLR), providing analysis of trends, challenges and achievements in tackling fraud and error. This reaffirms the Government’s commitment to safeguarding public resources.
Excluding data related to tax and welfare fraud, which is reported separately by HM Revenue and Customs (HMRC) and the Department for Work and Pensions (DWP), this document highlights the evolving landscape of fraud within central government operations.
This report examines the levels of detected, recovered, and prevented fraud and error for the financial years 2022/23 and 2023/24. Covering a two year period allows the Government to share all of the data it currently holds on public sector fraud, outside of tax and welfare. We have introduced new ways of collecting the data and a stronger, more robust system of measuring performance and compliance with the functional standards, updates of which are included in this report. Going forward we expect future reports to be more timely.
The report outlines the ambitious financial targets set by departments and their progress against these. It also highlights the Functional Standard Assurance Programme, which helps to drive public sector counter fraud accountability and supports public bodies to identify and prioritise their counter fraud activity.
By utilising evidence-based data, the PSFA aims to enhance accountability and ensure fraud is an area of focus across public sector organisations.
PSFA is committed to providing a better understanding of the fraud risks and losses in the public sector. As part of this, we have increased the quality of the evidence that we gather and report. A major improvement in 2023/24 is the collation of data broken down by fraud typologies, which is shown throughout the 2023/24 section of this report. Departments also began reporting additional benefits, prosecutions and investigations in 2023/24. In addition, we have more confidence in the prevention numbers from 2022/23 onwards and that they are being driven by counter fraud activity, as these are now externally assessed by a group of counter fraud experts, before they can be reported.
Summary
The latest cross-government assessment indicates that counter fraud performance is improving. We have seen positive trends in the detection of fraud and error, the achievement of financial targets and the prevention of further losses.
- Detection of fraud and error has increased significantly since the pre-COVID baseline. Excluding extraordinary events, detection surpassed pre-COVID levels for the first time in 2023/24. This indicates that good work is being undertaken to understand and identify the problem. The better the public sector detects fraud and error, the better it is able to both find and recover losses, and build stronger controls to prevent such losses in the future.
- Both the financial targets set by government departments to measure their counter fraud performance, and their achievement against these targets, have increased year on year. Collectively, in-scope departments prevented and recovered £914m of fraud and error in 2023/24. When adjusted to exclude extraordinary events, their performance stands at £341m, which means they exceeded the financial target set for the period.
- Encouraging results are beginning to emerge from the preventative approach championed by the Government Counter Fraud Functional Strategy 2024-2027. 60% of organisations reviewed against the Government Functional Standard (GovS 013: Counter Fraud) attained a minimum rating of ‘Good’ in at least half of the sections in the standard. Public bodies may benefit from going further in two critical areas: identifying inherent fraud and error vulnerabilities and implementing more robust fraud risk assessments to address threats effectively.
Cross-government fraud and error reporting, 2019/20 to 2023/24
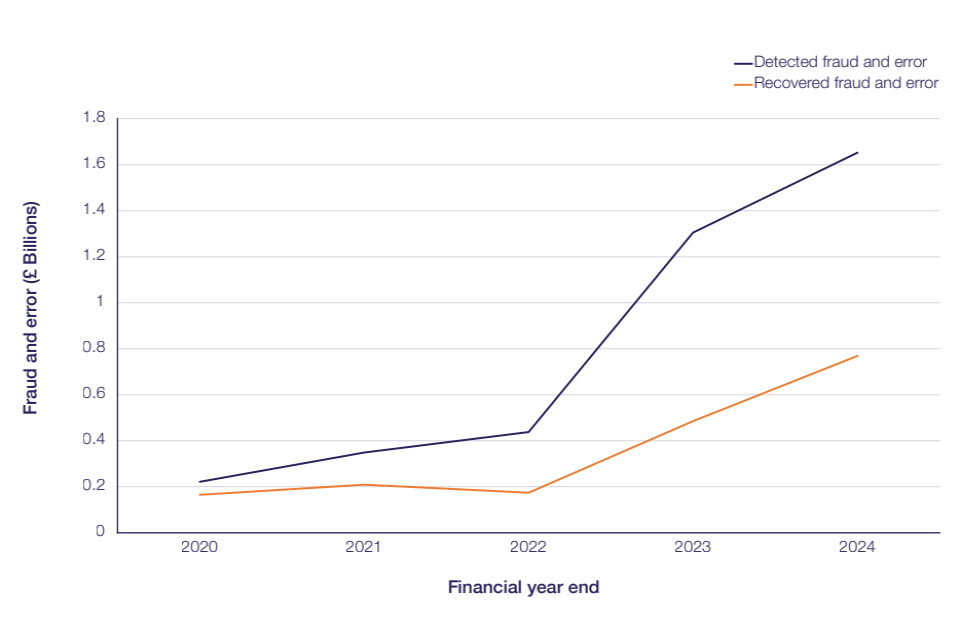
The chart below shows how much fraud and error has been detected and recovered by government departments since 2019/20.[footnote 1]
The chart suggests that both detection and recoveries have increased significantly since the pre-COVID baseline in 2019/20. This is largely due to the impact of extraordinary events and emergency situations such as the pandemic and rising energy prices.
Government departments are detecting and recovering more fraud and error
To note, prevented fraud and error have been removed, as the methodology for reporting prevention has evolved and improved over time. From 2022/23, it became mandatory for departments to assure all estimated or modelled savings through the PSFA Prevention Panel. Furthermore, departments could only report prevented error if it resulted from proactive detection such as fraud measurement or data matching, rather than the implementation of business-as-usual controls. It is therefore misleading to compare trends in prevention over time.
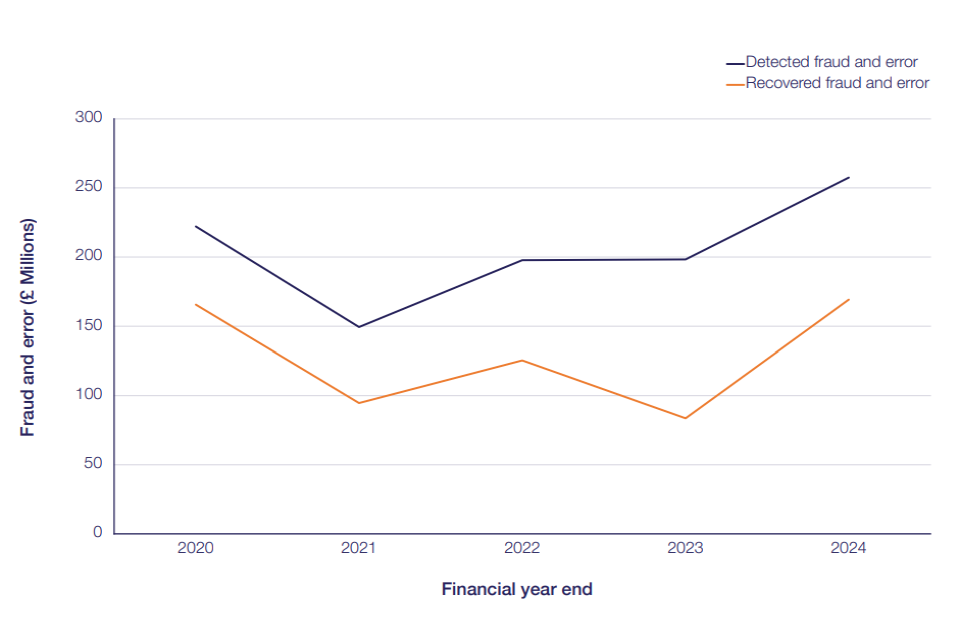
Excluding extraordinary events, detection and recoveries have returned to pre-COVID levels, with a slight increase in detection
The chart below shows cross-government fraud and error reporting excluding extraordinary events. See Annex A for full details.
Detected, prevented and recovered fraud
The data presented in the following two sections sets out the detected, prevented and recovered fraud and error that departments have reported to the Public Sector Fraud Authority. Alongside this, for 2023/24 we have collected further information on additional financial benefits as a result of counter fraud activity, beyond prevention and recoveries.
Scope of the data
HMRC and DWP separately publish data on fraud and error relating to the tax and welfare systems, for example tax evasion and benefit fraud. Therefore, this data on detected, prevented and recovered fraud and error only includes HMRC and DWP’s internal fraud and error, i.e. where it has been carried out by a government employee or contractor.
Fraud versus error
Government departments and public bodies report on both fraud and error. In this context, the difference between fraud and error is the intent of the individual or organisation involved in the incorrect payment. This intent is established on the balance of probabilities, in line with the government’s definition for reporting fraud. As such, there are elements of both subjectivity and uncertainty in the reporting, as it will be dependent on the extent to which a public body has evidence of intention, and their assessment of this evidence.
The impact of COVID-19
Where possible, we have provided figures that are broken down to show the fraud and error that occurred as a result of COVID-19 and that which is business-as-usual activity (i.e. non-COVID related).
Section one - 2023/24
Performance headlines
1. Detected fraud and error
- £1.7bn of detected fraud and error reported to the PSFA in 2023/24.
- 27% increase in detected fraud and error in 2023/24 compared to 2022/23.
- Detected fraud increased by £21m (3%) and detected error increased by £327m (67%).
- Detected fraud and error relating to business-as-usual activity increased by £257m (45%) and in COVID-19 activity by £91m (12%).
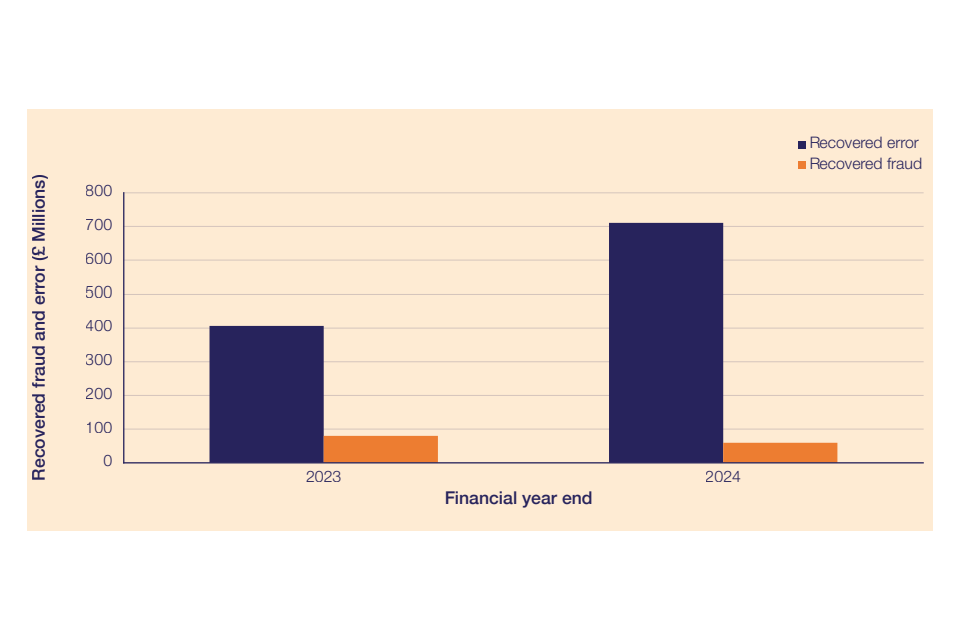
2. Recovered fraud and error
- £770m of recovered fraud and error reported to the PSFA in 2023/24.
- 58% increase in recovered fraud and error in 2023/24 compared to 2022/23.
- Recovered fraud decreased by £20m (25%), while recovered error increased by £304m (75%).
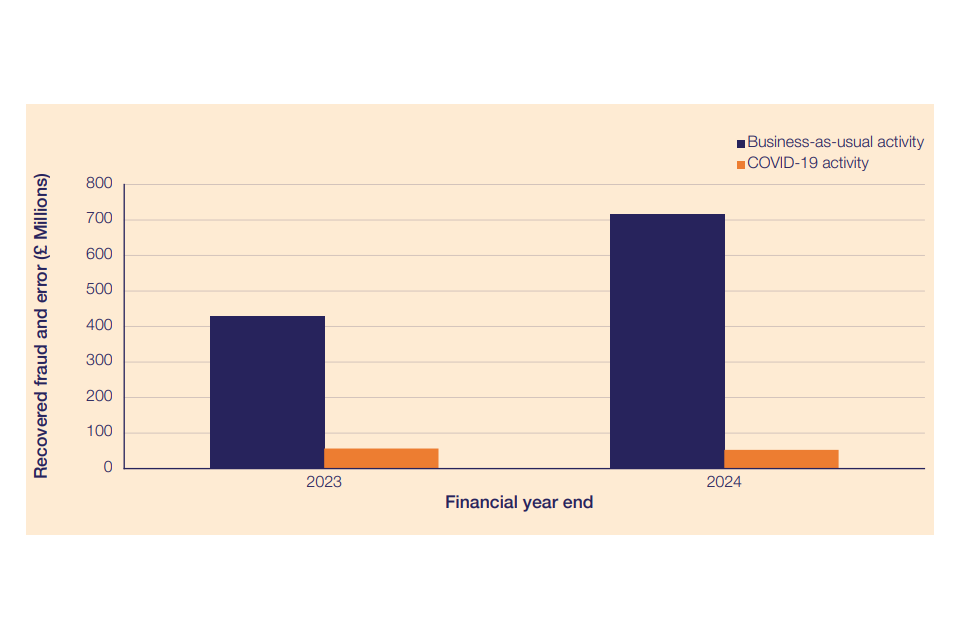
- Recovered fraud and error increased by £288m (67%) in business-as-usual activity, but decreased by £4m (6%) in COVID-19 activity.
3. Prevented fraud and error
- £413m of prevented fraud and error reported to the PSFA in 2023/24.
- Prevented fraud and error increased by £212m (106%) compared to 2022/23.
- Prevented fraud and error increased by £214m (116%) in business-as-usual activity, but decreased by £1m (8%) in COVID-19 activity.
Detected fraud and error - 2023/24
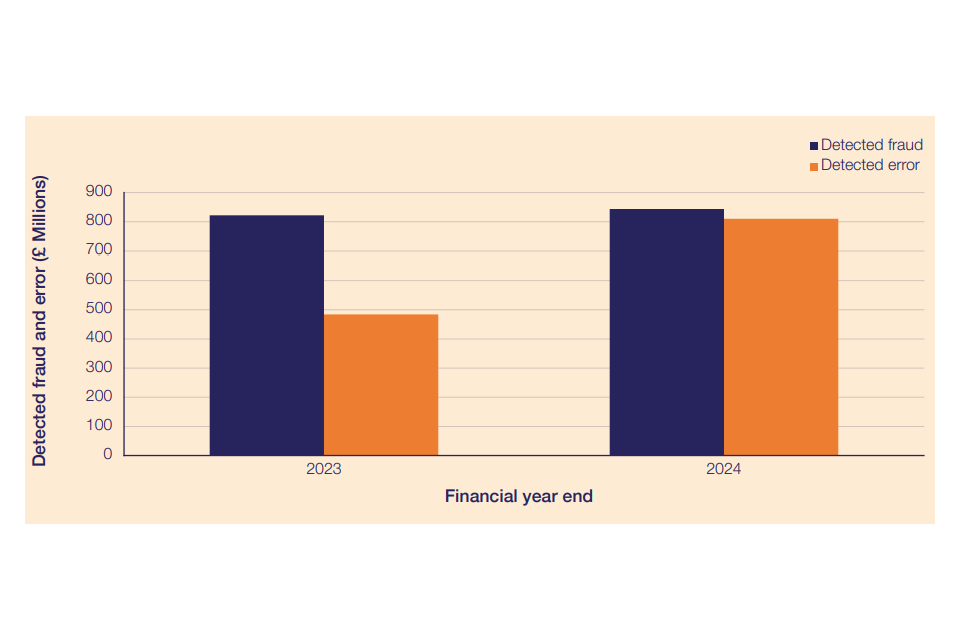
Central government organisations reported £1.7bn of detected fraud and error to the PSFA in 2023/24. This was the highest value of detected fraud and error reported in a single year to date. It represents an increase of £348m (27%) on 2022/23, when organisations reported £1.3bn of detected fraud and error.
As seen below, most of the change is due to an increase in detected error of £327m (67%) compared to fraud, which increased by £21m (3%).
More fraud and error was detected in 2024/24, mostly due to a rise in detected error
Why did we see an increase in detected error in 2023/24?
The main cause of the increase in detected error in 2023/24 was the Department for Energy Security and Net Zero (DESNZ). It reported £411m of detected error through the energy affordability support schemes, now closed, equivalent to less than 1% of the schemes’ total value. This accounted for 51% of total cross-government reporting of detected error. The energy affordability support schemes refer to government initiatives and supplier obligations aimed at helping households and businesses afford energy bills. The schemes were exceptional, as they addressed the impact of rising energy prices affecting the global market. DESNZ reported having recovered a similar amount of error in 2023/24, which is explained in the next section. Excluding these schemes, organisations reported £413m of detected error in 2023/24, representing a 7% decrease on the £445m reported in 2022/23.
What else do we know?[footnote 2]
- The business areas that reported the majority of detected fraud and error by total value were grants, procurement and personnel.
- The largest share of detected fraud was committed by private companies, followed by members of the public.
- The majority of detected fraud was committed through false representation. The largest share was committed by substituting or mis-selling products.
- The majority of detected error was committed by suppliers.
How did COVID-19 affect these figures?
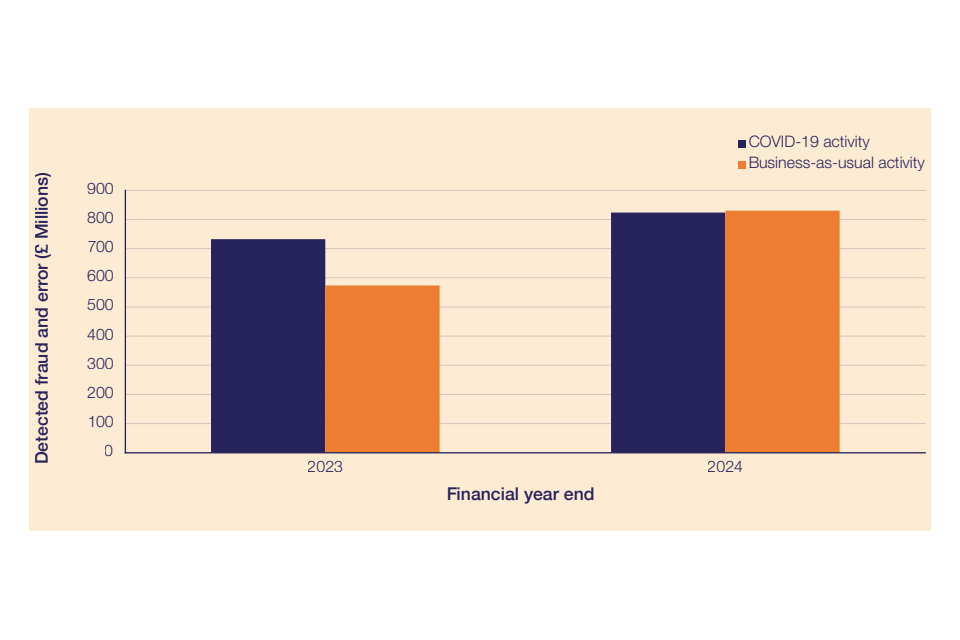
Excluding COVID-19 schemes, central government organisations reported £830m of detected fraud and error in 2023/24. This represents an increase of £257m (45%) on 2022/23, when organisations reported £574m of detected fraud and error in their business-as-usual activity.
Detected fraud and error in COVID-19 activity accounted for £824m (50%) of total detection in 2023/24 and increased by £91m (12%) compared to 2022/23.
Departments found similar levels of fraud and error in their COVID-19 and business-as-usual activity
Recovered fraud and error - 2023/24
Departments are required to report the amount of fraud and error they recover each year. It is a government priority to recover money which has been lost to fraud and error.
Central government organisations reported £770m of recovered fraud and error to the PSFA in 2023/24. This represents an increase of £284m (58%) on 2022/23, when organisations reported £486m of recovered fraud and error.
As seen below, most of the change is due to an increase in recovered error of £304m (75%) compared to fraud, which decreased by £20m (25%).
Recovered error increased by more than 70% in 2023/24
Why did we see an increase in recovered error in 2023/24?
The main cause of the increase in recovered error in 2023/24 is the Department for Energy Security and Net Zero. It successfully recovered £406m of error, mostly through the energy affordability support schemes described in the previous section. This accounted for 57% of total recovered error across government and is equivalent to a recovery rate of approximately 98% in these schemes. Excluding these schemes, organisations reported £313m of recovered error in 2023/24, representing a 15% decrease on the £368m reported in 2022/23.
What else do we know?[footnote 3]
- The business areas that reported the majority of recovered fraud and error by total value were grants, procurement and personnel.
- The majority of fraud was recovered from private sector companies, followed by members of the public.
- The majority of fraud was recovered from perpetrators who had committed fraud through false representation. The largest share was recovered from perpetrators who had committed fraud by falsifying invoices.
- The majority of recovered fraud and error was achieved through offsetting, followed by voluntary repayment. The majority of error was recovered by staff in non-counter fraud roles.
How did COVID-19 affect these figures?
Excluding COVID-19 schemes, central government organisations reported £718m of recovered fraud and error in 2023/24. This represents an increase of £288m (67%) on 2022/23, when organisations reported £430m of recovered fraud and error in their business-as-usual activity.
Recovered fraud and error in COVID-19 activity accounted for £53m (7%) of total recoveries in 2023/24 and decreased by £4m (6%) compared to 2022/23.
Recoveries in business-as-usual activity increased by more than 60% in 2023/24
Prevented fraud and error - 2023/24
Central government organisations reported £413m of prevented fraud and error to the PSFA in 2023/24. This represents an increase of £212m (106%) on 2022/23, when organisations reported £201m of prevented fraud and error.
The prevented fraud and error reported in 2023/24 had three components:
Actual savings at the point of detection
This relates to instances of payments prevented from being processed due to the detection of fraud. The value of the prevented payments can therefore be evidenced with certainty.
Actual savings accounted for £159m (38% of the total). The majority of these savings were achieved through activities to prevent fraud through false representation, most of which were related to the prevention of falsified applications.
Future loss prevented
These are calculated savings that show that fraud or error would have continued for a period of time had it not been detected in the first place, and would subsequently have resulted in a financial loss. Calculated savings should be arrived at through evidenced and agreed assumptions. These savings accounted for £201m (49% of the total).
Upstream prevention
Upstream savings are generated from the implementation of new processes, policies or controls that reduce the amount of fraud or error in a given payment stream or scheme. The savings are calculated by measuring fraud or error both pre- and post-implementation.
These savings accounted for £53m (13% of the total). The full sum was reported by the NHS Business Services Authority, following the implementation of an upstream control in its Prescription Exemption Checking Service. This was approved by the PSFA Prevention Panel in May 2024, so although the control was in place before, this is the first time that there has been a measurement for these savings.
How did COVID-19 affect these figures?
Excluding COVID-19 schemes, central government organisations reported £398m of prevented fraud and error in 2023/24. This represents an increase of £214m (116%) on 2022/23, when organisations reported £184m of prevented fraud and error in their business-as-usual activity.
Prevented fraud and error in COVID-19 activity accounted for £16m (4%) of total prevention in 2023/24 and decreased by £1m (8%) compared to 2022/23.
Additional counter fraud benefits - 2023/24
This section refers to additional financial benefits as a result of counter fraud activity, beyond prevention, detection and recoveries.
Additional counter fraud benefits
Departments began reporting the value of additional counter fraud benefits to the PSFA in 2023/24. Additional benefits are received through public bodies detecting fraud and utilising the enforcement actions that are available to them. This new area of reporting allows the PSFA to recognise and demonstrate the positive financial impact that counter fraud activity has on the public sector.
The total value of these benefits was £37m in 2023/24. The benefits reported were:
1. Sanctions
Financial sanctions such as fines and penalties that are awarded to public bodies via criminal and civil routes.
- Civil sanctions, which accounted for £35m (95% of the total). The majority of this value is due to the NHS Business Services Authority, which reported £20m of penalty charge and surcharge payments related to the Prescription Exemption Checking Service and the Dental Exemption Checking Service.
- Criminal sanctions, which accounted for £1m (3% of the total). This is due to the Ministry of Justice, which reported a voluntary repayment as part of a deferred prosecution agreement with a supplier.
2. Benefits via the Proceeds of Crime Act 2002
Benefits via the Proceeds of Crime Act 2002 accounted for £1m (2% of the total). The Proceeds of Crime Act 2002 is legislation that allows for money or assets gained through criminal activity to be recovered. Our reporting captures confiscations or civil recoveries which specifically relate to fraud against the public sector. The benefits reported here refer to the share of assets received by the organisation. The largest share of this value was reported by HM Land Registry, Ministry of Defence and the Department for Work and Pensions respectively.
Supplementary Information
Fraud and bribery allegations
Central government organisations reported having received 13,520 allegations of fraud in 2023/24. This represents an increase of 19% on 2022/23, when organisations reported having received 11,323 allegations of fraud. The number of fraud allegations reported in previous years has fluctuated between a low of 5,115 in 2020/21 and a high of 13,833 in 2021/22.
Organisations reported having received 49 allegations of bribery in 2023/24. Of all fraud and bribery allegations reported in 2023/24, 509 allegations came as a result of whistleblowing.
Investigations
Central government organisations reported opening 8,069 investigations relating to fraud in 2023/24 and reported closing 9,345 such investigations. This was the first year that departments reported investigations figures to the PSFA.
They reported opening 43 investigations relating to bribery and closing 23 such investigations.
Fraud against the public
Fraud against the public refers to fraud that was facilitated by impersonation of the Government. This type of fraud does not result in a direct financial loss to the Exchequer. It can include using forged Government documents or impersonating Government online to defraud members of the public. We capture instances of fraud against the public to understand the wider impact of public sector fraud beyond the financial losses to the Government. Organisations have reported on fraud against the public to the PSFA and its predecessors since 2016/17.
Central government organisations reported 2,148 instances of fraud against the public in 2023/24 (excluding DWP and HMRC). This represents a decrease of 47% on 2022/23, when organisations reported 4,058 instances of fraud against the public. The decrease was driven by fewer instances of fraud against the public reported by the DVLA, which in both years reported high numbers of misleading third-party websites, phishing emails, phishing text messages and social media accounts offering fraudulent services.
Section two - 2022/23
Please see details on the scope and background to the data on page X. Since 2022/23, the PSFA has improved and increased the data that we collect, meaning that the following section is lighter in detail.
Detected fraud and error - 2022/23
Central government organisations reported £1.3bn of detected fraud and error to the PSFA in 2022/23. Excluding MOD[footnote 4], this represents an increase of £867m (198%) on 2021/22, when organisations reported £438m of detected fraud and error. The main drivers are the amount of COVID-19 fraud identified and the reporting of error by the NHS Business Services Authority.
Organisations reported £822m of detected fraud (63% of the total) and £484m of detected error (37% of the total). Excluding MOD, detected fraud increased by £620m (307%) and detected error increased by £247m (105%) compared to 2021/22.
Why did we see an increase in detected fraud in 2022/23?
Reporting of detected fraud increased in 2022/23 due to more fraud being identified in a COVID-19 scheme administered by the British Business Bank. The organisation reported £673m of suspected fraud in its Bounce Back Loan Scheme in 2022/23, accounting for 82% of the cross-government total. British Business Bank was part of the Department for Business, Energy and Industrial Strategy in 2022/23. It is now part of the Department for Business and Trade.[footnote 5]
How did COVID-19 affect these figures?
Excluding COVID-19 schemes, central government organisations reported £574m of detected fraud and error in 2022/23. Excluding MOD, this represents an increase of £330m (137%) on 2021/22, when organisations reported £242m of detected fraud and error in their business-as-usual activity. Detected fraud within business-as-usual activity decreased by less than £1m compared to 2021/22, while detected error increased by £331m (230%). This increase is due to a new reporting line from the NHS Business Services Authority, which is explained in the next section.
Recovered fraud and error - 2022/23
Central government organisations reported £486m of recovered fraud and error to the PSFA in 2022/23. This represents an increase of £311m (178%) on 2021/22, when organisations reported £175m of recovered fraud and error.
Organisations reported £80m of recovered fraud (16% of the total) and £406m of recovered error (84% of the total). Recovered fraud increased by £27m (50%) and recovered error increased by £285m (234%) compared to 2021/22.
Why did we see an increase in recovered error in 2022/23?
Reporting of recovered error increased in 2022/23 because there was a new reporting line from the NHS Business Services Authority, a public body of the Department of Health and Social Care. It reported £310m of recovered error in 2022/23, representing 76% of the cross-government total. The vast majority of this figure is due to the detection and recovery of error in its support services, such as administering payments to dentists.
How did COVID-19 affect these figures?
Excluding COVID-19 schemes, central government organisations reported £430m of recovered fraud and error in 2022/23. This represents an increase of £270m (168%) on 2021/22, when organisations reported £160m of recovered fraud and error in their business-as-usual activity.
Organisations reported £30m of recovered fraud (7% of the total) and £400m of recovered error (93% of the total) in their business-as-usual activity. Recovered fraud within business-as-usual activity decreased by £22m (42%) compared to 2021/22, while recovered error increased by £292m (270%).
Prevented fraud and error - 2022/23
Central government organisations reported £201m of prevented fraud and error to the PSFA in 2022/23. This represents a decrease of £133m (40%) on 2021/22, when organisations reported £334m of prevented fraud and error.
The prevented fraud and error reported in 2022/23 had two components:
- Actual savings at the point of detection, which accounted for £160m (80% of the total).
- Estimated or modelled savings, which accounted for £41m (20% of the total).
How did COVID-19 affect these figures?
Excluding COVID-19 schemes, central government organisations reported £184m of prevented fraud and error in 2022/23. This represents a decrease of £135m (42%) on 2021/22, when organisations reported £319m of prevented fraud and error in their business-as-usual activity.
Why did we see a decrease in prevented fraud and error in 2022/23?
The main reason for the decrease in prevented fraud and error is a change to our reporting guidance. From 2022/23, it became mandatory for departments to assure all estimated or modelled savings through the PSFA Prevention Panel. Furthermore, departments could only report prevented error if it resulted from proactive detection, such as fraud measurement or data matching, rather than as a result of business-as-usual activity.
Scale of the challenge - 2022/23 iceberg
The fraud ‘iceberg’ estimates the level of fraud and error in government spending outside of COVID-19 schemes. It covers three elements to show the scale of public sector fraud:
- Fraud and error that has been detected
- Government estimates of the levels of fraud and error
- The range of unknown fraud and error
Data for 2022/23 puts the estimated fraud and error in government between £51.3bn and £81.0bn, outside of COVID-19 schemes[footnote 6]. This calculation includes tax and welfare and is based on established and published estimates where fraud and error measurement has been undertaken to a high standard, along with an estimated range of 0.5% to 5.0% on the areas where high-quality measurement work has not been carried out.
In 2021/22 the PSFA estimated that the level of fraud and error was between £39.8bn and £58.5bn. In previous years the ‘ceiling’ of the estimate has remained broadly flat. Our latest model shows this is no longer the case, with both the ‘floor’ and ‘ceiling’ of the estimate rising. This indicates a significant increase and highlights the widening of the estimated range. Higher government spending and estimates of fraud and error have contributed to this increase.
It is important to note that this range reflects the estimated level of fraud and error before any government intervention. It is not actual loss, as it excludes the impact of prevention, detection, and recovery activity.
Our fraud and error estimate relates to between 3.0% and 4.8% of overall government expenditure and income.
Whilst COVID-19 schemes are excluded from this iceberg, the estimated fraud and error sits at £10.9 billion, as outlined in the Cross Government Fraud Landscape Report 2021-22. Updated evidence has significantly improved our understanding of the nature of error and fraud in the COVID-19 support schemes.
Section three - 2022-24
Financial targets
As part of its work to modernise counter fraud activity, the government asked departments to set targets for their counter fraud work based on the financial impact they have. The overall aim is to drive performance and increase transparency.
What are financial targets?
Financial targets consider both prevented and recovered fraud and error, alongside additional counter fraud benefits[footnote 7]. Departments are expected to have a financial target which shows a positive return on investment and an increase in ambition. A clear rationale is required where this is not possible. This is a key element of our work, as laid out in the PSFA Mandate and shaped by Ministers and Senior Officials.
How are departments doing?
The below diagram shows the cross-government financial targets journey so far, demonstrating an increased drive and ambition to find and deal with fraud.
1. £201.8m
- 22/23 Performance: Figure collected in the CDR, before targets were introduced
2. £331.4m
- 23/24 Target: First year of targets
3. £341.3m
- 23/24 Performance: Total fraud and error reported in 23/24 was £913.5m, when adjusted for anomalies this figure was £341.3m
In 2023/24, 14 government departments (excluding DWP and HMRC) set financial targets totalling £331.4m for their counter fraud work. As can be seen, the total fraud and error prevented and recovered in 2023/24, for those departments in scope for financial targets, was £913.5m. When adjusted for one-off events unlikely to recur and excluding these from the total, the performance across departments was £341.3m, therefore exceeding the ambition for 2023/24. HMRC agrees its financial targets for activity on fraud and error in the tax system with HM Treasury Ministers. DWP achieved AME savings of £1.35bn against a target of £1.3bn in 2023-24 from dedicated counter fraud and error resources.
The financial targets setting process will continue to evolve in line with the government’s continued ambition to increase its impact against fraud and error.
COVID-19 analysis
Tom Hayhoe was appointed as COVID Counter Fraud Commissioner on 3 December 2024, for a fixed term of one year. This public appointment—reporting directly to the Chancellor of the Exchequer—was established to provide independent assurance that all possible measures have been taken to recover public funds lost to fraud during the pandemic.
The Commissioner reviewed losses of public money due to fraud, error, and underperforming contracts during the COVID-19 pandemic, initially focusing on contracts for personal protective equipment (PPE). Phase two of his work has included other major COVID schemes such as Furlough, Bounce Back Loans, Business Support Grants, Eat Out to Help Out, and COVID-era Universal Credit fraud.
The Commissioner has assessed recovery efforts to date and reviewed individual contracts to provide additional scrutiny and assurance regarding disputed spending.
In addition, the Commissioner launched a voluntary repayment scheme in September, providing an opportunity for individuals and businesses to return money received during the pandemic, as a way to bolster government recovery effects.
In concluding his work, he will make recommendations to ensure that maximum recovery efforts have been undertaken, provide assurance on this to the public and Parliament, and generate lessons for the future.
Through this work, the Commissioner is playing a key role in restoring public trust and acting as a deterrent to fraudsters in future government schemes.
Functional Standard Assurance
The Government Functional Standard GovS 013: Counter Fraud sets the minimum expectations for the management of fraud, bribery and corruption risk in government organisations, including a basic checklist. In 2023, the PSFA developed a new Continuous Improvement Assessment Framework (CIAF), to assess compliance of organisations against the standard and measure relative counter fraud maturity across government.
The Functional Standard Assurance (FSA) Programme uses the CIAF model to review compliance and rate sections as ‘In development’, ‘Good’, ‘Better’ or ‘Best’. In order to achieve the minimum compliance with the Standard, organisations are required to meet all of the criteria within the ‘Good’ category.
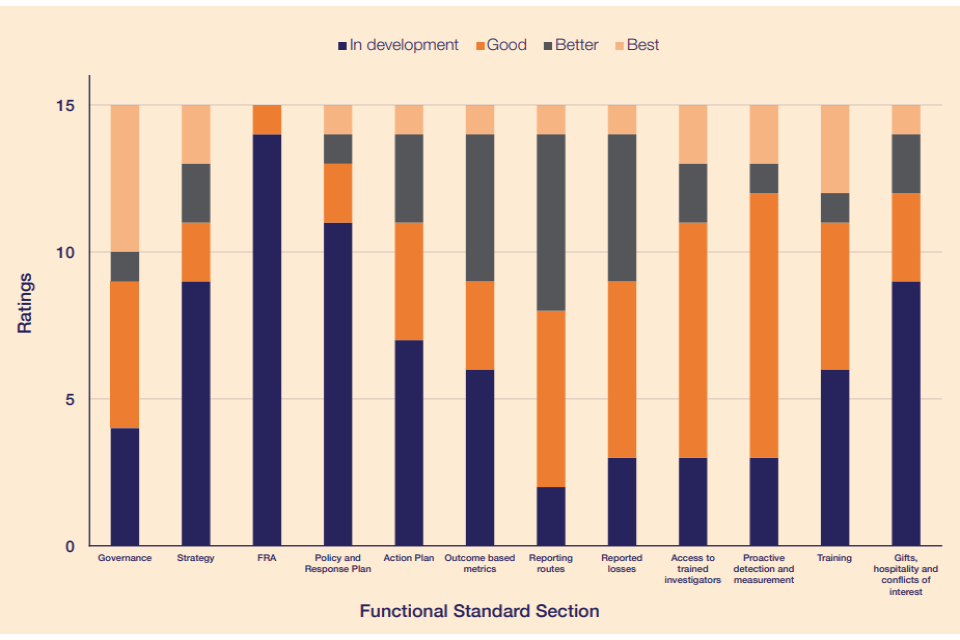
Functional Standard Assurance 2023/24: outcome and trends
The 15 organisations reviewed were positively engaged with the FSA Programme. However, overall performance highlighted that only one organisation met the Standard, having attained a minimum overall rating of ‘Good’ across all 12 sections.
Whilst variance was observed in the 2023/2024 cohort, there are notable areas of strength demonstrated, including the presence of an Accountable Board Member for counter fraud and senior-level accountability and buy-in. This ensures that fraud risks and losses are discussed by all executive boards at least annually.
60% of organisations reviewed attained a minimum rating of ‘Good’ in six sections or more. With the exception of Fraud Risk Assessments, at least one organisation achieved ‘Best’ in each of the other 11 sections.
It is recognised that many organisations were found to be ‘In development’ overall, which reflects the maturity of departmental counter fraud functions. The FSA 2023/2024 Programme observed the following trends where further development is required:
- One organisation met the standard in Fraud Risk Assessment.
- 50% of organisations reviewed analysed their own fraud and error data, with even fewer using this to inform future activity (40%), although this data is reported to the PSFA.
- Although most organisations undertake proactive activity to detect fraud, this is done at a fairly fundamental level, with only 20% actively undertaking fraud measurement.
- 33% of organisations reviewed had access to investigators that meet the Government Counter Fraud Profession’s Counter Bribery and Corruption Standard.
Public sector organisations are committed to getting the basics in place to manage fraud, bribery and corruption risk. To date, organisations that have undergone FSA reviews have cited this as a useful tool, and are taking action, including enhancing their counter fraud action plans to address the relevant activity required.
Distribution of ratings per section of the Government Functional Standard GovS 013; Counter Fraud
Annex A: trends over time
The table below compares detection in recent years with the pre-COVID baseline, excluding extraordinary events.
| Detection | 2019/20 | 2020/21 | 2021/22 | 2022/23 | 2023/24 |
|---|---|---|---|---|---|
| Detected fraud | £55.0m | £40.2m | £97.8m | £97.5m | £54.4m |
| Detected error | £167.1m | £109.1m | £99.9m | £100.7m | £203.1m |
| Total | £222.1m | £149.3m | £197.7m | £198.2m | £257.4m |
The table below compares recoveries in recent years with the pre-COVID baseline, excluding extraordinary events.
| Recoveries | 2019/20 | 2020/21 | 2021/22 | 2022/23 | 2023/24 |
|---|---|---|---|---|---|
| Recovered fraud | £25.5m | £8.8m | £52.0m | £29.9m | £40.6m |
| Recovered error | £140.1m | £85.9m | £73.4m | £53.7m | £128.6m |
| Total | £165.6m | £94.7m | £125.4m | £83.6m | £169.2m |
The extraordinary events excluded in the above tables are:
- fraud and error in COVID-19 schemes;
- fraud in the Ministry of Defence due to a change in reporting methodology, which is explained within this report;
- error in the NHS Business Services Authority, due to a new reporting line;
- and error in the energy bill support schemes, which is again explained in this report.
Why have we used 2019/20 as the pre-COVID baseline?
When defining the pre-COVID baseline, we use 2019/20 data for a number of reasons:
- Before 2019/20 we do not have a breakdown of data by department.
- The relevant COVID-19 schemes did not begin until Q1 2020/21 (i.e. the Bounce Back Loan Scheme and the High Priority Lane for procurement of personal protective equipment).
- We cannot compare prevention like-for-like before 2022/23 because of the change in our reporting guidance.
Annex B: data tables, 2023/24
The tables below show the total amount of detected, recovered and prevented fraud and error reported by government departments and their arm’s length bodies in 2023/24, both including and excluding COVID-19.
The reporting for DWP and HMRC is internal fraud and error only—that is, carried out by a government employee or contractor—and as such excludes welfare benefits, tax and HMRC-administered COVID-19 schemes.
All figures include outliers, which are exceptional instances that we do not expect to occur again in the future. Examples may include, for instance, unusually high value error within a time-limited government scheme.
All departmental fraud and error figures are rounded up or down accordingly to the nearest £0.1m. There may be small discrepancies in the overall total due to rounding.
Detected fraud and error by department including outliers, 2023/24
| Department group | Detected fraud and error (excluding COVID-19) | Detected fraud and error (including COVID-19) |
|---|---|---|
| Department for Business & Trade | £2.2m | £783.6m |
| Department for Energy Security & Net Zero | £411.2m | £411.2m |
| Department of Health & Social Care | £184.7m | £226.2m |
| Department for Education | £84.8m | £84.9m |
| Department for Transport | £45.1m | £45.4m |
| Department for Levelling Up, Housing & Communities | £35.8m | £35.8m |
| Foreign, Commonwealth & Development Office | £17.8m | £17.8m |
| Cabinet Office | £12.9m | £12.9m |
| Department for Environment, Food & Rural Affairs | £8.5m | £8.5m |
| Home Office | £8.1m | £8.1m |
| Department for Science, Innovation & Technology | £7.2m | £7.4m |
| Department for Culture, Media & Sport | £3.2m | £3.4m |
| HM Revenue & Customs | £2.1m | £2.1m |
| Ministry of Justice | £2.1m | £2.1m |
| Ministry of Defence | £1.5m | £1.5m |
| Department for Work & Pensions | £1.3m | £1.3m |
| HM Treasury | £0.9m | £0.9m |
| UK Export Finance | £0.8m | £0.8m |
| Total | £830.4m | £1,654.0m |
Recovered fraud and error by department including outliers, 2023/24
| Department group | Recovered fraud and error (excluding COVID-19) | Recovered fraud and error (including COVID-19) |
|---|---|---|
| Department for Energy Security & Net Zero | £406.3m | £406.3m |
| Department of Health & Social Care | £163.4m | £187.1m |
| Department for Education | £66.7m | £66.8m |
| Department for Transport | £36.5m | £36.5m |
| Department for Business & Trade | £2.1m | £30.8m |
| Cabinet Office | £11.0m | £11.0m |
| Foreign, Commonwealth & Development Office | £8.7m | £8.7m |
| Home Office | £7.5m | £7.5m |
| Department for Environment, Food & Rural Affairs | £4.9m | £4.9m |
| Department for Levelling Up, Housing & Communities | £2.1m | £2.1m |
| Ministry of Justice | £1.9m | £1.9m |
| Department for Science, Innovation & Technology | £1.7m | £1.8m |
| UK Export Finance | £1.5m | £1.5m |
| Ministry of Defence | £1.3m | £1.3m |
| HM Revenue & Customs | £1.0m | £1.0m |
| Department for Culture, Media & Sport | £0.7m | £0.7m |
| HM Treasury | £0.2m | £0.2m |
| Department for Work & Pensions | £0.1m | £0.1m |
| Total | £717.7m | £770.2m |
Prevented fraud and error by department including outliers, 2023/24
| Department group | Prevented fraud and error (excluding COVID-19) | Prevented fraud and error (including COVID-19) |
|---|---|---|
| Department of Health & Social Care | £103.8m | £119.4m |
| Department for Education | £104.1m | £104.1m |
| Department for Energy Security & Net Zero | £93.8m | £93.8m |
| Department for Levelling Up, Housing & Communities | £44.0m | £44.0m |
| Department for Business & Trade | £22.3m | £22.3m |
| Department for Science, Innovation & Technology | £16.3m | £16.4m |
| Department for Culture, Media & Sport | £4.0m | £4.0m |
| Department for Transport | £2.5m | £2.5m |
| UK Export Finance | £2.4m | £2.4m |
| Department for Work & Pensions | £1.0m | £1.0m |
| Home Office | £0.9m | £0.9m |
| Ministry of Defence | £0.7m | £0.7m |
| HM Treasury | £0.6m | £0.6m |
| Ministry of Justice | £0.5m | £0.5m |
| Department for Environment, Food & Rural Affairs | £0.4m | £0.4m |
| Foreign, Commonwealth & Development Office | £0.3m | £0.3m |
| Cabinet Office | £0.0m | £0.0m |
| HM Revenue & Customs | £0.0m | £0.0m |
| Total | £397.5m | £413.2m |
Annex C: data tables, 2022/23
The tables below show the total amount of detected, recovered and prevented fraud and error reported by government departments and their arm’s length bodies in 2022/23, both including and excluding COVID-19.
The reporting for DWP and HMRC is internal fraud and error only—that is, carried out by a government employee or contractor—and as such excludes welfare benefits, tax and HMRC-administered COVID-19 schemes.
All figures include outliers, which are exceptional instances that we do not expect to occur again in the future. Examples may include, for instance, unusually high value error within a time-limited government scheme.
All departmental fraud and error figures are rounded up or down accordingly to the nearest £0.1m. There may be small discrepancies in the overall total due to rounding.
Detected fraud and error by department including outliers, 2022/23
| Department group | Detected fraud and error (excluding COVID-19) | Detected fraud and error (including COVID-19) |
|---|---|---|
| Department for Business, Energy & Industrial Strategy | £50.5m | £725.1m |
| Department of Health & Social Care | £368.9m | £418.4m |
| Department for Education | £93.0m | £97.3m |
| Cabinet Office | £15.2m | £15.2m |
| Department for Transport | £7.0m | £10.2m |
| Department for Environment, Food & Rural Affairs | £8.6m | £8.6m |
| Home Office | £7.9m | £7.9m |
| Department for Levelling Up, Housing & Communities | £7.1m | £7.1m |
| HM Treasury | £4.8m | £4.8m |
| Foreign, Commonwealth & Development Office | £2.4m | £2.4m |
| Department for Culture, Media & Sport | £1.5m | £2.2m |
| HM Revenue & Customs | £2.1m | £2.1m |
| Ministry of Justice | £1.6m | £1.9m |
| Ministry of Defence[footnote 8] | £1.3m | £1.3m |
| Department for Work & Pensions | £0.9m | £0.9m |
| Department for International Trade | £0.7m | £0.7m |
| Total | £573.6m | £1,306.2m |
Recovered fraud and error by department including outliers, 2022/23
| Department group | Recovered fraud and error (excluding COVID-19) | Recovered fraud and error (including COVID-19) |
|---|---|---|
| Department of Health & Social Care | £335.5m | £383.3m |
| Department for Business, Energy & Industrial Strategy | £43.5m | £47.8m |
| Department for Education | £16.6m | £17.0m |
| Cabinet Office | £12.1m | £12.1m |
| Department for Environment, Food & Rural Affairs | £6.1m | £6.1m |
| Department for Transport | £2.3m | £5.5m |
| Home Office | £3.3m | £3.3m |
| HM Treasury | £3.2m | £3.2m |
| Foreign, Commonwealth & Development Office | £2.1m | £2.1m |
| Department for Culture, Media & Sport | £0.9m | £1.4m |
| Department for Levelling Up, Housing & Communities | £1.4m | £1.4m |
| Ministry of Defence | £1.2m | £1.2m |
| HM Revenue & Customs | £1.0m | £1.0m |
| Department for International Trade | £0.5m | £0.5m |
| Ministry of Justice | £0.2m | £0.2m |
| Department for Work & Pensions | £0.0m | £0.0m |
| Total | £430.0m | £486.1m |
Prevented fraud and error by department including outliers, 2022/23
| Department group | Prevented fraud and error (excluding COVID-19) | Prevented fraud and error (including COVID-19) |
|---|---|---|
| Department of Health & Social Care | £93.3m | £93.5m |
| Department for Education | £38.0m | £54.8m |
| Department for Business, Energy & Industrial Strategy | £47.9m | £47.9m |
| Department for Work & Pensions | £1.4m | £1.4m |
| Department for Environment, Food & Rural Affairs | £1.0m | £1.0m |
| Department for Culture, Media & Sport | £0.8m | £0.8m |
| Department for Transport | £0.7m | £0.7m |
| Ministry of Defence | £0.5m | £0.5m |
| Department for International Trade | £0.2m | £0.2m |
| Ministry of Justice | £0.1m | £0.1m |
| Foreign, Commonwealth & Development Office | £0.0m | £0.0m |
| Department for Levelling Up, Housing & Communities | £0.0m | £0.0m |
| Home Office | £0.0m | £0.0m |
| Cabinet Office | £0.0m | £0.0m |
| HM Revenue & Customs | £0.0m | £0.0m |
| HM Treasury | £0.0m | £0.0m |
| Total | £183.9m | £200.9m |
-
To note, this chart excludes data on fraud and error relating to the tax and welfare systems. Data from the Ministry of Defence has also been removed from the cross-government totals for consistency. Before 2022/23, the department used a different methodology for reporting detected fraud, derived from the value of fraud allegations. Excluding this data does not have a material impact on the cross-government view. ↩
-
These insights exclude data on the Bounce Back Loan Scheme administered by the British Business Bank, which was reported to the PSFA in a different format. ↩
-
These insights exclude data on the Bounce Back Loan Scheme administered by the British Business Bank, which was reported to the PSFA in a different format. ↩
-
To note, MOD figures have been removed from the cross-government trend analysis in this section for consistency. Before 2022/23 the department used a different methodology for reporting detected fraud that was derived from the value of fraud allegations. This does not have a material impact on the cross-government view. ↩
-
The British Business Bank has revised its methodology for reporting detected fraud to the PSFA since the previous Fraud Landscape Report. Its methodology is now aligned with the performance data that it publishes on the Bounce Back Loan Scheme. ↩
-
To note, the National Audit Office also produces an estimate in their document ‘Estimating and reporting fraud and error in annual reports and accounts (PDF, 1,378KB)’ which shows a range of £55 billion to £81 billion in 2023/24, this uses a variation on the PSFA methodology and different timeframes. ↩
-
This refers to additional financial benefits as a result of counter fraud activity, beyond prevention and recoveries, which include sanctions, cost awards and benefits via the Proceeds of Crime Act. ↩
-
To note, the Ministry of Defence originally reported £204.5m of detected fraud and error in 2022/23. Previously the department used a different methodology for reporting detected fraud that was derived from the value of fraud allegations. To achieve standardisation with other departments, it was agreed that MOD would derive its detected fraud from substantiated cases in 2023/24. The figure reported above has therefore been updated using the new methodology. ↩