CDEI AI Barometer
Updated 23 June 2020

© Crown copyright 2020
This publication is licensed under the terms of the Open Government Licence v3.0 except where otherwise stated. To view this licence, visit nationalarchives.gov.uk/doc/open-government-licence/version/3 or write to the Information Policy Team, The National Archives, Kew, London TW9 4DU, or email: psi@nationalarchives.gov.uk.
Where we have identified any third party copyright information you will need to obtain permission from the copyright holders concerned.
This publication is available at https://www.gov.uk/government/publications/cdei-ai-barometer/cdei-ai-barometer
AI Barometer
1. Chair’s Foreword
The terms of reference for the Centre for Data Ethics and Innovation (CDEI) call on us to scan for opportunities and risks arising from the use of artificial intelligence, and to identify gaps in our national response. It is a little over a year since these terms were published. Since then, the urgency of knowing that we can safely and effectively deploy new data driven technologies has been demonstrated in a tragic and global way by the COVID-19 pandemic.
The AI Barometer provides a system-wide view of how AI and data are being used across the UK in five key sectors. It highlights where there are opportunities for greater use and where there are barriers to responsible adoption. It draws on the expertise of over one hundred participants from industry, academia, civil society and government. The research that underpins the AI Barometer predates the pandemic. But the conclusions apply now with even greater force.
The AI Barometer is a community-informed view of what we should be focusing on as a country. Within each of the sectors, risks and opportunities have been ranked, debated and analysed for underlying factors. Views differed, of course, and areas where there is less agreement can be seen in the detailed analyses presented here. But the overall conclusions paint an emerging picture of what is foremost on the minds of experts across different disciplines. As we develop the Barometer we will increase the range of sectors looked at and the numbers of people engaged to broaden and deepen our understanding.
I would encourage you to explore the wealth of detail set out in each of the five sector chapters. But there are two overarching messages that are worth highlighting here.
The first is that there are a number of ‘harder to achieve’ opportunities of enormous potential social benefit but which are unlikely to be realised without concerted government support and a clear national policy. These ‘harder to achieve’ opportunities include a fairer justice system; more efficient de-carbonisation; and, of course, more effective public health research and disease tracking. These opportunities have a number of common characteristics: they require coordinated action across organisations or ecosystems; they involve the use of very large scale complex data about people; and they affect decisions that have an immediate and significant impact on people’s lives.
The second overarching conclusion is that there are a number of common barriers to achieving these ‘harder to achieve’ benefits. Some relate to the workforce – the skills and diversity of those working on these problems. Some involve our state of knowledge, for example, about what the public will accept as ethical. Others relate to the data governance and regulatory structures we currently have in place. Concern about the quality and availability of data and its related infrastructure was a consistent theme, as was concern about the lack of clarity in how regulation applied to the use of data in particular circumstances, and a lack of transparency about how data was actually being used.
These issues contribute to one fundamental barrier – low levels of public trust. As we have seen in the response to the COVID-19 pandemic, confidence that government, public bodies and private companies can be trusted to use data for our benefit is essential if we are to address the major risks that threaten our society, from pandemics, to global warming, to social fragmentation.
In its first year, the CDEI’s programme has focused on clarifying areas of regulatory uncertainty, with reports on online targeting and algorithmic bias (to be published shortly). As we plan our programme for the future we will be looking at how the CDEI and the country can address the full range of barriers set out in this report.
The most promising benefits will not be realised without a coordinated national response.
AI has huge potential to address key societal challenges such as climate change, provision of health and care for an aging population, and inequality. It presents concrete opportunities through the potential for:
- Operating an efficient green energy grid capable of managing decentralised power generation and storage
- Identifying and tracking public health risks at speed
- Using automated decision support systems in health, education and criminal justice in a way that reduces bias
- Understanding the impact of automated services on vulnerable people and supporting them better.
- Tackling misinformation while respecting freedom of speech
These most promising opportunities often share key characteristics: the use of complex data flows about individuals; a direct impact on individuals and their rights; and coordination across organisations and ecosystems – and this means realising them will involve overcoming significant common barriers.
Roger Taylor
Chair
2. Overview
2.1 What is the AI Barometer?
The AI Barometer is an analysis of the most pressing opportunities, risks, and governance challenges associated with AI and data use, initially across five key UK sectors. Over 100 experts took part in workshops and scoring exercises to produce a community-informed view of these factors. These outputs will inform the work of the CDEI and our advice to the UK government on its policy priorities. Full details are available in our methodology.
The current age of data-driven technology is unlike anything we have seen before. Large-scale technological change is occurring at an unprecedented pace, which the global response to COVID-19 has only accelerated, with far-reaching implications across all aspects of our lives. It comes accompanied by an overwhelming volume of commentary and claims, for which the evidence - and extent of sensationalism - can often be unclear. In the face of all this, it can be difficult to discern which issues most require our attention.
The ambition of the AI Barometer is to provide a much needed system-wide view of how AI and data is being used across the UK. Having a broad view of the landscape allows us to understand where common challenges are being experienced, and how different contexts drive how beneficial or harmful AI use might be. In a highly interconnected world, it also helps us know how technological, policy, and regulatory developments in one sector may influence others.
2.2 Key findings
-
The exercise highlighted the numerous opportunities that AI and data can offer, which many of our panellists believed we have only begun to tap into, for example in improving content moderation on social media, supporting clinical diagnosis in healthcare, and detecting fraud in financial services. Even those sectors that are mature in their adoption of digital technology (e.g. the finance and insurance industry) have yet to maximise the benefits of AI and data use.
-
However, some opportunities are easier to realise than others. ‘Easier to achieve’ innovations tend to involve the use of AI and data to free up time for professional judgement, improve back-office efficiency and enhance customer service. ‘Harder to achieve’ innovations, in contrast, involve the use of AI and data in high stakes domains that often require difficult trade-offs (e.g. police forces seeking to use facial recognition must carefully balance the public’s desire for greater security with the need to protect people’s privacy).
-
Alongside looking at opportunities, our panellists were asked to rank a series of risk statements according to their impact and likelihood. Some of their judgements were to be expected, for example, technologically-driven misinformation scoring highly in healthcare. Yet the scoring exercise also brought to the surface risks that are less prominent in media and policy discussions, for instance the differences between how data is collected and used in healthcare and social care, and how that limits technological benefits in the latter setting.
-
While the top-rated risks varied from sector to sector, a number of concerns cropped up across most of the contexts we examined. This includes the risks of algorithmic bias, a lack of explainability in algorithmic decision-making, and the failure of those operating technology to seek meaningful consent from people to collect, use and share their data. This highlights the value of cross-sector research and interventions.
-
Several barriers stand in the way of addressing these risks and maximising the benefits of AI and data. These range from market disincentives (e.g. social media firms may fear a loss of profits if they take action to mitigate disinformation) to regulatory confusion (e.g. oversight of new technologies like facial recognition can fall between the gaps of regulators).
-
While many of these barriers are daunting, they are far from intractable. Incentives, rules and cultural change can all be marshalled to address them. This document highlights how regulators, researchers and industry are rising to the challenge with new interventions, which will pave the way for more ethical innovation.
-
Three types of barrier merit close attention: low data quality and availability; a lack of coordinated policy and practice; and a lack of transparency around AI and data use. Each contributes to a more fundamental brake on innovation – public distrust. In the absence of trust, consumers are unlikely to use new technologies or share the data needed to build them, while industry will be unwilling to engage in new innovation programmes for fear of meeting opposition and experiencing reputational damage.
-
Against this backdrop, the CDEI is launching a new programme of work that will address many of these institutional barriers as they arise in different settings, from policing, to the workplace, to social media platforms. In doing so, we will work with partners in both the public and private sectors to ensure that the sum of our efforts are greater than their individual parts.
3. Contents
In this first edition of the AI Barometer, you will find:
-
A summary of our findings, covering common patterns across opportunities, risks, and governance.
-
Chapters for each of the five sectors we analysed:
-
Criminal Justice
-
Financial Services
-
Health and Social Care
-
Digital and Social Media
-
Energy and Utilities
-
Details of our Methodology.
-
Acknowledgements recognising the contribution of our sector panellists.
4. Our Methodology
The AI Barometer was developed using the following approaches. Full details are available in our methodology.
-
AI and data-driven technology: We looked at the potential impact of technologies involving the use and collection of data, data analytics, machine learning, and other forms of artificial intelligence.
-
Sectoral approach: We focused on a mix of five key sectors, knowing that AI and data-driven technology can pose radically different opportunities and risks depending on the contexts in which they are deployed. A sectoral approach also frames our findings within boundaries that policymakers and regulators are familiar with.
-
A community-driven view: Understanding the ethical impacts of AI and data use is an interdisciplinary endeavour. We convened expert panels made up of different communities within each sector, which ensured our work was informed by a diverse set of expertise and perspectives. Panellists included representatives from industry, academia, civil society and government. This report reflects the input of these panels.
-
A focus on the opportunities and risks of AI and data use: We used policy and academic literature to list and categorise the opportunities and risks apparent in each sector over the next three years. This provided a starting point for how uses of technology are understood in current debates.
-
Comparative tools to ensure fair judgements: Each of our expert panellists was asked to complete a pairwise comparison survey, whereby they were presented with two risk statements at a time and asked to choose the one that appeared most likely or impactful. This method allowed for a large number of risks to be meaningfully assessed and ranked.
-
Deliberation, discussion and research: We used these survey results to provoke discussion in a series of expert panel workshops. Here we explored the drivers and consequences of the different opportunities and risks we had previously identified. We also discussed the governance regimes present in different sectors. We undertook further research to unpack the issues raised in the workshops and to verify the claims that were made.
5. Sector Selection
We chose a diverse set of sectors to examine for the first edition of the AI Barometer, to understand how opportunities and risks vary by context. Specifically, we selected sectors that varied in the extent of:
-
Personal data use by services and systems
-
Digital maturity, and current level of AI and data analytics use
-
Public and privately commissioned and delivered services
-
Governance systems and approaches
6. Expert Panel Composition
Each panel was composed of a balanced set of experts and stakeholders within each sector, typically including:
-
Government
-
Regulators and other arms-length bodies
-
Tech industry
-
Sector organisations (e.g. service providers, businesses using data-driven technology)
-
Membership bodies
-
Academia
-
Civil society organisations
See the Acknowledgements for a full list.
7. Summary of Findings - Opportunities
The exercise highlighted that AI and data present significant opportunities that have yet to be fully realised. This is true for all of the five sectors in scope, including healthcare and finance, which are typically seen as fast adopters of technology.
Some of the highest-potential benefits are among the hardest to achieve, typically involving the toughest ethical questions. Others were seen as relatively easy to deliver, as described in the table below. The boxes on the left-hand side highlight characteristics of use cases that appear as common across the sectors.
| Harder to Achieve | Criminal Justice | Financial Services | Health & Social Care | Digital & Social Media | Energy & Utilities |
| Systemic improvements that require market or system coordination | Predictive analytics to improve existing riskscoring | Fraud and money laundering detection | Public health research and tracking | Online content and marketplace moderation | Better data-driven planning to meet decarbonisation goals |
| More effective risk assessment and decision-making supported by algorithms, without exacerbated bias | Facial recognition technology to increase policing capability | Better risk assessment and management | Clinical diagnosis and decision support systems | Combating mis/disinformation | Proactive/predictive network and asset maintenance |
| Improved support of vulnerable people while preserving autonomy | More proportionate and unbiased court decisions | Regulatory compliance | Reducing health inequalities | Supporting vulnerable users | Coupling markets, enabling a whole-systems approach to innovation and energy usage |
| Combating misinformation without affecting people’s rights | Supporting vulnerable consumers |
| Easier to Achieve | Criminal Justice | Financial Services | Health & Social Care | Digital & Social Media | Energy & Utilities |
| Improved corporate and backoffice efficiency | Improved staff wellbeing | Increased access to financial products | Patient-facing apps and services | Improved organisational efficiency | Enhanced consumer choice and control |
| Freeing up time for professional and human judgement | Better allocation of police resources and automated back-office functions freeing up professional time | Innovation in fintech banking services and interfaces | Workforce management | Tracking, profiling and targeted advertising | Increased energy efficiency through automation of power management |
| New products and business models | Pre-clinical and clinical research | Better search and recommendations | |||
| Better consumer-facing applications, choice and control | |||||
| Lower-impact decision-making support |
8. Summary of Findings – Risks
Alongside highlighting opportunities of AI and data use, the exercise identified a broad set of risks resulting from the use of this technology - where risk means the chance of a harm occurring. The below table sets out notable risks found in each sector, as well as notable risks commonly found across all sectors. It is important to note that these risks are not certain to unfold, although many are already playing out in some form. Panellists were asked to score risks according to their perceived impact and likelihood.
| Top Common Risks | Criminal Justice | Financial Services | Health & Social Care | Digital & Social Media | Energy & Utilities |
| Algorithmic bias leading to discrimination featured highly across almost all sectors | Facial recognition technology presents numerous risks, including concerns around accuracy and bias, personal data retention, public/private data-sharing, and its impact on privacy | Bias in algorithmic decision-making systems such as algorithms used for credit-scoring or for pricing insurance | Health mis/ disinformation provided through apps, search, websites and social media | Manipulation and political micro-targeting based on powerful inferences from personal data, affecting people’s autonomy and trust in institutions | Loss of public benefits via underuse such as better local-level energy system planning, interventions to tackle fuel poverty, and meeting decarbonisation targets – largely due to how data can be shared across the supply chain |
| Lack of explainability of AI systems | Bias in algorithmic decision-making systems such as those judging reoffending risk or appropriate sentencing | Higher-impact cyberattacks, due to the scope for adversarial attacks on AI systems, and low explainability making it difficult to identify impact of attacks | Bias in algorithmic decision-making systems which manifests in complex ways in health contexts | Market power of platforms which hold large volumes of personal data, with implications for markets and consumers | Regulator resourcing in the context of an industry adapting to decarbonisation |
| Regulator resourcing impacting the ability of governance systems to address AI and data use | New demands on data by the criminal justice system, particularly of victims of serious crimes | Concentration of data in a few large actors within the sector, with impacts on market fairness, innovation and consumers | Worsened health inequalities due to poor data availability and unequal access to technological benefits | Addictive design leading to excessive use of digital platforms, with potential mental health impacts | Digital exclusion of some households and businesses from the benefits of increased AI and data use |
| Failure of consent mechanisms, leading to the mass collection and use of data without people’s consent | Underuse in social care due to low digital and data maturity, and lack of structural incentives for improvement | ||||
| Loss of public trust in institutions due to problematic AI and data use |
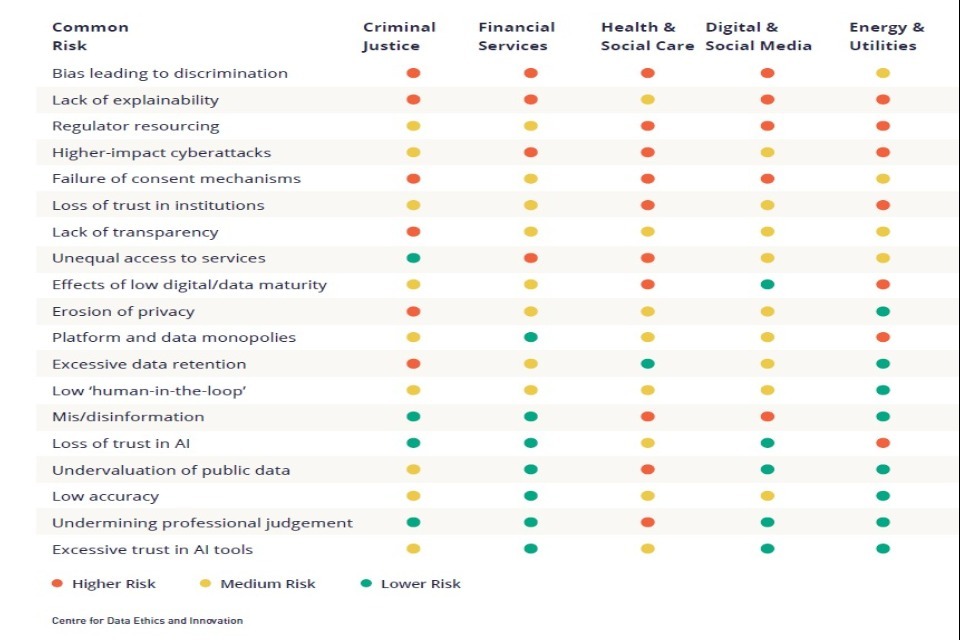
Summary of Findings - Risks
While the use of AI and data presents unique challenges for each sector, our analysis found that a large number of risks were common in every sector examined. This table reflects how risks that are common across sectors were perceived in relative terms by our expert panels, from higher to lower risk, as reflected in the risk quadrants within each sector chapter.
Some familiar risks, such as algorithmic bias, were unsurprisingly prominent. However, the rating of others was perhaps more surprising, such as the failure of consent mechanisms for personal data collection and use, which was deemed a high or medium risk in every context. The table also reveals that the severity of risks, while present in every sector, can vary. The undervaluation of public data, for instance, is perceived as a far greater hazard in healthcare than in any other sector. The extent and severity of the common risks experienced in a given sector typically varied by:
-
How advanced the use of AI and data is
-
The extent of personal data use
-
The direct impact that decisions and system functionality (e.g. the provision of energy) in that sector have on individuals and other actors
-
The nature of interactions between public and private actors
-
Pre-existing governance approaches (e.g. pre-market certification requirements for products such as medical devices).
9. Summary of Findings – Barriers to Ethical AI
The exercise helped reveal several barriers to the ethical use of AI and data in our five sectors. These barriers prevent risks from being adequately mitigated, while also hampering innovation and denying society the full benefits of the technology.
A lack of funding, for example, can block attempts in the public sector to launch new data sharing projects, especially where those projects take years to bear fruit. Yet not all barriers relate to resourcing. Some are borne from a lack of coordination and communication, such as where there is confusion about which regulators govern a new application of AI. In other cases, barriers are more fundamental, such as when there is a lack of evidence to substantiate claims that a perceived risk truly is a risk.
10. Data barriers
- Low data quality, availability and infrastructure - The use of poor quality or unrepresentative data in the training of algorithms can lead to faulty or biased systems (e.g. diagnostic algorithms that are ineffective in identifying diseases among minority groups). Equally, the concentration of market power over data, the unwillingness or inability to share data (e.g. due to non-interoperable systems), and the difficulty of transitioning data from legacy and non-digital systems to modern applications can all stymie innovation.
11. Knowledge barriers
-
Insufficient evidence - The impact of AI and data-driven technology is not always known. This is often the case for new applications and innovations (e.g. synthetic media), which have yet to be studied in depth. Insufficient evidence prevents decision-makers from knowing whether and how to intervene to promote innovation.
-
Lack of consensus - There is often disagreement among the public about how and where AI and data-driven technology should be deployed. Innovations can pose trade-offs (e.g. between security and privacy, and between safety and free speech), which take time to work through.
12. Workforce barriers
-
Digital and data skills - Data skills are in high demand across the economy, meaning that many organisations – particularly in the public sector – struggle to find the talent they need to address risks and maximise opportunities. A lack of skills and capacity is much a feature of the regulatory landscape as it is of the industry landscape, affecting both our ability to adopt technology and to govern it well.
-
Workforce diversity - A lack of diversity in the workforce can mean AI and data-driven technology is developed and deployed without consideration of the needs of every group in society. This is a problem found not just in tech firms but across the tech ecosystem, from data labelling organisations to governance bodies.
13. Market barriers
-
Funding gaps - Significant investment is often required to mitigate the most intransigent risks and hardest to achieve opportunities (e.g. cleaning up public sector datasets and making them available for research and development; or developing detection systems to remove deepfake content from tech platforms). This expense can be difficult to win support for when innovation projects take years to bear fruit.
-
Risks to profit - Private firms can lack incentives to address risks posed by AI and data-driven technology (e.g. social media platforms may fear that addressing AI-driven disinformation could affect their revenue).
14. Governance barriers
-
Regulatory and policy development and coordination - The approaches, guidance, and training used across the development and deployment of AI and data-driven systems is often highly localised (e.g. with different police forces setting their own policies for FRT use). Regulatory approaches can vary between sectors and between regulators operating within one sector. This can lead to confusion among both those deploying and overseeing technology.
-
Lack of transparency - Private firms and public sector organisations are not always transparent about how they use AI and data-driven technology or their governance mechanisms. This prevents scrutiny and accountability, which could otherwise spur ethical innovation.
15. Trust barriers
- Lack of trust - Users of AI and data-driven technology often lack confidence that it is safe to use or is being designed in their interests. This can deprive people of the benefits of technology (e.g. discouraging them from using AI-driven healthcare apps). A lack of trust can also temper industry’s appetite for engaging in innovation, for fear of pushback from their customers (e.g. energy firms may be unwilling to ask customers to share more household data, which could otherwise improve energy efficiency services).
One barrier to ethical AI and data use that deserves close attention is the need for good governance. Whereas some other barriers describe external factors that are difficult to control directly (e.g. public trust), governance can be shaped by policymakers and regulators through a combination of measures, from legislative changes to injections of funding. Our panellists highlighted their understanding and perceptions of how regulation of AI and data use is working, helping build a picture of the barriers to better governance described below - albeit one that very much varies by context and sector (for example, some regulators have dedicated considerable resources to examining the impact of AI and data use).
16. Barriers to effective governance
-
AI competes for attention and resource: AI and data-driven technology are not the only issues on the minds of regulators. In finance, for example, regulators are grappling with the growth of cryptocurrencies, and in energy, regulators are focused on achieving net-zero carbon emission targets, while also managing an influx of new suppliers into the market. Regulators in most sectors are having to respond to increased cybersecurity threats. Each of these trends are competing for regulators’ limited resources and bandwidth, which in many cases have not significantly increased in recent years.
-
Highly devolved or distributed systems: In many instances, governance bodies are operating in fragmented systems with high levels of devolved decision-making. In policing, for instance, individual police forces have considerable scope to experiment with new technologies like facial recognition and predictive policing algorithms, and to devise their own operating procedures. Devolved governance of this kind can make oversight of AI and data use challenging.
-
Lack of clarity about where oversight responsibility lies: Despite AI and data being commonly used within and across sectors, it is often unclear who has formal ‘ownership’ of regulating its effects. This problem is common in sectors where there are multiple regulators (e.g. in healthcare), although there are many examples of regulators coordinating their activity in relation to AI and data use through various bodies and working groups.
-
Data governance is still maturing: The introduction of GDPR and the Data Protection Act has strengthened the data governance landscape. However, panellists highlighted a lack of clarity as to how it should be interpreted in specific contexts (e.g. how to determine what is a lawful use of facial recognition technology, or what amounts to meaningful consent in the collection of data). This confusion can make organisations reluctant to share or make use of data (e.g. hospital trusts). The Information Commissioner’s new regulatory sandboxes and formal Opinions were cited favourably as useful mechanisms to address this challenge.
-
Industry fills governance vacuums: In the absence of clear, centrally-defined governance, some industry and frontline organisations are creating their own standards of AI and data use as they increase their use of technology. For example, panellists in the finance sector noted how some firms were deciding for themselves what amounts to fairness in algorithmic decision-making. While some self-direction is inevitable and welcome, too little steer from regulators could result in diverging and potentially undesirable practices.
-
Data skills shortages: Many regulators struggle to attract staff with data science and AI skill sets, given the extent to which they are in demand across the economy. Regulators are also competing for talent with private firms in their own sectors.
-
Limited data access: Some panellists thought regulators could benefit from having greater access to data about the systems and organisations they govern, although in many cases, regulators do already have powers to obtain information. The capability to access data at a systemic level could help some regulators understand whether regulation is being adhered to and individuals treated fairly (e.g. enabling energy regulators with easy access to system-level smart meter or supplier data).
17. Summary of Findings – What next?
17.1 Making the most of the AI Barometer
Over the coming months, the CDEI will promote the findings of the AI Barometer to policymakers and other decision-makers across industry, regulation and research. We hope the AI Barometer will inform their agendas, directing them to look at the most pressing issues of AI and data use as identified by our expert panels. We will encourage them to look not just at addressing the hazards posed by this technology, be it misinformation or cybersecurity threats, but also to champion new innovations that can improve our public services, bolster our economy and help people lead more fulfilling lives.
The AI Barometer will also play a role in shaping the future strategy of the CDEI. We will use its findings to help us understand where we can add the most value, looking in particular at those barriers to ethical innovation that if removed could yield the greatest gains. The CDEI has already made progress in identifying policy interventions through its two reviews on bias and online targeting. These have highlighted the importance of data access and transparency in ethical data-driven systems.
The AI Barometer itself will be expanded over the next twelve months, looking at new sectors and gathering more cross-sectoral insights.
18. Looking towards the future
As the CDEI embarks on its work programme for the coming year, we will be looking at how both we and others can address the barriers to maximising ethical AI and data use identified in this report.
| Barrier Type | Barrier to Ethical AI and Data Use | Examples of Potential Mitigating Action |
| Data Barriers | Low data quality, availability and infrastructure | Investing in core national data sets; building secure data infrastructure; trusted data sharing mechanisms; ethical data regulation |
|---|---|---|
| Knowledge Barriers | Insufficient evidence; Lack of Consensus | Researcher access to platform data; Citizen council models; ethics committees |
| Workforce Barriers | Digital and data skills; Workforce diversity | Training and education programmes e.g. AI masters; Training and recruitment policies to diversify workforce |
| Market Barriers | Funding gaps; Risks to profit | Investing in core national data sets; Requirements for public disclosure and independent audit |
| Governance Barriers | Regulatory and policy development and coordination; Lack of transparency | Development & coordination of policy; defining & aligning industry and regulatory standards; Requirements for public disclosure and independent audit |
| Trust Barriers | Lack of trust | Public education and information initiatives; Addressing the workforce and data governance barriers to ethical AI |
19. The impact of COVID-19
19.1 How is data-driven technology and AI being used in response to COVID-19?
AI and data-driven technology have played a central role in the response to the COVID-19 pandemic, both in terms of the healthcare response, and addressing its wider economic and societal impacts. Below we highlight some of the more prominent use cases being employed or considered across the world, which we have also begun tracking through our COVID-19 repository.
The CDEI is undertaking research into high-profile uses of technology in response to the pandemic, looking at what it would take to ensure they are developed and deployed to the highest ethical standards.
19.2 Supporting the immediate healthcare response to the disease
-
Speeding up medical research (e.g. using AI to understand the structure of the virus or identify promising treatment and vaccination candidates).
-
Improving diagnostic processes (e.g. using image recognition to identify viral pneumonia).
-
Using algorithms to estimate high-risk patients and triage cases.
-
Using predictive analytics and data-driven simulations to understand how the disease might spread.
-
Using data platforms to track health equipment and other assets.
-
Making population-level data publicly available to aid global COVID-19 research.
-
Prioritising the provision of official health advice through tech platforms (e.g. in search results, on social media, and through smart speakers).
19.3 Supporting the public health response and mitigating the effects of lockdown
-
Identifying vulnerable people using publicly-held data and offering them priority services (e.g. food delivery slots) that improves their ability to self-isolate.
-
Contact-tracing apps to track the spread of the disease and identify people who should isolate.
-
Identifying adherence to social distancing in public and workplaces using wearables and computer vision.
-
Automating content, advertising, and marketplace moderation in the absence of human reviewers.
-
Connecting volunteers and enabling community support on apps and social media platforms.
-
Use of video chat devices within care homes to enable contact with friends, family, and isolating residents.
-
Predicting food shortages to enable redistribution of supplies accordingly.
-
Sharing and aggregation of publicly-held data at the local level to enable better support of people during lockdown (e.g. children receiving free school meals).
19.4 Building future resilience and aiding the recovery
-
Using predictive analytics to predict future epidemics and understand how to build resilience.
-
Using data to understand the longer term impact of disease on other health factors e.g. cardiovascular risk.
-
Using digital health certificates and facial verification to support the return to normal economic activity.
-
Using novel data sources (e.g. energy data) to understand how economic activity is recovering.
19.5 Technology Trends
-
The COVID-19 crisis is causing the ‘leapfrogged’ adoption of specific technologies, applications, and business models, which has accelerated the opportunities and risks presented by particular AI and data use cases. Technologies are being used at scales and in contexts where they may have otherwise taken greater time to penetrate (e.g. the use of video chat devices in care homes). It will take some time for evidence to emerge of how beneficial or problematic particular applications have been in responding to the impacts of the pandemic (e.g. how automated content moderation compares to human moderators).
-
There has been considerable growth in the use of digital and data-driven platforms to address the effects of lockdown, including video conferencing, digital entertainment, social media, online marketplaces, and delivery networks. As well as changing the shape of some markets, these changes in behaviour mean those platforms will be benefiting from increased volumes of data that they can use to generate insights and build their services.
-
Data-sharing and use across the public sector is at a new high-watermark, and responses to the crisis has seen the rapid integration of technology platforms into public services, particularly at the national level. Many public bodies have changed how they deliver services, often by growing existing digital delivery platforms (e.g. tele-health), and these developments may permanently alter how services are delivered in future. In some instances, planning and resource may be needed to retain the benefits of the accelerated technology use, and sustainably integrate it into service delivery.
-
Specific risks identified in the AI Barometer that are likely to be heightened as a result of COVID-19 include misinformation (particularly around health issues), data concentration and platform monopolies as people and businesses increasingly rely on digital services, and the privacy impacts of increased digital surveillance that can arise with the use of technology to track the spread of the virus.
20. Criminal Justice
20.1 Overview
Scope
The scope of our sectoral analysis covered the use of AI and data-driven technology in policing, the courts, prisons, and the probation service, as well as legal services to the extent they relate to access to justice.
How is data-driven technology and AI used in criminal justice?
Applications of AI and data analytics in criminal justice are focused around a small number of use cases:
-
Facial recognition technology is used in policing to identify wanted suspects and persons of interest. It has been used for many years to retrospectively identify people in CCTV footage. However, it is now being used in live settings, for example to process footage from cameras placed in surveillance vehicles. Facial recognition technology could in future be used in combination with other equipment (such as bodycams and smartphones).
-
Risk-scoring algorithmic decision-making or supporting tools (ADMTs). ADMTs are being developed for different uses across the criminal justice sector that support decision-making around individuals, including in policing (e.g. to predict cases of domestic violence), prisons and probation (e.g. to predict the risk that someone will reoffend) and the courts (e.g. to inform sentencing decisions). Not every form of ADMT has yet been trialled in the UK.
-
Predictive crime analytics inform planning decisions by providing ‘heatmaps’ and other insights about criminal activity that help forces decide their resource deployment and responses. Several UK police forces have trialled predictive analytics, however many have ended these experiments or shifted from using external vendors to developing their own technology in-house.
-
Digital forensics, where data analytic tools can improve the capability and speed with which investigators can search through digital evidence from devices, email, and social media accounts, to determine relevance to a case, or what may need to be disclosed in legal proceedings.
Key Messages
-
Risks relating to facial recognition technology (FRT) were seen by many in our sector panel as among the most urgent to address. This reflects FRT’s transformative potential, and the fact it is being tested and deployed in a growing number of settings. Automating, scaling, and networking surveillance using AI and data-driven approaches creates qualitatively different effects than scaling up that activity using traditional human-led methods.
-
Digital maturity presents challenges. While there are ambitions to use state of the art AI and data-driven technology within the courts, they are still in the process of digitising their records and services. Digital systems across policing and prisons are often fragmented (e.g. in terms of standards and interoperability).
-
Parts of the justice system are devolved, making policy coordination difficult. For example, the existence of over forty police commissioners and chief constables mean approaches to managing data and AI can vary considerably across the country, raising the risk of confusion among the public and requiring police forces to spend time building up a significant knowledge base around a technology. Panellists said standardised technology trials would be desirable. The West Midlands Digital Ethics Committee was cited as an example of good practice. This initiative draws on the views of academic researchers and community members, with publicly available documentation and minutes, and mandates formal sign-off for new data projects, providing local accountability.
-
Effective governance depends on learning lessons from industry and other jurisdictions. UK policymakers may benefit from understanding how other national governments and our devolved administrations are managing the use of AI and data in their justice regimes. This includes Scotland, which recently introduced a Scottish Biometrics Bill to govern second generation forms of biometrics like facial images. Panellists also commented on the need to work with the private sector firms who develop these technologies, particularly to ensure they have mechanisms in place to provide accountability for major decisions. Commercial confidentiality may limit effective scrutiny of algorithmic systems, as was demonstrated in the US when investigators struggled to access the COMPAS software being deployed in US criminal courts. Commercial confidentiality may have also hindered the independent bias testing of facial recognition systems procured by UK police forces.
21. Criminal Justice: Opportunities
21.1 Key Messages
-
AI and data-driven technology promise to alter the way the justice system understands and executes human-driven concepts of fairness and accountability. However, the information and human judgement that goes into making these decisions is complex and multifaceted, and may not be fully captured by data-driven systems. Our panel viewed these opportunities, albeit sizeable, as among the hardest to achieve.
-
However, there are many opportunities for AI systems to enhance decision-making where digital technology is already being deployed. AI-based predictive analytics are a natural successor to existing actuarial risk-scoring, while facial recognition technology has the potential to greatly increase policing capability to identify known suspects, with modest workforce requirements.
-
These AI-led opportunities need to be considered alongside more conventional opportunities to improve the justice system. Our panel highlighted the risk that a novel AI-driven solution could attract greater policymaker attention and therefore funding than worthier interventions that lack the same allure, such as digitisation (e.g. of court record and decisions) and the consolidation of legacy systems. Indeed, digitisation could form the foundation for the use of AI in the sector. Better data quality and sharing were widely seen as necessary to achieving better justice outcomes.
21.2 State of the Art: Tech use in Criminal Justice
-
The Law Society has published a series of reports on the use of algorithms in criminal justice, effects of tech on the rule of law and access to justice, and a broader look at lawtech.
-
The Royal United Services Institute published a CDEI-commissioned report in March 2020 on data analytics and algorithm use in policing, including proposals for a new policy framework.
Case Study: Implementing Ethics in Policing
West Midlands Police (WMP) have established an Ethics Committee to advise the Chief Constable and Police and Crime Commissioner on the force’s data analytics projects, the first of its kind within UK policing. Its goal is to create a culture of ethics by design, and ensure that there is adequate ethical review at all stages of the research and development process.
While there are questions about the scalability and sustainability of a force-level model, the committee has influenced several decisions around police use of technology, in part due to the commitment from WMP not to proceed with technology projects without the committee’s approval.
Other police forces have established similar ethical advisory bodies, such as the London Policing Ethics Panel, which has advised London City Hall on issues such as facial recognition technology.
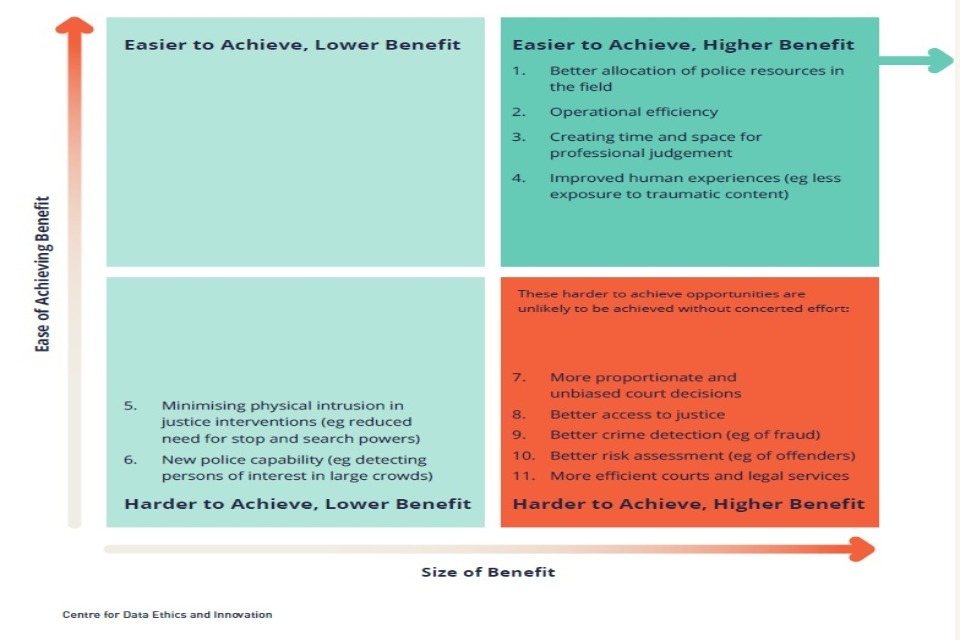
Criminal Justice - Opportunities Quadrant
This quadrant is based on panel discussion of major AI opportunities within the Criminal Justice sector over the next three years. This diagram is not exhaustive and reflects a review of existing policy literature, workshop discussion, further socialising and additional research and analysis. See the methodology at the end of this document for further detail.
Spotlight: Improved Human
Experiences AI and data-driven technology present a number of opportunities to improve the human experience in the justice sector:
- Freeing up humans to do more valuable kinds of work. Time saved through AI tools can be reinvested in face-to-face activities or those requiring human judgement.
- Creating opportunities for accountability. The use of AI could make justice decisions more transparent by revealing previously unseen patterns of how people are treated and decisions made. Interrogable algorithms were, however, seen by our panel as hard to achieve and some way off.
- Improving occupational health through automation. For example, AI could automate traumatic aspects of a job, such as reviewing or labelling violent or pornographic imagery (see Case Study on the following page).
- Decreased physical intrusion. Use of facial recognition technology, improved electronic monitoring and automated data analysis could reduce the need for use of stop and search powers, day-today supervision in probation, and human review of sensitive data. However, the use of AI and data-driven technology may interfere with people’s privacy in new and different ways, and panellists noted intrusion need not be physical to be problematic.
Case Study: Reducing Exposure to Traumatic Content in Policing
AI tools are being deployed in policing to improve the way that content which may affect the wellbeing of officers (such as indecent images of children) is processed. As well as increasing the speed at which such content can be reviewed and improving police capabilities (e.g. by matching subjects in photos), the tools moderate and reduce the volume of content officers need to manually review, reducing the psychological pressure placed on them.
21.3 Criminal Justice: Opportunity Descriptions
-
Better allocation of police resources: Use of data-driven technologies to predict risk of crime, allowing more effective deployment of police resources.
-
Operational efficiency: Use of AI and data helps organisations to allocate back-office resources more efficiently and reduce operating costs.
-
Creating time and space for professional judgement: Automation can free people up to do more valuable and rewarding kinds of work.
-
Improved human experiences (e.g. automation of potentially traumatic aspects of work, such as reviewing or labelling violent or abusive imagery, leading to improved occupational health).
-
Minimising physical intrusion in justice interventions: For example, use of facial recognition technology or improved electronic monitoring could reduce the need for use of stop and search powers or day-to-day supervision in probation. Automated data analysis can also mean less sensitive personal data is reviewed directly by humans.
-
New police capability: use of technologies such as facial recognition to provide new policing capabilities, or existing capabilities at scales or in contexts not previously feasible.
-
More proportionate and unbiased court decisions: Use of AI and data could theoretically make justice decisions more transparent by providing more data on how people are treated, and with algorithms that can be interrogated and tested in a way that humans can’t be. In practice this was seen as hard to achieve and some way off.
-
Better access to justice: Process automation driving down the cost of providing legal services and use of chatbots to provide more affordable legal advice services.
-
Better crime detection: use of data-driven technologies to automatically identify criminal patterns of behaviour (e.g. fraud).
-
Better risk assessment: Use of data-driven technologies to better assess risk of reoffending, resulting in more proportionate interventions.
-
More efficient courts and legal services (e.g. digital court management, automated document analysis)
22. Criminal Justice: Risks
22.1 Overview
-
Given the significant impact that justice decisions already have on individuals, even modest deployments of AI and data-driven technology could lead to life-changing effects. Policing and court decisions often curtail people’s liberty, privacy, and other important human rights. Our panel saw the deprivation of rights (e.g. privacy) as a highly likely and highly impactful consequence of deploying AI. They also saw a potential decline in the quality and impartiality of decision-making as a major risk (e.g. with AI systems being biased and lacking in transparency).
-
Privacy risks were seen as both highly likely and highly impactful in this sector. Whereas some privacy risks were ranked highly by panels in other sectors, our criminal justice panel believed AI and data-driven technology posed a threat to privacy across a range of issues, such as the way criminal justice institutions share and retain data.
-
In keeping with our other sectors, many of the risks relating to the use of algorithmic decision-making systems were deemed to be high impact and high likelihood. This includes issues such as a lack of explainability and biased decision-making.
-
Higher impact, lower likelihood risks in need of contingency planning included black swan events such as cyberattacks, as well as future misuses of the technology that could erode the public’s trust in AI and justice institutions. Other risks in this bracket include the deskilling of the justice workforce due to task automation, and many relating to the use of algorithmic decision-making tools, including the absence of effective oversight, confusion over who is legally responsible for the technology, gaming of the system, and excessive trust.
-
Higher likelihood, lower impact risks needing active management mostly related to the digital and skills infrastructure needed to support ethical AI use, including the possibility of a procurement skills gap, a lack of digital maturity in the sector, and the undervaluation of public data.
22.2 Top Risks at a Glance
| Most likely | Most impactful | Most Combined Likelihood of Impact |
| 1. Excessive data retention by facial recognition technology systems | 1. Entrenchment of ‘over-policing’ | 1. Privacy in public / quasi public spaces eroded by FRT |
| 2. Lack of awareness and agreement on police use of FRT | 2. Insufficient human oversight of ADM | 2. Lack of explainability for technical or commercial reasons |
| 3. Lack of digital maturity | 3. Bias of algorithmic decision-making systems | 3. Bias of algorithmic decision-making systems |
| 4. Privacy in public / quasi public spaces eroded by FRT | 4. Higher impact cyberattacks | 4. Lack of awareness and agreement on police use of FRT |
| 5. Lack of explainability for technical or commercial reasons | 5. Loss of public confidence in public institutions | 5. Excessive data retention by facial recognition technology systems |
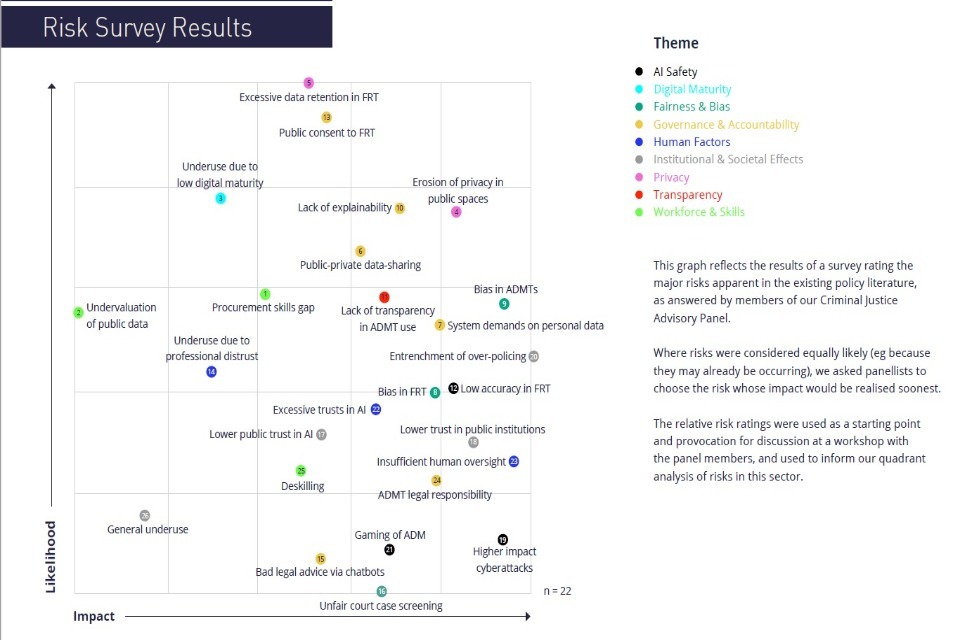
Criminal Justice - Risk Survey Results
This graph reflects the results of a survey rating the major risks apparent in the existing policy literature, as answered by members of our Criminal Justice Advisory Panel. Where risks were considered equally likely (eg because they may already be occurring), we asked panellists to choose the risk whose impact would be realised soonest. The relative risk ratings were used as a starting point and provocation for discussion at a workshop with the panel members, and used to inform our quadrant analysis of risks in this sector.
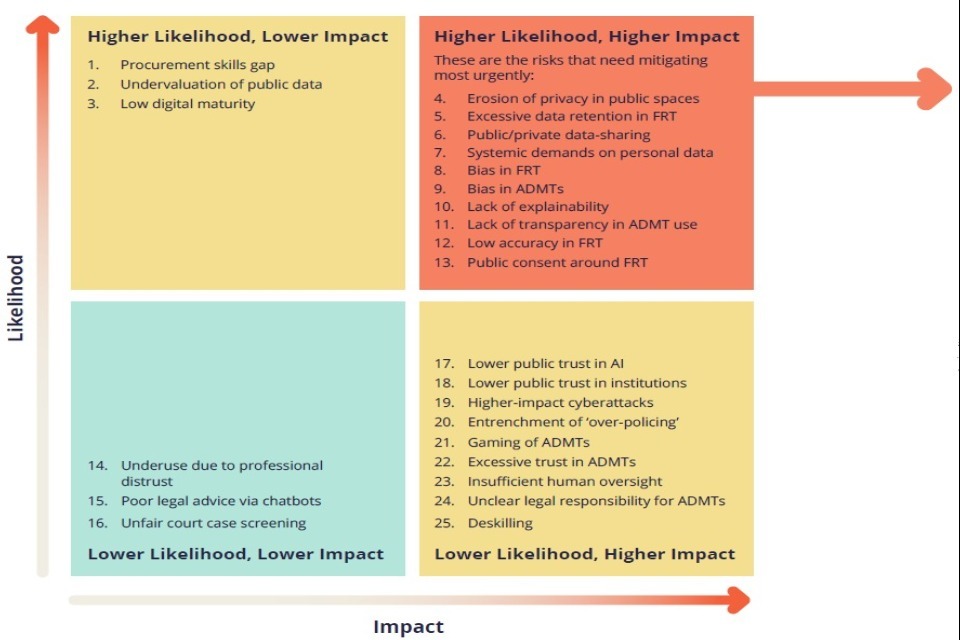
Criminal Justice - Risk Quadrant
Top themes in Criminal Justice Risks: Privacy; Fairness & Bias; Transparency
This quadrant is based on a panel survey rating the major risks in the Criminal Justice sector over the next three years. This diagram is not exhaustive and reflects a review of existing policy literature, workshop discussion, further socialising and additional research and analysis. See our methodology for further detail.
22.3 Criminal Justice: Risk Descriptions
-
Procurement skills gap: Public sector justice bodies are unable to effectively scrutinise the quality and functionality of algorithmic systems they procure, leading to worse justice outcomes.
-
Undervaluation of publicly-owned data: public bodies do not understand the full commercial value of sharing publicly-owned data (e.g. digitised court records) with private sector developers, leading to inefficient use of public assets or taxpayer money.
-
Low Digital Maturity: Limited digitisation of court and police records, or non-interoperable systems hinders the development and use of algorithmic decision making tools, denying institutions and citizens the potential benefits they could provide to justice decisions.
-
Facial recognition technology erodes privacy in public or quasi-public spaces: use of facial recognition for crime prevention erodes individuals’ privacy by making it increasingly difficult to be anonymous in public places.
-
Excessive data retention: facial recognition technology collects and retains data on people beyond immediate operational requirements, resulting in a significant increase in the number of people with biometric data held on police files and infringing on individuals’ privacy.
-
Unclear governance on public/private-data sharing: unclear application of law with regard to data sharing between public and private bodies (e.g. between police and private security firms) infringing on individuals’ privacy.
-
System demands on personal data: availability of analytic technology increases the volume of personal device data demanded from those affected by or involved in crime (e.g. sexual assault victims), infringing on their privacy and access to justice.
-
Bias in facial recognition technology used by the police: low accuracy for particular groups such as women and BAME demographics result in more mistaken police interventions for these groups.
-
Bias in algorithmic decision-making tools: use of biased algorithmic tools (e.g. due to biased training data) entrenches systematic discrimination against certain groups (e.g. reoffending risk scoring).
-
Lack of explainability for technical or commercial reasons: it is difficult for people to understand or challenge decisions made or informed by algorithms because of their ‘black box’ nature or commercial confidentiality regarding their functionality.
-
Lack of transparency in algorithmic decision-making: it is difficult for people to understand or challenge decisions made or informed by algorithms, because they are not aware of their use.
-
Accuracy flaws in facial recognition technology used by the police: FRT systems generate excessive numbers of false positives and negatives, causing mistaken or failed police interventions.
-
Lack of awareness and agreement on police use of facial recognition technology: biometric data of individuals is collected, processed and stored by police without their meaningful input and agreement.
-
Under-use due to professional distrust: benefits of algorithmic tools not realised because justice official (e.g. police or courts) distrust the accuracy or appropriateness of those tools and disregard their input.
-
Poor legal advice via chatbots: AI-driven legal advice services (e.g. chatbots) provide incorrect legal advice to users (for example, about case prospects or routes to legal redress based on the facts of their case).
-
Unfair screening of court cases: use of AI case outcome prediction by lawyers reduces chances of unusual or novel legal cases coming to court and limits access to justice.
-
Trust in AI: The controversial deployment of AI and data use in policing and criminal justice increases the public’s concern about how these technologies are used in other sectors, undermining their application across society.
-
Loss of public confidence in public institutions: Concerns about the accuracy and impartiality of AI and data use in policing and criminal justice undermines public trust in courts, police forces and other institutions
-
Cyberattacks: increased use of data and AI in the justice system increases risk and impact of cyberattacks which may cause changes in system functionality, loss of system availability, or data breaches.
-
Entrenchment of ‘over-policing’: bias in predictive policing algorithms means police resources are directed at communities that have been unfairly targeted in the past and entrenches systematic discrimination against certain groups.
-
Gaming of algorithmic systems in justice (e.g. lowering or raising of offender risk scoring through input data manipulation)
-
Excessive trust in algorithmic decision-supporting tools: police, courts or prisons using algorithmic recommendations (e.g. OGRS scoring system) in lieu of professional judgement resulting in poorer outcomes for victims and the accused.
-
Insufficient oversight by humans in algorithmic decision-making processes leads to poorer outcomes for subjects of those tools (e.g. police being over reliant on the recommendations of their facial recognition systems).
-
Lack of clear legal responsibility for justice decisions made or informed by the use of algorithmic tools, makes it difficult for people to challenge those decisions.
-
Professional deskilling: Over-reliance on algorithmic decision-making tools erodes the development and availability of professional skills and judgement (e.g. for police or judges).
-
Underuse of data and AI: Restrictions on the use of data and AI leads to society missing out on system-wide benefits, such as opportunities for better crime detection, improved access to justice and more efficient allocation of policing resources.
23. Major theme: Facial Recognition Technology
23.1 Overview
Facial recognition technology (FRT) permits the automatic comparison of faces captured in photos or video feeds, typically providing a similarity score between faces seen in a given environment against those in a ‘watch list’. It presents a broad set of use cases for policing, including live deployment via surveillance vehicles, and retrospective use in matching and tracking persons of interest using CCTV surveillance footage.
Despite this transformative potential for policing, the attendant risks of the technology are correspondingly broad, and were consistently identified by our advisory panel as being some of the most concerning across criminal justice. This may reflect the speed with which it is being introduced, fears that it is not suitably governed, and the possibility of it being networked with existing surveillance systems, which would amplify its impact.
23.2 The risks of using FRT include:
-
Its impact on privacy in public spaces, with law enforcement agencies being able to locate people’s whereabouts.
-
The retention of people’s personal data beyond immediate operational requirements, further interfering with their privacy (although the police forces that currently use FRT have policies to immediately discard people’s facial data if they are not matched against a watchlist).
-
The premature deployment of the technology, given FRT systems still struggle to maintain a high level of accuracy in situations like low light or when the subject is wearing accessories.
-
Lower accuracy when matching the faces of some demographic groups, such as Black and Asian people, and women. In a policing context, this magnifies the risk of erroneous police responses against groups already subject to historic discrimination.
The severity of these risks depends in part on who is included on watchlists. Some of our panel expressed concerns that the criteria for deciding who is added to watchlists remains opaque, potentially including people who have been taken into custody but not charged or convicted, and people sought for minor offences. This has led some to warn that FRT deployments could result in a democratic ‘chilling effect’, dissuading people from attending gatherings where the technology is being used.
24. Governance
-
In the summer of 2019, civil liberties group Liberty took South Wales Police (SWP) to court on the basis that their use of live FRT on members of the public had breached the Human Rights Act, the Data Protection Act, and the Equality Act. The High Court ruled that there is a ‘clear and sufficient’ legal framework to ensure the appropriate and non-arbitrary use of live facial recognition, and that SWP used live facial recognition in a way that abided by this legal framework.
-
However, this does not mean that every deployment of live FRT by a police force would necessarily be legal. Under the Data Protection Act, for example, police forces would still need to demonstrate that their specific use of the technology is strictly necessary. The ICO recommends a binding code of practice so that all police forces can better interpret the law. Such a code could, for example, specify best practice approaches to compiling watchlists. Lessons could be learned from the clear guidance available for covert surveillance. Panellists noted the importance of updating guidance to reflect developments in other biometrics, such as gait recognition or affect detection.
-
Guidance would be especially valuable to inform trials of the technology, for example by specifying robust evaluation methods, the criteria that need to be met before FRT is fully rolled out, and how to determine which practices sit within or outside the scope of a trial. Experiments in the use of FRT lack the same rigour as other trials of important innovations, such as medical trials, which are governed by well-established protocols. Panellists cited the Ministry of Justice’s OASys risk assessment tool and earlier police use of randomised control trials as examples of good evaluative practice.
-
There are no widely recognised certification or assurance standards for FRT, or for the underlying algorithms and datasets (for example, with respect to avoiding biased outcomes), in contrast with other tools and technologies used by the police. However, our panellists said some developers seem reluctant to submit their products to independent, third party tests and tools that do exist.
-
The above notwithstanding, panellists indicated that consideration of appropriate policies and practice were far more advanced in policing than private sector use of facial recognition technology.
Case Study: Evaluating data-driven technology in justice
The OASys system was introduced in 2001 to assess offenders’ risks and needs to provide individualised sentence plans. It consists of a number of risk scores for an offender, including calculating the chance of reoffending and the potential severity of any future offence, as well as a structured professional judgement based on these calculated scores, other contextual factors, and engagement with the offender. There have been a number of evaluations of OASys, that have shown its calculated elements offer more predictive value than professional judgements alone. While it does not incorporate machine learning approaches, it was identified by our sector panel as an example of statistical risk modelling successfully supporting a human-led assessment process, and of a well-implemented, iterative evaluation approach to using data-driven insights in justice decisions.
25. Drivers
Novel use of second-generation biometrics in scalable, automated systems. Using biometrics to automate identification in videos represents a fundamentally different form of surveillance than human-led identification. FRT systems are potentially massively scalable, and place considerable power in the hands of their operators. The extent to which FRT systems interfere with privacy depends on whether they are mobile or static, deployed in live or retrospective contexts, and retain or discard personal data. The existence or otherwise of governance mechanisms to guide choices also matters. Panellists emphasised that policymakers and regulators should consider future changes in the capability of FRT systems (such as the prospect of networked, perpetual surveillance systems), and not be limited to examining existing police trials.
Opaque deployment policies. Panellists noted that police forces do not always respond in full to Freedom of Information requests about their FRT policies, meaning the only available information is limited to that voluntarily published by police. Factors in FRT policies that assist in determining the impact of the technology include:
-
Justifications and sign off procedures for the generation of watchlists. Many of the risks presented by FRT scale with the size and geographical breadth of watchlists, along with the policies for the different types of individuals which could be included, such as known criminals and ‘persons of interest’.
-
Criteria for deployment, including how the choice of location is determined.
-
Minimum accuracy thresholds for matching faces both in the context of procurement and for actioning positive identifications during deployment.
-
Procedures for how to act on information generated by FRT systems, and the training that staff are required to undergo to operate the systems.
Historic problems in how police forces have governed data storage. Panellists highlighted that some police forces have not always upheld the highest data governance standards. One example is the unlawful retention of custody images, where it has been alleged that police forces were continuing to store facial images of suspects that had been released without charge, despite a High Court ruling in 2012 that deemed this practice unlawful. Another example is when the Metropolitan Police Service shared facial images with a commercial property developer in Kings Cross, London in 2019. Our panel suggested there may be room for improvement in how police forces govern the use of FRT and associated biometric data.
Proprietary technology and commercial confidentiality limit transparency and the ability to audit systems’ performance and appropriate use. Some suppliers of FRT deployed by police do not permit third-party testing for bias across criteria like ethnicity and gender. There appear to be few robust experiments and evaluations of FRT’s performance ‘in the wild’. Assessing performance in controlled environments may not give reliable indications of a system’s accuracy or capacity to perform with minimal bias.
Dive further into the detail with the CDEI’s latest Snapshot report on Facial Recognition Technology.
26. Major theme: Bias in algorithmic decision-making
26.1 Overview
Algorithmic decision-making or supporting tools (ADMTs) are increasingly used in justice contexts, for example to assess the risk of someone reoffending.
The use of such systems in other jurisdictions, for example recruitment, has already shown they can be biased and produce unfairly discriminatory outcomes. The particular risk of bias in justice ADMTs is the reinforcement and entrenchment of historical discrimination against particular groups, for example through over-policing.
-
In criminal justice, historical data is often weighted against particular groups: anyone with a criminal record; demographic groups that are over-represented in training data; non-white people (due to historic discrimination); and lower income groups (due to the way different forms of crime are detected and processed by the criminal justice system).
-
AI systems that are trained on or which process unrepresentative data can reinforce discriminatory practices. Additionally, even when variables relating directly to protected characteristics such as ethnicity are removed from training data, ADMTs can learn to use proxy variables (e.g. postcodes, income levels, or a combination of various factors) that reintroduce bias from underlying data.
-
While unmonitored use of ADMTs is presently rare in the UK justice system, there are examples of data insights being used in practice with limited roles for the ‘human in the loop’. For example, some offender scoring is used in prisons as a threshold for determining eligibility for rehabilitation opportunities. While staff judgement is used to determine whether an eligible offender will be actually offered the intervention and also to determine eligibility for those with marginal scores, those whose score is substantially below the threshold will not be able to participate. The scores are highly dependent on official criminal history data, which in turn is affected by upstream decisions around the detection and prosecution of reported crime. The use of thresholds is based on meta-analytic findings about the impact of interventions for offenders of different actuarial risk levels.
26.2 Governance
-
It is difficult to agree acceptable thresholds for bias in decision-making. The baseline is the degree of bias seen in human decision-making, which will likely need to be superceded in algorithmic contexts, as people have more tolerance of failure of human judgement.
-
Beyond general measures in the Data Protection Act 2018, there are no context-specific governance requirements regarding how humans should review algorithmic recommendations before they are acted upon. Some offender risk scoring is already used as an access gateway to rehabilitation courses without moderation by a human decision-maker. Panellists noted recent Ministry of Justice work examining different ways of presenting information to support decision-making in justice contexts.
-
New tools and guidance are in development that would help justice institutions to mitigate bias, however these efforts do not appear to be coordinated. Panellists cited several de-biasing projects including: the CDEI/RUSI investigation into the use of algorithms in policing; published work by Westminster Police; and other work by HM Criminal Justice Inspectorates Group. There are, however, no formally applicable best practice guidelines for deploying ADMTs in policing, or industry standards that set out what checks should be undertaken to ensure the ADMTs are fit for purpose, or the training necessary for responsible and effective use.
26.3 State of the Art: Addressing algorithmic bias
The CDEI will shortly be publishing a comprehensive analysis of algorithmic bias across four sectors, including policing, with recommendations on how to address it.
26.4 Drivers
The data underlying machine learning training and deployment can be biased because it reflects a biased reality, or because it is of poor quality or incomplete. Fundamentally, algorithms cannot decide by themselves which biases should be reproduced and which should be ignored. Specific issues discussed included:
-
Data provenance is important, and data will often reflect historical bias present in police records, sentencing, or stop and search practices.
-
Automated decision-making systems such as offender scoring tools are often heavily reliant on police records, and their output therefore depends greatly on how a person was processed and precisely what was recorded. Small differences in police records can result in different outcomes for substantively similar situations.
-
Police forces and criminal courts have more data on particular kinds of crime, such as burglary, knife crime, violent attacks, and domestic abuse, which form the basis of training datasets.
-
A paucity of research on different types of AI and data bias in a UK justice context. Much of the research originates in the US and is not necessarily applicable to the UK context. For example, the geographic segregation of people of different ethnicity is much lower in the UK, and policing systems are different.
-
Some ADMTs (e.g. those that create crime ‘heatmaps’) are trained only on arrest data, meaning that the system is finding and repeating patterns in detainment judgements rather than conviction judgements (although the latter could also be historically unfair).
The impact of bias may vary depending on whether the focus of a system is on predicting criminality or identifying potential victims. Some ADMTs aim to predict future criminality, for example predicting reoffending risk or crime hotspots. The impact of these applications is likely to be different to ADMTs that identify potential victims.
-
Opaque, unstandardised development and deployment processes. Panellists expressed concern that local justice institutions were not coordinating their efforts in tackling bias in AI and data-driven systems. Different biases may arise as police forces use different data sources in a variety of ways. Different accuracy requirements and weight is placed on ADMTs by different parts of the justice system. The panel also highlighted variability in:
-
The level of transparency around the use, evaluation, and functionality of ADMTs, which prevents scrutiny and challenge of potential bias. In some instances this includes a lack of standards or requirements around explainability and interpretability.
-
Data validation processes, for example, ensuring variables are appropriate and not reintroducing bias.
-
Awareness of available de-biasing tools or how to use them.
Human factors affect how recommendations are acted on. The output of ADMTs is only as useful as the ability of justice officials to make sense of the information, and how much they trust it.
-
Some practitioners will not trust an ADMT and ignore recommendations entirely when making judgements. Panellists cited Hampshire Police focus groups on using algorithms, which found police officers were more sceptical and challenging of ADMT outputs than expected, and wanted to understand the information that was processed by the algorithm.
-
Conversely, some justice officials may fear criticism if they do not use or refer to the results of an ADMT. Users of these systems may not be clear that they can reject or challenge an ADMT recommendation. There is a spectrum of emphasis that may be placed on scores provided by an ADMT.
26.5 State of the Art: Explaining Decisions Made with AI
The Information Commissioner’s Office and the Alan Turing Institute have recently published guidance on explaining decisions made with AI.
27. Major theme: New Demands on Data
27.1 Overview
Increasing volumes of data are being requested from people involved in the criminal justice system, including suspects - but also the victims of crime.
The increasing concentration of personal data on digital devices and accounts, and the availability of forensic and analytic technologies that can examine them, means that evidential principles of the justice system are increasingly requiring the processing and use of this data for pursuing ‘reasonable lines of inquiry’ in police investigations, particularly around sexual offences. This has raised questions about whether the privacy of victims is at risk, and whether the justice system can cope amidst an expectation to use and review this data.
-
While refusing consent to provide personal device data does not automatically trigger a case being dropped, in practice it will not proceed if police or prosecutors decide this blocks a reasonable line of inquiry. This means victims of crime may have to decide whether to compromise their privacy in order to access justice.
-
People may have considerable volumes of personal data seized, which may not be immediately relevant to the crime in question. Third party personal data (i.e. of people not involved in cases) can also be captured in these processes, with consequences for those individuals’ privacy.
-
A lack of capacity to process this data can lead to long delays in progressing cases, during which suspects may be released pending investigation, victims are unable to receive redress, and those accused are unable to vindicate themselves. Some panellists described this as a harm of ‘delaying justice’, with tangible effects on people involved with the justice system.
27.2 Governance
-
A central concern is how well long-standing systems of criminal investigation and legal disclosure can adapt to new circumstances. The reality is that most people now own personal devices and digital accounts that store substantial information about their personal lives and interactions with others - data that can be easily extracted.
-
The National Police Chiefs’ Council issued a national digital consent form in April 2019 to standardise police forces’ approaches to requesting data from victims.
-
The Crown Prosecution Service (CPS) issued guidance in April 2019 on its approach to requesting mobile phone data from victims of crime.
-
The signing of the Clarifying Lawful Overseas Use of Data (“CLOUD”) Act Agreement between the US and UK has further expanded the data that the justice system could potentially access as part of criminal investigations, and the procedural ease with which it can be accessed.
-
The ICO is examining police use of mobile phone data and the impact on individual’s privacy.
-
A Royal Commission on Criminal Justice was announced in the Queen’s Speech in December 2019, which will look at the efficiency and effectiveness of the criminal justice process.
28. Major theme: New Demands on Data
28.1 Drivers
-
Lack of resources to process data. While algorithms are increasingly used to help process data in civil cases, the need for accuracy is even higher in the criminal context (for example in identifying relevant materials to build prosecutions and defences, and for disclosure). This means data analysis is reliant on traditional methods, which is time intensive. For example, the HM Crown Prosecution Service Inspectorate (HMCPSI) found delays of 11 months for forensic examination of phones.
-
Unsophisticated forensic tools. The software packages used to extract data from personal devices typically download everything rather than permitting selective retrieval based on the specific line of enquiry. The outputs of these tools can often be very basic (e.g. a single large PDF document), and procedural requirements mean an individual investigator is accountable for searching through the data, limiting the extent to which search processes can be automated. Some police forces have been trialling more advanced software to improve analysis and reduce the time taken to review data.
-
Unclear data retention policies. Some panellists indicated that there was a lack of clarity over how long different types of data would be retained by police. The NPCC digital device extraction template encourages practitioners to be clear on what data is being collected (e.g. noting which is relevant or irrelevant for a case) and why (e.g. ‘information that may assist in protecting the vulnerable’). However, the template does not ask practitioners to specify when individuals will be notified that their data is being processed, or how long that data will be retained. This affects victims’ privacy and may influence their choice of whether to consent to data extraction.
-
Practice can diverge from official guidance. NPCC and CPS guidance sets clear expectations for how and when data should be sought from victims, but this is not always reflected in police and prosecutor practice. The HMCPSI recently found that requests for victims’ data was disproportionate in 39% of cases, and civil society organisations have highlighted examples of where data is requested even though the victim and accused do not know each other.
-
Unclear effects on justice outcomes. Our panel noted that there is a lack of evidence that making more data available in judicial proceedings necessarily improves the quality and reliability of justice decisions. Assessing the proportionality of data extraction may therefore be difficult.
28.2 State of the Art: Victim data
-
HM Crown Prosecution Service Inspectorate published a thematic review in 2019 examining rape cases, including how victims’ data is obtained and processed.
-
The London Mayor’s Office for Policing and Crime published a review of rape cases in 2019, including findings around timeliness and evidential challenges, and reflections and recommendations by the Independent Victims’ Commissioner for London.
-
The National Policing Digital Strategy was launched in January 2020, and recommends the development of a national data ethics governance model to ensure data is acquired, used and shared in an ethical way to safeguard public trust.
29. Financial Services
29.1 Overview
29.2 Scope
Our sectoral analysis covers the use of AI and data-driven technology in the provision of personal financial services and products, as well as the role and functions of financial institutions and markets. Greater focus is given to applications that affect customers and citizens.
29.3 How is data-driven technology and AI used in financial services?
AI and data-driven approaches are being applied across a range of functions within financial services. These include:
-
Fraud detection and anti-money laundering: analysing patterns in financial transfer data to spot money laundering and detect fraud e.g. by looking for unusual spending activities
-
Risk management: analysing large volumes of data to better predict and manage risks (e.g. credit risk, insurance pricing, and asset management).
-
Customer interactions: automating client interactions and speeding up routine decisions e.g. on credit rating applications, through the use of chatbots and voice assistants. ‘Robo-advisors’ are also being applied to help customers manage their financial affairs.
-
Trading: brokers, hedge funds, and investment firms can use machine learning algorithms to find signals for higher (and sometimes uncorrelated) returns to optimise trading execution, and make faster decisions.
-
Compliance: financial firms can employ machine learning techniques to comply more accurately and efficiently with regulatory requirements. Similarly, these approaches can be used as part of supervisory technology to support regulators in monitoring compliance.
29.4 Key Messages
-
AI innovations can deliver more than efficiency improvements: current policy narratives tend to focus on the potential for AI and data-driven technology to improve efficiency in the financial services sector, allowing firms to deliver the same services only faster and cheaper. However, our expert panel believed that this technology, deployed responsibly, could reshape markets for the better, including by opening up new products to vulnerable consumers and encouraging ethical investment.
-
Industry is being left to interpret what fairness means: bias in financial decisions was seen as the biggest risk arising from the use of data-driven technology. Financial service firms must take steps to prevent their algorithmic systems from replicating societal and historic discrimination (e.g. red lining poorer neighbourhoods within the insurance industry). However, financial firms must also be wary of the inferences they can now draw about customers using AI, some of which could be deemed unfair (e.g. insurers predicting someone’s fitness levels from their purchasing habits). Without clearer guidelines and greater consensus on what amounts to a reasonable use of data and AI, industry will de facto be left to decide standards for themselves.
-
Building markets that work for consumers: the way that data is collected, combined, and used to inform financial decisions can be difficult for consumers to understand and navigate. This raises doubts about the ability of consumers to make informed decisions, such as whether to agree to give credit score agencies access to more of their data, or to hand over data from wearable devices to insurers. If markets are built on the assumption that consumers can make informed decisions, less engaged or more vulnerable consumers will likely be disadvantaged.
-
Regulators may need more resources to manage the challenges presented by AI and novel data use: as technology advances, so must the remit of regulators. However, their capacity and resources do not always grow in tandem with their extra responsibilities. In financial services, regulators are having to respond to a variety of new issues, including cryptocurrencies, cybersecurity threats, and a shift towards cloud-based services - as well as increased AI and data use.
29.5 State of the Art: Machine learning in financial services
In October 2019, the Bank of England published the results of a comprehensive survey of machine learning use in the financial services sector, including data that indicates the prevalence of different applications within the industry. In January 2020, the Financial Conduct Authority and Bank of England announced the establishment of the Financial Services Artificial Intelligence Public-Private Forum (AIPPF) to understand how increasing data availability and use of AI are driving change in financial markets.
30. Financial Services: Opportunities
30.1 Overview
-
The potential for AI and data-driven technology to improve financial market efficiency and access to finance is considerable. However, our panel emphasised that the scale and complexity of some challenges might call for a more active role for policymakers and regulators in articulating an inclusive vision of how to best deploy AI systems, including what amounts to a fair use of this technology.
-
The full benefits of AI and data-driven technology may only be realised with the aid of government support and incentives. This is particularly true of innovations that are costly or where there is little immediate profit to be made, for example new uses of AI and data that would support vulnerable consumers or which could enable better regulatory compliance. Conversely, our expert panel believed that low cost and highly profitable data-driven innovations would likely be implemented under normal market forces. This includes the development of new markets and products, personalised services, and improved operational efficiency.
-
Different innovations will benefit different groups in society. Our expert panel emphasised the importance of deploying AI and data-driven technology to achieve fairer social and environmental outcomes, not just improved profit margins. But even well-intentioned initiatives can leave some people worse off (e.g. using AI in personal insurance to generate more granular risk assessments could lead to lower premiums for some but higher premiums for others). Policymakers will want to ask questions about how the benefits of AI are likely to be distributed and who may bear the cost of new found efficiencies.
-
While new data sources have already been put to use (e.g. in powering more accurate credit risk scoring), their full potential has yet to be realised. For example, non-traditional data sets (e.g. from social media, wearables or home-based sensors) could form the basis of new financial innovations, such as personalised insurance premiums, or improved customer engagement, for instance in long-term personal financial planning through gamification.
Case Study: Anti-Money Laundering (AML)
-
Compliance with AML regulation can be costly for the banking sector, particularly for smaller organisations, and there are substantial penalties for failing to implement appropriate measures. It has been estimated that 95% of laundered money goes undetected, indicating that even minor improvements in identification would have significant benefits for the financial industry and society.
-
The use of AI solutions in AML is in its early stages, with much of the current focus on reducing the large number of ‘false positive’ results in AML efforts, which require substantial resources to identify. Banks such as Standard Chartered have used machine learning algorithms to create risk scores for transactions, allowing staff to triage the cases most likely to involve money laundering.
-
Current AML measures, including those that use AI, are focused on assessing individual transactions and behaviour, which form only a small fraction of large money laundering networks. Future applications of AI could be used to identify wider patterns (e.g. across multiple transactions and accounts).
-
One challenge for financial institutions is to implement sufficiently transparent AI solutions. Firms will need to show regulators that their technology is effective in identifying money laundering, and that it is not simply being used to reduce costs (i.e. the staff required for human-led AML).

Financial Services - Opportunities Quadrant
This quadrant is based on panel discussion of major AI opportunities within the Financial Services sector over the next three years. This diagram is not exhaustive and reflects a review of existing policy literature, workshop discussion, further socialising and additional research and analysis. See the methodology at the end of this document for further detail.
Case Study: Digital Assistants in Banking
Digital assistants are now commonplace in banking, but vary in their sophistication. They range from simple interfaces that can respond to frequently asked questions, to conversational chatbots that aim to create a more ‘humanised’ experience for customers. Some banks have integrated home voice assistants into their banking apps, enabling access to a limited range of information and queries through a voice-activated PIN. Benefits can include reduced costs; 24/7 responsive support for customers; higher customer satisfaction; and the creation of data for further AI system training.
Case Study: AI in Credit Decisions
Machine learning has been widely implemented in the banking industry to inform credit decisions, leading to faster and potentially more accurate assessments about whether borrowers will default on their loan. In some instances, AI is being used to provide risk assessments of individuals without any credit history, potentially allowing more people to access credit, while opening new markets for lenders. AI methods are increasingly being used to support or create credit scores on the basis of ‘alternative data’ from non-traditional sources such as social media. However, these new sources of data are relatively untested, and if not used responsibly could amplify discriminatory decisions. The CDEI Review of Algorithmic Bias will provide an in-depth exploration of how to address bias caused by the use of new types of data.
30.2 Financial Services: Opportunity Descriptions
-
Faster access to financial products: Use of non-traditional data, combined with algorithms that partially automate decisions, results in more accurate, speedier and fairer delivery of financial services (e.g. faster decisions on loans and insurance claims or better prices).
-
Personalised services: Use of AI and data allows firms to deliver personalised products at scale (e.g. with AI-powered chatbots giving tailored advice to customers about how to better manage their money) leading to better outcomes for customers and organisations.
-
New markets and products: The ability of firms to combine large and varied data sets allows them to create new products and opens up new markets (e.g. FinTech applications that help people to better manage their finances)
-
More efficient markets: Use of AI and data can make for a more efficient trading market (e.g. by reducing transaction breaks and trading errors) and more efficient consumer markets (e.g. automated switching for credit cards).
-
Increased access to financial products: Use of non-traditional data leads to better profiling of customers (of e.g. likelihood of repaying loans)which may allow for greater access to financial products that were previously unavailable.
-
Operational efficiency: Use of AI and data helps financial institutions to allocate resources more efficiently and reduce operating costs, potentially leading to lower prices for customers.
-
Fintech innovation (e.g. new app-based, data-driven banking products and services)
-
Efficient compliance: Use of regulatory technology (‘regtech’) enables firms to comply more easily with regulations, lowering operating costs and allowing for more efficient resource allocation.
-
Increased consumer engagement: use of data and AI are used to help to increase consumer engagement with financial products and services which results in beneficial outcomes for them, for example using gamification to encourage long-term investments management.
-
Supporting vulnerable individuals and groups: Use of AI and non traditional data can help identify people that are vulnerable (e.g. at risk of financial distress), enabling intervention before the problems escalate.
-
Encouraging ethical consumerism and investment: use of data and AI enables the building and promotion of ethically minded new financial products and services and helps identify and encourage opportunities for ethical investment.
-
Better detection of economic crime: Use of AI and data to identify unusual transactions leads to better, faster and more efficient detection of fraud and money laundering both by the companies themselves and supervisory bodies.
-
Increased cybersecurity: Use of AI and data leads to faster and more accurate detection of cyber threats, and improved capability to counter those threats
-
Better risk assessment: Use of AI and data leads to more accurate assessments of financial and non-financial risks, potentially leading to lower prices for customers and less systemic risk.
31. Financial Services: Risks
31.1 Overview
-
The erosion of fairness was a common theme among the top risks identified by our panel. The amplification and entrenchment of bias in financial decisions was considered the most concerning risk associated with the use of AI and data, but the potential for consumer disempowerment, along with market effects such as increased uninsurability and the concentration of data in powerful market players, also ranked highly.
-
Regulation, not just consumer awareness, will be necessary to uphold fairness in the use of AI and data. Our expert panel viewed a lack of explainability in algorithmic decision-making (for regulators) as a significantly greater risk than a lack of transparency (for consumers). This may imply that top-down regulatory power is viewed as a surer route to realising ethical AI than bottom up consumer action. Indeed, there is an ongoing debate about the extent to which citizens should be obliged to take action to safeguard the use of their own data.
-
Giving consumers more information about how they are being treated by algorithmic systems is unlikely to address fairness issues. There are many in society, including the digitally disengaged and vulnerable, who cannot make fully informed decisions, even if all the information about a technology or a data processing activity is disclosed. The possibility of preferential market access for some and digital exclusion for others were both seen as significant risks by our panel. These risks are mirrored in the opportunities we examined, where the potential to use AI and data-driven technology to support vulnerable individuals and groups was seen as difficult to achieve.
31.2 Top Risks at a Glance
| Most likely | Most impactful | Most Combined Likelihood of Impact |
| 1. Data monopolies | 1. Regulator resourcing | 1. Algorithmic bias |
| 2. Algorithmic bias | 2. Algorithmic bias | 2. Higher-impact cyberattacks |
| 3. Consumer disempowerment | 3. Higher-impact cyberattacks | 3. Lack of explainability in algorithm decision-making |
| 4. Higher-impact cyberattacks | 4. New interdependencies and systemic risks | 4. Data monopolies |
| 5. Lack of explainability in algorithm decision-making | 5. Lack of explainability in algorithm decision-making | 5. Consumer disempowerment |
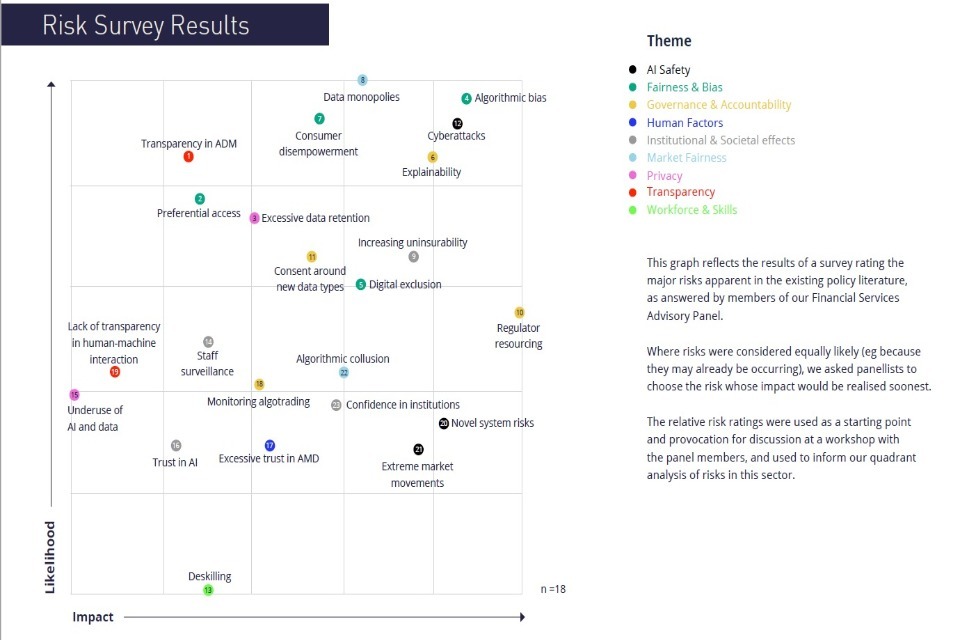
Financial Services - Risk Survey Results
This graph reflects the results of a survey rating the major risks apparent in the existing policy literature, as answered by members of our Financial Services Advisory Panel. Where risks were considered equally likely (e.g. because they may already be occurring), we asked panellists to choose the risk whose impact would be realised soonest. The relative risk ratings were used as a starting point and provocation for discussion at a workshop with the panel members, and used to inform our quadrant analysis of risks in this sector.
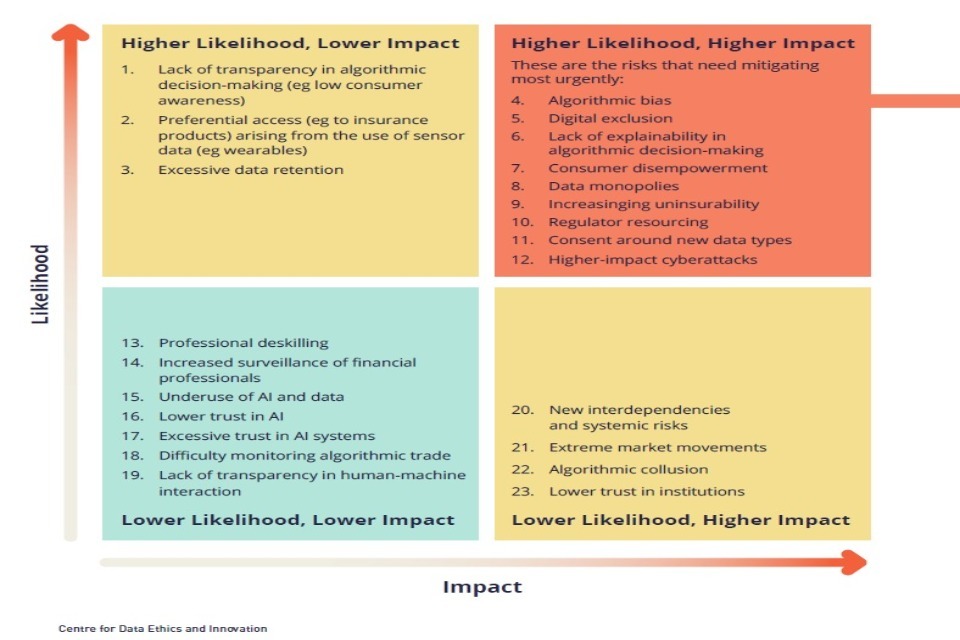
Financial Services - Risk Quadrant
Top themes in Financial Services Risks: Fairness & Bias; Market Fairness; Governance & Accountability
This quadrant is based on a panel survey rating the major risks in the Financial Services sector over the next three years. This diagram is not exhaustive and reflects a review of existing policy literature, workshop discussion, further socialising and additional research and analysis. See our methodology for further detail.
31.3 Financial Services: Risk Descriptions
-
Lack of transparency in algorithmic decision-making: it is difficult for people to challenge decisions about access to financial services that are made or informed by algorithms, because they are not aware of, or understand, their use.
-
Preferential access arising from the use of sensor data: individuals who agree to share data from sensors (e.g. car sensors or fitness trackers) get beneficial deals on financial products whereas individuals who are not happy to share data may be disadvantaged, leading to unequal insurance provision.
-
Excessive data retention: insurers and other financial institutions collect and retain data on people (eg from telemetrics or social media) beyond what is needed to provide relevant services, infringing on individuals’ privacy and making the consequences of a cyber breach more severe.
-
Bias in financial decisions: the use of historical data, and algorithms replicates and potentially exacerbates unfair bias (e.g. discrimination on the basis of protected characteristics) in decisions regarding to access financial services and the price of financial products
-
Digital exclusion: People who use digital services less frequently generate less data about themselves, making it more difficult for them to access financial services, as their ‘thin file’ is difficult to assess and may yield less accurate predictions.
-
Lack of explainability in algorithm decision-making: it is difficult for supervisory bodies to interrogate the accuracy and robustness of AI and data-driven systems used within financial services (eg in credit decisions) due to lack of transparency and their ‘black-box’ nature.
-
Consumer disempowerment: businesses derive valuable insights from customer data, giving them an unfair advantage in terms of ability to price products, assess risks and value data, resulting in a worse deal for consumers (e.g. new uses of data could reveal which customers are willing to pay higher prices).
-
Data monopolies: A small number of companies hold large, varied and high-quality data sets leading to an unfair playing field for other companies and consumers, potentially increasing system risk.
-
Uninsurability: the use of AI enables granular risk assessments (e.g. how likely someone is to fall ill or have their house broken into), resulting in more people being excluded from insurance products as unseen risks relating to them are exposed.
-
Regulator resourcing: Regulators lack the resources, expertise or technical understanding needed to effectively regulate the use of AI and data in the sector.
-
Consent around new data types: financial institutions collect novel data about people to inform their decisions (eg using data from social media to estimate the likelihood of someone repaying a loan or data from sensors to decide insurance premiums) in a way that does not allow for the appropriate level of transparency to, and control by, individuals.
-
Lack of transparency in algorithmic decision-making: it is difficult for people to challenge decisions about access to financial services that are made or informed by algorithms, because they are not aware of, or understand, their use.
-
Higher-impact cyberattacks: increased use of data and AI within financial services and markets increases the risk and impact of cyberattacks, which may cause changes in system functionality, loss of system availability, or data breaches.
-
Professional deskilling: Over-reliance on algorithmic decision-making tools erodes the development and availability of professional skills and judgement of finance professionals.
-
Increased surveillance of financial professionals: increased use of regulatory technology by firms for regulatory compliance and commercial purposes leads to financial professionals being unnecessarily monitored.
-
Underuse of AI and data: low uptake of AI and underuse of data means society misses out on system-wide benefits such as better fraud detection, cheaper and more tailored financial services, and faster and better risk assessments.
-
Lower trust in AI: The controversial deployment of AI and data use in financial services increases the public’s concern about how these technologies are used in other sectors, undermining their application across society.
-
Excessive trust in algorithmic decision-supporting tools: financial professionals using algorithmic recommendations (e.g. credit scoring system) in lieu of professional judgement resulting in poorer outcomes for users of financial products.
-
Difficulties in monitoring algorithmic trade: the black box nature of algorithms used to automate financial trading mean it can be difficult to predict and monitor trading behaviours, understand market effects and address undesirable (e.g. fraudulent) behaviour
-
Lack of transparency in human-machine interaction: Customers are unaware that the financial advice they are being given is from a chatbot, preventing them from critically assessing this advice as they otherwise might and potentially reducing human autonomy.
-
New interdependencies and systemic risks: novel data-driven trading strategies connect financial markets and institutions in new ways, increasing the possibility and scale of system risks where, for example, an event at company level could trigger instability through large, and seemingly unconnected, sections of the market.
-
Extreme market movements: the use of algorithms to automate trading decisions causes extreme unintended market movements, including flash crashes (where a market crashes within a very short period of time).
-
Algorithmic collusion: algorithms collude (e.g. work together to set prices of competing products) leading to higher prices for consumers and companies, without it necessarily being an explicit strategy of the financial institutions that operate them.
-
Loss of public confidence in finance institutions: Concerns about the accuracy and impartiality of AI and data use in financial services undermines public trust in banking, insurance, or other financial institutions.
32. Major Theme: Algorithmic Bias
32.1 Overview
The risk of algorithmic bias in financial decisions was rated as one of the most significant in this sector, occurring where the use of historical data and algorithms replicates and potentially exacerbates unfair societal biases.
-
Society should aim to reach a consensus about what counts as fair discrimination when offering and pricing financial products. The availability and pricing of financial products requires firms to legitimately discriminate against their customers on the basis of financial risk. In some markets, such as car insurance, it is widely accepted that older and younger people should be priced differently due to the different average risk profiles they present to insurers. Conversely, it has been decided that drivers should not be discriminated against on the basis of their gender, even though there is a difference in risk profile between men and women. As more data about individuals becomes available, new questions will arise about what amounts to fair discrimination.
-
A lack of explainable AI systems makes it more challenging to uphold fairness in finance. Even when sensitive information such as protected characteristics are removed from datasets, AI systems can learn to use ‘proxy variables’ (such as a borrower’s postcode) to replicate historic biases in training data (e.g. a bank having lent less often to people from a particular ethnic group, that happen to be concentrated in particular areas). If AI systems cannot be interrogated to understand the logic behind their decisions then unfair discrimination is less likely to be identified and mitigated.
-
If there is no consensus about what is fair, industry will make the choice. Without a common view and clear guidelines on what is considered fair use of data, industry will de facto set the standards by itself. Our expert panel – many of whom represented financial services firms – emphasised that it is neither reasonable nor desirable for firms to bear the responsibility of answering sensitive questions about what is just.
32.2 Governance observations
Our expert panel emphasised the need for regulators to be appropriately resourced and for governance responses to be transparent, agile, and future proof. They noted the applicability of a number of existing rules to the challenge of addressing algorithmic bias in finance, including GDPR accuracy and fairness principles, FCA rules on treating customers fairly, and the Equalities Act.
-
Transparent: While it may take time to agree what constitutes discrimination, this should not stop firms from being transparent today about how they are using data and algorithms to inform financial decision-making, which would strengthen accountability and allow their behaviour to be scrutinised.
-
Agile: Governance bodies should provide clarity to firms about what they can and cannot do, while at the same time recognising that even the best regulation will not have an answer for every context and circumstance. Agile governance is likely to include a mix of traditional rules-based approaches, which could include ‘guardrails’ on what personal data sources or types are legitimate to use when calculating risk, as well as more novel interventions, such as those that require firms to demonstrate that a customer would not have a worse outcome using non-traditional data.
-
Future-proof: The impact of new technologies can take time to manifest, and therefore governance mechanisms need to look out for and redress harms that are revealed years into the future. Our expert panel pointed to the example of the Payment Protection Insurance (PPI) scandal, where the Financial Conduct Authority stepped in to help victims reclaim money, but in some cases long after they were first mis-sold a PPI product.
32.3 State of the Art: CDEI Review of Algorithmic Bias
The CDEI will be publishing a comprehensive review of algorithmic bias across four sectors (including financial services), looking at whether governance regimes are equipped to mitigate unfair discrimination, and what it would take to strengthen them where necessary.
32.4 Drivers
-
Bias and discrimination can arise throughout the AI system lifecycle. The risk of unfair bias being replicated and exacerbated when decisions are partly or fully automated can arise from the data itself (e.g. with incomplete datasets that do not represent all sections of society), from how algorithms are designed, and from the ways in which they are deployed. This makes it challenging to comprehensively address bias.
-
Historical societal biases are integrated into training data. Past decisions about who has access to financial products and how much they are charged may have been driven by long standing societal biases, and often form the basis of the data used to train today’s AI systems. Consumers can be discriminated against on the basis of their protected characteristics, but also the economic history of the places in which they live. For example, people living in former mining towns may be deemed a higher risk to banks, given the economic collapse faced by these regions in years gone by, yet location in this sense may no longer be an accurate predictor of borrower behaviour.
-
Increased volume and complexity of data use. As well as collecting data directly from their customers, financial services firms increasingly make inferences about them using seemingly unrelated data, such as their social media history or spending patterns. This intricate and growing web of data collection may unintentionally import new sources of bias into decision-making, for example by introducing new proxy variables within training datasets.
-
A lack of historical personal data can also lead to discrimination: As data increasingly determines what financial products individuals have access to, discrimination can also arise against people without historic, or with negative, data footprints. Those more able or willing to share their data may receive preferential products and pricing. However, this can be product-specific. With regard to annuities, for example, it may be more advantageous for customers to have less data available on them.
-
Cultural and organisational factors: Bias can be more difficult to address when organisations are fractured and where internal teams are not in alignment on bias mitigation policy (e.g. with differences between the approaches of teams that design tools and those who deploy them). There are also structural limitations within organisations that can serve as barriers to developing best practice in using AI systems, such as data stored in legacy systems and poor quality data.
33. Major Theme: Higher-Impact Cyberattacks
33.1 Overview
The increased use of data and AI within financial services and markets increases the risk and impact of cyber attacks, which can cause changes in system functionality, loss of system availability, or data breaches.
-
The use of AI and big data analytics increases the opportunities for malicious attacks. AI systems are potentially vulnerable to new types of adversarial attacks, in addition to experiencing those that normally affect digital systems. For example, the data used to train algorithms can be ‘poisoned’ to change the outcomes it produces.
-
The impact of cyber attacks can be both direct and intangible, and can be compounded by AI use. Cyberattacks are best known for their direct consequences, for example in affecting system functionality or leading to fraud. However, they can also result in less tangible effects, such as reducing levels of consumer trust in technology. The collection and storage of increasingly large volumes of personal data to train AI systems can magnify the impact of data being stolen, or the efforts required to recover from an attack.
-
Cyberattacks present a significant challenge for companies, and can be costly to address. Large investments are required to update and protect systems, particularly older technology. Complying with cybersecurity guidance can also be costly, especially for SMEs, and it can be a challenge to set standards in a way that does not have adverse effects for smaller providers.
-
Explainability is crucial for maintaining confidence in systems. The ability to transparently examine AI systems’ decision-making processes for anomalies is critical for maintaining organisational and consumer trust in financial markets. If there is enough suspicion that an attack has happened and it is difficult to determine quickly whether a system has been affected, that system may still be taken offline regardless of whether an attack has actually occurred.
-
Both industry and regulators are finding it challenging to meet skills requirements. Financial firms are in a continuous battle to keep pace with ever evolving cybersecurity threats. It is particularly difficult to find talented specialists who can prevent and address state of the art attacks. Many financial companies rely on consultancies, which erodes in-house security knowledge. Regulators, meanwhile, are adjusting to expanding remits and new technologies beyond AI, such as the shift to cloud-based services.
-
The scale of the risk is difficult to estimate from available data. There is relatively little published data on rates of cyberattacks, which may conceal the true extent of activity. It is likely that many smaller data breaches and fraudulent transactions go unnoticed.
33.2 Drivers
-
Attackers tend to be ahead in the development and use of new technology. Financial firms are often on the back foot, responding to new threats rather than anticipating them, which would require more resources than most have at their disposal. Regulators can also struggle in this fast-changing environment, given the time it takes to create guidance and legal structures that respond to new developments. Attackers, meanwhile, have an advantage in operating outside of the law.
-
Human error can enable cyberattacks. As well as common factors such as weak passwords, a lack of in-house security knowledge driven by reliance on outside consultancies and off-the shelf products can exacerbate the risk of attack.
-
Concentration of capabilities and infrastructure increases system weakness. Many financial institutions rely on a small number of service providers, for example for their cloud infrastructure. Yet the risk management policies of financial firms are not always designed with outsourcing in mind.
-
AI systems present a greater range of attack ‘surfaces’. The tampering of AI models can be harder to detect than conventional forms of cyberattack. AI systems could be manipulated in such a way that leads to a small change in every computation – a deviation that may be undetectable in isolation but when multiplied across thousands of computations results in large effects for financial organisations. An example is model tampering that leads to riskier lending than intended, with consequent effects on a bank’s capital requirements.
Case Study: Machine Learning and Adversarial Attacks in Financial Markets
-
As well as bringing new benefits, machine learning techniques can also create additional ‘attack surfaces’ for a given system – that is, new opportunities for bad actors to conduct cyber attacks. Adversarial attacks can involve very small ‘nudges’ that affect the inputs for a machine learning technique. Such nudges can go undetected, either due to the subtlety of the change, or a lack of internal understanding of the inputs for a given machine learning algorithm. However, attacks could have substantial impacts if new data is processed, or existing data weighted differently, skewing the model and resulting in unexpected decisions and actions.
-
In financial trading, where an attack could be used to nudge a machine learning algorithm to make different predictions about stocks or a market with apparent high confidence, the potential result could be substantial losses to investors or a traded entity. Recent research by Goldblum et al. on adversarial attacks suggests that a single attack can be widely transferable to different AI systems, potentially by an attacker with a small budget and limited knowledge of the victim’s systems.
-
These attacks can be particularly damaging because it is difficult to know whether one has occurred, as small nudges from attacks can make misbehaving models appear benign to humans. The Financial Conduct Authority and Alan Turing Institute have outlined an initial framework for thinking about transparency in the use of machine learning in financial markets. Of particular importance is establishing trustworthiness in AI system outcomes through robust metrics for performance and explainability.
34. Major Theme: Data Concentration
34.1 Overview
With only a small number of companies holding large, varied, and high-quality data sets, other companies and consumers can experience unfair playing fields, potentially increasing systemic risks.
-
Reinforced power and information asymmetries: the concentration of high-quality data to help create new financial products and services can exacerbate existing asymmetries of power. Imbalances can arise at various levels, for example, between established firms and startups, between government and industry, and even between countries. The potential entrance of large technology companies into the financial market could create further asymmetries.
-
Lack of clear definitions and measurements: there is little consensus on how to identify digital or data monopolies, or to clearly signal when concentrations of data become problematic. This can be exacerbated by difficulties in tracking the flow of data and where it is used. For example, data may be collected in one market but used in another, or companies may move from operating in one sector to another.
-
Regulator access to data is limited: regulators encounter challenges in monitoring how companies use data, which hampers their ability to understand the impact of data monopolies in the financial sector.
-
Data concentration impacts all sectors: Although increased data concentration has specific implications for the financial sector, it reflects a broader pattern of market concentration across the economy, where a small set of companies dominate their sectors. Given many of these firms operate across borders, attempts to address data concentration may require a coordinated international response. Our expert panel also cautioned that the goal of promoting competitive markets is unlikely to be met solely through individual sector action, but instead demands an economy-wide strategy.
34.2 Governance
-
Competition law may play a central role in reducing the scale and impact of data concentration, including within highly data-driven sectors like finance. The Competition and Markets Authority (CMA) is responsible for overseeing adherence to competition law in the UK.
-
‘Open banking’ is a flagship CMA initiative that has sought to increase competition and data accessibility in financial markets. Introduced in January 2018 through the Second Payment Services Directive (PSD2), open banking promotes data portability between competitors in financial services sectors, such that customer account data can be accessed via open APIs.
-
Still in its early stages, open banking has been viewed as an important measure in improving access to data, particularly for smaller fintech competitors. The Open Banking Implementation Entity (OBIE) which oversees the development of open banking, has noted significant increases in user uptake in late 2019, although consumer awareness remains relatively low.
-
In early 2020 the Bank of England and Financial Conduct Authority launched joint new initiatives examining the future of regulatory data collection in financial services, with the former announcing a review and the latter a new data strategy. Both seek to improve how regulators capture and analyse information regarding financial markets and business activities.
34.3 Drivers
-
Historically concentrated markets. Banking, finance, and financial trading markets have tended to be dominated by a small number of very large actors, which have historically controlled a majority of market share, and therefore data.
-
Increased opportunities to make use of existing datasets. Established organisations often have large volumes of historic data on markets and customers, which can now be mined by AI and big data analytics to generate new insights. In practice, however, historic data may be stored on legacy systems that are expensive to update – a problem not experienced by startups, which are better placed to adopt new technologies and standards.
-
Barriers to new entrants. New entrants to financial markets face a range of challenges, with regulatory barriers often cited as a particular burden. As long as these obstacles to competition exist, data is likely to be concentrated in the hands of a small number of actors.
Case study: The Opportunities of Open Banking
The ODI produced a case study of Barclays Bank’s implementation of the open banking directive (PSD2), which highlighted how the sharing of customer data created value both for the firm and its customers. Beyond the implementation of specific APIs in line with this directive, Barclays introduced new features within their mobile banking app, allowing customers to view up to eight accounts with other banks. The ODI’s analysis also suggests that Open Banking APIs allowed Barclays to work more closely with a range of fintech startups by standardising the way they share live customer data.
34.4 State of the Art: Open Finance
In December 2019 the FCA published a Call for Input on the concept of ‘open finance’, driven by belief that the data collected by financial services providers is ultimately owned by customers. The FCA paper looks at the progress of open banking so far, and suggests where open finance could further improve competition by giving customers more control over their data. This could mean opening up customer data to more third-party providers, allowing, for example, the use of personal financial management dashboards and automated account switching.
35. Health and Social Care
35.1 Overview
35.2 Scope
The scope of our sectoral analysis covered the use of AI and data-driven technology in the provision of health and social care services including: national and devolved health bodies; local authorities; public, private and VCSE health and care providers; the pharmaceutical and biotechnology industries; research bodies and funders; and regulators.
35.3 How is data-driven technology and AI used in health and social care?
The health and social care sector is relatively advanced in how it uses AI and data-driven technologies. Use cases include:
-
Medical research (e.g. protein modelling, drug discovery)
-
Public health research and tracking (e.g. detecting diseases, tracking epidemics)
-
Efficiency improvements (e.g. predicting demand, supporting back-office planning, triaging)
-
Clinical decision-support systems (e.g. enabling personalised treatment)
-
Clinical diagnosis (e.g. identifying diseases on medical scans)
-
New patient-facing apps and services (e.g. diagnosis apps, symptom checkers, chatbots)
-
Social care risk scoring (e.g. predicting risk of truancy or abuse of people in care)
-
In-home monitoring and support services (e.g. voice assistants that can deliver health advice from the home)
-
Remote health management
More advanced applications are in development, such as AI clinicians and automated surgery, however our analysis looks only at innovations that are currently being deployed at scale.
35.4 Key Messages
-
Healthcare is advanced in terms of the range, capabilities, and implementation of AI applications, and the opportunities these present are correspondingly broad. The promise of AI and data-driven technology has been demonstrated most recently during responses to COVID-19, where it has been used, for example, to improve vaccine discovery and power diagnostic tools. However, the breadth of use cases across a large systems, which concerns people’s wellbeing and often requires the processing of large volumes of personal data, presents significant risks.
-
Despite the level of innovation occurring within the healthcare sector, many areas lack an effective and systematic approach to data use. Many of the use cases listed above have only been possible following bespoke efforts to improve data collection and quality. Levels of digital and data maturity are considerably lower in social care, as are the systemic incentives that usually drive data sharing and research into better data use, such as the availability of research funding. This means that the use of AI in social care is limited compared with the healthcare sector. The main applications of data-driven technology were in risk analytics (e.g. predicting which children are at risk of abuse) and in-home monitoring and support (e.g. via voice assistants or IoT devices).
-
Public trust is crucial in health and social care contexts. The opportunity costs of underusing AI and data were seen as higher in health and social care than in other sectors. Moreover, our panel appeared to be less concerned here than elsewhere about technology’s impact on privacy, which may reflect the clear and tangible benefits it offers to patients. But this enthusiasm for better healthcare is accompanied by a relatively higher public sensitivity to data and AI misuse, which in turn has trust implications for health and care institutions. The potential for medical professional distrust of AI-driven technologies was also a prominent concern in health compared to other sectors.
36. Opportunities
36.1 Overview
-
Few applications in health and social care were seen by our panel as being of low potential benefit. Health and social care services are embedded within highly interconnected and interdependent systems, many of which operate with tight resources. This means that even routine, non-clinical uses of AI and data (e.g. tracking equipment) can have significant positive knock-on effects.
-
Many of the opportunities that were seen as easier to realise related to less tightly regulated contexts, in particular, those that don’t involve clinical decisions or applying algorithmic decisions to patients directly, such as workforce management and support.
-
Panellists felt that many of the opportunities presented by AI and data-driven technology were skewed towards health rather than social care, in part because of lower digital and data maturity in social care, and fewer structural incentives for these to develop.
-
Maximising the public benefits of AI and data-driven technologies is highly contingent on trust in technology and health institutions. There are opportunities to enhance public trust through more nuanced consent models for how data is shared and used (e.g. allowing patients to specify the purposes for which their data can be used), which would also ensure more data is available for research and AI model training.
36.2 Key opportunities
Our expert panellists highlighted the following opportunities:
-
Reduced health inequalities as improvements in software lower costs and allow more people to access advanced healthcare.
-
Improved prevention in public health. Algorithmic systems can learn to spot patterns in public behaviour that may indicate the onset of an epidemic, for example using inputs into search engines or content displayed on social media feeds.
-
Greater role for patients in managing their health. New data-driven tools can allow patients to contribute to their own diagnosis and disease management, for example by logging lifestyle data that may reveal patterns leading up to a medical relapse. These tools were also discussed as having potential for educating and managing the concerns of the ‘worried well’, although some noted that symptom checker apps may worsen this issue.
-
Supporting social care service users and staff by automating aspects of social care monitoring (e.g. detecting whether care home residents are awake or in need of support).
-
Better equipped workforce. AI and data-driven technology could extend the abilities of healthcare staff, for example by enabling them to diagnose diseases more rapidly and give the correct treatments. Deployed well, technology could also free up the time of healthcare professionals, enabling more personal interaction and potentially reducing overall staffing demands, although this latter point was contested by our panel.
-
Cost savings achieved through automating non-complex tasks, such as estimating tumour size. Automation could also assist with the triaging of patients, or supporting their movement between different parts of the health system by tracking the care they receive. Automation has further potential in social care, where it could support staff with identifying personal care needs for residents - although there are concerns that excessive automation of care tasks could remove important human-to-human connection.
-
Improved data entry quality. Algorithmic systems can improve the pace and accuracy of data entry for medical research and use of healthcare tools, for example the digitisation of paper records. However, this would depend on having clean data, underpinned by data standards.
36.3 State of the Art: Research and Commercial Use of Healthcare Data
Future Care Capital recently published a report examining the legal issues surrounding the potential ownership and exploitation of health data.
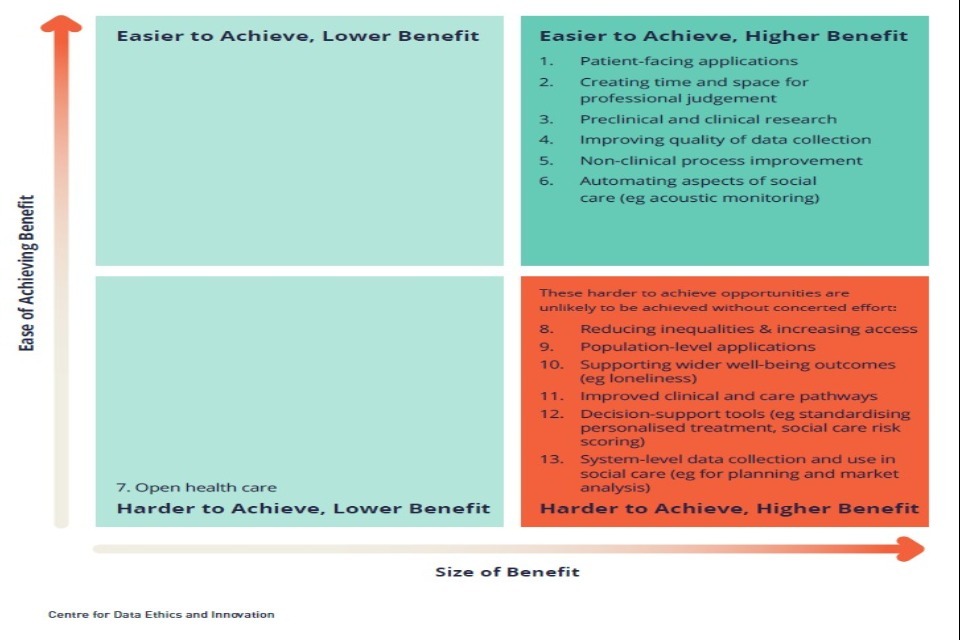
Health & Social Care - Opportunities Quadrant
This quadrant is based on the panel’s discussion of major AI opportunities within the Health & Social Care sector over the next three years, compiled by reviewing existing policy literature. This table is not exhaustive. See the methodology at the end of this document for further detail.
Spotlight: Reducing Health Inequalities and Increasing Access
The improved use of AI and data-driven technology in health and social care has the potential to reduce health inequalities, for example between geographic areas, or for particular groups that vary with age, gender or ethnicity. A number of NHS projects aim to use technology in this way, including:
- The Seaview Project in Hastings has provided greater internet access to homeless people in public spaces, with the goal of encouraging them to access health information online. This has allowed the recording and triage of health concerns among rough sleepers, and has led to improved adherence to medication and the management of its side-effects.
- Volunteer-run digital health hubs have improved people’s digital skills and confidence, ensuring they can access online health information and services. Hubs are being rolled out across a number of councils.
- The NHS has been exploring whether wearable technology can help patients that have vision and hearing impairments access the health services they need.
Health inequalities could be addressed on a larger scale with the assistance of technology, although this would not be without its challenges. For rural communities, establishing services to deliver medical examinations and monitoring at a distance (telemedicine and telehealth respectively) could significantly improve patient accessibility to healthcare. The availability of such services has accelerated in the context of COVID-19. However, such measures often require new digital infrastructure, a change in culture and understanding, and significant cost. Crucially, interventions need to be underpinned by a consideration of the particular context of health or social care provision and the communities likely to be affected.
36.4 Opportunity Descriptions
-
Patient-facing applications (e.g. remote delivery of therapies, information provision, health promotion, preventative health, home monitoring)
-
Creating time and space for professional judgement (e.g. automation can free people up to do tasks requiring professional judgement)
-
Preclinical and clinical research (e.g. drug discovery, genomic science, clinical trials)
-
Improving the quality of data collection (e.g. the digitisation of handwritten medical notes using image recognition and natural language processing).
-
Non-clinical process improvement (e.g. procurement, logistics, document/paperwork management, staff scheduling, demand management, predictive modelling, professional development)
-
Automating aspects of social care (e.g. using acoustic monitoring to determine when social care services users may need support)
-
Open healthcare: open, shareable formats for health data enabling the development of innovative new services.
-
Reducing inequalities and increasing access (e.g. by reducing the cost of diagnosis or treatment, allowing more people to benefit)
-
Population-level applications (e.g. identifying epidemics, targeting public health resources)
-
Supporting wider wellbeing outcomes (e.g. using video devices or chatbots to combat loneliness)
-
Improved clinical and care pathways (e.g. better diagnostics, prognostication, treatments, health and care interventions)
-
Decision-support tools for healthcare professionals (e.g. enabling personalised treatment for people with multiple conditions, or better risk assessment in social care)
-
System-level data collection and use in social care (e.g. use of system-level data comparable to healthcare for better national and local planning around care demand and supply)
37. Health and Social Care: Risks
37.1 Overview
-
Risks relating to underuse of AI were both more prevalent in this sector, and typically scored higher than similar risks in other sectors. This may be because the opportunity costs of not using data-driven technologies in health and social care are particularly tangible (e.g. higher levels of mortality).
-
Conversely, many risks relating to privacy scored lower in terms of impact than in other sectors, reflecting the trade-off and careful balancing needed between privacy and the potential public benefits of using health data.
-
There was one significant exception to this pattern. Our panel rated as high impact the risk that meaningful consent may not be obtained for the newest forms of health data generation and collection – for example by non-public bodies or via personal devices and health apps.
-
The potential for AI use to affect health inequalities was prominent in our workshop discussions, both as a high-impact risk and opportunity. This reflects the potential for AI to make the fair distribution of health and social care services better or worse, depending on how it is used. The risk of algorithmic bias also ranked very highly, as it did in most other sectors.
-
The potential impact of AI and data misuse on trust in institutions is notably higher in health and social care than in many other sectors. The responsible and ethical use of technology may be seen as more important in health because trust in institutions significantly affects levels of engagement with services, with consequences for both individuals and system demand.
-
While the risk of inadequate regulator resourcing scored similarly to other sectors, our workshop discussions focused more on the coordination of governance and ‘ownership’ of regulatory outcomes, than on resourcing specifically.
37.2 Top Risks at a Glance
| Most Likely | Most Impactful | Combined Likelihood and Impact |
| 1. Worsened health inequalities due to lack of data | 1. Higher-impact cyberattacks | 1. Higher-impact cyberattacks |
| 2. Lack of transparency in algorithmic decision-making systems | 2. Trust in institutions | 2. Algorithmic bias |
| 3. Low e-Health literacy | 3. Worsened health inequalities due to lack unequal access | 3. Worsened health inequalities due to lack of data |
| 4. Algorithmic bias | 4. Poor medical advice | 4. Poor medical advice |
| 5. Professional distrust | 5. Algorithmic bias | 5. Low e-Health literacy |
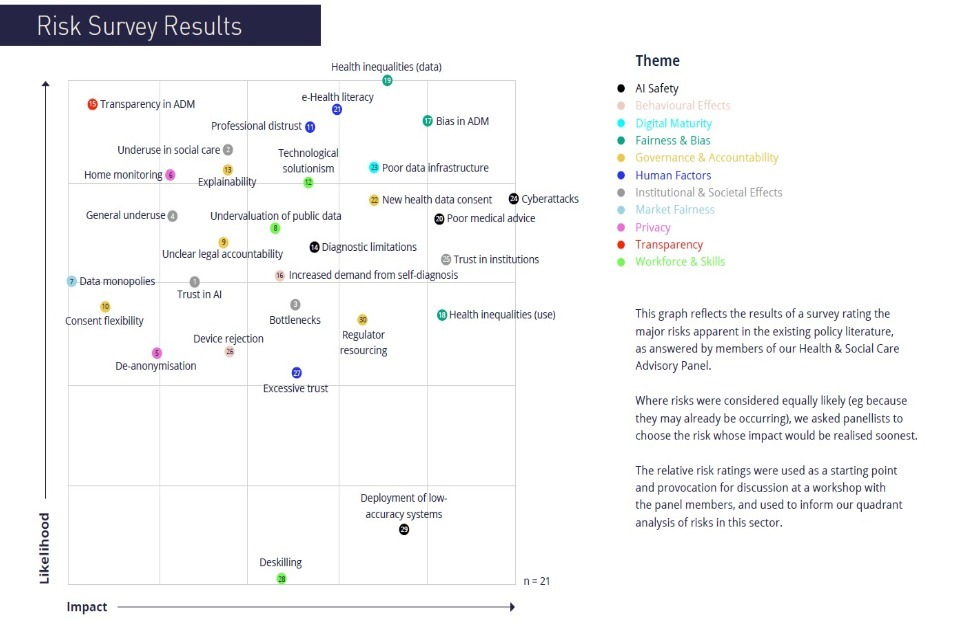
Health & Social Care - Risk Survey Results
This graph reflects the results of a survey rating the major risks apparent in the existing policy literature, as answered by members of our Health & Social Care Advisory Panel. Where risks were considered equally likely (e.g. because they may already be occurring), we asked panellists to choose the risk whose impact would be realised soonest. The relative risk ratings were used as a starting point and provocation for discussion at a workshop with the panel members, and used to inform our quadrant analysis of risks in this sector.
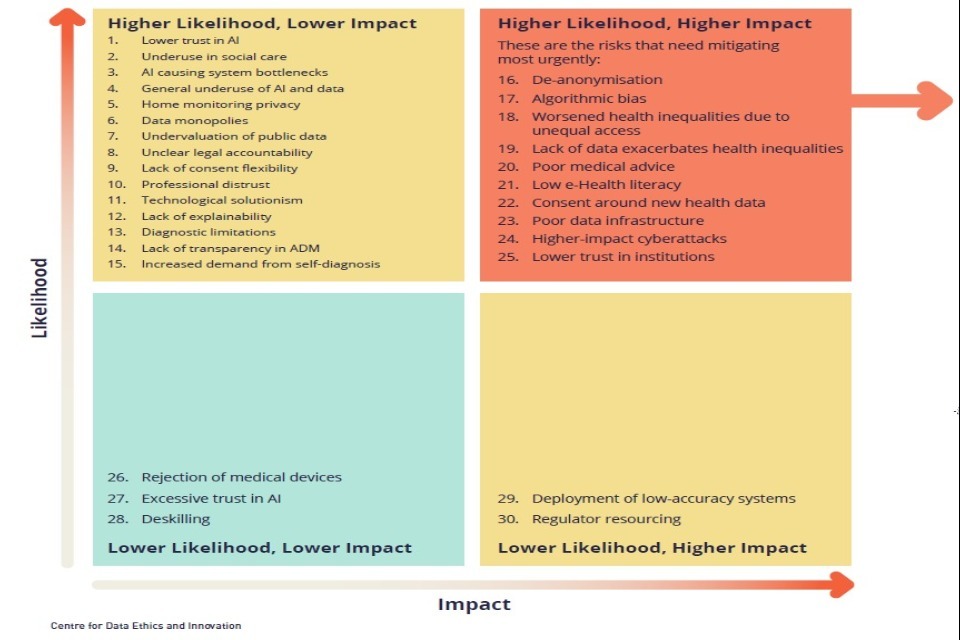
Health & Social Care - Risk Quadrant
Top themes in Health & Social Care Risks: Fairness & Bias; Privacy; Institutional & Societal Effects
This quadrant is based on a panel survey rating the major risks in the Health & Social Care sector over the next three years. This diagram is not exhaustive and reflects a review of existing policy literature, workshop discussion, further socialising and additional research and analysis. See our methodology for further detail.
37.3 Health and Social Care: Risk Descriptions
-
Lower trust in AI: The controversial use of AI and data in health and social care increases the public’s concern about how these technologies are used, undermining their application within health (including people withdrawing from other health services), and across wider society.
-
Underuse in social care: Underuse due to unequal resourcing and incentivisation in data infrastructure and research between health and social care.
-
Pathway bottlenecks: The increased diagnostic capability provided by AI and data-driven applications leads to bottlenecks further on in the health and care pathway.
-
Underuse of data and AI: Excessive governance measures in health (e.g. of medical devices, or to address privacy concerns) stymie the development and roll out of AI and data-driven applications potentially delaying the benefits for patients and the health system.
-
Home monitoring privacy risks: New and increasing use of smart/IoT patient-monitoring devices in people’s homes negatively impacts their privacy, with it being unclear what data is collected, how it is stored and who it is shared with.
-
Data monopolies drive unbalanced AI health markets: Only a small number of organisations hold large, varied and high-quality data sets leading to an unfair playing field for other companies, and ultimately a smaller market of AI/data-driven health products for health commissioners to choose from.
-
Undervaluation of publicly-owned data: Public bodies do not understand the full commercial value of sharing publicly-owned data (e.g. medical records) with private sector developers, leading to inefficient use or exploitation of public assets (e.g. selling proprietary products built on public health data back to the public sector).
-
Unclear legal accountability: Lack of clear accountability for who is legally responsible for health and social care decisions made or informed by the use of algorithmic tool (e.g. misdiagnosis).
-
Lack of flexibility in consent options for people sharing their health data means they opt out of sharing, decreasing the system benefits of large, high quality health datasets for research.
-
Under-use of AI and data-driven technology due to professional distrust: Algorithmic decision-making tools are disregarded by health and care professionals because they question the accuracy of these tools, or believe they will undermine their professional independence (e.g. in judging the need for a given care intervention).
-
‘Technological solutionism’: Unwarranted overemphasis of digital solutions to tackle health and social care challenges that require fundamental human relationships and connection (e.g. loneliness), leading to poorer outcomes for service users.
-
Lack of explainability in algorithmic decision-making: The ‘black box’ nature of algorithms used in health and social care, or their commercial confidentiality means it is difficult for professionals, service users or regulators to interrogate decisions and know what confidence to place in them.
-
Limitations of AI and data-driven approaches to diagnostics: AI and data-driven diagnostic services miss information that human clinicians can take into account (e.g. non-quantifiable or non-captured data), leading to worse health outcomes.
-
Lack of transparency in algorithmic decision-making: Individuals are unable to challenge health and social care decisions made or informed by algorithms (e.g. about the size of their personal care budgets), because they are not aware of their use.
-
Increased demand from self-diagnosis: Private patient-facing apps or services tend to provide risk-averse false-positive diagnoses, leading to increased demand on public health services.
-
De-anonymisation: The ability to de-anonymise health data with relative ease impacts individuals’ privacy or limits AI research in the field of healthcare due to consequent restrictions placed on data sharing.
-
Bias in algorithmic decision-making systems: Use of biased algorithmic tools (e.g. due to biased training data) entrenches systematic discrimination against certain groups (e.g. social care risk scoring or misdiagnosis).
-
AI and data-driven technology magnifies health inequalities: Access to cutting edge AI and data-driven medical technology is unevenly distributed through the health and care system, magnifying existing health inequalities.
-
Lack of data exacerbates health inequalities: Lack of health data on particular groups means AI applications are poorly trained or adapted to their needs.
-
Poor medical advice provided by quasi-medical apps and services: Health misinformation distributed through online platforms (eg via high search or social media salience, or through quasi-medical apps and services) is unaddressed, leading to worse health outcomes and increased system demand.
-
Lack of public e-health literacy: People are unable to weigh up the reliability and accuracy of different internet sources that offer medical advice (e.g. being unable to distinguish between social media misinformation and reliable health advice websites), leading to worse health outcomes and increased system demand and risk.
-
Consent around new health data: Lack of transparency and meaningful consent around collection and use of health data by apps and services (e.g. medical apps, wearables, health-related web searches, online genetic testing services), impacting people’s privacy and access to products like health insurance.
-
Underuse due to poor data infrastructure: lack of effective data collection, data quality assurance, data-sharing arrangements, interoperable systems (e.g. between care providers, commissioners, or researchers), or trust leads to the under-use of AI and data-driven approaches.
-
Higher-impact cyberattacks: increased use of data and AI within health and social care increases the risk and impact of cyberattacks, which may cause changes in system functionality (e.g. misdiagnosis), loss of system availability (e.g. via ransomware), or data breaches.
-
Loss of public confidence in health and social care institutions: Concerns around accuracy, security or privacy of AI and data use in health and social care undermines public trust in health providers and related institutions
-
Rejection of data-driven health devices: Poorly designed and conceived health devices (e.g. for fall monitoring or medication reminders) means people are less willing to use them, leading to loss of the technology’s individual and system benefits.
-
Excessive trust in algorithmic decision-making tools: Health or social care professionals use algorithmic recommendations in lieu of professional judgement, resulting in poorer outcomes for service users.
-
Professional deskilling: Over-reliance on algorithmic decision-making tools erodes the development and availability of professional skills and judgement.
-
Deployment of low-accuracy systems: AI-driven diagnostic technology is deployed in health and social care despite having low accuracy, causing misdiagnosis.
-
Regulator resourcing: Regulators lack the resources, expertise or technical understanding needed to effectively regulate the use of AI and data in the health and care sector.
38. Major theme: Health Mis/Disinformation
38.1 Overview
Health misinformation and disinformation concerns the provision of poor or misleading medical advice, particularly through newer apps and web services, which people are increasingly using as an alternative to official health services.
As well as harming individuals, both misinformation and disinformation can have systemic effects on demand for health services, for example with false positive diagnoses causing people to seek medical care they don’t need, or unscientific claims about the dangers of vaccination lowering population immunity and resulting in disease outbreaks. For the sake of brevity, we use the term mis/disinformation in the rest of this document to capture all forms of misleading health information.
38.2 Key messages
-
Data-driven technology can drive mis/disinformation directly (e.g. via inaccurate diagnostic apps) or enable its spread (e.g. with search or social media platforms making misinformation more prominent). Panellists noted the potential for mis/disinformation to damage trust in all forms of AI and data-driven technologies, including applications and innovations that have played no part in the problem.
-
Inaccurate information that leads people to incorrectly seek or dismiss further medical intervention has significant systemic effects on demand. These effects are magnified during public health crises, when the public is actively seeking medical information and pressure on healthcare systems is most acute.
-
Mis/disinformation affects many other areas of life beyond healthcare, suggesting that coordinated, cross-sector approaches will be needed to address it effectively. This may mean developing better content moderation policies on digital platforms, introducing new marketing standards (e.g. for advice apps), and protecting public trust in reliable sources of information.
38.3 Governance
-
Apps that provide medical advice are considered medical devices. The regulation of medical devices is well-developed, with different levels of device classification for the nature of the information conveyed (e.g. symptom checkers vs diagnostics). It also operates on a principle of substance over form, meaning that an app disclaiming medical device status does not necessarily place itself outside the governance regime. However, panellists questioned how meaningfully these provisions are enforced in the context of growing volumes of health and wellness apps and services offered through globalised app stores and platforms.
-
There are no requirements on platforms that provide apps to monitor, flag, or vet the apps they provide access to for the accuracy of their content or their claims around medical device status.
-
Some platforms are voluntarily experimenting with ways to tackle mis/disinformation in search results, for example, by bringing accurate advice higher up the search results. While this may have competition implications in some jurisdictions, (e.g. due to the prevalence of private health providers), doing so may be less of a concern in the UK given the public nature of most healthcare provision.
38.4 Drivers
-
Confusion between wellbeing apps and medical devices. The former are unregulated and therefore less likely to deliver correct and useful health advice, but consumers tend not to know the difference. Some apps disclaim medical status even though the nature of the service they provide would fall under the definition of a medical device under the law, further adding to confusion.
-
Large and confusing ecosystem of medical advice services. The prominence of some websites (e.g. in search results) may give the impression that they are authoritative, despite their advice being inaccurate and/or scraped or aggregated from a variety of sources. In the UK, the NHS competes with such providers to promote accurate health information.
-
Search and social media platform reticence to police content. Some search and social media platforms have been slow to address inaccurate or misleading content. While some are now flagging or taking down problematic content, it typically relates only to the most controversial issues like vaccination or inaccurate COVID-19 content.
-
Lack of explainability in algorithmic health systems. If the results of diagnostic algorithms provided through apps and websites cannot be interpreted, their results may not be sufficiently interrogated, leading to mis/disinformation in the form of false diagnoses.
-
Risk averse incentives among third party providers. Third party health app developers are incentivised to avoid false negatives to avoid liability for telling users they are healthy when they are ill. The tendency to recommend medical consultation and prefer false positives increases system demand.
-
Low e-health literacy. Some people do not have the skills to determine what is a reliable source of health information. This includes patients but also some healthcare professionals, as well as intermediaries that sit between patients and the healthcare system, such as school teachers.
-
Trust in institutions. Mis/disinformation is amplified when people do not trust established healthcare institutions. For example, low levels of trust in some public fertility services can push people to seek out advice elsewhere. People may seek second opinions from peers on social media, rather than rely on the advice of doctors and other clinicians.
Case Study: COVID-19 and Mis/Disinformation on Social Media
The COVID-19 pandemic has created an unprecedented challenge in ensuring the public receive accurate information regarding the disease, and responses to it. Mis/disinformation concerning prevention, mitigation and cure were widely spread across social media from the outset of the pandemic, as well as on marketplace platforms. In March 2020, as much as 50% of the news content read on Facebook was related to COVID-19.
Many social media platforms have previously expressed reluctance in taking down misleading content, but the response to COVID-19 mis/disinformation has been notably swifter and more expansive. As well as taking down content identified as mis/disinformation which could lead to ‘immediate and imminent’ harm, platforms such as Facebook and Instagram have directed users to content from reliable health authorities such as the World Health Organisation and NHS. Several platforms have suggested that AI-based solutions are imperfect for addressing mis/disinformation as they lack the context of a human operator, but have nevertheless implemented automated content moderation to cope with higher demand and lower availability of their moderation workforce. Some platforms such as Facebook have openly acknowledged that this may lead to some legitimate content being incorrectly flagged as misleading or taken down.
39. Major theme: Bias in algorithmic decision-making
39.1 Overview
Algorithmic decision-making tools (ADMTs) are increasingly being trialled throughout the health and social care system. In health, they may be used as part of the diagnostic process, or to help medical professionals decide what combinations of treatment to recommend to a patient.
In social care, they may help identify service users at particular risk of harm. While the harms caused by bias in the latter setting is similar to the harms presented in other contexts such as justice and finance, the use of ADMTs for health-related decisions (e.g. diagnosis) can differ in that the inclusion of sensitive personal data such as ethnicity may be very important for achieving positive health outcomes for patients.
39.2 Key Messages
-
While the level of governance for ADMTs is similar in health to what is prescribed in other sectors, it is less mature than the governance used in other aspects of healthcare (e.g. for medical trials, medical devices, clinical safety etc).
-
ADMTs used in healthcare need to be trained on data that is representative of the populations they are applied to. This is because health conditions can manifest differently across demographic groups. There are, however, a range of challenges to obtaining data of sufficient relevance and quality in healthcare, and ensuring that those procuring ADMTs are able to make informed judgements about which trained systems to choose.
39.3 Governance
-
There is no centralised responsibility for governance of bias in health ADMTs. Some standards exist (such as the Data Quality Maturity Index) but are voluntary. Universal laws such as the Human Rights Act and the Equality Act may offer a degree of oversight. However, they tend to be applied too far downstream in the process of developing and deploying ADMTs to meaningfully address bias, often once products are reaching or deployed to a market.
-
There are no requirements to publicly report or publish details of healthcare algorithm development. Developers are not required to disclose key information about how systems are trained, for example the size, diversity, and provenance of their training datasets. While this level of rigour is apparent in much academic research, commercial organisations are not incentivised to test their systems under peer review, although some have begun to do so recently to enable their scientists to publish their work openly. Some of our panellists suggested that minimal standards could be introduced via a ‘consensus statement’ model, which would include the background and composition of the population used to train systems. This could permit procurement officials to undertake a quick assessment of a system’s suitability for its target population.
-
Compliance concerns around GDPR may have caused some health bodies such as NHS trusts to become more risk averse in sharing data for innovation, meaning some developers may have switched their focus to health data and deployment contexts elsewhere in the world.
39.4 Drivers
-
Mismatch between training and deployment populations. Data used to build and train ADMTs occasionally comes from non-UK populations; for example, a West Midlands ADMT trial for radiology scans was primarily trained on Hungarian populations, which may not be representative of UK patients. The same issue can arise through data selection: cancer treatment research trials at major pharmaceutical companies often have overwhelmingly white participants. By contrast, DeepMind’s work with Moorfields Eye Hospital drew on a large and diverse UK population for the training of an eye disease detection algorithm.
-
Data availability. In some cases, data cannot or is not labelled at the point of collection. This could mean, for example, that ethnicity is not logged during scanning procedures. A further challenge is posed when individuals withdraw their consent to data use, which can affect algorithmic accuracy for already underrepresented populations. The availability of datasets can determine which healthcare products get built and for whom. For example, in the US, the military has an extensive dataset on military veterans, with data collected about them on a regular basis from the point they join the army to the time of their death. This rich dataset enables and encourages healthcare companies to develop healthcare tools that support demographic groups most represented within the army.
-
Devolved health and care systems. Fragmentation in the commissioning and delivery of health and care services means that best practice is developed independently. This can make it more difficult to form standards for technology procurement, trialling and deployment, including for ADMT trials.
-
No clear ‘ground truth’ in some medical contexts. Existing ‘expert-driven’ models also contain bias. For example, doctors don’t always agree on a diagnosis, which itself can vary by factors such as time of day, making it difficult to establish a baseline from which bias is considered to deviate.
-
Commercial confidentiality decreases accountability. Some of the key technologies being deployed in healthcare are not publicly owned, which diminishes accountability. It can be difficult to know whether bias has been addressed in privately owned ADMTs. Panellists cited this as a live concern for products already on the market.
40. Major theme: Underuse in Social Care
40.1 Overview
Health and social care are interdependent systems that must work closely together to deliver effective treatment and support for service users. Digital maturity and data-sharing infrastructure is however far less developed in social care, depriving institutions and ultimately service users of the benefits of greater data use.
40.2 Key messages
-
Despite the close connection between health and social care services, there is a disparity in data quality and availability between the two systems. The extent of AI and data use in social care is therefore comparatively limited.
-
Most applications of AI and data-driven technology in social care are focused on care beneficiaries. Example innovations include in-home remote monitoring, support delivered through voice assistants, and automated acoustic monitoring (e.g. of patient wakefulness) to allow more responsive care in residences. System-level AI applications and advanced data analytics, such as those used to support public health planning for COVID-19, are typically unviable in social care because of data availability and quality.
-
The introduction of integrated care systems brings together hospitals, GP practices, community services and social care services within local areas to jointly plan for the needs of their community. The difference in data availability, use of and adherence to standards, as well as data quality between health care and social care is likely to cause issues as the two systems seek to become increasingly integrated.
-
Better data quality and availability in social care could deliver considerable benefits for the sector. For example, it could improve our understanding of provider market stability (e.g. by allowing entrances and exits made through often complex ownership structures to be tracked); help to predict risk of failure among providers; enhance understanding and planning of the social care workforce; and enable better system-level planning and procurement (e.g. by allowing formal measures such as the average cost of care to be standardised).
40.3 State of the Art: Improving data infrastructure in social care
-
Future Care Capital’s Data That Cares report highlights the potential for generating system-level insights about the social care system, and draws attention to the limitations of existing datasets. It proposes the introduction of a formal digital duty of care applicable to public bodies responsible for the commissioning, provision, monitoring, and/or regulation of social care services. This would aim to incentivise the collection and sharing of data that could drive innovative applications of data-driven technology.
-
Doteveryone have published a series of papers looking at the impact of technology and data use in the social care system, the gaps in evidence and data available, and what the future of care could look like.
-
The Health Foundation recently launched the Data Analytics for Better Health programme that examines how better data analytics can improve outcomes across health and social care.
40.4 Drivers
-
Lack of provider incentives to collect, store, or share data. Providers are under few obligations to collect information on their services or service users beyond that required for regulation, meaning those planning and commissioning services at the system level struggle to obtain data that enables monitoring of how well the system is functioning, and estimate supply and demand for services. Low provider profit margins further disincentivise investment in improving digital and data-gathering infrastructure.
-
Highly distributed provider marketplace. The social care provider market is highly fragmented, with tens of thousands of different providers, making the collection of high-quality, comparable data challenging. Even relatively simple information on data maturity, such as the extent of the workforce with data science skills is not routinely collected (unlike in healthcare).
-
Lack of centralised ‘ownership’ of social care data collation. While a variety of bodies (eg providers, commissioners, and regulators) collect some data about the social care system, there is no centralised public body incentivised and empowered to collect data on social care systematically, with the objective of improving the system overall.
-
Data capture at the frontline of care provision is difficult. Capturing good quality data about the care people receive can be challenging, and is further exacerbated by relatively low digital skills among the social care workforce.
-
Low momentum for innovation. Data maturity is so low that the potential benefits of better data use can seem impractical, and new AI and data-driven applications hard to imagine. There is a negative feedback loop between the availability of good quality data and systemic incentives for greater research and use of social care data.
41. Digital & Social Media
41.1 Overview
41.2 Scope
This sectoral analysis looks at the use of AI and data in the provision of online content and services, including that channelled through social media platforms, websites and search engine results.
41.3 How is data-driven technology and AI used in digital and social media?
-
Tracking and profiling users to power targeted advertising. Data-driven technologies are used to identify users and their devices, build up inferences about them based on the way they engage with content, and provide targeted advertising based on that profiling.
-
Driving search and recommendations. Search engines rely on finely-tuned algorithms to provide users with relevant results, as do music and video recommendation systems on content platforms.
-
Online content moderation. Platforms like YouTube and Facebook increasingly use algorithms to flag inappropriate, misleading or unauthorised images, videos, and written content, and to make decisions about whether to take this content down or make it less prominent.
-
Facial recognition. Some social media platforms like Facebook encourage users to opt-in to facial recognition, enabling features such as automated photo tagging, and allowing the platform to track where and with whom users are in photos with.
41.4 Key messages
-
The use of AI and algorithmic systems is widespread in this sector, and platforms have created and aggregated huge datasets that can be used to generate increasingly sophisticated inferences and insights about people. These datasets have enormous potential value beyond the contexts they are collected in, as recently demonstrated during the COVID-19 pandemic, where platform data has been used to understand population movements, although the concentration of data within a small number of organisations creates system and market risks.
-
The risks of using data and AI in this sector can be difficult to judge, in part because they relate to novel phenomena that research communities are only beginning to investigate. For example, experts disagree on the impact that concentration of market power among major technology platforms has, given that most services they provide are free. The long-term impact of micro-targeting on platform users is also a point of contention, with limited information about its effects on autonomy. New governance models and more research may be needed to better understand and evaluate risks in this sector.
-
The risks associated with AI and data use in this sector are unlikely to be better understood or addressed without greater transparency, both for regulators and individuals. For example, increased access to platform data for regulators and researchers would help to improve our understanding of how risks and harms arise, and which to prioritise. However, new governance approaches will need careful design to avoid discouraging new entrants to the market and therefore perpetuating existing concentrations of market power in major platforms.
42. Digital and Social Media: Opportunities
42.1 Overview
-
The data collected across digital and social media can be powerfully deployed in other sectors. While many significant risks in this sector relate to the lack of transparency in the large-scale collection, storage and use of data by a small set of market actors, our panel also highlighted the benefits of large standardised datasets. They could be used, for example, to build new products and services in the finance and energy industries, or to enable predictive analytics to improve public health.
-
Similarly, AI and algorithmic systems can enable platforms to foster trusted interactions between strangers, such as through online marketplaces and communities, and can help internet users access new, relevant content, allowing for more informed decisions and creating benefits across other sectors.
-
In particular, our panel highlighted the value of social media data in powering ground-breaking research with significant public benefits, for example, learning more about how young people talk about mental health. This value is counterbalanced by the privacy implications of sharing such data (particularly sensitive personal data), including the challenge of effectively anonymising data (e.g. location history), the ethical concerns of using data-driven inferences to ‘nudge’ user behaviours, and gaps between how and why data is shared, and how it is then used.
-
AI systems have the potential to address prominent online harms, for example by limiting the spread of misinformation or identifying vulnerable users. However, these beneficial applications of AI were seen by many of our expert panel as particularly difficult to achieve because of inherent trade-offs with people’s rights to free speech and autonomy.
42.2 State of the Art: Slowing the spread of COVID-19
Data collected by major digital platforms has been used to help inform efforts to combat the spread of COVID-19. For example, Facebook’s Data for Good programme has made geospatial data available to help public authorities understand patterns of movement among the population to monitor people’s adherence to lockdown measures. The data is only available to approved researchers, and is anonymised and aggregated to reduce the impact of the data sharing on user privacy. Similarly, Google has decided to publish a series of aggregated community mobility reports that list changes in mobility across different land uses (eg parks and transport hubs) to a sub-regional level.
Publicly available data such as social media posts have also been used to predict COVID-19 outbreaks. For example, Dataminr has used public posts referencing the virus, exposure, symptoms, and supply shortages to predict imminent COVID-19 outbreak hotspots across several US states up to seven days in advance, and works with the public sector to help anticipate and prepare for spikes of cases.
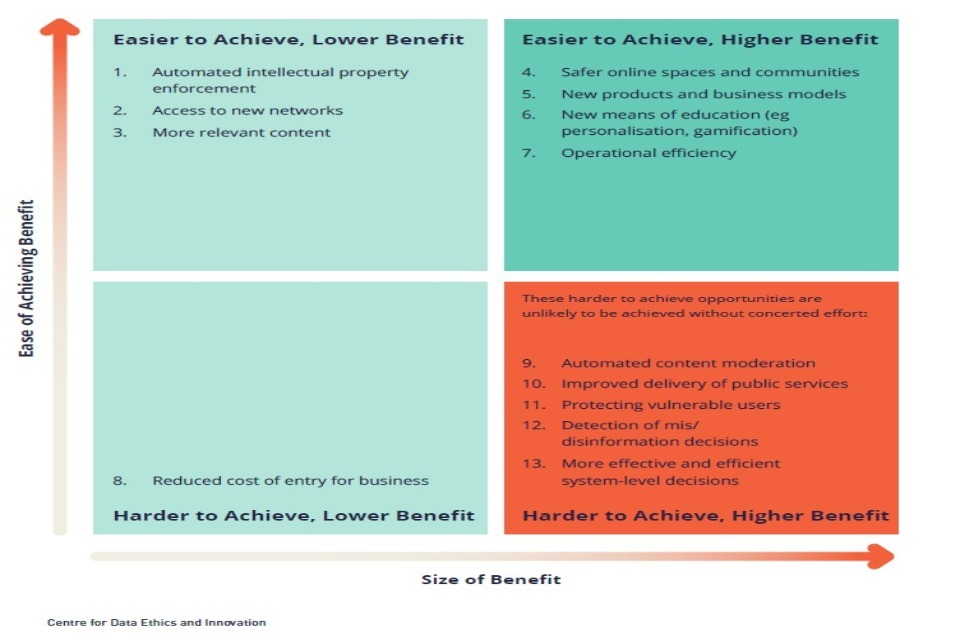
Digital & Social Media - Opportunities Quadrant
This quadrant is based on panel discussion of major AI opportunities within the Digital & Social Media sector over the next three years. This diagram is not exhaustive and reflects a review of existing policy literature, workshop discussion, further socialising and additional research and analysis. See methodology for further detail.
42.3 Digital & Social Media: Opportunity Descriptions
-
Automated IP enforcement: Use of data AI help automate the identification, and enforcement, of products, services and content which is in breach of IP law.
-
Access to new networks: Use of personal information to tailor online content and services helps connect individuals (eg people who have rare diseases or who have difficulties engaging socially) to new networks and opportunities which they would not otherwise have access to.
-
More relevant content: Use of personal information, to tailor online content and services means internet users have convenient access to more relevant, safe and diverse products, services and information, and are able to discover new educational and cultural content.
-
Safer online spaces for communities and groups: Social media platforms, powered by algorithms and new data sources, can offer safe spaces for groups to connect and to explore identities.
-
New products and business models: Increased collection and analysis of personal data lead to innovative new business models and markets, including across other sectors.
-
New means of education and engagement: The use of algorithms and data personalises education online, so that educational content is tailored to suit people’s individual learning styles; and new approaches, such as gamification strategies, collaborative problem solving and VR, enable greater engagement.
-
Operational efficiency: Use of personal information to tailor content and services enables firms to increase their customer base, increase productivity, identify new business opportunities and boost profit.
-
Reduced cost of entry for business: Social media and online marketplaces lower the cost of entering new markets, particularly for smaller businesses.
-
Automated content moderation: Use of data-driven technologies help identify different types of content and automate appropriate moderation approaches.
-
Improved delivery of public services: Use of data and AI increases access and enables more effective online delivery of services with public value.
-
Protecting vulnerable users: Use of AI and data can help identify vulnerable people, enabling the targeting of support.
- Detection of mis/disinformation: Use of data and AI helps detect false content at scale, including doctored political speeches, false pornographic content and scams.
- More effective and efficient system-level decisions: Use of personal information to tailor online content and services means internet users have convenient access to more relevant, safe and diverse products, services and information and are able to discover new educational and cultural content.
43. Digital and Social Media: Risks
43.1 Overview
-
The most serious risks in this sector relate to the behavioural effects of AI on personal autonomy (eg addictive design and exploitative targeting), and the resulting effects on public discourse. These include the impact of AI-enabled political targeting on fair democratic debate and the spread of mis/disinformation. Our panel were also concerned that AI and data-driven technology could lead to market imbalances, as large firms use the technology to help entrench their positions.
-
The risks of using data and AI in this sector can be difficult to judge, making it difficult to design effective governance responses. For example, the impact of micro-targeted content on people’s autonomy or on fair democratic debate is difficult to quantify and measure. Similarly, traditional competition governance models can struggle to achieve healthy market outcomes when many products and services are provided for free.
-
Information asymmetries between major platforms and regulators are particularly prominent in this sector. Addressing the risks posed by AI and data-driven technology is likely to require greater transparency from platforms, and greater access to platform data for independent researchers (e.g. to establish how particular design elements may drive addictive behaviour). As in other sectors, panellists noted that regulators may struggle to attract and retain staff with AI and data skillsets, further compounding governance challenges.
43.2 Top Risks at a Glance
| Most Likely | **Most Impactful ** | Combined LLikelihood and Impact |
| 1. Market power of platforms | 1. Political micro-targeting | 1. Political micro-targeting |
| 2. Regulator resourcing | 2. Behavioural manipulation | 2. Market power of platforms |
| 3. Political micro-targeting | 3. Mis/disinformation | 3. Mis/disinformation |
| 4. Transparency of data use | 4. Cyberattacks | 4. Behavioural manipulation |
| 5. Mis/disinformation | 5. Undermining democratic debate | 5. Regulator resourcing |
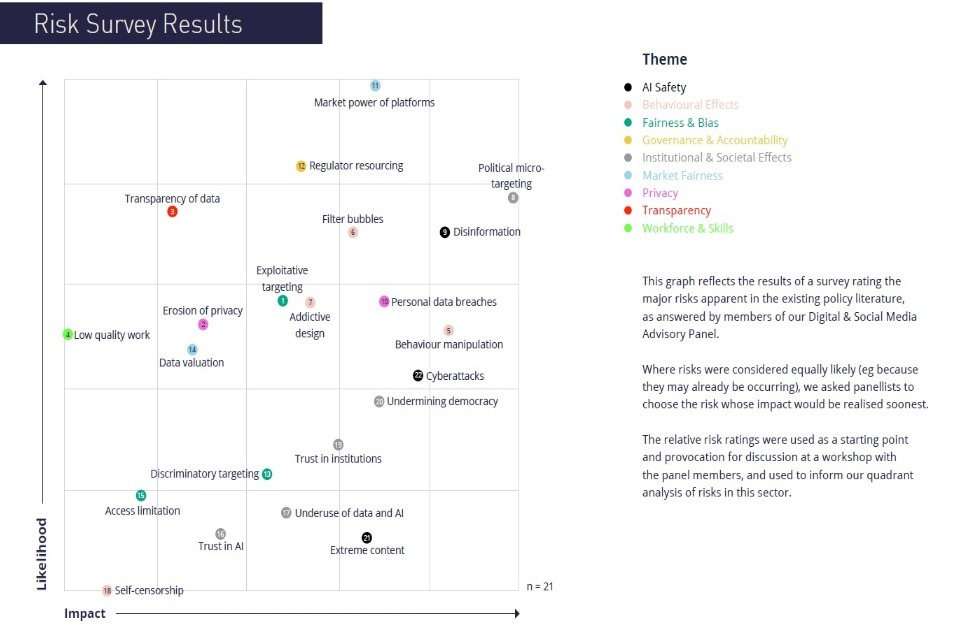
Digital & Social Media - Risk Survey Results
This graph reflects the results of a survey rating the major risks apparent in the existing policy literature, as answered by members of our Digital & Social Media Advisory Panel. Where risks were considered equally likely (e.g. because they may already be occurring), we asked panellists to choose the risk whose impact would be realised soonest. The relative risk ratings were used as a starting point and provocation for discussion at a workshop with the panel members, and used to inform our quadrant analysis of risks in this sector.
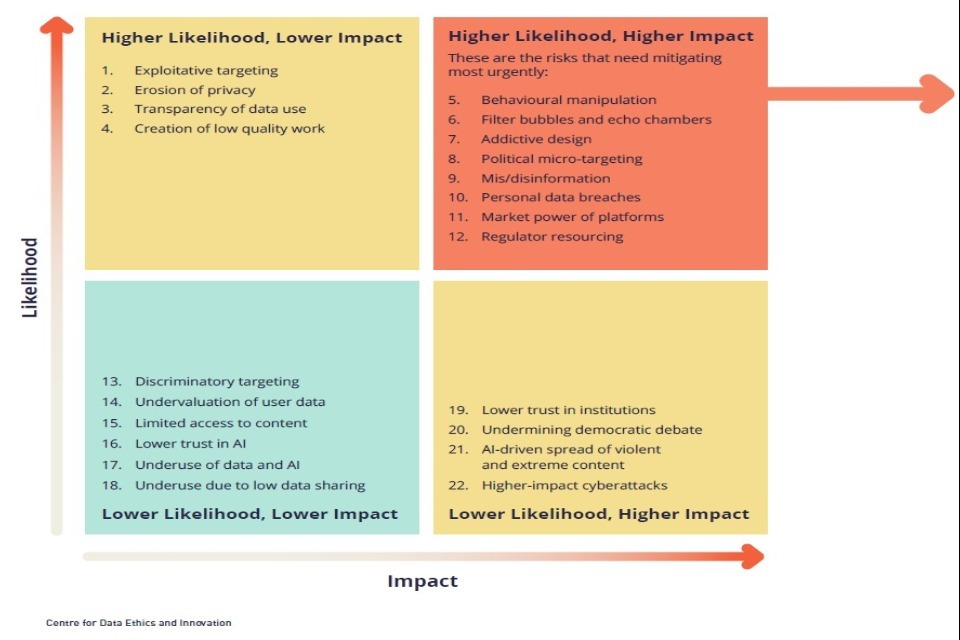
Digital & Social Media - Risk Quadrant
Top themes in Digital & Social Media Risks: Behavioural Effects of AI; Privacy; Market Fairness
This quadrant is based on a panel survey rating the major risks in the Digital & Social Media sector over the next three years. This diagram is not exhaustive and reflects a review of existing policy literature, workshop discussion, further socialising and additional research and analysis. See our methodology for further detail.
43.3 Digital and Social Media: Risk Descriptions
-
Exploitative targeting: Personal information is used to target content, services and adverts at vulnerable people, or exploit people’s vulnerabilities, against their interests or which encourage addictive or harmful behaviours (e.g. serving gambling adverts to gamblng addicts).
-
Erosion of privacy: The increase of online provision of services means that individuals have to share data about them in order to access such services, affecting their privacy and enables the possibility that some groups will be disadvantaged (e.g. privacy as a luxury).
-
Lack of transparency about how data is being collected and used: Individuals are not always aware that their personal information has been collected and used to tailor the content, services and adverts they view, preventing them from making informed decisions about how data is shared and infringing on their privacy.
-
Creation of low quality work: The need to train algorithms and assess the content they generate leads to an expansion in low quality ‘click work’ (e.g. data labelling and content moderation), which is monotonous and occasionally distressing.
-
Behavioural manipulation: Personal information is used to tailor online content, services and adverts in a way that undermines personal autonomy through manipulation of behaviour, values, or beliefs.
-
Filter bubbles and echo chambers: News feeds and search engine results provide narrow and personalised content to individuals, entrenching and polarising opinions, and possibly siloing people and groups.
-
Addictive design: Use of personal data and AI enables digital services to design highly engaging platforms and content which encourage users to spend more time online and engage in addictive behaviours.
-
Political micro-targeting: Lack of transparency in the use of AI to target political adverts online undermines open and free political debate (e.g. issues opacity of funding or misleading claims)
-
Creation and dissemination of mis/disinformation: Use of AI and data allows for the creation and distribution of false content at scale, e.g. doctored political speeches, deepfake pornograpic content and anti-vaccination propaganda.
-
Data breaches involving personal data: Increasing generation and collection of personal and sensitive data increases the severity of potential data breaches, increasing the risk of identity fraud and threats to people’s privacy.
-
Market power of platforms: The volume of data held by large technology firms gives them an unparalleled advantage in targeting their content and services and in research & development, making it difficult for smaller and newer firms to compete. Their dominant position may also discourage innovation given the barriers to entry in their markets.
-
Regulator resourcing: Regulators lack the resources, expertise or technical understanding needed to effectively regulate the use of AI and data in the sector.
-
Discriminatory targeting: Digital services tailor content and services based on the characteristics of internet users (e.g. their gender, sexuality, age or health status), which deliberately or unintentionally results in discrimination against individuals and groups (e.g. targeting job adverts only at men).
-
Undervaluation of user data: Digital service users are unable to value the data they share in exchange for content and services, preventing them from making informed decisions and assess what constitutes a fair or reasonable exchange.
-
Limited access to content, products and services: Advertisers, search engines, e-commerce sites, and media sites use personal data to target internet users, which prevents them from viewing content and services that may be in their interests.
-
Lower trust in AI: The controversial deployment of AI and data use in the provision of online services and content increases the public’s concern about how these technologies are used in other sectors, undermining their application across other sectors and services.
-
Underuse of data and AI: Restrictions on the use of personal data and AI leads to society missing out on system-wide benefits, such as opportunities for innovation, including new services, content and business models
-
Underuse due to low data sharing and self-censorship: Concerns among digital service users about how their personal information is used and their lack of control discourages them from sharing their data, resulting in lower quality content and services (e.g. less relevant adverts and search engine results).
-
Loss of public confidence in institutions: Concerns about the accuracy and impartiality of AI and data use in the provision of online services and content undermines public trust in established institutions and authorities (e.g. media or academia)
-
Undermining open and democratic public debate: Use of AI and data means that content related to important social movements or events is presented to fewer people and is less likely to be openly debated.
-
AI-driven spread of violent and extreme content: Use of AI (e.g. recommendation algorithms) contributes to the dissemination of content which could be harmful or distressing to individuals, or which propagates and funds ideas harmful to society, such as extremist or violent content.
-
Higher-impact cyberattacks: Increased use of data and AI raises risk and impact of cyberattacks which may cause changes in system functionality, loss of system availability, or data breaches.
44. Major theme: Manipulation and Political Micro-targeting
44.1 Overview
Data is increasingly used to make inferences about individuals and populations, which can in turn be used to tailor and target content to change their behaviour. This can result in small effects (e.g. altering people’s purchasing decisions) and large ones (e.g. swaying public opinion). While there are long established norms about how advertising and campaigning should be conducted, the advent and commoditisation of online targeting raises fresh questions about what counts as a legitimate practice. Two particular areas of concern are:
-
Manipulation of behaviour, values, and beliefs, where personal information is used to tailor online content, services and adverts in such a way that may undermine people’s autonomy, with a range of tangible consequences for their lives.
-
Political targeting, where a lack of transparency risks undermining free and fair political discourse.
44.2 Key Messages
-
Distinguishing between legitimate persuasion and unwarranted manipulation has always been difficult. Online targeting, however, presents novel challenges due to the volume of personal data available for profiling, the ability to iteratively tailor content to individuals with a level of specificity not previously possible, its ubiquitous scale, and the lack of transparency that often characterises how the underlying data is collected and used.
-
Identifying and evidencing the precise harms that occur as a result of manipulation can be challenging. Potential harms may be tangible (e.g. measureable in purchasing behaviour), but may also be abstract and hard to evidence (e.g. undermining democratic debate), making it more difficult to design good governance responses.
-
Vulnerable internet users are particularly at risk, which may include children, young adults, people suffering from addiction, and older people. Children are often disproportionately affected as they may be less aware of manipulation occurring. However, vulnerability can be difficult to define as it is sometimes a transient state or context dependent, for example as can occur with chronic illness.
-
The mere perception of manipulation could itself give rise to harms, even if no manipulation occurs. For example, the perception of unwarranted political targeting may lower people’s trust in democratic institutions, without such targeting actually occurring, or without it affecting individuals’ decisions.
44.3 Drivers
-
A lack of transparency around what data is being collected, the inferences being made from it, and how it is being used, leading to information asymmetries between online platforms and both individuals and regulators.
-
An inability to translate ‘analogue’ regulation to digital contexts. While there are robust guidelines for advertising and campaigning in offline settings, these are not always equipped to govern the novel risks posed by online targeting practices. For example, electoral broadcasting laws designed for television do not translate neatly into the digital world, in part because of the range of actors distributing political messaging online.
-
The commoditisation of micro-targeting. Social media advertising systems allow almost any business to target content to fine-grained audiences, meaning the volume of adverts and advertisers continues to grow, presenting new governance challenges for systems designed for far fewer market actors or simpler marketplaces.
45. Major theme: Manipulation and Political Targeting
45.1 State of the Art: The Public Perspective
In December 2019, the CDEI commissioned Ipsos MORI to conduct an online poll of 2,200 UK adults, in which we questioned people’s attitudes towards online targeting. Our survey revealed that the public are marginally more likely to think that online targeted adverts have a positive rather than a negative impact on purchasing decisions (e.g. by helping them make more informed decisions). By contrast, more of the public appear to be concerned about political adverts than would welcome them, with 40% believing they will have a negative impact on general elections. Many also believe that targeting has no impact at all on purchasing decisions or general elections.
These perspectives vary considerably across age groups. For purchasing decisions, there is a clear trend between age and perception, with older groups more likely to view online targeting as having a negative effect. For political advertising, however, the pattern is less clear-cut, with only the 18-24 year old group displaying a net positive perception of online targeting. This in part may reflect that more people in older groups believe that targeting does not make a difference to these kinds of decisions.
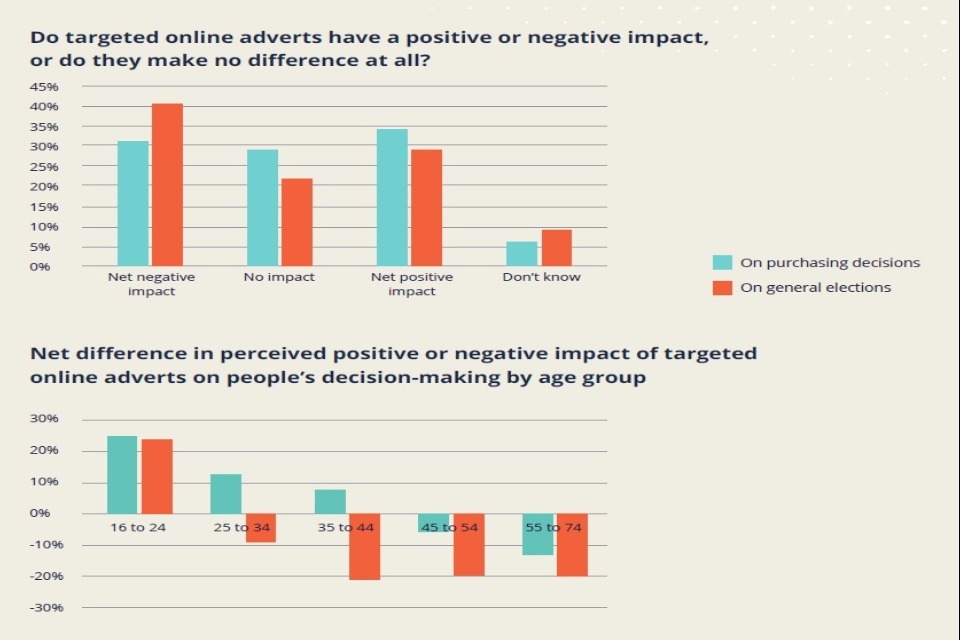
Major Theme - Manipulation and Political Targeting (Polling Graph)
The first graph asks: do targeted online adverts have a positive or negative impact, or do they make no difference at all? The answers range from net negative impact, no impact, net positive impact to don’t know, and the categories being considered are on purchasing decisions (blue) and on general elections (red). The second graph shows the net difference in perceived positive or negative impact of targeted online adverts on people’s decision-making by age group. Source: CDEI/Ipsos polling, December 2019 (n=~2200)
46. Major theme: Manipulation & Political Micro-targeting
46.1 Governance
CDEI Review of Online Targeting and the Online Harms White Paper
The government’s Online Harms White Paper sets out proposals for a new regulatory framework and independent regulator for online safety, in response to a perception that industry has been slow to self-regulate. It identifies a range of current and potential harms resulting from online targeting, and proposes that companies adopt a new duty of care that would hold them accountable for safeguarding their users. The Digital Markets Taskforce is conducting related work, examining how the government can encourage competitive digital markets that empower consumers, innovators and small businesses.
The CDEI Review of Online Targeting takes an in-depth look at the nature and impact of online targeting, particularly as it affects individual autonomy and vulnerability, democracy and society, and discrimination. The report provides three sets of recommendations to minimise the risks of online targeting while ensuring that its benefits can be realised.
- Accountability: The government’s new online harms regulator should be required to provide regulatory oversight of targeting, encompassing all types of targeting content, including advertising. The regulator should require online platforms to assess and explain the impacts of their systems, and empower independent experts to undertake secure audits of platform data.
• Transparency: Platforms should be required to host publicly accessible archives for political adverts, job, credit and housing adverts, and adverts for age-restricted products. Platforms should be further required to give independent researchers secure access to their data where it is of significant potential importance to public policy.
• User empowerment: Regulation should encourage platforms to give people more information and control about how they are targeted with content. Paid-for political content should be made easy to identify, with platform users clearly notified when adverts have been targeted at them.
47. Major theme: Market Power of Platforms
47.1 Overview
The volume of data held by the largest technology firms gives them an unparalleled advantage in targeting their content and services as well as powering internal research and development.
The collection of large standardised datasets can create efficiencies in services (e.g. allowing for more accurate search engine results) and provide benefits to other sectors that can apply such data for their own purposes (e.g. using social media data to predict outbreaks of COVID-19). Yet it may also be damaging in the long run for online platforms to hold such a wealth of data, for example by creating unfair markets or problematic concentrations of non-market power.
47.2 Drivers
-
Platform users do not always know the value of their personal data, nor that the exchange of this data and attention is the reason why digital services are ‘free’ to use. The absence of good models for estimating the value of data as a commercial asset, as well as the fact that the value of such data is often only realised when aggregated, makes it hard for consumers to understand what represents a fair exchange.
-
The accumulation of data within platforms (e.g. messages, photos and personal connections) can make it difficult for consumers to switch to alternatives, and to do so on an informed basis. This contrasts with other services such as energy and utility supply, where suppliers are required to make switching easy for consumers.
-
Network effects mean that big platforms benefit from positive feedback loops. For example, social media platforms and search engines become more useful as more people engage with them, which in turn attracts new users. This helps to create ‘winner takes most’ markets, where a handful of data-rich platforms dominate.
-
Online platforms can use the data at their disposal to give them an immediate foothold in new markets. Several tech firms have already capitalised on their data, algorithmic, and computational assets to enter new sectors, including within finance and healthcare.
Case Study: Platform power and online targeting
The CDEI Review of Online Targeting notes the connection between online targeting and the market power of social media platforms. The market position of major platforms allows them to deliver targeted advertising and sales effectively and at considerable scale, further cementing their position. While consumers can benefit from this trend, in the long run it means that only the platforms which rely on heavy forms of content targeting can survive, which in turn limits consumer choice.
In its December 2019 interim report on online platforms and digital marketing, the Competition and Markets Authority (CMA) found that most users fall back on default privacy settings, which provide platforms with more data than the users would expect and prefer.
47.3 Governance
-
Many of the challenges associated with market power are not restricted to any one geographical area or legal jurisdiction, but play out across a larger geopolitical context. International collaboration is therefore critical to implementing effective governance responses, although coordinating at speed and scale is a challenge.
-
Digital service governance models need to work for different business types. Those seeking to strengthen the governance of digital services will need to be wary of inadvertently curtailing new products, services and businesses, and avoid unduly advantaging existing large actors by creating barriers to new market entrants.
-
Our panellists highlighted a number of regulatory approaches that could begin to address imbalances in market power, including improved transparency requirements, bespoke competition governance for digital services, and the creation and enforcement of data portability and interoperability standards.
47.4 State of the Art: Improving data portability
The CDEI will shortly be publishing a report on how to maximise ethical data sharing, including measures that would help give users greater data portability.
Case Study: Platform Income Dependence
-
The market power of platforms affects businesses as well as individuals. While having an online presence has become a substantial benefit or even necessity for many businesses, new entrants are increasingly relying on a small number of available platforms, such as Amazon, Etsy or Instagram, to achieve visibility and deliver their services. News media organisations are also particularly reliant on the prominence their content receives on aggregation platforms and search engines, which directly drives their income via advertising revenue.
-
The phenomenon of ‘platform-dependent entrepreneurs’ has been documented in academia, and their dependence on algorithmic decisions may be further exacerbated by the increased use of automated content and marketplace moderation following the COVID-19 crisis.
-
Change to terms and conditions, including the nature of automated decisions, can have substantial implications for businesses, particularly given the lack of comparable alternative platforms. For example, YouTube has at least 40,000 full time content creators, whose income is heavily dependent on the prominence their content is given by search and recommendation algorithms.
-
Similarly, sellers that use online marketplaces or search engines rely on their offers being visible in search results, and some platforms such as Amazon offer paid services to theoretically achieve greater prominence. Content on video platforms can also be ‘demonetised’ by removing advertising revenue from content creators, with little notice or explanation.
48. Major theme: Addictive design
48.1 Overview
Digital platforms tailor their services with the aim of keeping users logged on for as long and frequently as possible. The use of autoplay videos, infinite scrolling, push notifications, ‘dark patterns’, encouraged reciprocity, and ‘variable rewards’ for users are examples of ‘persuasive design’ approaches that may lead to addictive behaviour, particularly when deployed in combination. These designs are often underpinned by algorithms and user data, which can learn the content individual users are most likely to engage with, and present it in ways that they are most likely to continue engaging with. Such techniques may cause excessive use of digital platforms, with potential mental health impacts, and magnify the risk of other harms.
-
Addictive design is a broad concept and difficult to define, as it is highly subjective and context dependent. The most problematic practices are easier to identify, for example, when apps and services are targeted at children so as to encourage them to spend long periods of time in front of screens. However, many popular features can simultaneously be beneficial for users, such as when recommended content is auto-played, while leading to excessive use.
-
Beyond the immediate potential harms that addictive behaviours can cause (e.g. on users’ mental health), excessive use of digital and social media platforms can exacerbate other data-driven harms. These can play out at an individual level (e.g. addictive design that exposes vulnerable users to more exploitative targeting) and at the system level (e.g. addictive design that entrenches a platform’s market power by decreasing the likelihood users will want to switch to alternatives).
Case Study: Variable Rewards
-
One of the most pervasive examples of algorithmically-driven addictive design is the implementation of ‘variable interval reward schedules’. This entails users of social media platforms only being shown content they are likely to particularly enjoy (the ‘reward’) after an uncertain period of time spent on the platform (e.g. scrolling down a news feed). This concept, borrowed from behavioural science, is also often implemented in gambling contexts, such as slot machines, for its proven capability to keep consumers engaged.
-
Platforms use algorithms to automatically tailor these intervals to individual users, automatically adjusting the time between rewards and the anticipated relevance of the content to maximise the likelihood the user will continue to spend time on the platform.
-
Similar algorithmic techniques can be used to encourage disengaged users to continue using an app or service. If a user has not engaged for a period of time, some social media platforms will automatically increase the exposure of that user’s posted content (e.g. the number of times it is viewed by other users) to elicit responses (e.g. ‘likes’), that are then pushed to the disengaged user via notification as fresh ‘reward signals’.
48.2 Drivers
-
Scale. Persuasive design is not a new concept, having been used in advertising and traditional media platforms such as television for many years. However, the advent of mass internet availability and online platform use means it is now being used on a scale never seen before. These design approaches are most commonly associated with social media and mobile gaming in a digital context, but they can be found in many other settings, for example on news sites and dating apps.
-
Increased access to data and measurability of effects. Platforms have more data about their users, including data that captures more patterns of behaviour. This makes it easier to predict user responses to behavioural design, and therefore to design effective app and platform features for specific groups of users or individuals. New techniques can be easily tested on groups of users, often with clear before-and-after impact data, which can be used to measure the effectiveness of a new design. Compared to print media or television, digital media platforms (and particularly social media) can more accurately estimate the value of each user and their propensity to make purchases or engage with promoted content.
-
Little applicable governance. As with many online harms related to autonomy, ‘addictive design’ can be difficult to precisely define and identify, particularly as it may be context dependent. With the precise risk of harm or actual impact being difficult to quantify, regulation of such practices is challenging. Currently in the UK and globally there are few measures to regulate addictive design for digital platforms.
48.3 Governance
-
Presently almost all governance of ‘behavioural design’ occurs through self-regulation implemented by platforms, with the emphasis on the user to regulate their own engagement. For example, Facebook, Instagram and Youtube all have features allowing individuals to monitor and set time limits on usage, as do mobile operating systems such as iOS and Android. Yet the benefit of these measures is contested. For example, the introduction of ‘you’re all caught up’ features on some platforms could be seen either as a way of encouraging users to stop using a platform once they have no new content to browse, or as an encouragement to stay engaged until a user is ‘all caught up’, which may be heavily dependent on the volume of content they follow on a given platform.
-
Efforts at broad regulation in other jurisdictions have been problematic. A Bill to reduce ‘social media addiction’ was unsuccessfully introduced to the US Senate in 2019, proposing wide-reaching measures including a ban on autoplay and infinite scroll features, and enforced limitation of social media use to 30 minutes per day per platform. The Bill failed to gain support in part because of the lack of evidence that the measures would successfully address problems that are not yet well understood.
-
While excessive use of digital and social media platforms correlates with increased exposure to harms (e.g. bullying), the precise nature of these relationships and the scale of the impact is unclear and often contested. A robust evidence base will be required to make informed and proportionate governance responses, and is likely to involve better research on the impacts of behavioural design, within varying contexts and relative to the benefits they provide.
49. Energy and Utilities
49.1 Overview
49.2 Scope
The scope of our sectoral analysis covers the use of AI and data-driven technology in the generation and supply of energy and other utilities, as well as the maintenance of infrastructure and new devices such as smart meters.
49.3 How is AI and data-driven technology used in energy and utilities?
The main applications of AI and data-driven technology in the energy and utilities sector include:
-
Predicting maintenance and replacement needs of generation systems and distribution networks.
-
Detecting faults and errors in generation systems and distribution networks (e.g. pipe leaks).
-
Balancing energy network loads.
-
Using robotics to improve workforce safety in hazardous environments.
-
Automating power supplies and cooling (e.g. in data centres) to maximise energy efficiency.
-
Predicting demand (e.g. to enable responsive energy generation, or to drive supplier-level purchasing decisions).
-
Understanding consumer behaviour to drive product design and consumer advice.
49.4 Key Messages
-
AI and data-driven technology could generate significant benefits for the energy and utilities sector. Indeed, our panel saw the underuse of technology as a significant risk – one that could deprive households of cheaper energy and utilities, and hamper efforts to reduce emissions and improve sustainable use of scarce resources.
-
However, the sector has only begun to realise the potential of this technology, with AI and data-driven innovation still nascent following the relatively recent introduction of smart into UK homes. Panellists also expressed concern that data is not being shared in a way that will spur innovation, both across government (e.g. combining energy use and buildings data to better understand fuel poverty) and between suppliers - although some research programmes work with what data is presently available (e.g. the Open Energy Modelling Initiative). Energy firms, in particular, may fear losing competitive advantage by sharing data.
-
Securing public trust is a prerequisite for innovation. Without trust, consumers will be less likely to want to adopt technology, while energy and utilities firms will remain wary of engaging in programmes that involve new forms of data collection and use. One way of building trust is to better articulate the benefits of AI and data use to consumers, for example by showing how greater data collection in households could pave the way for lower energy bills and improved environmental outcomes.
50. Energy and Utilities: Opportunities
50.1 Overview
-
Systemic improvements to the functioning of the energy systems (e.g. cleaner or more efficient energy generation) were seen as among the most significant potential benefits of AI and data use, particularly for the onward public benefits they could generate, such as achieving decarbonisation targets and addressing fuel poverty.
-
Panellists believed that significant gains could be made from combining sectoral datasets (e.g. from smart meters) with non-sectoral data (e.g. geographic data on infrastructure distribution) in order to generate new insights (e.g. about property use and patterns in energy demand). The roll-out of electric charging infrastructure provides a further opportunity to link up datasets. However, panellists indicated that in practice it is often difficult to access relatively basic non-energy related data from public bodies due to risk aversion and data governance constraints, or from industry due to commercial competition.
-
Panellists highlighted that AI and data-driven technology could be deployed with relative ease to increase consumer choice and control over services, such as flexible and dynamic tariff pricing. As well as being beneficial to consumers, this could help to improve public trust in the sector and its use of data, in turn unlocking more forms of data sharing - provided consumers feel the benefits. For example, giving consumers more control over services through digital means could increase the number of customers that consent to share more granular data about their energy use (e.g. half-hourly rather than hourly smart meter data) - which in turn could unlock more valuable system-level insights. However, some of our panellists believed that control and choice policies would need to be carefully constructed so as not to exclude households that are less digitally literate or engaged.
Case Study: Predictive Maintenance
The use of data for predictive maintenance is commonplace across the energy sector. It allows maintenance to be conducted on an anticipatory basis, rather than on a scheduled or reactive basis (i.e. following component failure). Predictive maintenance techniques are particularly useful for the upkeep of isolated and offshore infrastructure, such as wind turbines. The alternative approach of periodic maintenance can be resource intensive, and repairs following failure even more costly.
Failures of oil pipelines can similarly lead to considerable environmental and economic costs. While the risk of unidentified corrosion or other pipeline failures cannot be entirely mitigated, modern data analysis techniques supported by extensive monitoring can alert engineer teams when maintenance is required.
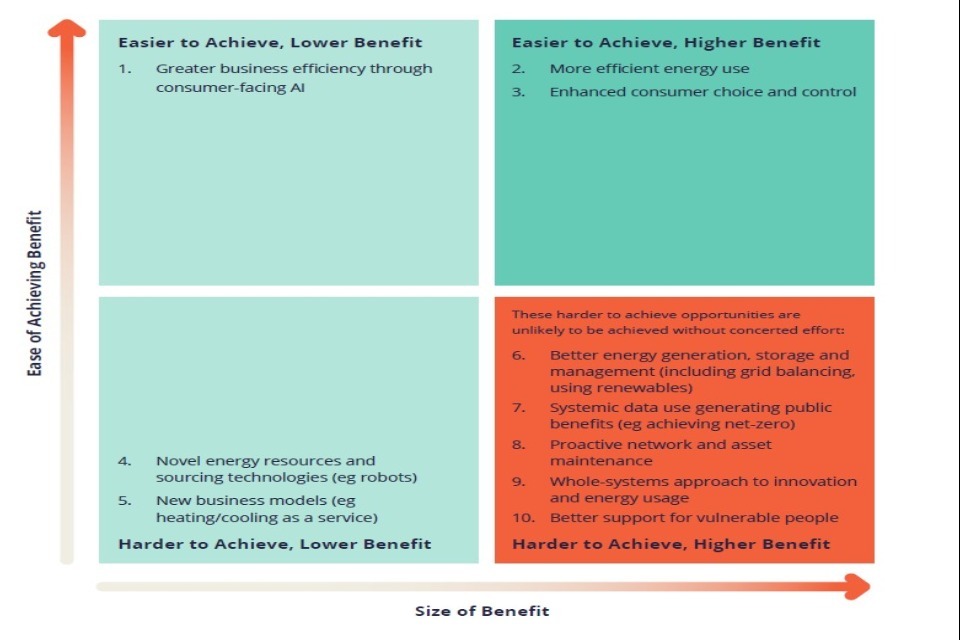
Energy & Utilities - Opportunities Quadrant
This quadrant is based on panel discussion of major AI opportunities within the Energy & Utilities sector over the next three years. This diagram is not exhaustive and reflects a review of existing policy literature, workshop discussion, further socialising and additional research and analysis. See methodology for further details.
Case Study: Minimising Energy Use in Data Centres
While the COVID-19 pandemic has led to a reduction in energy use in many parts of the economy, for data centres the trend has been in the opposite direction. Many have experienced a substantial increase in energy consumption, partly due to increased demand for digital services such as video streaming and video conferencing. Attempts to improve efficiency within these centres have therefore become more important.
AI and data-driven technology can support this goal. Google, for example, has used an AI system to fully automate the cooling of its data centres since 2016. Previously this would have required significant human supervision, even with the support of AI systems that would make recommendations to human engineers.
Full automation was achieved by using deep learning models to predict the impact of various possible actions for cooling and reducing energy consumption, based on monitoring recorded every five minutes. Google reported that this resulted in a 40% reduction in energy consumption from cooling, delivering substantial cost savings and a fall in emissions.
50.2 Energy and Utilities: Opportunity Descriptions
-
Greater business efficiency through consumer-facing AI (e.g. chatbots and virtual assistants reducing the cost of providers information to customers)
-
More efficient energy use (e.g. by using AI systems to regulate energy usage in power-intensive industries such as data centres)
-
Enhanced consumer choice and control through apps and services that communicate smart meter insights and permit dynamic tariff switching.
-
Novel energy resources and sourcing technologies (e.g. using AI-enabled robots, or to improve nuclear fusion designs)
-
New business models (e.g. heating/cooling as a service, or services that automatically switch suppliers for energy customers)
-
Better energy generation, storage and management, leading to increased energy efficiency through better timed energy usage and prediction of longer term needs
-
Systemic data use generating public benefits (e.g. achieving net-zero): Our ability to meet decarbonisation targets is enhanced through data-driven planning and operation of the national energy system.
-
Proactive network and asset maintenance: Energy producers and suppliers are able to maintain and replace their infrastructure more efficiently by using predictive modelling.
-
Whole-systems approach to innovation and energy usage enabled by coupling between markets (e.g. the energy system with electric vehicles infrastructure)
-
Improved capability for targeted support for vulnerable and disengaged energy consumers through more robust insight about their needs and barriers to participation
51. Energy and Utilities: Risks
51.1 Overview
-
The energy and utilities sector is distinguished in the extent and severity of risks related to underuse of data and AI as compared to other sectors. This in part reflects the contribution that technology could have in addressing climate change and achieving net-zero carbon emission targets.
-
Risks relating to privacy were generally ranked lower in this sector than elsewhere. One reason is that energy and utilities firms collect comparatively little personal data. Moreover, smart metres, which do collect household data, are governed by a bespoke data access policy. Nevertheless, our panel expressed concern that sensitive insights could still be derived from the personal data that is collected. Panellists also highlighted the challenges that face regulators in trying to protect personal data while simultaneously seeking to promote innovation in new data-driven products and services.
-
Some of our panel believed that regulators lacked the necessary resources to maximise the benefits of better data and AI use – a task made more difficult by competing priorities, such as the urgent need to mitigate cybersecurity threats.
-
The panel believed that low levels of trust in technology was a significant risk. The absence of trust could put a brake on innovation by discouraging consumers from adopting technology in their home, and by causing energy and utilities firms to be more timid in their tech transformation programmes. Firms and other energy and utilities bodies could help to foster trust by being clearer on the benefits of AI and data use, and by ensuring that those benefits are widely distributed in society.
51.2 Top Risks at a Glance
| Most Likely | Most Impactful | Combined Likelihood and Impact |
| 1. Regulator resourcing | 1. Higher-impact cyberattacks | 1. Regulator resourcing |
| 2. Lack of transparency in data use | 2. Loss of public benefits due to underuse of data and AI | 2. Higher-impact cyberattacks |
| 3. Digital exclusion | 3. Regulator resourcing | 3. Loss of public benefits due to underuse of data and AI |
| 4. Unequal access to smart data | 4. Lower trust in AI | 4. Digital exclusion |
| 5. Loss of public benefits due to underuse of data and AI | 5. Lack of explainability | 5. Lower trust in institutions |
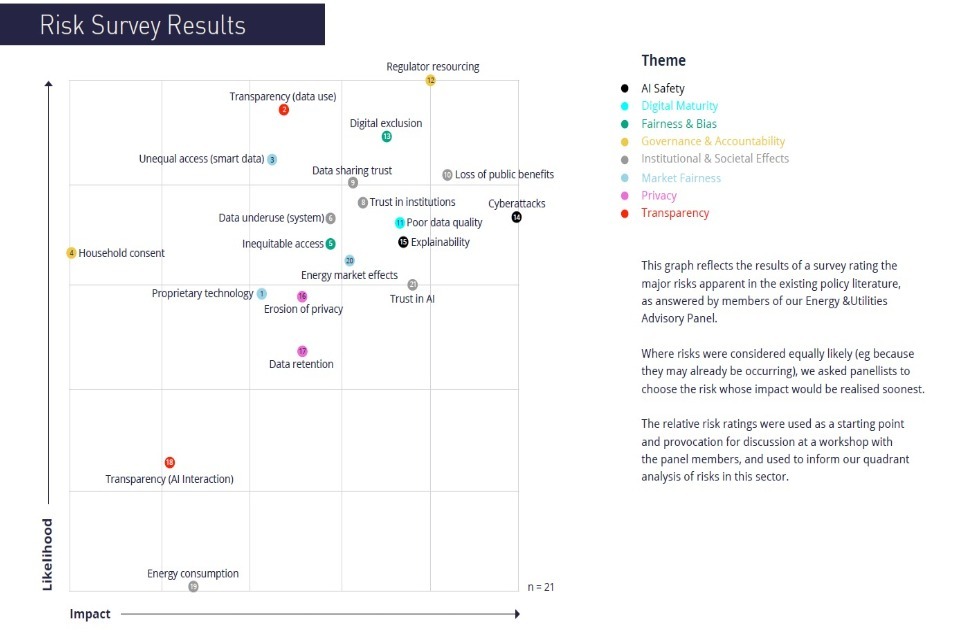
Energy & Utilities - Risk Survey Results
This graph reflects the results of a survey rating the major risks apparent in the existing policy literature, as answered by members of our Energy &Utilities Advisory Panel. Where risks were considered equally likely (e.g. because they may already be occurring), we asked panellists to choose the risk whose impact would be realised soonest. The relative risk ratings were used as a starting point and provocation for discussion at a workshop with the panel members, and used to inform our quadrant analysis of risks in this sector.
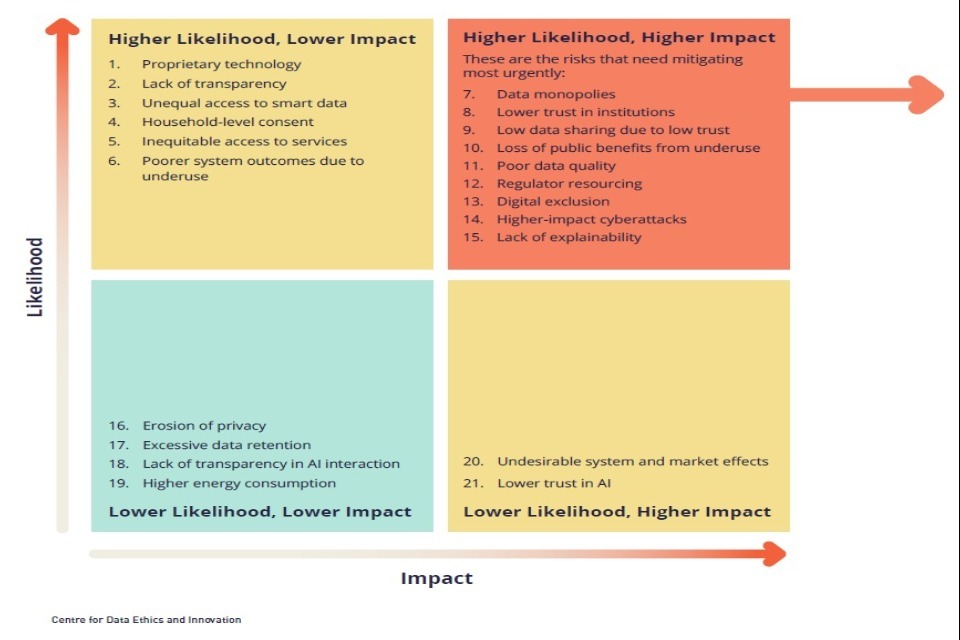
Energy & Utilities - Risk Quadrant
Top themes in Energy & Utilities Risks: Institutional & Societal Effects; Digital Maturity; Fairness & Bias
This quadrant is based on a panel survey rating the major risks in the Energy & Utilities sector over the next three years. This diagram is not exhaustive and reflects a review of existing policy literature, workshop discussion, further socialising and additional research and analysis. See our methodology for further detail.
51.3 Energy and Utilities: Risk Descriptions
-
Proprietary technology: Proprietary AI, data-driven technology, and data infrastructure makes it harder for consumers to switch service providers or challenge poor service, and for system-level benefits to be realised.
-
Lack of transparency in data use: Lack of transparency in how energy data is used to create novel products and services or to infer sensitive details (especially when combined with other types of data) makes it difficult for consumers to give informed and meaningful consent.
-
Unequal access to smart meter data: Creation of a ‘walled garden’ of carefully regulated access to smart meter data, with more granular and sensitive data sitting outside of the walled garden and which is not subject to specific controls, which may lead to granular data not being available to actors looking to maximise public benefit and consumer outcomes.
-
Household-level consent: Consent to share energy data is given by one member of the household, but encompasses everyone living at the same property who may have data shared about them without explicit agreement, infringing on individuals’ privacy.
-
Inequitable access to services: Use of data and AI leads to new business models (e.g. P2P trading or beneficial tariffs in return for selling energy back into the grid) which do not distribute benefits equally, leaving some groups in more costly systems.
-
Poorer system outcomes due to data underuse: Energy systems data is underused leading to suboptimal system outcomes such as stifled innovation, loss of economic opportunity, increased risks to system stability, and inefficiencies in how energy is produced, distributed and consumed.
-
Only a small number of organisations hold large, varied and high-quality data sets leading to unfair markets for companies and consumers, and reducing the potential benefits of greater data use.
-
Loss of public confidence in institutions: Concerns about the accuracy, safety and impartiality of AI and data use in the supply and demand of energy undermines public trust in public and private institutions and authorities.
-
Low data sharing due to lack of trust: Individuals opt-out of sharing energy data due to a lack of trust about how that data may be used, leading to missed opportunities for using data for wider and societal benefits.
-
Loss of public benefits from underuse: Constraints on how regulators, researchers and the government are able to use granular energy data leads to public benefits being missed, such as better local-level energy system planning, better evidence for effective public policy, interventions to tackle fuel poverty, and meeting decarbonisation targets.
-
**Poor data quality: AI which is trained and tested on poor quality or biased data may result in suboptimal system outcomes (e.g. poorly designed interventions to target fuel poverty or to manage energy systems).
-
Regulator resourcing: Regulators lack the resources, expertise or technical understanding needed to effectively regulate the use of AI and data within the energy sector
-
Digital exclusion: New smart energy products primarily benefit consumers that are more digitally literate, willing to share data, or willing to outsource decisions to third parties, leaving some groups with more costly energy products.
-
Higher-impact cyberattacks: Increased use of data and AI to manage energy systems leads to increased risk and impact of cyberattacks which may compromise critical national infrastructure (eg cause changes in system functionality and availability or data breaches).
-
Lack of explainability and predictability of algorithm decision-making: Overreliance on ‘black-box’ algorithms leads to unintended, unexpected or severe impact on system functionality and stability which are difficult to predict and monitor.
-
Erosion of privacy: Household data about energy consumption, generation and storage (from e.g. smart meters, electrical vehicles or heat batteries) is used to infer sensitive details about individuals (e.g. activity and working patterns or religious affiliation) particularly when combined with data from other sources, infringing their privacy.
-
Excessive data retention: Energy suppliers and other institutions collect and retain data on people (e.g. from smart meters) beyond what is needed to provide relevant services, infringing on individuals’ privacy, undermining trust and making the consequences of a data breach more severe.
-
Lack of transparency in human-machine interaction: Use of AI (e.g. chatbots) to help consumers make decisions about their energy consumption is done without their awareness, preventing them from critically assessing such advice.
-
AI and data-driven technology drive energy consumption: Computational power needed to fuel AI and data driven-tech (e.g. data centres) contributes to substantially higher levels of demand for energy and potentially increasing CO2 emissions
-
Undesirable system and market effects: Use of AI to automate decisions affect the market in a way that may lead to poorer consumer outcomes (e.g. AI designed to maximise financial return chooses to not generate energy at certain times to create a deficit of supply and push up generation prices).
-
Lower trust in AI: Controversial use of AI and data in energy and utilities increases the public’s concern about how these technologies are used, undermining their application within the energy sector, and across wider society.
52. Major Theme: Loss of Public Benefits via Underuse
52.1 Overview
This risk describes how constraints on AI and data use could lead to public benefits being lost. Missed opportunities include better local, national, and supra-national energy system planning, better evidence for effective public policy, interventions to tackle fuel poverty, and meeting decarbonisation targets. The risk is not only that energy and utilities firms do not make the most of their own data, but that their data is not combined with that of other firms and public bodies to generate richer insights.
52.2 Key messages
-
More than any other sector we explored, the potential loss of public benefits due to the underuse of data and AI was identified as one of the highest likelihood, highest impact risks. This reflects both the importance of technology in reaching net-zero carbon emissions, as well as the perceived difficulty of rolling out technology at scale.
-
Household-level data is often the focus of policy discussion, but represents only a fraction of the information collected in the energy and utilities sector. Data is also gathered on assets such as electrical substations and solar panels. Among other uses, this information can help operators to spot hazards, such as potential faults in power stations, and decide which assets to inspect and repair.
-
However, household data may also be more informative than it first appears. It could be used, for example, to reveal information about occupancy levels, work and sleep times, and the duration of routines such as mealtimes - with corresponding implications for privacy. These insights can in turn reveal more information about households, such as when a property is empty, the type of work its occupants engage in, and their religious beliefs. Equivalent inferences can be made about commercial premises.
-
Despite energy and utilities firms collecting relatively little personal data, public trust is still fragile, and will be necessary for people to share more and varied types of data that can be used for innovation. This will require firms and energy agencies to be transparent about their practices and to maintain the highest data governance standards.
52.3 State of the Art: Maximising the benefits of data use in energy
-
Imperial College London’s Energy Futures Lab Digitalisation of Energy report examines how new technologies will affect the energy system.
-
The Smart Meter Energy Data Public Interest Advisory Group is examining the added benefits that greater access to smart meter data could unlock.
-
Energy Systems Catapult Digitalisation for Net Zero report looks at the technologies potentially needed to achieve 2050 emissions targets, with a similar focus in academic work such as Tackling Climate Change with Machine Learning by Rolnick et al.
52.4 Drivers
-
Low public trust in some parts of the sector affects both consumer behaviour (e.g. making households less willing to consent to data sharing of granular smart meter data) and supplier behaviour (e.g. making firms more risk averse). As smart meters allow for increasingly sophisticated data to be collected and analysed (e.g. enabling the age of household appliances to be estimated), consumers may become more alert to the privacy implications and reticent to adopt the technology.
-
Innovation-friendly governance. The availability and accessibility of regulatory sandboxes can help energy and utilities suppliers experiment more confidently with new uses of AI and data-driven technology.
-
Sophistication of data use. Panellists highlighted that the energy and utilities sector as a whole is relatively unsophisticated in how it uses data, depriving households and industry of its potential benefits. Energy data, for example, is rarely combined with other forms of data to generate new insights. This reflects the fact that, until recently, energy systems were largely based on analogue models.
-
Articulation of benefits. Panellists highlighted the need for clearer messaging about the benefits and trade-offs involved in using smart meter data, including the potential for better control and greater efficiency of energy systems. The panel also pointed to the need for clearer standards to define and underpin conceptions of public benefit in energy and utilities. There are limited standards, for example, relating to the use and maintenance of ‘priority services registers’, which suppliers use to support vulnerable people.
-
A lack of open or available data. This is due to a combination of risk aversion, the high cost of regulatory compliance (e.g. to access smart meter data), and commercial interests. Access to non-energy data (e.g. that held by public bodies) is also limited.
52.5 State of the Art: the Modernising Energy Data programme
The Modernising Energy Data programme is a collaboration between Government, Ofgem, and Innovate UK. It commissioned the Energy Systems Catapult to run its Energy Data Task Force, which published its final report in June 2019. The report set out recommendations on how to modernise digital infrastructure and data use in the energy sector, focusing on data, infrastructure and asset visibility, system optimisation, open markets and data, and agile regulation.
The programme is now facilitating delivery of a modern digitalised energy system that makes effective use of data. Themes include creating transparency about the digitalisation plans of regulated monopolies and establishing Data Best Practice for energy, which includes the principle that data is “presumed open”. The programme also features the creation of infrastructure to serve as a platform for modern marketplace data services (making energy assets visible, helping system optimisation, open markets, enabling insight services, and agile regulation). Many of these relate directly to some of the drivers identified opposite.
53. Major Theme: Regulator Resourcing
53.1 Overview
This risk concerns regulators lacking the resources, expertise, coordination or mandate needed to effectively regulate the use of AI and data-driven technology within the energy sector.
53.2 Key Messages
-
The use of AI and data-driven technology in the energy and utilities sector is not as well developed as in other parts of the economy.However, this may change as competition in the energy market grows, smart meter data use becomes more sophisticated, and the industry looks towards new ways of achieving decarbonisation.
-
Regulators will need to be ready to deal with a step change in the use of AI and data-driven technology. This may prove difficult, however, given the limited resources and technical expertise at their disposal (although note that Ofgem and Ofwat recently established dedicated teams of data specialists).
-
Panellists reported that regulators did not feel they had the mandate to support disruptive innovation, in a sector where rapid change may be necessary to meet carbon emission targets.
-
Panellists, however, commended recent changes to the ICO’s regulatory approach, including the launch of ‘regulatory sandboxes’ – where firms are encouraged to experiment with new uses of data in close coordination with the regulator – and the publication of new ‘Opinion’ pieces, which allow guidance on data use to be issued more rapidly. These and other regulatory changes could help to encourage innovation, in particular by helping firms understand what the Data Protection Act allows and what it prohibits.
53.3 State of the Art: The ICO Sandbox Programme
-
Enabling the safe, ethical and legal use of data lies at the heart of maximising the benefits of AI, making it important for data governance to achieve a balance between protecting people’s rights and fostering innovation.
-
The Information Commissioner’s Sandbox programme allows organisations across the private and public sectors to develop new, heavily data-driven services, from facial recognition technology in airports to lowering violent crime, with strong data protection built in from the start.
-
The programme was consistently cited by our sector panels as an example of a governance model that enables safe innovation.
53.4 Drivers
-
Limited data access. Regulators do not have direct access to system data, for example from smart meters and infrastructure assets, which would allow them to spot current and potential issues and develop more sophisticated governance tools - although providing this would be a sizeable undertaking and require significant resources.
-
AI and data-driven technology are competing for attention with other pressing governance issues. This includes the increasing prevalence and viability of cyberattacks on cyber-physical systems such as power stations, and the need to reconfigure the UK’s portfolio of energy sources over the coming decades.
-
Changes in market structure. As well as coping with the impact of new technologies, regulators are having to adapt to more fractured markets with a greater number of actors. One noteworthy trend has been the entry of new suppliers and switching services in the energy market. Another has been the growth of microgeneration and peer-to-peer energy markets. These trends may have added to the workload of regulators and made it more challenging to keep track of how AI and data-driven technology is being used.
-
High demand for data and digital skills. While regulators in the energy and utilities sector have traditionally relied on staff with engineering expertise to safeguard infrastructure and promote innovation, today they need to recruit and develop teams with digital and data-focused skill sets. However, regulators can struggle to compete for talent with private sector firms, which can offer more lucrative salaries and benefits.
-
Speed of technological change. Despite the energy and utilities sector being less advanced than other industries in the adoption of AI and data-driven technology, the pace of innovation is still such that it requires fast action on the part of regulators to issue guidance and establish monitoring procedures. Regulators face the challenge of having to rapidly adjust their practices, with limited capacity on hand.
54. Major Theme: Digital Exclusion
54.1 Overview
Digital exclusion is where the benefits of technology are denied to some households and businesses. This is often because they lack digital literacy, or are unable to share data and outsource decisions to third parties. In the context of the energy and utilities sector, digital exclusion can lead to less choice and higher prices.
54.2 Key Messages
-
Our panel raised concerns that some households would not be able to take full advantage of new AI and data-driven products, including smart meters, smart energy products and digital-first switching services. This could lead to unfair outcomes and prevent the poorest households from reducing their bills. Low income groups already face difficulties accessing appropriate energy and utilities products, for example with many relying on prepayment meters that can charge higher tariffs.
-
Digital exclusion also affects the business community. Many small businesses, for example, may not have the time or expertise in house to maximise the benefits of AI and data-driven technology. Similarly, some sectors are not set up to take advantage of new products and services. This includes certain forms of manufacturing that have inflexible energy demands.
-
Addressing digital exclusion will require not just an improvement in the digital skills of households and businesses, but also a high degree of trust, without which consumers will be less willing to engage with new technology or the firms seeking to promote it. Households and businesses will need confidence that sharing their data will not disadvantage them, signifying an important role for consent-based data-sharing. Firms also need to be clear that widespread use of AI and data-driven technology could lead to greater benefits for all, with more data collection and analysis leading to more sophisticated products and services.
54.3 Drivers
-
More energy providers and switching services are becoming digital-first. They market their services online and engage with customers through apps (e.g. asking people to post meter readings themselves via smart phones). This approach can lock out households and businesses without digital skills or equipment.
-
People suffering fuel poverty often coincide with groups lacking digital literacy, leading to cumulative disadvantage and making it harder for them to switch providers. In some instances, suppliers have been known to target marketing at customers they are likely to yield greater profits because of their limited options. However, for those seeking to address issues such as fuel poverty, the administrative costs involved in finding and collecting data on potentially vulnerable users are significant, and can be difficult to obtain - for example, there is no ‘tell me once’ system for people in debt to share data on their circumstances with different creditors.
-
Households and businesses often need to meet certain criteria before they can adopt AI and data-driven products and services, usually due to the need for specialised hardware. This can include owning property, having control of the energy and utility provision while renting, or owning hardware such as an electric vehicle. Similarly, participation in microgeneration and collective approaches to energy generation depends on having the capital to buy or rent the necessary hardware (e.g. solar panels), and often requires a person to own or have the right to modify the property in question. Lower income groups and tenants in the private rented sector could therefore be frozen out of the benefits of new AI and data-driven products and services.
-
New smart energy tariffs are not always easy for consumers to understand and make use of. For example, ‘time of use’ tariffs, which incentivise customers to use more energy at off-peak times, have the potential to cut energy and utilities bills, but they also require people to be engaged, digitally literate and flexible.
Case Study: Understanding Customer Behaviour in Energy Markets
Ofgem, the energy markets regulator, recently published a study looking at how long-term disengaged customers might be identified among energy users that have been on a default tariff for more than three years.
A supervised machine learning approach was used to identify the attributes that were most likely to indicate disengaged customers, such as whether they paid by prepayment or direct debit, and whether they were signed up to a small or large supplier.
With this information to hand, policymakers and regulators could try to predict which customers are likely to disengage in future, which could inform where they target interventions. This data-driven approach could also be used to identify disengaged customers in other markets.
55. Methodology
55.1 Overview
The CDEI is tasked with looking at the impact of AI and data use and its governance, across all of the UK economy and society, now and in the future. This initial iteration of the CDEI AI Barometer used an experimental methodology to begin to map out this landscape. We set out our process in this methodology chapter to place our findings in context, and help others understand how we have tried to navigate the inherent uncertainties associated with AI and data use. The diagram below provides an overview of the process, with the purpose, challenges and decisions taken at each stage described in further detail on the following slides.
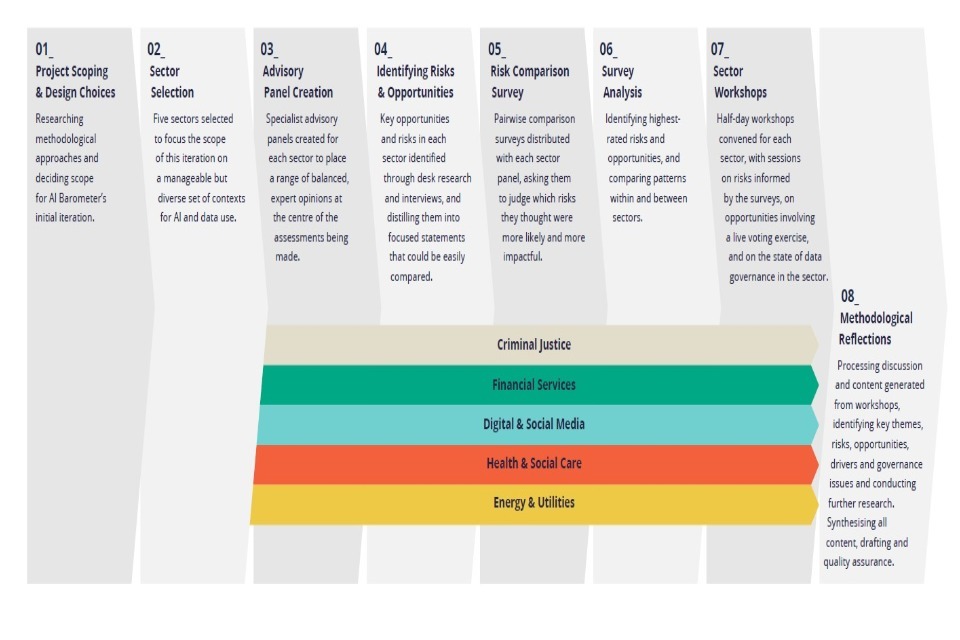
Methodology - Overview
56. Project Scoping & Design Choices
The objectives of the first edition of the AI Barometer are:
-
To provide policymakers with an assessment of priority issues across the landscape of AI and data use.
-
To begin building an understanding of where and why issues arise and vary across different contexts.
-
To provide an initial understanding of how successfully governance regimes are able to take advantage of opportunities and mitigate the risks of AI and data use.
56.1 Challenges
-
AI and data-driven applications are general purpose technologies, and the scope of understanding which issues they give rise to, and which of these are the most urgent is a correspondingly extremely broad challenge.
-
Risks and opportunities can operate at very different levels, and affect individuals, groups, and organisations differently.
-
The impact of particular technologies, approaches or practices around AI use varies greatly by context - for example, the impact of a predictive algorithm for recommending videos may be different from one used to diagnose disease.
56.2 Design choices
-
Sector focus - We chose to conduct our research around sectors, to frame research, discussions, and findings in an immediately familiar and understandable way to policymakers, particularly as applications, impacts and governance responses to technologies are often sector specific. It also helped narrow our analysis around a manageable segment of the UK economy and society.
-
Community informed - Convening different communities involved in and affected by AI and data technologies would ensure we received a comprehensive and balanced understanding of the issues, and it was crucial that the Barometer was built collaboratively with them. We decided to place expert advisory panels at the centre of our research.
-
Grounding risks and opportunities in context - We chose to ground our conceptualisations of risks and opportunities around AI and data use at the level of deployment in context - for example, the risks associated with the use of algorithmic decision-making tools in justice contexts like policing, rather than more generally.
57. Sector Selection
57.1 Overview
We chose to focus our research around five sectors, to centre the scope of the first AI Barometer on a manageable but diverse set of contexts for AI and data use.
57.2 Challenges
- Defining the scope of some sectors was challenging, particularly those around newer industries, products and services such as ‘Digital and Social Media’.
57.3 Design choices
The five sectors were chosen to exhibit a range of different contexts of AI use, data use, and data collection, for example:
-
the extent of personal data use
-
the types of products and services delivered
-
public/private ownership and delivery
-
governance regimes
-
groups affected by risks and opportunities
The five sectors we chose were:
-
Criminal Justice
-
Financial Services
-
Digital and Social Media
-
Health and Social Care
-
Energy and utilities
57.4 Reflections
- The diversity in sector choices helped with the comprehensive identification of opportunities and risks, and allowed us to extract commonalities and differences across sectors.
58. Advisory Panel Creation
58.1 Overview
Specialist advisory panels created for each sector to place a range of balanced, expert opinion at the centre of the assessments being made.
58.2 Design choices
-
We wanted to ensure we achieved a fair balance of opinion, so we invited an even distribution of representatives from across the public sector, regulators, developers, academia, civil society, and from the industries within the sector in question.
-
We invited organisations of a range of sizes and market segments, to ensure we were reflecting diverse experiences from different parts of each sector.
-
Each panel consisted of around 25-30 specialists.
58.3 Reflections
- We curated each panel to ensure a balance of views from different communities. In future iterations, we will examine the feasibility of scaling the volume of survey respondents, and adjusting for balance later.
58.4 Sector panel breakdown
Public sector
-
Central government departments
-
Local government
-
Regulators
-
Sector organisations (e.g. NHS Trusts for the Health and Social Care sector)
-
Other arm’s-length bodies
-
Membership bodies
Industry
-
Tech developers
-
Sector organisations and providers (e.g. energy providers within the Energy and Utilities sector)
-
Membership and trade bodies
Academia
-
Academics
-
Research bodies
-
Research funders
Civil Society
-
Consumer bodies
-
Campaigning organisations
-
Think tanks
59. Identifying Risks and Opportunities
59.1 Overview
We needed to establish a comprehensive overview of the risks and opportunities in each sector, and prepare them in a way suitable for comparison and discussion by our advisory panels.
In summary this involved:
-
Collating risks and opportunities - Desk research and interviews to build long lists of risks and opportunities in each sector.
-
Crafting comparable statements - Making decisions about how to articulate risks and opportunities in a form they were easily comparable in, and deciding which should be in and out of scope.
-
Ensuring consistency - Making decisions about how to combine or separate related risks and opportunities. Identifying common risks and opportunities across different sectors and standardising their articulation where possible.
-
Quality assurance - Testing the statements with experts (including members of our sector panels) to ensure accuracy, good articulation, and comprehensiveness.
59.2 What do we mean by risk?
We distinguished between harms, hazards, and risks when conducting this research:
-
Harms are injuries, damage, or other negative effects suffered by people, or to the effective functioning of systems.
-
Hazards are potential sources of harms.
-
Risks are the probability that a hazard will result in a harm.
59.3 Collating risks and opportunities
-
We mapped out the risks and opportunities associated with AI and data use in each sector, which we collated through a broad review of policy and research literature and interviews with experts. We tried to capture all apparent and credible risks and opportunities; while some might be much less likely or impactful than others, we wanted to leave the assessment of that to our expert panels, rather than make assumptions ourselves.
-
We found this process produced different results for opportunities and risks; opportunities tended to emerge from policy and academic literature as higher-level (and therefore fewer), whereas risks were often more thoroughly described at a range of individual/group/system levels. We typically found around 25 risks and 10 opportunities for each sector, which are detailed in each sector chapter.
-
Given the different volumes and levels of abstraction in the risks and opportunities we generated, we decided to try different approaches to filtering them. For opportunities, we wanted a way of drawing out more detail about them, and understanding what we might have missed from the desk research. For the risks, we needed a way of sensibly comparing and filtering the large number of risks that were apparent in each sector.
59.4 Crafting comparable statements
-
The goal of collating risks and opportunities was to understand which require the most attention from policymakers, so they needed to be easily comparable. We attempted to distill each risk or opportunity into a short statement of just a sentence or two. For risks, we referred to the ‘bowtie’ risk management model, to focus statements on the specific event, including limited description of cause and impact to provide sufficient context, but without leading the reader.
-
We chose to focus on risks arising from the development and use of AI and data, which we defined as the possibility of harm occurring to individuals, groups, or organisations arising from the use or misuse of AI and data driven technology. We particularly focused on risks that had ethical and social implications.
-
Accordingly, we did not include risks which related specifically and only to the legality of AI or data use, unless that was the most relevant way of articulating the event that could cause harm. For example, we did not include general, deliberate breaches of data protection legislation within our lists of risks, but we did include risks that related to unclear guidance or governance around data protection, that might lead to intentional or unintentional data breaches.
59.5 Ensuring Consistency
-
We made choices about whether to combine or separate related or similar statements, for example, the risk of poor AI explainability due to either commercial confidentiality, or to technical reasons. We chose to combine statements where either the cause of the risk or a typical governance response was similar. In this example, as a potential response to achieving explainability in both contexts might be achieved through mandating explainability standards for those developing and deploying AI models, we decided to combine the statements. This was an imperfect process, and discussion at workshops occasionally brought out nuances we had not considered, which we incorporated into our findings.
-
Some risks were apparent in multiple sectors. Where this occurred, we tried to keep the majority of the statement identical, usually only adapting it to provide an in-context example for the sector, so that we could compare the relative significance of similar risks across different sectors. These formed the basis of the common risks we discuss in the body of the report.
59.6 Quality assurance
- We tested the statements with experts (including members of our sector panels) to ensure their accuracy, clarity of articulation, and comprehensiveness.
60. Risk Comparison Survey
60.1 Overview
We needed a process that permitted the meaningful comparison of 20-30 risks for each sector, that would allow us to identify which were most pressing and focus on them at our sector workshops.
60.2 Challenges
-
Risk complexity - Trying to compare risk statements is challenging, even with careful drafting and across simple, familiar criteria. Each risk is likely to carry different types of impact for different groups, with varying timelines, dependencies and governance considerations. Comparing more than two risks at once quickly becomes difficult for subject experts due to the multiplicity of factors that need to be taken into account and the complexity of the real world.
-
Collating opinions - As well as permitting individual panellists to effectively make judgements, we needed a way of aggregating their opinions in a meaningful way.
60.3 Design choices
Pairwise comparison approach - To manage this complexity, we chose to use a process of comparative judgement, whereby pairs of risk statements are presented to respondents, and they are asked to choose the one that best fits a given criteria. The box opposite depicts a single pairwise comparison between two risks statements.
-
Using this approach had a number of advantages:
-
It reduced the cognitive load required from panellists, allowing them to make more and better judgements.
-
It leverages the fact that people are better at making comparative rather than absolute judgements.
-
It allowed the automatic aggregation of multiple perspectives.
Choosing criteria for comparison - We chose likelihood and impact as the two criteria for our sector panellists to judge the risk statements against, representing the two basic components of traditional risk assessment. We defined likelihood as the chance of an event occurring, and impact as the degree of harm caused by the event occurring. We specified that where panellists considered two risks to be equally likely (for example, because they are already occurring), they should choose the risk whose impact would be realised soonest.
Panellists were asked to complete one online survey for likelihood, and one for impact, in each case choosing which statement from each pair was respectively either most likely or impactful in their judgement. Where risks were considered equally likely (e.g. because they may already be occurring), we asked panellists to choose the risk whose impact would be realised soonest.
Bounded time horizon - We asked respondents to evaluate the risks across a three-year time horizon, to bound the scope of the question they were being asked in each survey, and focus the risk assessment on the near-future, in line with the focus of this first iteration of the Barometer on the current risk landscape.
Choosing a platform - We used the No More Marking platform to conduct the surveys. While other, more generalised implementations of pairwise comparison survey platforms exist, we chose No More Marking because of the robust implementation of an open source comparative judgement algorithm, that provides the user with detailed information on the statistical model it outputs. In particular, its provision of reliability and infit metrics for the overall model and individual judges allowed us to be confident that the results were suitable for sharing and to drive discussion.
60.4 Pairwise Comparison Example - Criminal Justice
Choose the statement that you think is MORE LIKELY to occur in the next three years:
-
Gaming of algorithmic systems in justice (e.g. lowering or raising of offender risk scoring through input data manipulation)
-
Lack of clear legal responsibility for justice decisions made or informed by the use of algorithmic tools, makes it difficult for people to challenge those decisions.
61. Survey Analysis
61.1 Overview
We analysed the survey results to identify which risks were most significant and merited further focus in the workshops, and to identify patterns within and between sectors.
61.2 Findings
-
Relative risk scores - The output of each survey was a list of risks for the given sector, scored against either likelihood or impact, with a higher score indicating that in aggregate, respondents considered those risks more likely or impactful respectively. In essence, each score represents a quantification of a series of qualitative judgements by several different experts.
-
Top risks - We compiled lists of the top five most likely and most impactful risks, and also the top five by aggregate score, calculated by multiplying likelihood and impact scores together. These are reported in each sector chapter.
-
Visualising the results - We mapped the likelihood and impact scores for each risk within a sector against each other to permit easy comparison.
-
Typology - We then applied a thematic typology to the risks in that sector, to provide a further dimension in which to understand patterns in the data. The typology table that follows sets out these themes in more detail, and the charts opposite and on the following slide provide examples of the results presented to workshop participants and the types of patterns identified both within and across sectors.
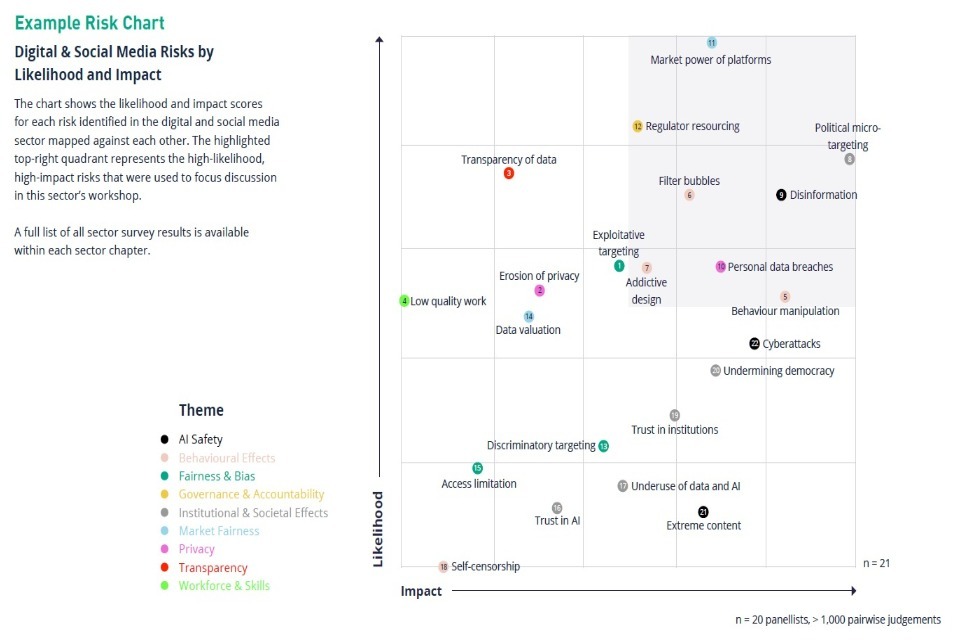
Survey Analysis - Example Risk Chart
62. Survey Analysis
Example Risk Chart: Digital & Social Media Risks by Likelihood and Impact
The chart shows the likelihood and impact scores for each risk identified in the digital and social media sector mapped against each other. The highlighted top-right quadrant represents the high-likelihood, high-impact risks that were used to focus discussion in this sector’s workshop.
A full list of all sector survey results is available within each sector chapter.
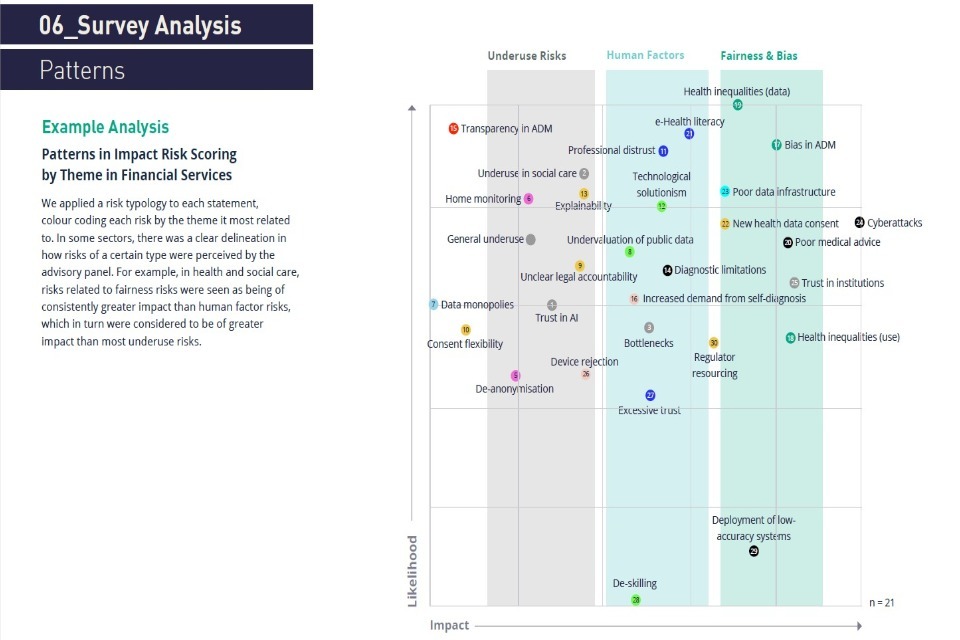
Survey Analysis - Patterns - Example Analysis
63. Survey Analysis - Patterns
Example Analysis: Patterns in Impact Risk Scoring by Theme in Financial Services
We applied a risk typology to each statement, colour coding each risk by the theme it most related to. In some sectors, there was a clear delineation in how risks of a certain type were perceived by the advisory panel. For example, in health and social care, risks related to fairness risks were seen as being of consistently greater impact than human factor risks, which in turn were considered to be of greater impact than most underuse risks.
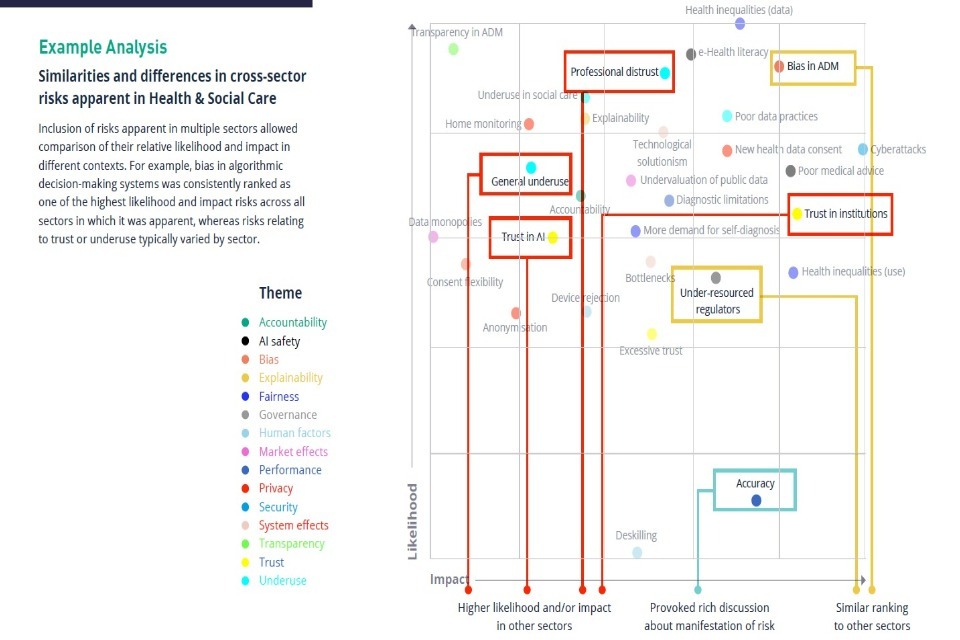
Survey Analysis - Patterns - Example Analysis
64. Survey Analysis - Patterns
Example Analysis Similarities and differences in cross-sector risks apparent in Health & Social Care
Inclusion of risks apparent in multiple sectors allowed comparison of their relative likelihood and impact in different contexts. For example, bias in algorithmic decision-making systems was consistently ranked as one of the highest likelihood and impact risks across all sectors in which it was apparent, whereas risks relating to trust or underuse typically varied by sector.
65. Survey Analysis - Interpretation
65.1 Interpretation and limitations of results
-
Sample size: Respondents to the surveys were members of our advisory sector panels, with the scoring for each sector representing the aggregated pairwise judgements of around 17 to 20 advisory panel members. Over all surveys, this amounted to over 4,700 individual pairwise judgements.
-
Relative ranking: The comparative judgement process produces relative scoring - which is essentially a measure of how much risk statements were chosen over others. Scores of 0 indicate statements that were most consistently chosen as the lowest likelihood or impact, but is not an indication that those statements have no likelihood or impact - and vice versa for scores of 100. For example, risks scored as low likelihood are not necessarily unlikely to occur, but in the view of our panels they are less likely to occur than the other risks in the list for that sector.
-
Perception vs Reality: The survey responses represented panellists’ perceptions of risks rather than actual risk levels, although the subsequent workshops were designed to provoke discussion to understand broader context that would inform our own assessments of risks.
-
Near-future focus: We set a three-year time horizon for evaluation of the risks to help respondents bound their assessments of the risks. The CDEI will also be working on longer term issues with the development of a Futures function in 2020.
-
Comprehensiveness: The comparative judgement process relied on having a comprehensive list of risks at the point the survey was distributed, and additional risks could not be included once the survey process had started. To minimise this issue, we checked our lists of risk statements with experts before running the surveys, and provided the opportunity to discuss additional risks in the workshops.
-
Reliability: Each set of sector survey results for likelihood and for impact received a statistical reliability score that describes how well the set of responses fit the model produced, or in other words, how consistent all the respondents’ answers are with each other. The reliability score is expressed from 0 to 1, with 0.6 generally regarded as being useable, 0.7 as good, and 0.8 as excellent reliability. The average reliability of all ten surveys (one likelihood and one impact survey per sector) was very good at 0.77, with a range of 0.66 to 0.84.
66. Survey Analysis - Thematic typology of risks
We categorised risk statements into the typology below, and used it to drive analysis of survey results, as shown on the preceding slides.
| Risk Theme | Description | *Risk Example |
| AI Safety | How the design, use and performance of AI and data-driven systems makes them safe or unsafe | * Poor autonomous vehicle road safety * Market flash crashes caused by algorithmic traders * Low accuracy of facial recognition technology in low-light conditions * Increased impact of cyberattacks due to increased AI use |
|---|---|---|
| Behavioural Effects of AI | How AI and data-driven technologies impact on individuals’ behaviour and autonomy | * Behavioural design * Behavioural manipulation via online micro-targeting |
| Digital Maturity | How the level of digital maturity of a given system or sector drives the adoption, development, risks and opportunities of AI and data-driven technologies. Includes data-sharing arrangements and system interoperability | Low availability of social care data limits development of AI solutions in that sector |
| Fairness & Bias | How AI and data-driven technologies produce fair or unfair outcomes for individuals and groups, including through algorithmic bias | * Algorithmic bias in credit-scoring decisions * Digital exclusion limiting access to AI benefits |
| Governance & Accountability | How governance systems interact with the development, adoption and use of AI and data-driven systems | * Unclear legal accountability for algorithmic outcomes • Unclear data governance guidance |
| Human Factors | How human behaviours and systems impact on the development and use of AI and data-driven technologies | * Professional distrust causing algorithmic recommendations to be ignored * Excessive trust in AI causing deskilling of professionals |
| Institutional & Societal Effects | How AI and data-driven technologies impact on public and private institutions, and wider society | * Bottlenecks in health system due to AI-driven diagnoses * Negative impact of misinformation on democratic debate |
| Market Fairness | How AI and data-driven technologies drive fair or unfair market effects | * Platform and data monopolies discouraging new market entrants * Algorithmic collusion in financial markets |
| Privacy | How AI and data-driven technologies impact people’s privacy, and the role their consent plays in data collection and use | * Erosion of privacy in public spaces due to deployment of facial recognition |
| Transparency | How transparent the use and functionality of AI and data-driven systems are to developers, operators and data subjects | * Lack of explainability in AI decision-making * Data subjects unaware of algorithmic decision-making applied to them |
| Workforce & Skills | How AI and data-driven technologies impact workforce and skills issues, and vice versa | * High AI expert demand affecting availability of university tutors * Automation of work driving significant job losses |
67. Survey Analysis - Common Risks
This table lists each risk identified as occurring in more than one sector, and provides a fuller description reflecting the risk statements presented to sector panellists. Each common risk is grouped according to our risk typology.
| Risk Type | Common Risk | Risk Description |
| AI Safety | * Creation and dissemination of misinformation and disinformation * Low accuracy of predictive AI systems * Increased impact of cyberattacks due to increased AI and big data use | * Use of AI and data-driven platforms and services allows for the creation and distribution of false or misleading content at scale * AI and data-driven systems with low accuracy are deployed in the field, causing poor outcomes for system operators and data subjects * Increased use of data and AI increases the risk and impact of cyberattacks which cause changes in system functionality, loss of system availability or data breaches |
|---|---|---|
| Behavioural Effects of AI | No common risks, as risks of this type are primarily prominent in Digital & Social Media sector | |
| Digital Maturity | Lack of digital or data maturity, including effective data-sharing capability | * Lack of effective data collection, data quality assurance, data-sharing arrangements, interoperable systems or sufficiently digitised systems leads to the underuse of AI and data-driven approaches |
| Fairness & Bias | * Bias in algorithmic decision-making tools resulting in discriminatory outcomes * Exclusion from or unequal access to services | * Use of biased algorithmic tools or data entrenches systematic discrimination against certain groups * AI and data-driven products and services primarily benefit consumers who are more digitally literate, willing to share data or willing to outsource decisions to third parties, leaving some groups with poorer access to them |
| Governance & Accountability | Lack of resources for regulators | * Regulators lack the resources, expertise or technical understanding needed to effectively regulate the use of AI and data in the sector |
| Human Factors | * Excessive trust in algorithmic decision-supporting tools * Underuse due to professional distrust * Lack of human-in-the-loop | * People use algorithmic recommendations in lieu of professional judgement, resulting in poorer outcomes for data subjects * Benefits of algorithmic tools are not realised because professionals distrust the accuracy or appropriateness of those tools and disregard their input * Insufficient oversight by humans in algorithmic decision-making processes leads to poorer outcomes for subjects of those tools |
| Institutional & Societal Effects | * Loss of trust in AI * Loss of confidence in institutions | * The controversial deployment of AI or data use increases the public’s concern about how these technologies are used, undermining their application across society * Concerns about the accuracy and impartiality of AI and data use in a sector undermines public trust in institutions or organisations within that sector or beyond |
| Market Fairness | * Undervaluation of publicly-owned data * Platform and data monopolies | * Public bodies do not understand the full commercial value of sharing publicly-owned data with private sector developers, leading to inefficient use of public assets or taxpayer money * The volume and quality of data held by large technology firms, and their unparalleled capacity to collect it, leads to an unfair playing field for other companies, ultimately leading to a smaller market and discouraging innovation |
| Privacy | * Data subject consent or agreement around use of new and non-traditional data types * General erosion of privacy * Excessive data retention | * Organisations collect novel data types about people to inform their decisions (e.g. social media data to estimate loan repayment) in a way that does not allow for the appropriate level of transparency for or control by individuals * Increasing use of AI and data-driven technology generally erodes individuals’ privacy by making it increasingly easy to track and identify them in digital or physical spaces * AI and data-driven systems collect and retain data on individuals beyond immediate operational requirements, resulting in a significant increase in the amount of data unjustifiably held on them |
| Transparency | * Lack of explainability for technical or commercial reasons * Lack of transparency in data collection, use and application of AI systems | * Difficulty in understanding or challenging decisions made or informed by algorithms because of their ‘black box’ nature or commercial confidentiality regarding their functionality. * Individuals are not aware or do not understand how data is collected from them or used, preventing them from making informed decisions about how to share and control their data, or from understanding or challenging decisions made about them based on that data. |
| Workforce & Skills | Professional deskilling | * Over-reliance on algorithmic decision-making tools erodes the development and availability of professional skills and judgement. |
68. 7. Sector Workshops
68.1 Overview
**Following the risk surveys, we ran an advisory panel workshop for each of the five sectors, with approximately 20-30 participants at each, most of whom had completed the surveys. The purpose of the workshops was to develop a more nuanced understanding of the risks, opportunities and governance gaps around AI and data use in the five chosen sectors, in a level of detail not possible through desk research or the surveys. Each workshop comprised of three main sessions.
68.2 Risks
- We first asked panellists to consider the most significant risks in their sector, including presentation of the survey results to provoke discussion. We invited participants to reflect on and challenge the results, and then focused debate around three of the highest likelihood and impact risks, to better understand the impact, drivers, evidence gaps and existing mitigation around these risks.
68.3 Opportunities
- The second session focused on opportunities. Participants were invited to review the list of opportunities we had identified, amend them, and suggest new ones. These suggestions were incorporated into a live voting exercise that asked participants to rank both the potential size of the benefit presented by the opportunity and the difficulty of achieving the benefit. The example on the next page shows a typical output of the voting exercise, and the variability in rating of specific opportunities.
68.4 Governance
- The final session focused on the state of existing governance on AI and data within the sector in question, and the scope to maximise the opportunities presented by technology in the sector.
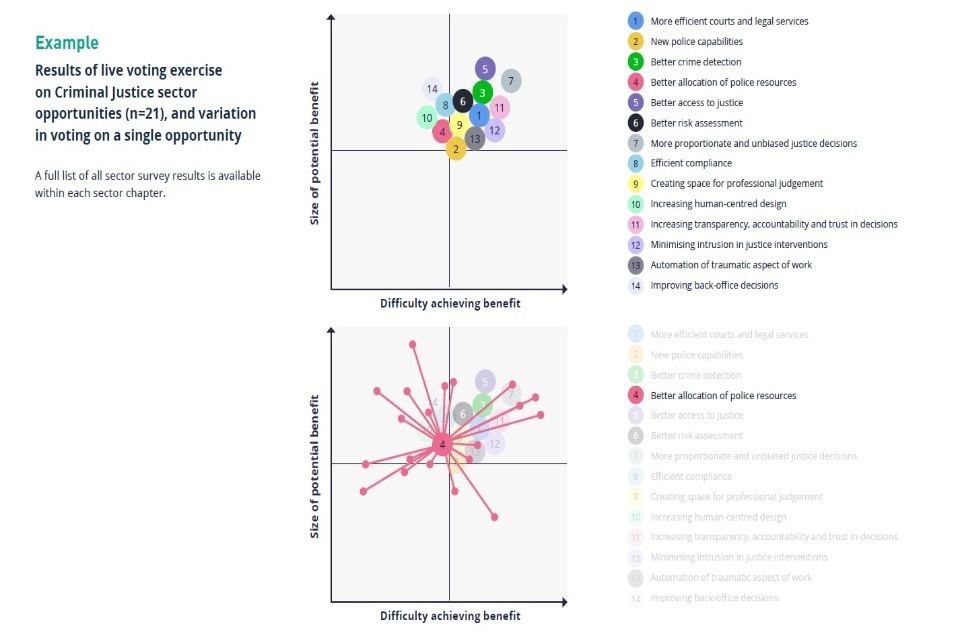
Sector Workshops - Example
An example of our sector workshops. Results of live voting exercise on Criminal Justice sector opportunities (n=21), and variation in voting on a single opportunity A full list of all sector survey results is available within each sector chapter.
We used the results to provoke discussion among participants on the opportunities. Given the exercise involved newly incorporated opportunity statements in a live setting, this created a time limitation on ensuring all panellists were completely clear on the scope of every opportunity voted on.
68.5 Limitations
-
Typically, there was a high degree of variability in the judgements made against any particular opportunity. In some cases, the variability against one axis was considerably greater than the other (e.g. ‘virtual assistants’, next page), denoting a greater or lesser extent of agreement between panellists on either the size of the benefit or the difficulty in achieving it.
-
The chart on the following page shows the high degree of variability in scores given by panellists on energy opportunities. The bars denote the standard deviation for the scores given across the respective axis. Some opportunities display a greater variation across one axis than another (e.g. ‘virtual assistants’), indicating greater disagreement among panellists across that criteria. Some opportunities show lower variation across both axes compared to other opportunities (compare for example ‘more efficient energy use’ with ‘cross-sector data’) indicating greater agreement, and possibly certainty about the potential difficulty of achieving and size of the benefits represented by that opportunity.
68.6 Reflections
- The high variability in scoring often meant the average score for many opportunities ended up close to the middle of the scoring range. The use of an absolute rather than comparative scoring approach in the workshops also contributed to this averaging effect, as participants were not forced to choose between opportunities, and could score them similarly to each other. Using pairwise comparisons may be the preferable approach, but it proved challenging to find a platform suitable for live use that also supported statistical measures for reliability and infit.
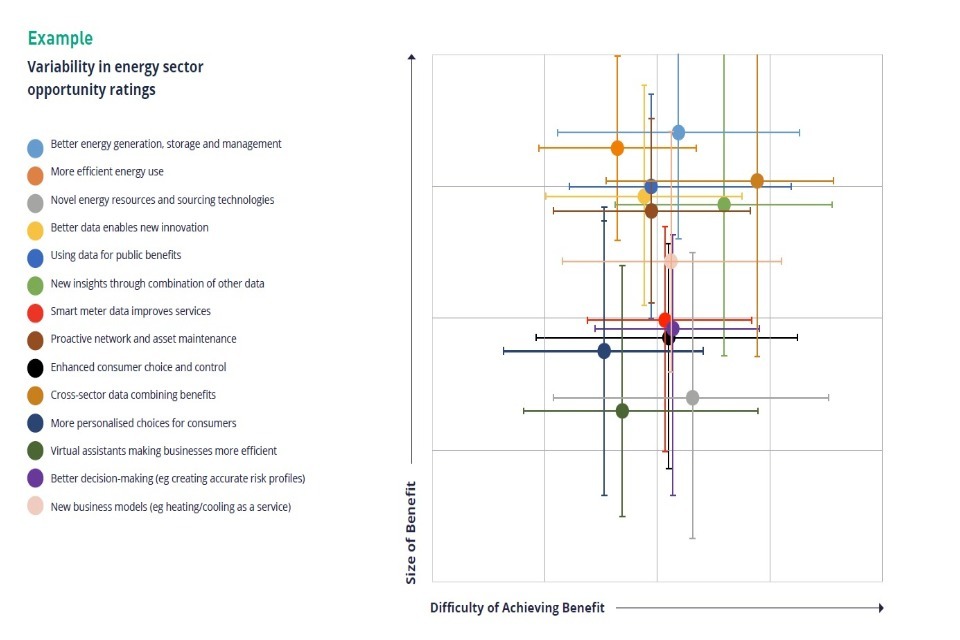
Sector Workshops - Example
An example of our sector workshops. Variability in energy sector opportunity ratings.
69. 8. Methodological Reflections
69.1 Survey design
Workshop discussion of the survey process highlighted the difficulty of making judgements against apparently simple criteria, given the scope for interpretation of the terms ‘likelihood’ and ‘impact’. For example:
*Potential impacts on individuals, groups, organisations, the economy, and wider society are often very different.
-
Issues are deeply interconnected, so some were hard to consider independently.
-
The overlap between the concepts of likelihood and frequency caused some panellists difficulty. For example, something might be 100% certain to happen 1% of the time or have a 2% chance of happening 50% of the time.
Panellists suggested that in future iterations it could be useful to validate the survey participants’ responses to see if their answers were probabilistically coherent - for example, did they consistently pick Risk A over Risk B, over Risk C.
For future iterations, we may consider using a Delphi exercise or similar method for developing the risk statements collaboratively with our panels.
69.2 Survey analysis
-
Including common risk statements across sectors helped to highlight similarities and differences in attitudes to different risks in-context, for example, algorithmic bias was consistently concerning across all sectors, but the risk to trust in AI was only seen as a major issue in certain sectors like health and energy.
-
We tried applying a variety of different typologies to the survey results, and settled on one focused around thematic issues. We also attempted clustering by application or underlying technology, but this only tended to provide useful insights in sectors with relatively few AI application types, such as Criminal Justice.
69.3 Workshop design
-
Using risk and opportunity statements gave a clear focus for workshop discussion around the issues emerging as most significant. However, having a common understanding of precisely the issues being discussed proved important, as panellists often carried varying definitions of key terms and issues.
-
Some ‘surprises’ in the survey results helped provoke rich discussion in the workshops regarding how risks occur and how they are presently mitigated in sector - for example, the low ranking of the ‘accuracy’ risk in the Health and Social Care workshop resulted in an extended discussion on why panellists ranked it the way they did.
-
With more time, the panels could have helped to generate risk and opportunity statements more comprehensively, although an advantage of our approach was that panel members were forced to consider risks that may not have been ‘top of mind’ for them.
-
Many of the potential societal or person-centric benefits of AI and data use were not particularly prominent in the literature or policy narrative, but emerged at the workshops.