Below Average Resources: Developing a new poverty measure
Updated 18 April 2024

© Crown copyright 2024
This publication is licensed under the terms of the Open Government Licence v3.0 except where otherwise stated. To view this licence, visit nationalarchives.gov.uk/doc/open-government-licence/version/3 or write to the Information Policy Team, The National Archives, Kew, London TW9 4DU, or email: psi@nationalarchives.gov.uk.
Where we have identified any third party copyright information you will need to obtain permission from the copyright holders concerned.
This publication is available at https://www.gov.uk/government/statistics/below-average-resources-developing-a-new-poverty-measure/below-average-resources-developing-a-new-poverty-measure
1. Introduction
The Department for Work and Pensions (DWP) is developing a new poverty measure named ‘Below Average Resources’ (BAR) based on the approach proposed by the Social Metrics Commission (SMC).
The Office for Statistics Regulation (OSR) Review of Income-Based Poverty Statistics recommended that the DWP assess how the SMC’s proposals can be implemented to enhance the public value of our statistics. The OSR recognised that a basket of main poverty measures is required to meet varying user needs, but that signposting and coherence between different statistics could be improved to help users navigate the varying measures.
The DWP publishes Households Below Average Income (HBAI) National Statistics annually, with analysis based on data from the Family Resources Survey (FRS). These statistics estimate the number and percentage of individuals living in low-income households in the UK. Measures of material deprivation and household food security are also included in the HBAI publication to provide a broader view on aspects related to poverty. The HBAI publication meets the DWP’s statutory obligation to publish a measure of relative and absolute low income for children, and low income and material deprivation for children under section 4 of the Welfare Reform and Work Act 2016.
Once fully developed, the BAR measure will add value alongside these existing DWP measures. The BAR approach provides a more expansive view of available resources (both savings and inescapable costs) than the income measurement adopted under HBAI, and also includes some methodological changes proposed by the SMC. A summary of key differences between the BAR approach as currently realised, the full BAR approach as proposed by the SMC and HBAI are shown in Table 1. The comparisons with HBAI in Table 1, and throughout this report, focus on relative low income after housing cost estimates, as this approach is closest to the BAR measure. Comparisons with absolute low income on an after housing costs basis are also provided in the published data tables that accompany this release.
Table 1 – Key differences between the BAR measure as it is currently realised, the intended realisation of the BAR measure as proposed in the SMC framework and methodology for HBAI relative low income after housing costs
Table: Data source and Geographical coverage
| Below Average Resources as currently realised (in this publication) | Below Average Resources as proposed in SMC framework (full intended measure) | HBAI relative low income after housing costs | |
|---|---|---|---|
| Data source | Family Resources Survey | Family Resources Survey, Understanding Society | Family Resources Survey |
| Geographical coverage | United Kingdom (UK) from Financial Year Ending (FYE) 2003, Great Britain (GB) FYE 2001 to 2002 | UK from FYE 2003, GB FYE 2001 to FYE 2002 | UK from FYE 2003, GB FYE 2001 to FYE 2002 |
Table: Measuring resources
| Measuring resources | Below Average Resources as currently realised (in this publication) | Below Average Resources as proposed in SMC framework (full intended measure) | HBAI relative low income after housing costs |
|---|---|---|---|
| Income | Weekly net income | Weekly net income | Weekly net income |
| Assets | Liquid assets, divided by (365/7) to create a weekly measure | Liquid assets, divided by (365/7) to create a weekly measure | Not used |
| Inescapable costs – housing | Weekly housing costs, including full reported mortgage interest and capital repayments | Weekly housing costs, including full reported mortgage interest and capital repayments | Weekly housing costs, including imputed mortgage interest for those on repayment mortgages, but does not include mortgage capital repayments |
| Inescapable costs – childcare | Actual weekly spending on childcare used | Actual weekly spending on childcare used | Not used |
| Inescapable costs – disability | Proxy measure from weekly DLA/PIP/AA received | A more comprehensive approach required (but needs to be developed) | Not used |
| Inescapable costs – debt | Not yet included – but intended to be when data available | Intended to be included (but not yet due to data availability) | Not used |
| Other inescapable costs | Not included (for future consideration) | Not included – but mentions other costs including social care costs, energy, healthcare, travel-to-work etc could be considered. | Not used |
Table: Measuring needs
| Measuring needs | Below Average Resources as currently realised (in this publication) | Below Average Resources as proposed in SMC framework (full intended measure) | HBAI relative low income after housing costs |
|---|---|---|---|
| Benchmark for social norms | Three-year rolling average of median weekly total resources available (TRA) | Three-year rolling average of median weekly TRA | Median of weekly net income, taken each year |
| How needs vary by different households | Equivalisation by OECD modified scale (AHC) | A more representative measure required (but needs to be developed) | Equivalisation by OECD modified scale (AHC) |
Table: Comparing resources and needs
| Comparing resources and needs | Below Average Resources as currently realised (in this publication) | Below Average Resources as proposed in SMC framework (full intended measure) | HBAI relative low income after housing costs |
|---|---|---|---|
| Unit of assessment | Sharing unit (also referred to interchangeably as family unless stated otherwise). Defined as individuals within a household who are related. | Sharing unit (also referred to interchangeably as family). Defined as individuals within a household who are related. | Household |
| Poverty threshold | 54% of benchmark for social norms (TRA) – set at a threshold to match the number of individuals in relative low income AHC (HBAI) poverty in FYE 2017. (Note: in practice the numbers for FYE 2017 on BAR and relative low income AHC do not match exactly, due to methodological revisions since the SMC approach was first determined, which have caused some deviation but not sufficiently to revise the basis for the threshold) | 54% of benchmark for social norms (TRA) – set at a threshold to match the number of individuals in relative low income AHC (HBAI) poverty in FYE 2017. If further changes are made to the methodology which significantly affect the number of individuals in poverty in FYE 2017, the threshold will be adjusted so the number of individuals in poverty remains consistent with relative low income AHC for FYE 2017 | 60% of benchmark for social norms (net AHC income) |
| Accounting for overcrowded households | For an overcrowded household, the regional cost of renting a room at the prevailing market rate is deducted from the family’s TRA | For an overcrowded household, the regional cost of renting a room at the prevailing market rate is deducted from the family’s TRA | Not used |
Table: Understanding the nature of poverty
| Understanding the nature of poverty | Below Average Resources as currently realised (in this publication) | Below Average Resources as proposed in SMC framework (full intended measure) | HBAI relative low income after housing costs |
|---|---|---|---|
| Rough sleepers adjustment | No adjustment included as current methodology does not lead to changes in overall poverty levels | Total number of rough sleepers added to total estimate of those in poverty. Further examination of groups missing from household surveys still to be considered | Not used |
| Poverty depth | Full reporting of the position of families with respect to the poverty line – both those in poverty and those above the poverty line | Full reporting of the position of families with respect to the poverty line – both those in poverty and those above the poverty line | No formal measure used. |
| Poverty persistence | Not used in current publication (for future consideration) | Persistent poverty defined as being in poverty this year and any two of the previous three years (Eurostat and ONS definition). Analysis based on Understanding Society data. | Reported in a separate publication, Income Dynamics, as being in poverty in any three of the previous four years. Analysis based on Understanding Society data. |
| Lived Experience Indicators | Not used in current publication (for future consideration) | Identification, analysis and publication of a wide range of factors that reveal the experiences of individuals in poverty and the potential pathways in to and out of poverty | No assessment |
Diagram 1 shows how the new BAR measure will sit alongside existing DWP measures, highlighting the relative trade-off between increasing the coverage of what is captured by the measure against increased data and analytical requirements with implications for robustness and complexity of the approach.
Diagram 1 – Below Average Resources situated against related DWP poverty measures

Diagram 1 shows the relationship between the Below Average Resources (BAR) measure and other DWP poverty related statistical measures. The diagram shows that under poverty related measures there are currently the Households Below Average Income (HBAI) statistics, poverty persistence measures (published in the Income Dynamics statistics available on gov.uk) and improving lives indicators (published in the Improving Lives publication available on gov.uk). The poverty persistence statistics are related to the poverty persistence elements of the poverty measurement framework proposed by the SMC but are not included in the current publication. The improving lives indicators statistics are related to the lived experience indicators elements of the poverty measurement framework proposed by the SMC, but are not included in the current publication. Under the HBAI statistics, there are three measures highlighted – relative poverty, absolute poverty and material deprivation. Under absolute poverty there are before and after housing costs measures. Under relative poverty there are before and after housing costs measures. The diagram shows that the BAR poverty rate and depth measures are related to the relative poverty after housing costs measures. The diagram also shows BAR potential advantages as:
-
More expansive view – accounts for greater range of income sources and inescapable costs.
-
Stronger correlation with other poverty measures like material deprivation and food insecurity.
The diagram shows BAR potential limitations as:
-
Increased data collection needed for some components. Respondent burden and data quality concerns.
-
Greater complexity: Some measures of costs don’t account for unmet need or choice on quality. Determining what is ‘inescapable’.
-
Limitations on assumptions of asset use behaviour.
-
Timescales to develop the measure and establish consistent time series.
There is significant development work required to test the robustness and further develop different components of the BAR measure. The new measure will be developed by the DWP through a series of Official Statistics in Development (previously called ‘Experimental Statistics’) publications.
Official Statistics in Development are Official Statistics that are undergoing development or evaluation; they may be new or existing statistics, and will be tested with users, in line with the standards of trustworthiness, quality, and value in the Code of Practice for Statistics. The DWP will seek user feedback alongside the publications to inform the ongoing development of the statistics to enhance their public value.
This new Official Statistic in Development is named Below Average Resources for consistency with HBAI terminology but to reflect its broader approach. Below Average Resources considers the resources available to families (through income and savings after deductions due to outgoings and inescapable costs) to meet their immediate needs. The DWP will review the suitability of this name and seek user feedback as the measure continues to be developed.
In this first publication, an overarching summary is presented with:
- an initial overview of the approach proposed by the Social Metrics Commission to provide an introduction (for context ahead of the BAR and HBAI comparisons)
- comparison of estimates of Below Average Resources (BAR) and income (HBAI) for FYE 2001 through to FYE 2022. This illustrates where the new BAR approach suggests differences for poverty trends
- more detailed and technical discussion of the BAR components and methodology, highlighting where these differ from HBAI and isolating the impact of different elements, to seek feedback on how these should be developed in future
The analysis presented in this publication builds on that published by the Social Metrics Commission, and the DWP in the HBAI and FRS publications. Further detail and signposting to these is provided in the accompanying background and methodology document. Detailed methodological information on the surveys and variables used, including coverage, robustness and consistency over time can be found in the associated documentation for these reports.
Published data tables are also provided alongside this report. For ease of cross-reference between this report and the tables, figures and tables have been numbered consistently. For example, data underlying Section 3 of this report can be found in the Section 3 data tables ‘Comparisons of the Low Resources measure with Relative and Absolute Low Income after housing costs’ accompanying this publication. Report figure numbers correspond to the data sheets in these tables (for example, Figure 3.1 relates to sheet 3_1; whilst Figures 3.2.1 to 3.2.3 all relate to sheet 3_2).
Consultation information
The analytical consultation ran from 18 January to 11 April 2024, and has now closed. We will publish a response to the feedback we received from users by 4 July 2024.
The first statistical consultation on the BAR measure is being launched with this publication.
DWP welcomes user feedback on the material presented and on how the DWP can continue to develop the measure to provide the most value to users. User feedback will help inform the ongoing testing and future development of the measure.
Feedback is welcomed from all potential users of the statistics. Users are welcome to engage with all or any parts of the consultation as deemed relevant. Numbered consultation questions are included throughout this publication. Users are encouraged to provide explanations and links to any supporting evidence as part of their consultation response.
The consultation runs from 18 January to 11 April 2024. A consultation response will be published within 12 weeks of the consultation closing, setting out next steps and timescales.
2. Social Metrics Commission approach
The Social Metrics Commission
The Social Metrics Commission (SMC) is an independent commission formed in 2016 with the aim of developing a new approach to poverty measurement that better reflects the nature and experiences of poverty that different families in the UK have, and that can be used to build a consensus around poverty measurement and action in the UK.
In September 2018, the SMC published their report ‘A New Measure of Poverty in the UK’ in which they proposed a new method for measuring poverty. The SMC have subsequently published further reports incorporating more recent data and proposing further methodological refinements.
Overview of measurement framework
The Social Metrics Commission (SMC) focuses on ‘poverty now’, that is the extent to which families have resources currently available to meet immediate needs. The resources available to the family are calculated on a weekly basis, similarly to how incomes are calculated on a weekly basis in the DWP’s HBAI publication. The overarching measurement framework proposed by the SMC is set out in Diagram 2, with further explanation below.
Diagram 2 – The overarching measurement framework proposed by the SMC (Boxes 1, 2 and 3. These are sequential, with Box 1 actions followed by Box 2 and then Box 3, but are displayed separately here for interpretability)
Box 1 – Total Resources Available (TRA) calculation

Box 1: This diagram shows the Total Resources Available (TRA) calculation. It shows that TRA is calculated as Net Income, plus Other resources available i.e. Weekly measure of liquid assets, minus Inescapable family-specific costs i.e. childcare, disability, recurring hosing costs, others that require further research, minus Debt i.e. obligated weekly debt repayments. The debt information is greyed out to demonstrate that it is not used in the current realisation of the measure due to a lack of suitable data.
Box 2 – Estimating poverty based on Total Resources Available

Box 2: This diagram shows how the poverty threshold is calculated and the overcrowding adjustment applied. The diagram shows that the Total Resources Available (TRA) values from three years (t, t-1, t-2) are equivalised. The smoothed equivalised median TRA (averaged across three years) is then calculated and the poverty threshold calculated from this as 54% of the smoothed equivalised median TRA. Family specific poverty thresholds are then calculated using reverse equivalisation. After this, for those in overcrowded housing, their TRA is calculated as their TRA minus the cost of renting an additional room. Every family’s TRA is then compared to their poverty threshold to determine poverty status.
Box 3 – Wider measurement framework

Box 3: This diagram shows the wider measurement framework of the measure as proposed by the SMC. It shows that rough sleepers are added to the total number of people in poverty. It also shows that the poverty depth, poverty persistence and lived experience indicators sit alongside the measure of the number of people in poverty.
Total Resources Available
Box 1 (Diagram 2) shows the calculation of the Total Resources Available (TRA). The calculation of Net Income is on the same basis as for HBAI on an After Housing Costs (AHC) basis.
The TRA additionally accounts for other available resources from liquid assets (for example, accessible savings), deductions due to obligated debt repayments (though these are not included in the current realisation of the measure) and inescapable family-specific costs relating to childcare costs and extra costs of disability. Further inescapable family-specific recurring housing costs for mortgage capital repayments are also included, compared to HBAI AHC which includes only the interest element of mortgage repayments.
The TRA calculation is undertaken at the ‘sharing unit’ level (rather than at the household level, as for HBAI). A household consists of one person living alone or a group of individuals (not necessarily related) living at the same address, who share cooking facilities and share a living room or sitting room or dining area. The sharing unit is defined as individuals within a household who are related. Whilst narrower than a household, this new approach is wider than a ‘benefit unit’. A benefit unit includes a single adult, or a married or cohabiting couple, plus any dependent children. For further detail on benefit unit and household definitions see the FRS methodology report.
The sharing unit is based on anyone self-reporting being related to another individual in the household (for example, including foster, step, in law and other relatives). In the SMC’s reports, the sharing unit is referred to interchangeably with ‘family’ as is also the case in this publication.
The SMC propose the sharing unit approach improves upon the assumption that all individuals within a household share resources, because it allows for within household differences in living standards.
Estimating poverty based on Total Resources Available
Box 2 (Diagram 2) sets out the methodology for determining poverty estimates based on the Total Resources Available (TRA) calculated in Box 1 (Diagram 2).
The SMC propose a relative poverty measure, based on the position that poverty is experienced with reference to others in society as norms will change over time. However, the SMC also note that social norms and trends take time to adapt to changes in overall economic conditions, and therefore propose ‘smoothing’ the measure by calculating the poverty threshold based on a three-year average.
To calculate the poverty threshold, the TRA for sharing units is calculated for the current and previous two years. Each of these TRA estimates is then equivalised using the OECD modified AHC scale applied within HBAI, although the SMC note the need for work to develop a new, more suitable equivalisation approach in future which accounts for the impact of moving to a sharing unit and the new resource calculation. Please see the background and methodology report, and the links provided therein, for more detail on equivalisation. This is a standard methodology applied to allow comparison of living standards on a like for like basis after accounting for different financial requirements across families or households, due to different composition and size.
The equivalised median TRA estimates for each of the three years are then averaged to determine the smoothed median equivalised TRA (i.e. a lagged three-year rolling average of equivalised median TRA). The poverty threshold is determined based on whether individuals fall above or below a certain percentage of the smoothed median equivalised TRA.
For HBAI, estimates are published for thresholds based on 50%, 60%, and 70% of median income (though note HBAI does not apply the smoothing via three-year averaging). The SMC set their poverty threshold at 54% of smoothed median equivalised TRA. This threshold was chosen as it is the value that gives overall poverty estimates matching those of relative low income AHC (HBAI) for a chosen reference year of FYE 2017. The SMC adopted this approach because their aim was to create a measure that provided a more accurate picture of the composition of individuals in poverty and how both levels and composition change over time, and because it concluded that the choice of poverty thresholds is somewhat arbitrary.
However, in practice the numbers for FYE 2017 in poverty on BAR and relative low income AHC on HBAI do not match exactly, due to subsequent methodological revisions since the SMC approach was first determined. Whilst these methodological revisions have caused some deviation in numbers between the two measures, the SMC has not considered these to be significant enough to necessitate revision of the threshold. The SMC outlined considerations around future revisions to the threshold in their 2019 methodological report, which notes the intention to revise the threshold where refinements to the measure result in a significant change in numbers from FYE 2017 relative low income AHC levels on HBAI.
Individuals are defined as being in poverty in a particular year if their equivalised TRA for that year is below 54% of the smoothed equivalised median TRA (smoothed over that year and the two previous years). Under the BAR approach, this will be referred to as being in ‘low resources’, similarly to HBAI referring to being below the corresponding threshold as being in low income.
After this calculation, one further adjustment is made to account for housing adequacy. If individuals are classed as being in overcrowded accommodation (see background and methodology report for definitions), their TRA value is updated to deduct the regional cost of renting another room. If the equivalised TRA value falls below the poverty threshold after this adjustment has been made, these individuals are also counted as being in poverty.
Wider poverty measurement framework
Box 3 (Diagram 2) sets out the wider poverty framework examined by the SMC based on the outputs from the estimation of poverty in Box 2 (Diagram 2). The SMC aim to not only develop a new measure of who is considered to be in and out of poverty, but to also understand the nature and experience of poverty through considering poverty depth, poverty persistence and lived experience indicators.
Poverty depth considers the position of individuals relative to the set poverty threshold, for both those who are above and below the threshold to give a more detailed view of the extent of poverty. This is argued to be particularly important given the somewhat arbitrary nature of determining the poverty threshold itself.
Persistent poverty is defined by the SMC as an individual being in poverty in the year in question, in addition to two out of three years prior to that. Note that this is slightly different to the definition of persistent low income in the DWP’s Income Dynamics statistics, which also form part of the DWP’s statutory requirement for reporting on children living in low income households. The Income Dynamics statistics define an individual as being in persistent low income if they are in low income in at least three of four years but doesn’t specify the current year. The SMC’s definition is, however, consistent with that used by Eurostat and reported on by the Office for National Statistics.
The SMC’s lived experience indicators analysis looks at the association between a range of factors (under domains of: family, relationships and community; education; health; family finances; and labour market opportunity) with the experience of being in poverty or not according to the measure. This analysis seeks to deepen understanding of the experience of poverty and broaden understanding of the potential tools available to address it. Further detail on the lived experience indicators proposed by the SMC can be found in the SMC publications.
Finally, the SMC note that the reliance on household surveys to develop the estimates means that certain groups are underrepresented or not represented at all. For this reason, they count all individuals who are sleeping rough according to official statistics as also being in poverty, but note the need for further work to consider how best to capture wider groups not represented in household surveys.
The DWP’s proposed approach
Developing the Below Average Resources (BAR) measure will add value alongside DWP’s existing poverty related measures on income, material deprivation and household food security by adding a more expansive view of resources available.
The SMC note that there is significant further development work required to implement their framework as envisaged. In some cases, data has not been available at all (for example, debt) and in others a proxy approach (for example, disability costs) employed as a starting point, and substantial methodological developments are still required (for example, proposal for a new equivalisation approach).
In developing this measure, the DWP is committed to testing the robustness of the overall approach and its component parts, further developing this where required, and actively seeking user feedback in line with the Code of Practice for Statistics to inform this development.
The components of the overarching framework set out in Boxes 1 and 2 (Diagram 2) are all produced using data from the Family Resources Survey (FRS), as is the poverty depth analysis (Box 3, Diagram 2). The poverty persistence and lived experience indicators analysis additionally require data from Understanding Society.
Through these Official Statistics in Development publications, the DWP will focus on development of the measure using the FRS data initially. It is essential to develop a robust core measure (focusing on Boxes 1 and 2, Diagram 2), with significant further development work required to achieve this. This will be necessary ahead of any further work to consider the wider measurement framework components, such as poverty persistence and lived experience indicators, as well as potential changes to wider data sources.
Consultation question 1: Do you have any comments on the value of the Overarching Measurement Framework proposed by the SMC, and how you would like to see this developed in future?
Consultation question 2: Do you think that there is value in the DWP continuing to develop the Below Average Resources measure, based on the SMC approach, to sit alongside existing related poverty measures?
Consultation question 3: What value would this measure add from your perspective as a user?
Consultation question 4: What would be your priorities for development?
Consultation question 5: Is there value in the DWP developing the Poverty Persistence work in the longer-term, and what would it add for you as a user?
Consultation question 6: Is there value in the DWP developing the Lived Experience Indicators work in the longer-term, and what would it add for you as a user?
Consultation question 7: Do you agree with the Lived Experience Indicator domains (family, relationships and community; education; health; family finances; and labour market opportunity) proposed by the SMC? Are there any you would add or remove? If so, what are these and why?
Consultation question 8: From a user perspective, how should it be judged whether this measure has achieved its ambition to be a robust measure of poverty which adds new insight and value to existing measures? What would be your key criteria for success?
Consultation question 9: Please provide any additional comments you have on the content of this section.
3. Below Average Resources and Income comparisons
Poverty Trends
Key trends based on the Below Average Resources (BAR) and Households Below Average Income (HBAI) measures of poverty are presented here, showing estimates for those in low resources and low income respectively. Underlying data and further breakdowns are provided in the published data tables.
It is important to note that the BAR estimates presented throughout this publication match those published by the SMC for the period up to FYE (Financial Year Ending) 2022 and are based on the current realisation of the measure (see Table 1). As set out above, there is significant further development work required to test the robustness of the measure and refine the approach. As this work develops, the estimates presented here are likely to change and be updated over time until a final approach is agreed.
As referenced previously, the HBAI estimates provided are for relative low income after housing costs (AHC), given that this is the closest HBAI measure to the BAR approach. Both are relative measures accounting for housing costs, with BAR additionally accounting for liquid assets (i.e. accessible savings) as a form of income, and other deductions due to inescapable costs (i.e. childcare, disability and mortgage capital repayments), as well as the methodological changes including the use of a sharing unit instead of household sharing assumptions set out above (Box 2, Diagram 2). Comparisons with absolute low income AHC cost estimates from HBAI against the BAR measure are also provided in the published data tables.
The period covered by this report contains statistics up to FYE 2022. This covers the end of the COVID-19 pandemic and the start of increased inflationary pressures but not subsequent cost-of-living issues.
Estimates for FYE 2021 are not presented where there are concerns about the impact of the coronavirus (COVID-19) pandemic on data quality and consistency. Detailed analysis of the potential impact on data quality for HBAI for FYE 2021 is provided in the technical report published alongside the statistics. Interpretation of any estimates presented for FYE 2021 should be treated with some caution.
Where data allows, time series are presented back to FYE 2001 to allow comparison over a significant period. In line with the Family Resources Survey (FRS) coverage, the time series refer to Great Britain (GB) for FYE 2001 to FYE 2002, and to the United Kingdom (UK) for the period FYE 2003 onwards.
All individuals
Figure 3.1: Percentage of individuals in low resources (BAR) and low income (HBAI) for all individuals, FYE 2001 to FYE 2022
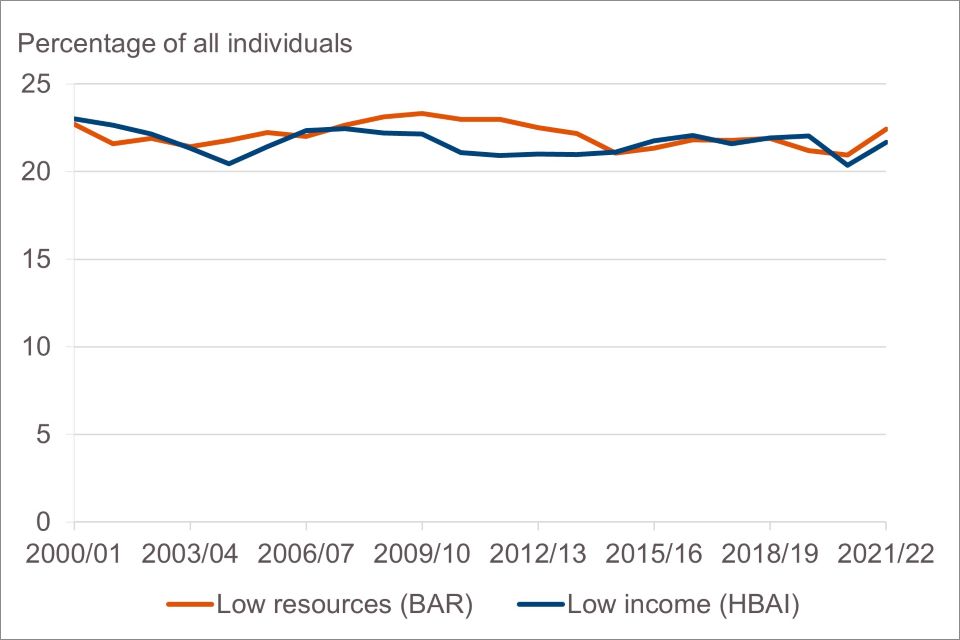
The percentage of individuals in low resources and low income was 22% on both measures in FYE 2022. The poverty rates for all individuals have been relatively stable since FYE 2001 on both measures, fluctuating within a range of 20% and 23%. The similarity between the two measures here reflects the methodological decision by the SMC to set the poverty threshold at a level that would match the estimates of the number of individuals in relative low income AHC on HBAI in FYE 2017. The SMC aimed to change the understanding of the composition of poverty rather than to significantly change the understanding of overall levels of poverty, which is reflected in these trends.
There is greater deviation between the low resources and low income estimates for the period FYE 2009 to FYE 2014. Analysis presented below suggests this may partly be explained by the smoothing approach (for the poverty threshold over three years) applied within the low resources estimate, which makes the measure less immediately sensitive in financial downturns and which is not accounted for in the HBAI approach.
Age Group
Figure 3.2.1: Percentage of individuals in low resources (BAR) and low income (HBAI) for Working age, FYE 2001 to FYE 2022
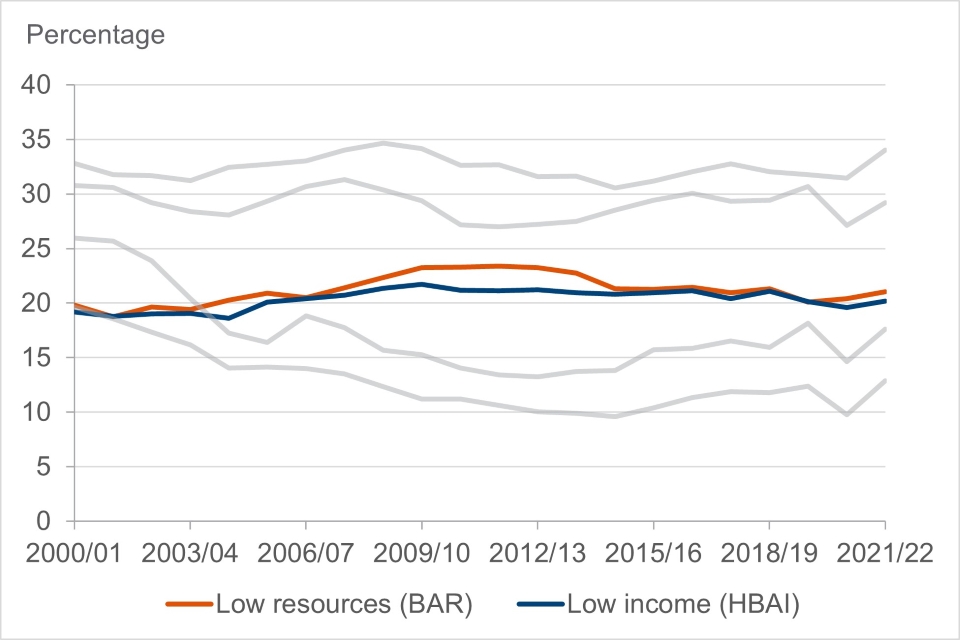
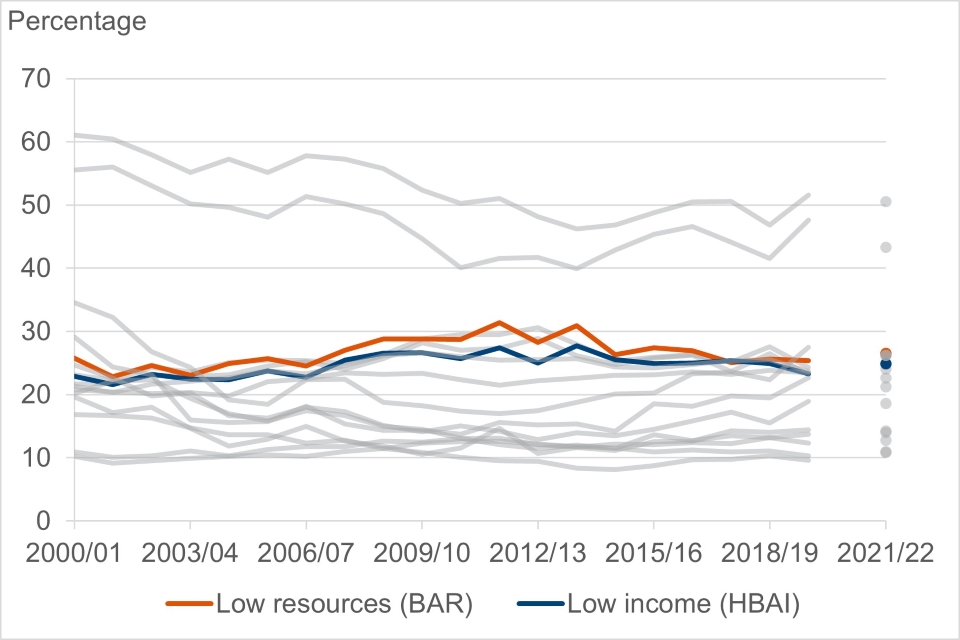
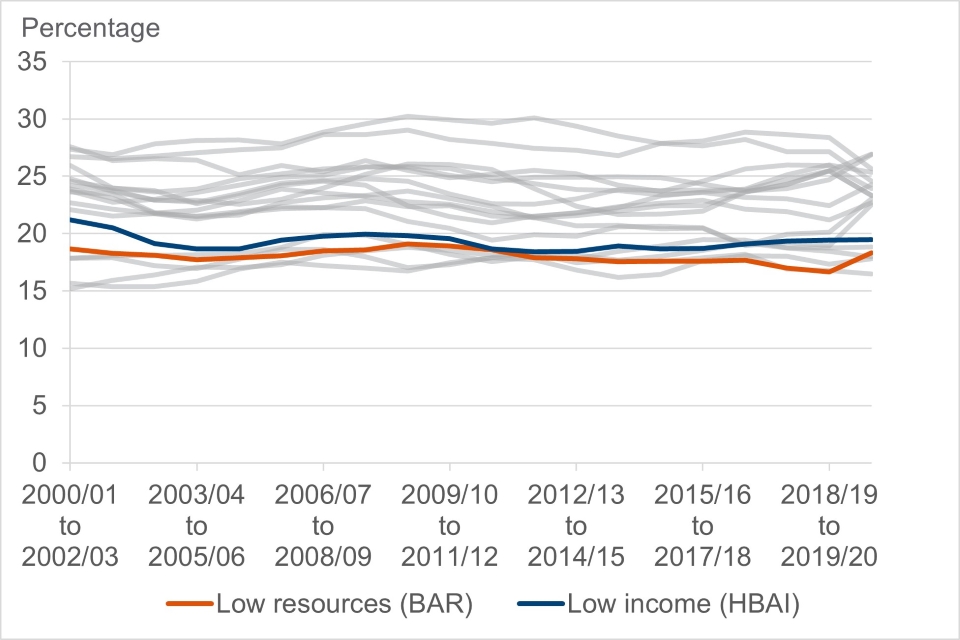
Figure 3.2.2: Percentage of individuals in low resources (BAR) and low income (HBAI) for Children, FYE 2001 to FYE 2022
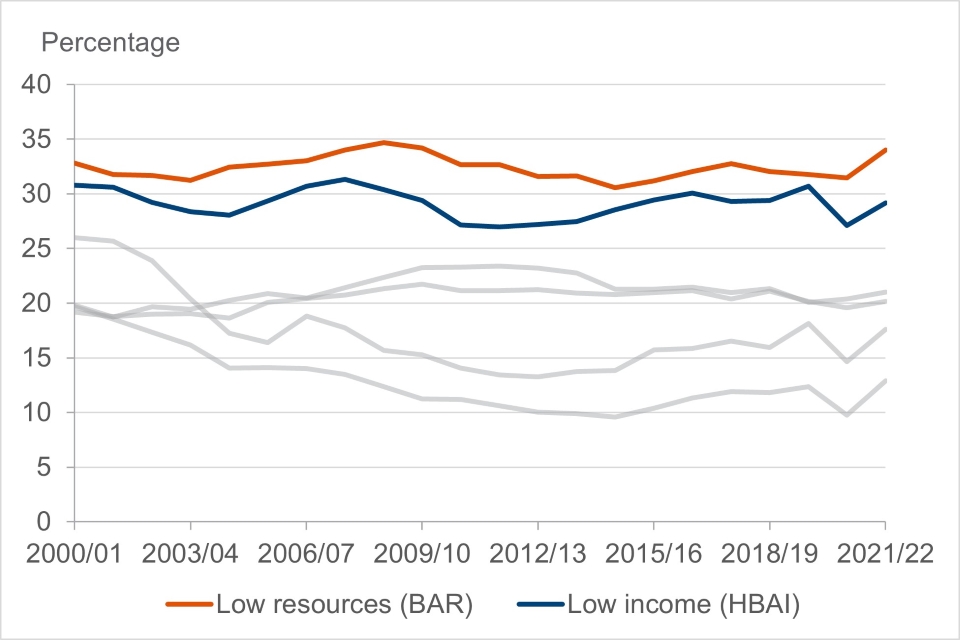
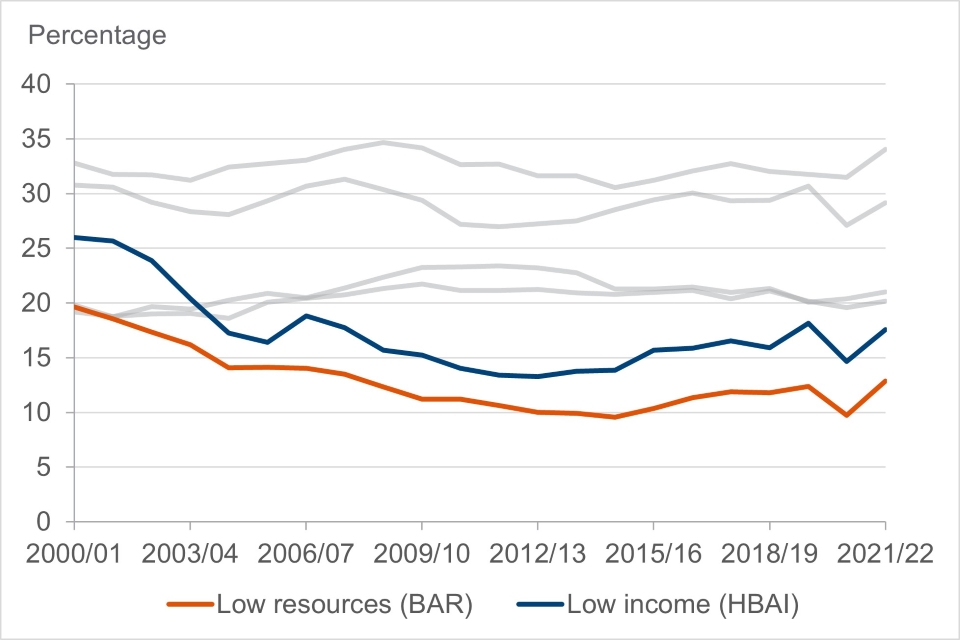
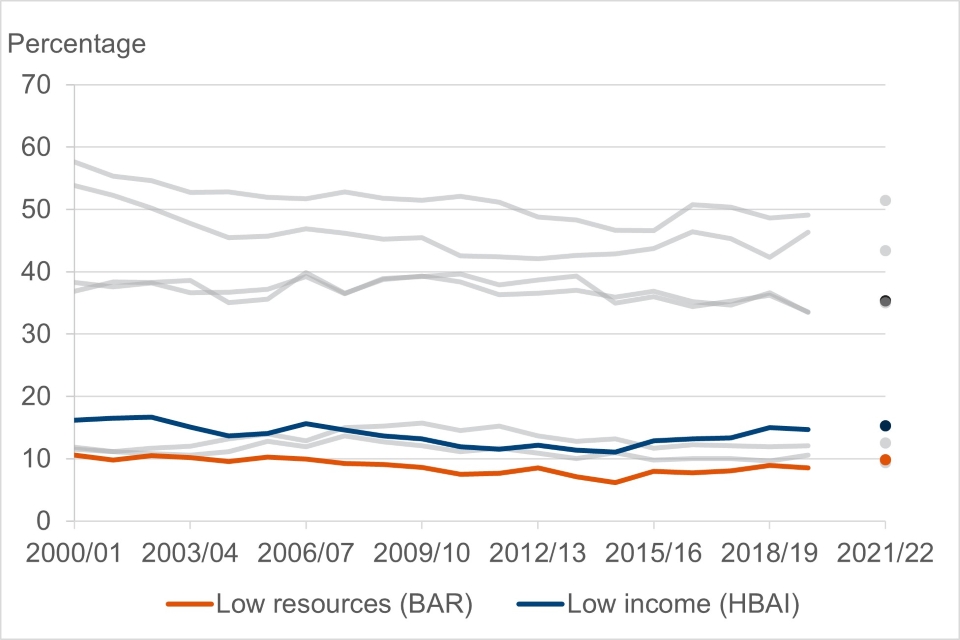
Figure 3.2.3: Percentage of individuals in low resources (BAR) and low income (HBAI) for Pensioners, FYE 2001 to FYE 2022
Age group figure notes (Figures 3.2.1 through to 3.2.3):
- grey lines are presented for comparison against other sub-groups on the same variable
- for example, the grey lines in Figure 3.2.1 relate to the estimates for children and pensioners
- this approach has also been adopted for relevant figures throughout the report
The trends for working age individuals on the low resources and low income measures are similar, with the exception of the more noteworthy difference for the period FYE 2009 to FYE 2014 as discussed above. In FYE 2022, 21% of working age individuals were in low resources compared to 20% in low income.
The percentage of children in low resources is higher than the percentage of children in low income throughout the period. In FYE 2022, 34% of children were in low resources, compared to 29% in low income. This suggests that more children are in poverty when taking a more expansive view of resources and inescapable costs faced by families, for example due to the inclusion of childcare costs.
For pensioners, a similar trend is observed across the two measures of declining poverty from FYE 2001 through to FYE 2016 when it started to increase again, although not to the same levels as for the start of the period.
Despite a similar trend for pensioner poverty, it is at lower levels on the low resources measure in comparison to low income. In FYE 2022, 13% of pensioners are in low resources compared to 18% in low income. This is largely driven by the inclusion of liquid assets (which are assumed to be depleted within one year) in the BAR measure. However, it’s worth re-stating here that debt has not yet been included within the current realisation of the measure, nor have costs such as social care which are likely to particularly affect this group.
Disability
Figure 3.3: Percentage of individuals in low resources (BAR) and low income (HBAI) by whether there is a disabled family member, FYE 2001 to FYE 2022
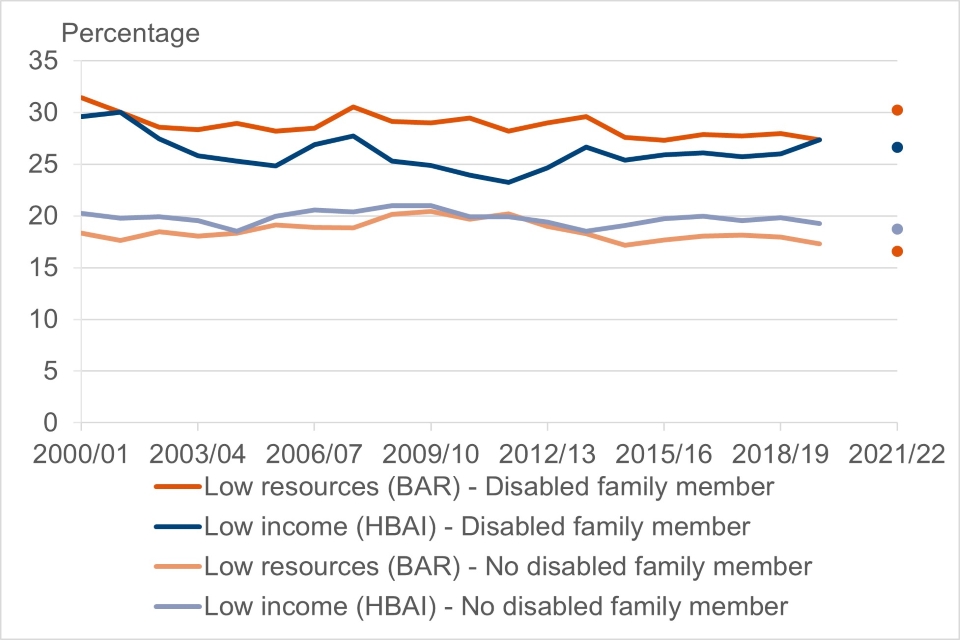
Figure notes:
- data is omitted for 2020 to 2021 due to data quality concerns
- for the low resources estimates, disability is at the sharing unit/family level. For the low income estimates, disability is at the benefit unit level for consistency with the HBAI publication. For further information on these differences, see the background and methodology note
A higher percentage of individuals in families with a disabled person are found to be in low resources than low income, across the period. Conversely, a lower percentage of individuals in families without a disabled person are generally found to be in low resources than in low income. Whilst individuals in families with a disabled person have higher poverty rates than individuals in families without a disabled person on both measures, the difference between the two groups is more pronounced on the low resources measure after accounting for additional income and costs, including the extra costs of disability.
In the FYE 2022, 30% of individuals in families with a disabled person were in low resources, compared to 27% in low income. Of individuals in families without a disabled person 17% were in low resources in FYE 2022 compared to 19% in low income.
Ethnicity
Figure 3.4.1: Percentage of individuals in low resources (BAR) and low income (HBAI) for White ethnic group, FYE 2015 to FYE 2022
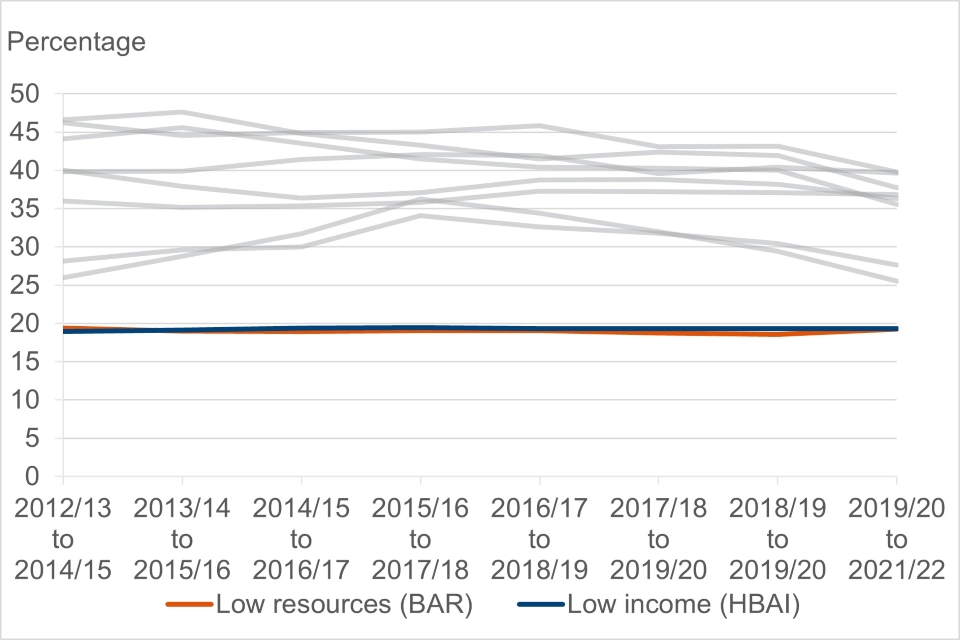
Figure 3.4.2: Percentage of individuals in low resources (BAR) and low income (HBAI) for Mixed Race ethnic group, FYE 2015 to FYE 2022
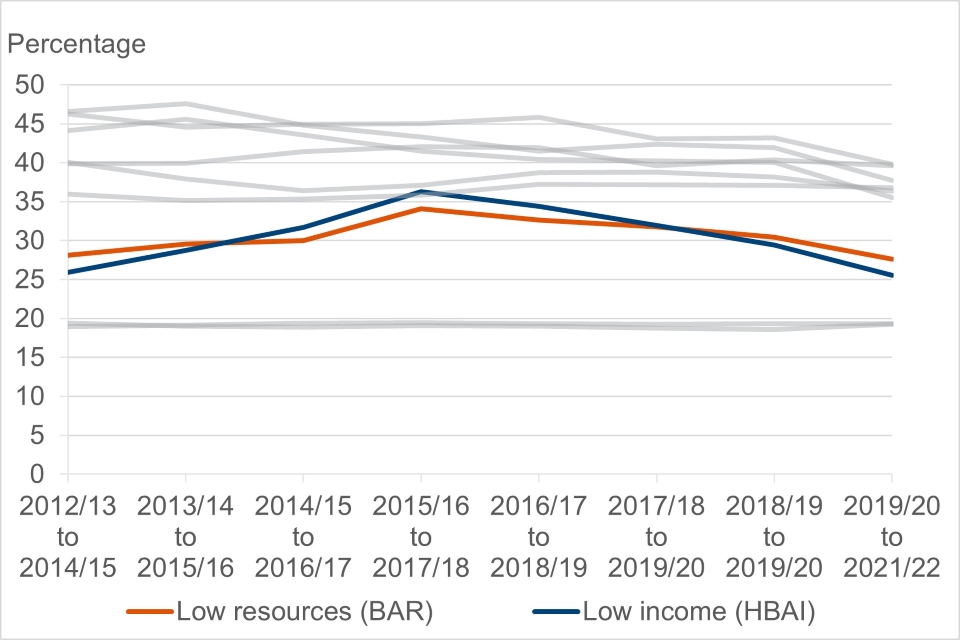
Figure 3.4.3: Percentage of individuals in low resources (BAR) and low income (HBAI) for Asian ethnic group, FYE 2015 to FYE 2022
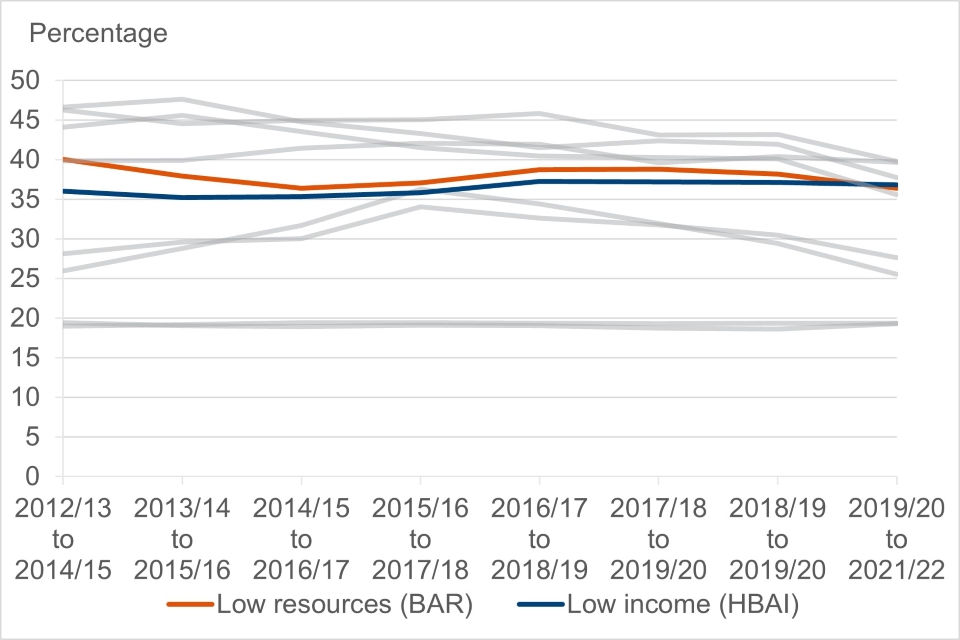
Figure 3.4.4: Percentage of individuals in low resources (BAR) and low income (HBAI) for Black ethnic group, FYE 2015 to FYE 2022
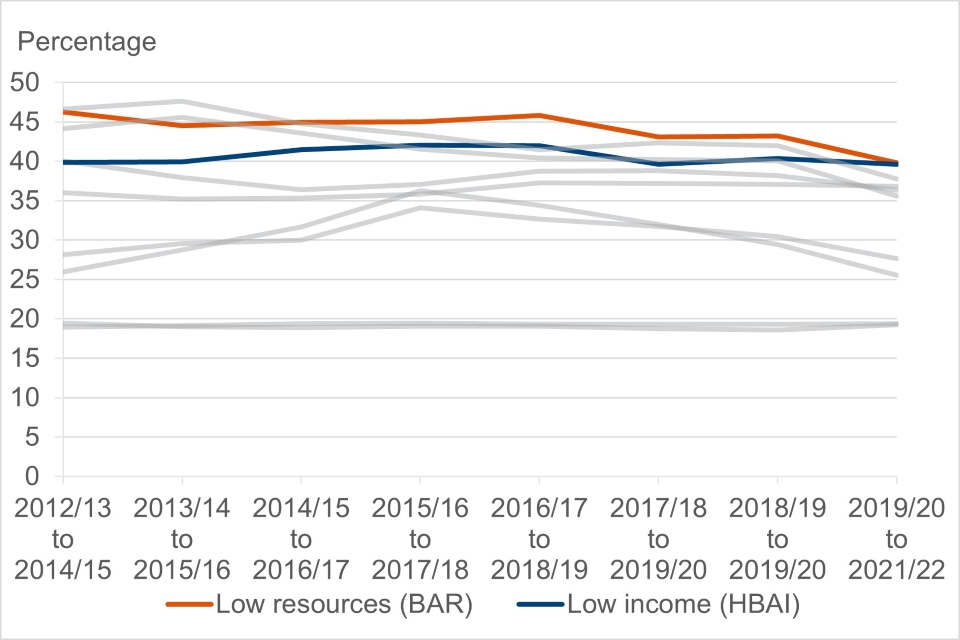
Figure 3.4.5: Percentage of individuals in low resources (BAR) and low income (HBAI) for Other ethnic group, FYE 2015 to FYE 2022
Ethnicity figure notes (Figures 3.4.1 through to 3.4.5):
- estimates are made using a three-year rolling average. This is an established method used to smooth out observed variation in single year estimates for these groups, which are subject to smaller sample sizes
- single year estimates for FYE 2021 were unavailable due to data quality issues. Therefore, the three-year averages encompassing that year (for example, three-year periods ending FYE 2021 and FYE 2022) are calculated with the single year FYE 2021 omitted, averaging across two years of data instead
- harmonised standards for ethnicity questions were fully adopted across the UK from 2012 to 2013. This combined with the three-year averaging means estimates start from the period ending FYE 2015
- ethnicity information is based on the head of the household
Higher poverty rates are shown for minority ethnic groups in comparison to the white ethnic group on both the low resource and low income measures. In general, this disparity becomes even more pronounced on the low resources measure except for the Mixed Race ethnic group where the picture is more mixed.
For the White ethnic group, the low resources and low income estimates are comparable over time.
For Black, Asian and Other ethnic groups, the percentage in low resources is typically higher than that found for the percentage in low income, suggesting higher poverty when accounting for wider resources and inescapable costs. However, for the period ending FYE 2022, the low resource and low income estimates appear to have converged for the Asian and Black ethnic groups, although these are based on two-year averages due to the omission of FYE 2021 data so should be treated with some caution.
For the Mixed Race ethnic group, the picture is more varied with fluctuating higher percentages in low resources or low income across the period, although the differences are quite small with the two at similar levels throughout.
For the period ending FYE 2022, the percentages in low resources were (from highest to lowest percentage):
- 40% for Black ethnic group (compared to 40% low income)
- 38% for Other ethnic group (36% low income)
- 36% for Asian ethnic group (37% low income)
- 28% for Mixed Race ethnic group (26% low income)
- 19% for White ethnic group (19% low income)
Benefit Unit Type
Figure 3.5.1: Percentage of individuals in low resources (BAR) and low income (HBAI) for Pensioner couples, FYE 2001 to FYE 2022
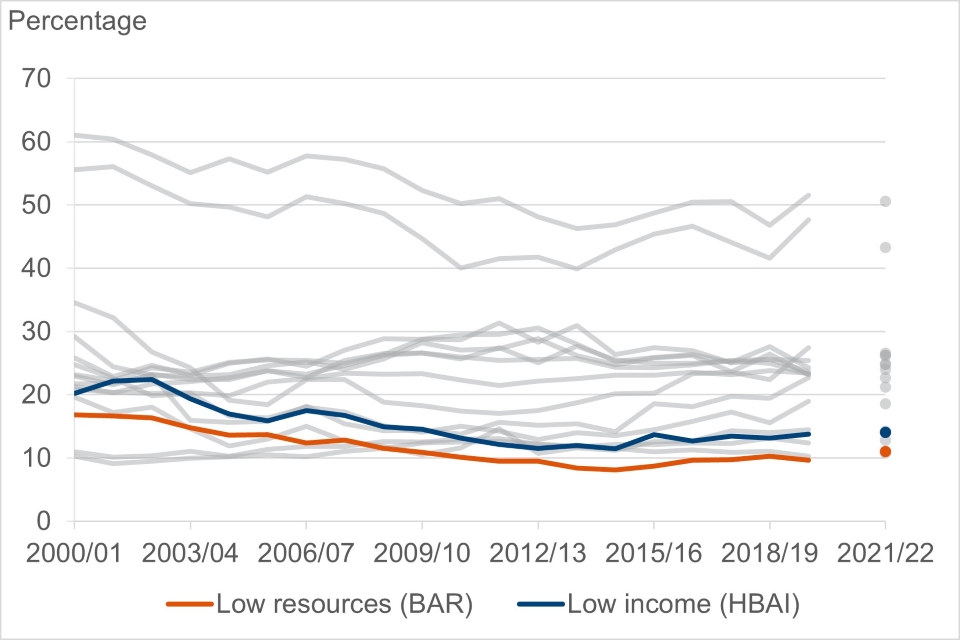
Figure 3.5.2: Percentage of individuals in low resources (BAR) and low income (HBAI) for Single male pensioners, FYE 2001 to FYE 2022
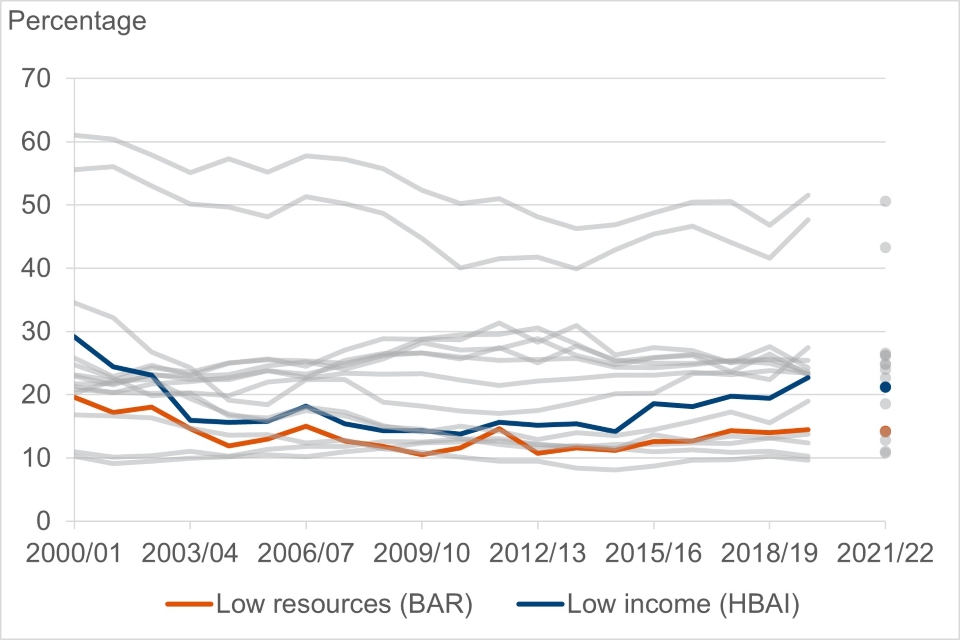
Figure 3.5.3: Percentage of individuals in low resources (BAR) and low income (HBAI) for Single female pensioners, FYE 2001 to FYE 2022
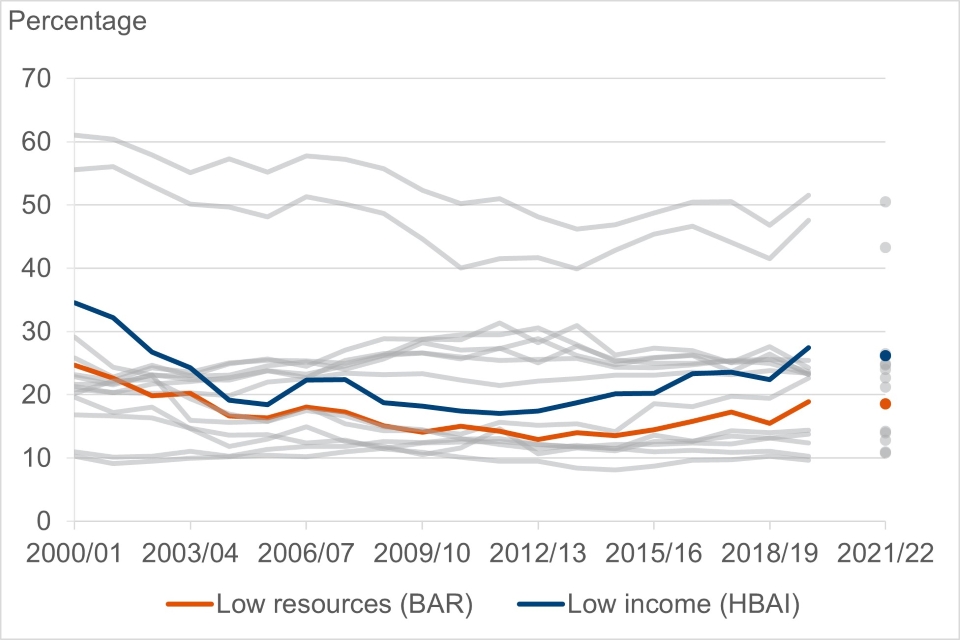
Figure 3.5.4: Percentage of individuals in low resources (BAR) and low income (HBAI) for Couples with children, FYE 2001 to FYE 2022
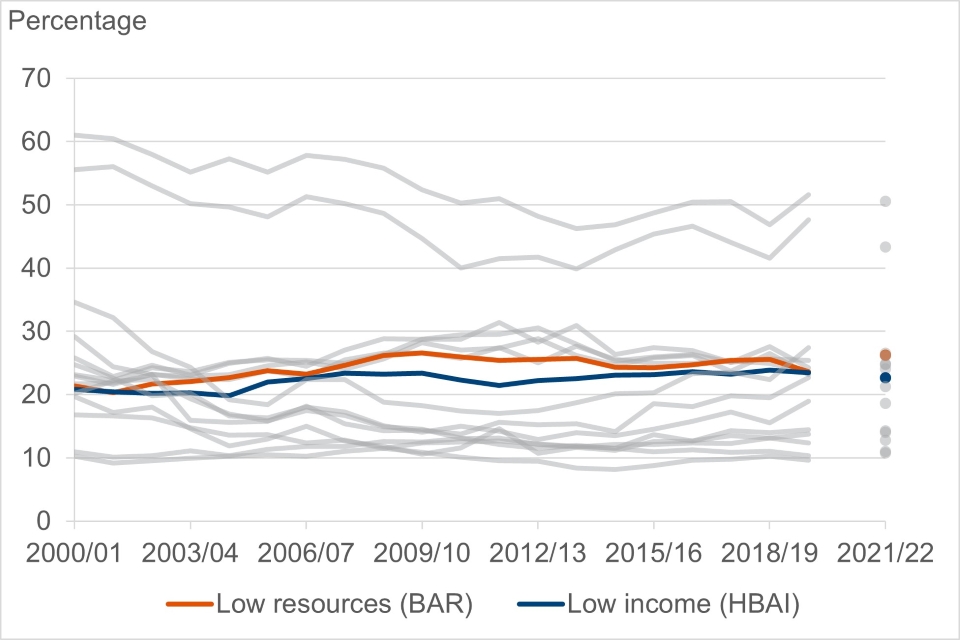
Figure 3.5.5: Percentage of individuals in low resources (BAR) and low income (HBAI) for Couples without children, FYE 2001 to FYE 2022
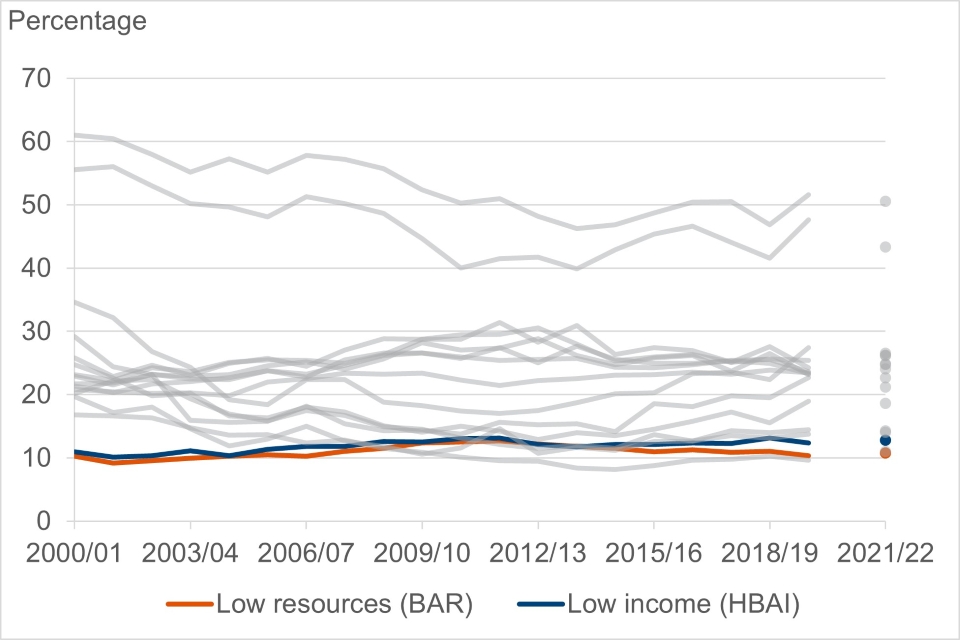
Figure 3.5.6: Percentage of individuals in low resources (BAR) and low income (HBAI) for Singles with children, FYE 2001 to FYE 2022
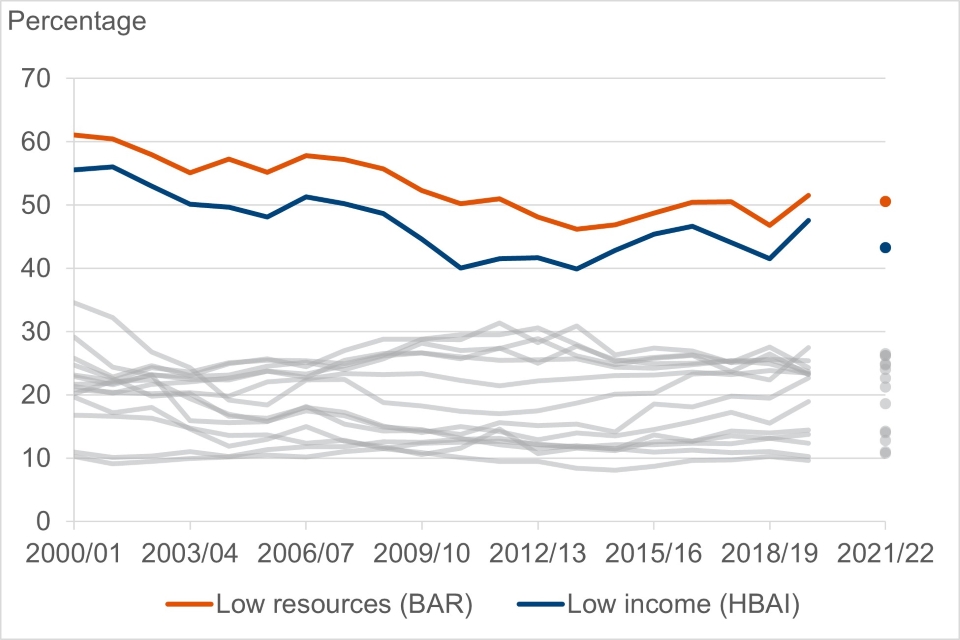
Figure 3.5.7: Percentage of individuals in low resources (BAR) and low income (HBAI) for Single males without children, FYE 2001 to FYE 2022
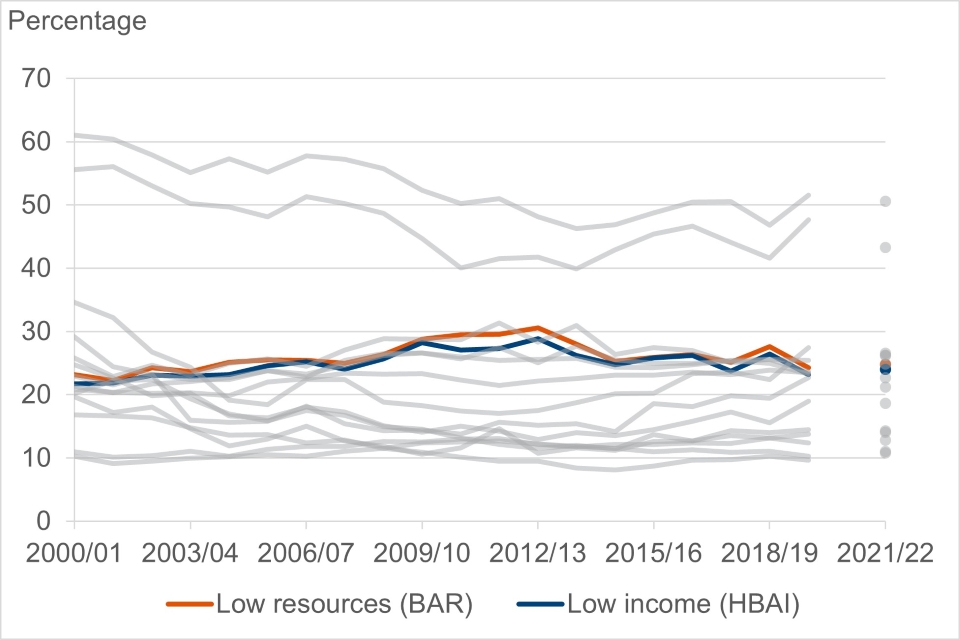
Figure 3.5.8: Percentage of individuals in low resources (BAR) and low income (HBAI) for Single females without children, FYE 2001 to FYE 2022
Benefit unit type figure notes (Figures 3.5.1 through to 3.5.8):
- data is omitted for 2020 to 2021 due to data quality concerns
- the figure refers to benefit unit type rather than family/sharing unit type. This is for consistency with how it is measured in the HBAI and SMC reports. However, we avoid reporting this as family, as in those reports, to avoid any conflation with the sharing unit definition of family used here
- see the background and methodology note for further detail on relevant definitions
The comparative poverty rate differentials between different benefit unit types are similar for the low resources and low income measures, and generally follow similar trends across the time period. For example, single individuals with children have the highest poverty rates on both measures, and the lowest poverty rates across both measures are typically seen for pensioner couples and couples without children.
Differences between the two measures can be seen when comparing poverty rates for the same benefit unit types. For both single and couple pensioners, the percentage of individuals in low income is higher than the percentage in low resources. This shows that the trends for pensioners seen above, of lower poverty on the low resources measure, hold even after considering single or couple status.
For couples with children and single males and females without children, the low resources measure of poverty is typically slightly higher than found for low income poverty; whilst there is little difference between the two measures for couples without children.
For single individuals with children, low resources poverty is notably higher than found on the low income measure.
In FYE 2022, the percentages in low resources were (from highest to lowest percentage):
- 51% for single individuals with children (compared to 43% low income)
- 27% for single females without children (25% low income)
- 26% for couples with children (23% low income)
- 25% for single males without children (24% low income)
- 19% for single female pensioners (26% low income)
- 14% for single male pensioners (21% low income)
- 11% for pensioner couples (14% low income), and
- 11% for couples without children (13% low income)
Housing Tenure
Figure 3.6.1: Percentage of individuals in low resources (BAR) and low income (HBAI) for Social rented, FYE 2001 to FYE 2022
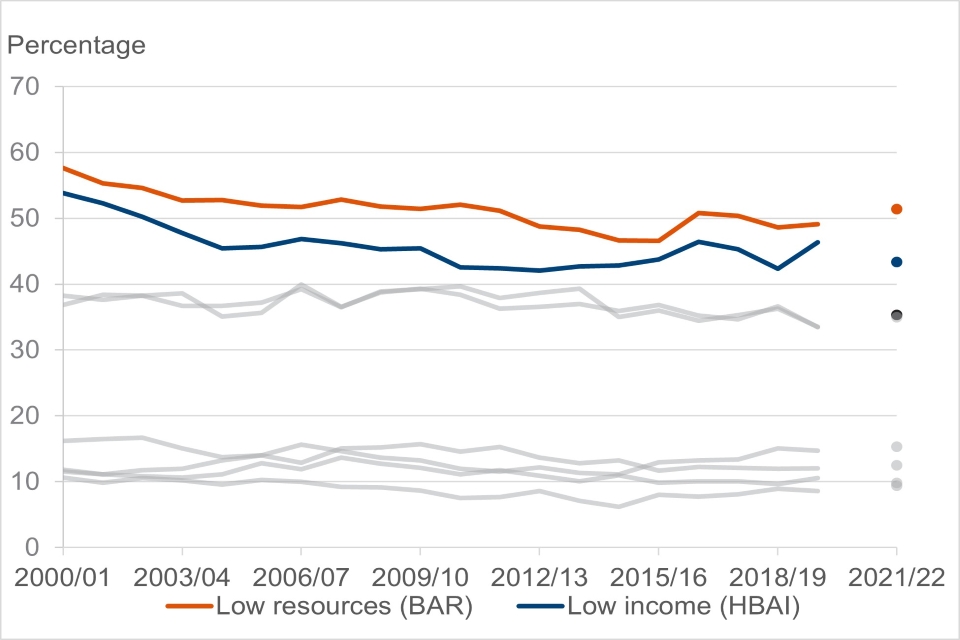
Figure 3.6.2: Percentage of individuals in low resources (BAR) and low income (HBAI) for Private rented, FYE 2001 to FYE 2022
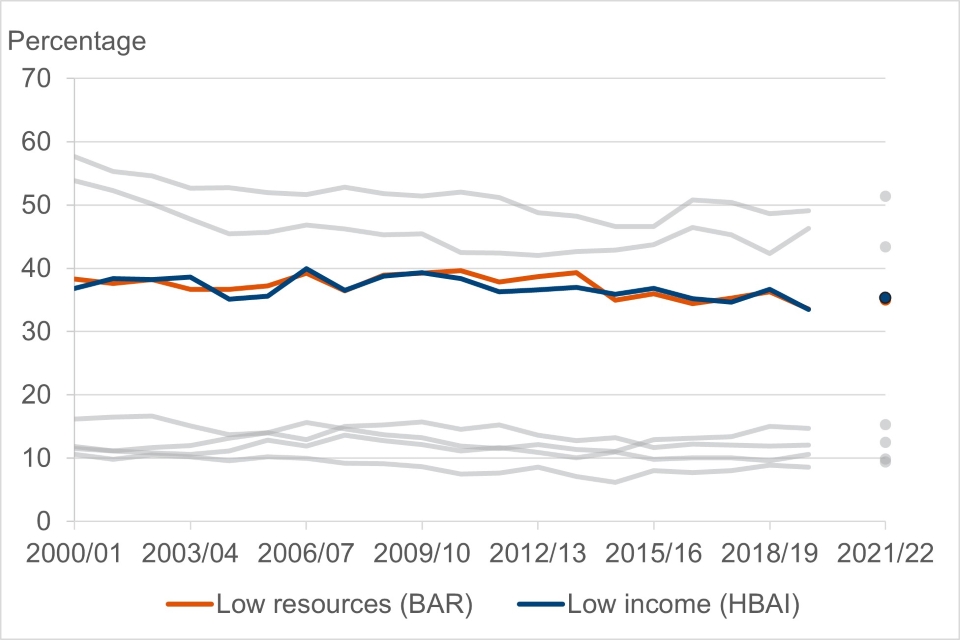
Figure 3.6.3: Percentage of individuals in low resources (BAR) and low income (HBAI) for Mortgage owned, FYE 2001 to FYE 2022
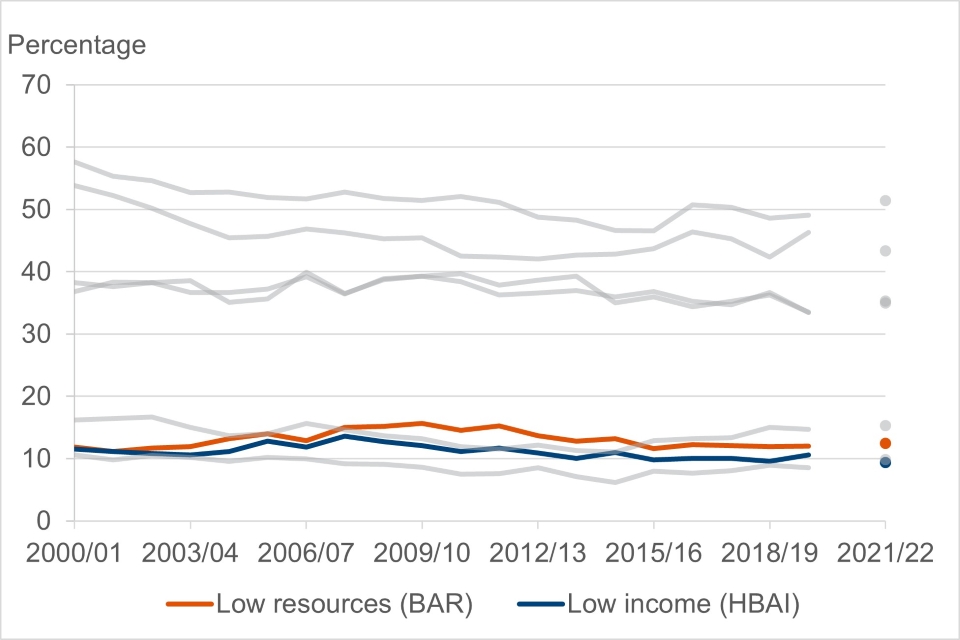
Figure 3.6.4: Percentage of individuals in low resources (BAR) and low income (HBAI) for Owned outright, FYE 2001 to FYE 2022
Housing tenure figure notes (Figures 3.6.1 through to 3.6.4):
- data is omitted for 2020 to 2021 due to data quality concerns
The comparative differentials in poverty rates between housing tenure types remains constant across the low resources and low income approaches. Regardless of which measure is used, the highest levels of poverty are found for social renters followed by private renters. Lower levels are shown for those with mortgages or who own their homes outright.
When comparing across the two measures for the same tenure types, higher percentages of mortgage owners and social rented groups were found to be in low resources than for low income. Similar percentages were found in low resources and low income for the private rented group, whilst lower percentages of those who own their homes outright were in low resources than for low income.
The higher percentage in low resources for mortgage owners may be related to the additional inclusion of mortgage capital repayments within the BAR approach. Other types of housing costs are otherwise accounted for equally across both the low resources and low income measures, so it’s likely that wider factors included in the BAR approach are also contributing to the higher poverty rates for social rented (for example, other types of inescapable cost) and lower poverty rates for the owned outright (for example, access to liquid assets).
In FYE 2022, the percentages in low resources were (from highest to lowest percentage):
- 51% of social renters (compared to 43% low income)
- 35% of private renters (35% low income)
- 12% of mortgage owners (9% low income)
- 10% of outright owners (15% low income)
Country
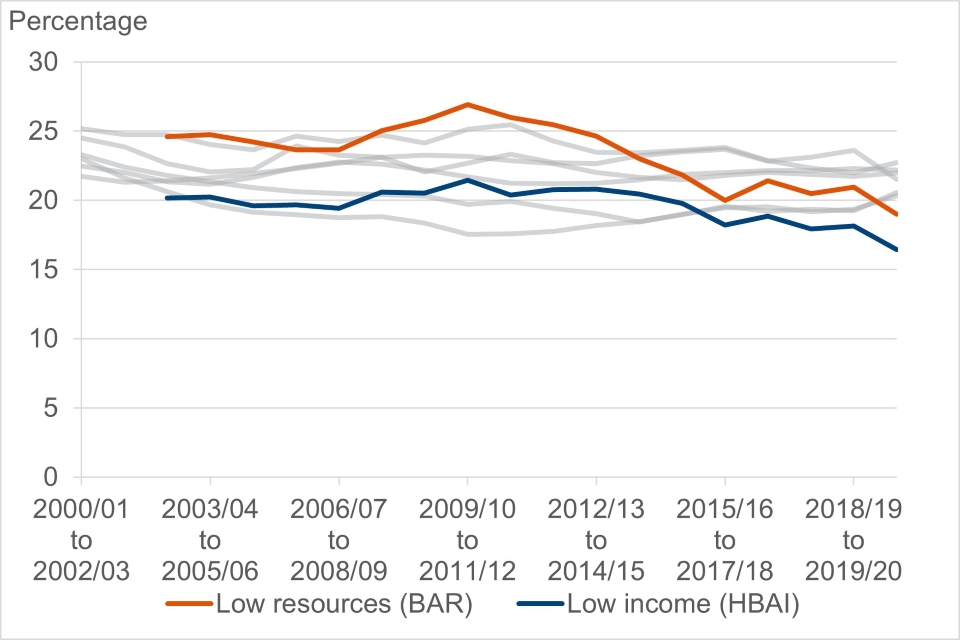
Figure 3.7.1: Percentage of individuals in low resources (BAR) and low income (HBAI) for England, FYE 2003 to FYE 2022
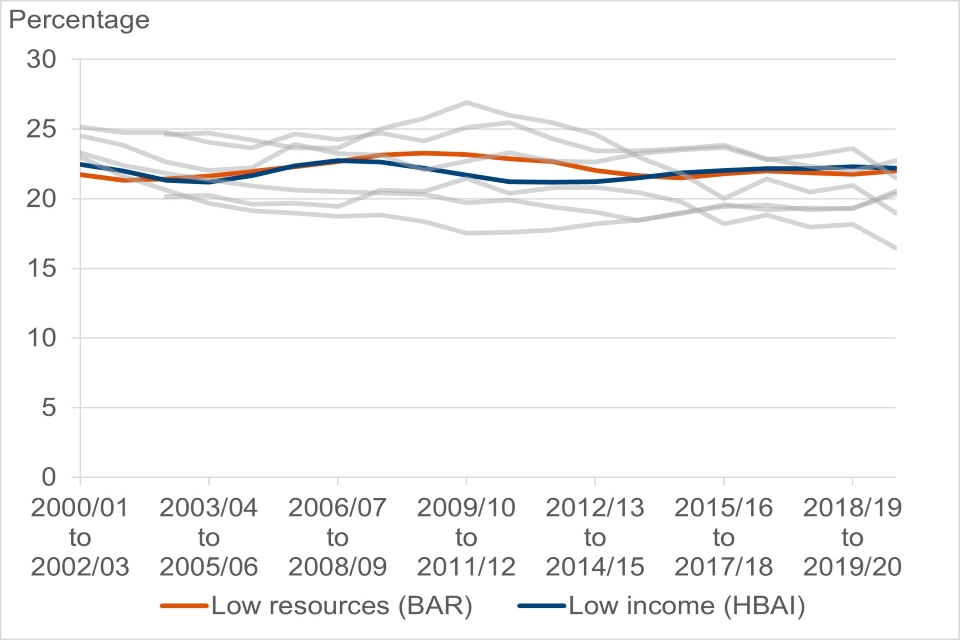
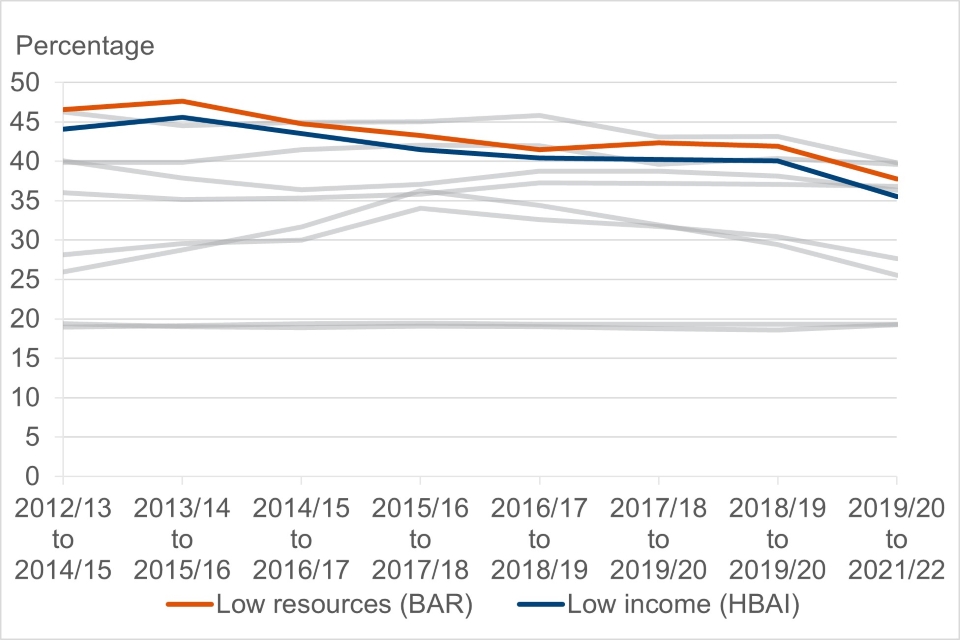
Figure 3.7.2: Percentage of individuals in low resources (BAR) and low income (HBAI) for Wales, FYE 2003 to FYE 2022
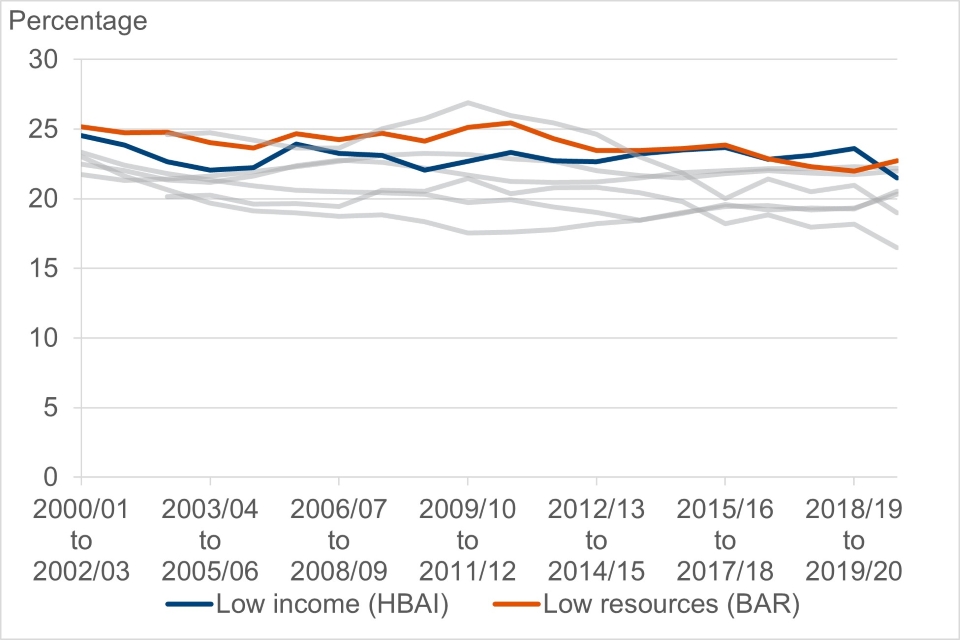
Figure 3.7.3: Percentage of individuals in low resources (BAR) and low income (HBAI) for Scotland, FYE 2003 to FYE 2022
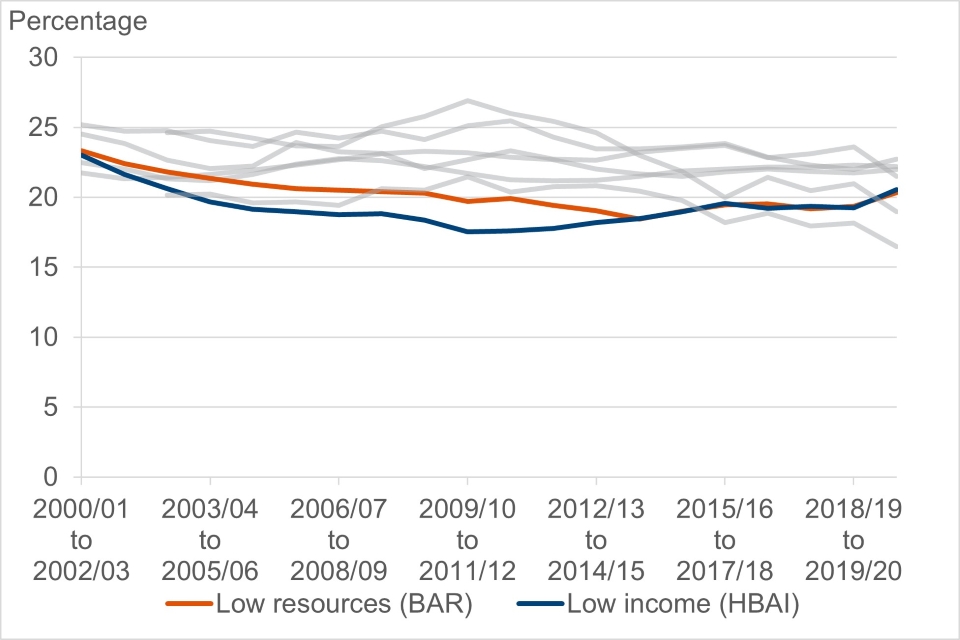
Figure 3.7.4: Percentage of individuals in low resources (BAR) and low income (HBAI) for Northern Ireland, FYE 2003 to FYE 2022
Country figure notes (Figures 3.7.1 through to 3.7.4):
- estimates are made using a three-year rolling average. This is an established method used to smooth out observed variation in single year estimates for these groups, which are subject to smaller sample sizes
- single year estimates for FYE 2021 were unavailable due to data quality issues. Therefore, the three-year averages encompassing that year (for example, three-year periods ending FYE 2021 and FYE 2022) are calculated with the single year FYE 2021 omitted, averaging across two years of data instead
- estimates are presented for FYE 2003 to FYE 2022, although not all years are labelled on the x-axis for interpretability
- data for Northern Ireland is only available from FYE 2003 and poverty estimates are only provided from the three years to FYE 2006 onwards due to three-year averaging
Poverty trends on a low resources and low income basis are largely similar for England, except for the period to FYE 2011 through to the period to FYE 2015 where the low resources estimates are slightly higher.
For both Scotland and Wales, the percentage of individuals in low resources is higher than for low income up to the period to FYE 2016 when the two measures then largely converge.
For Northern Ireland, the difference between the two measures is more pronounced and sustained throughout with a higher percentage of individuals found to be in low resources than in low income. The explanation for this difference across the two measures for Northern Ireland is not immediately obvious and will be explored further as the measure is developed.
In the period to FYE 2022, the percentages in low resources were (from highest to lowest percentage):
- 23% in Wales (compared to 22% low income)
- 22% in England (22% low income)
- 20% in Scotland (21% low income)
- 19% in Northern Ireland (16% low income)
Region
Figure 3.8.1: Percentage of individuals in low resources (BAR) and low income (HBAI) for the North East, FYE 2003 to FYE 2022
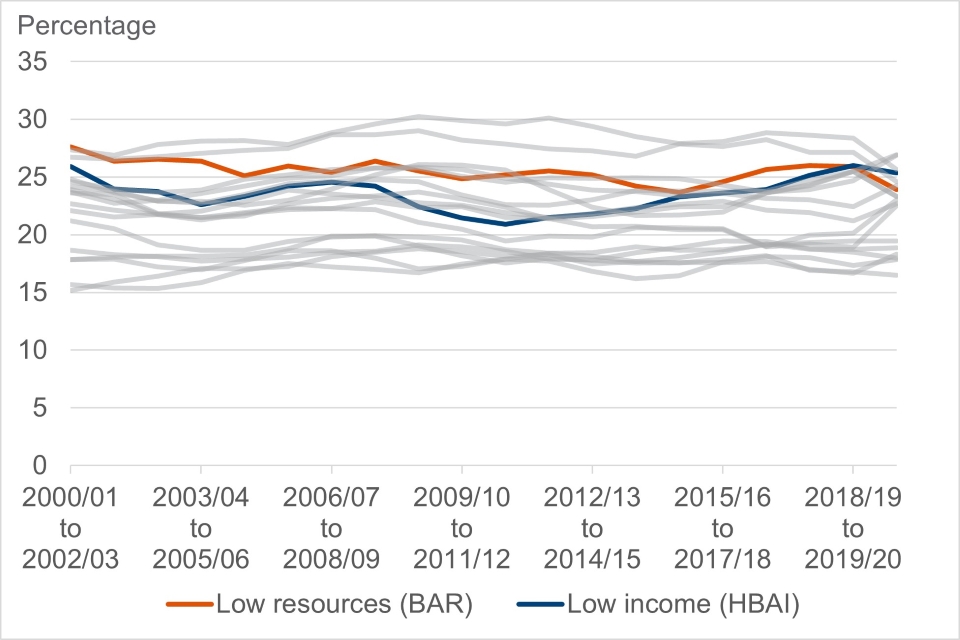
Figure 3.8.2: Percentage of individuals in low resources (BAR) and low income (HBAI) for the North West, FYE 2003 to FYE 2022
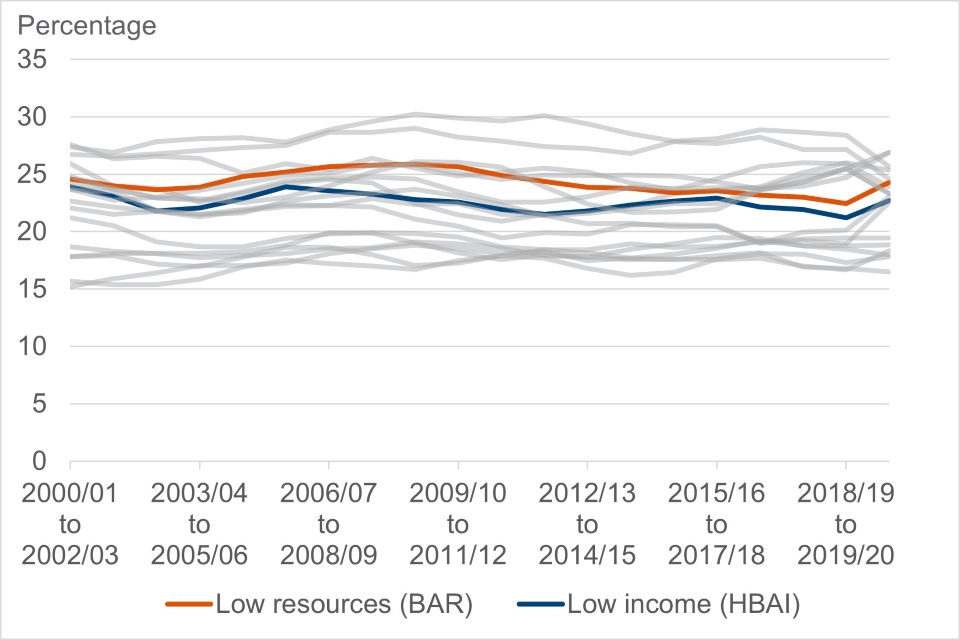
Figure 3.8.3: Percentage of individuals in low resources (BAR) and low income (HBAI) for Yorkshire and the Humber, FYE 2003 to FYE 2022
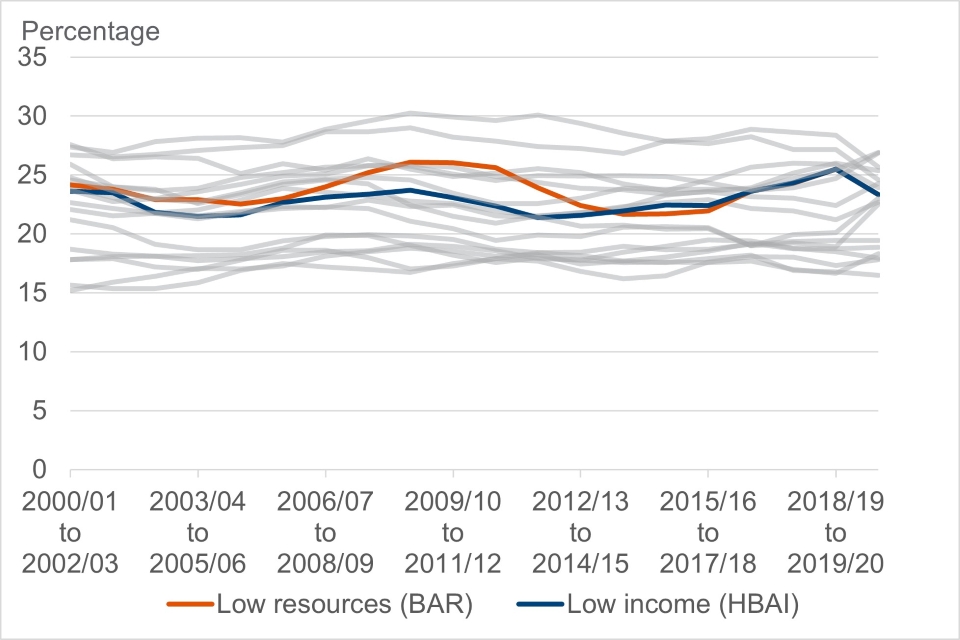
Figure 3.8.4: Percentage of individuals in low resources (BAR) and low income (HBAI) for the East Midlands, FYE 2003 to FYE 2022
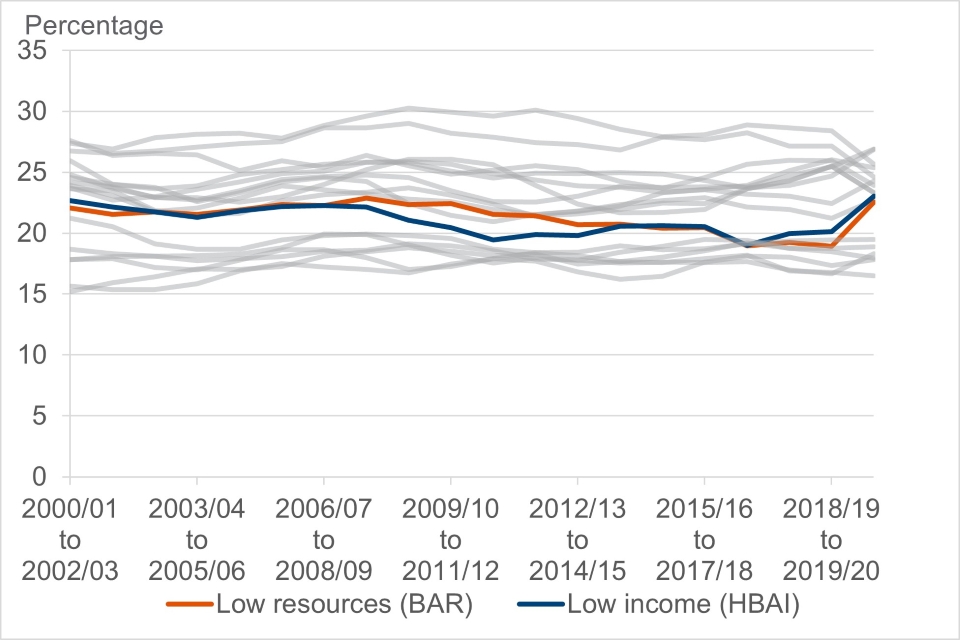
Figure 3.8.5: Percentage of individuals in low resources (BAR) and low income (HBAI) for the West Midlands, FYE 2003 to FYE 2022
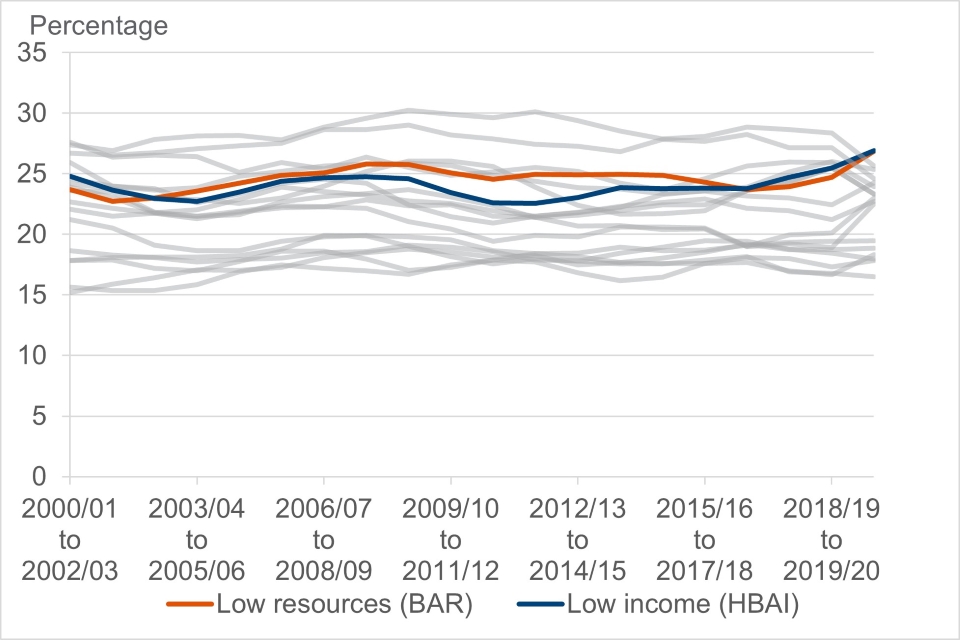
Figure 3.8.6: Percentage of individuals in low resources (BAR) and low income (HBAI) for the East, FYE 2003 to FYE 2022
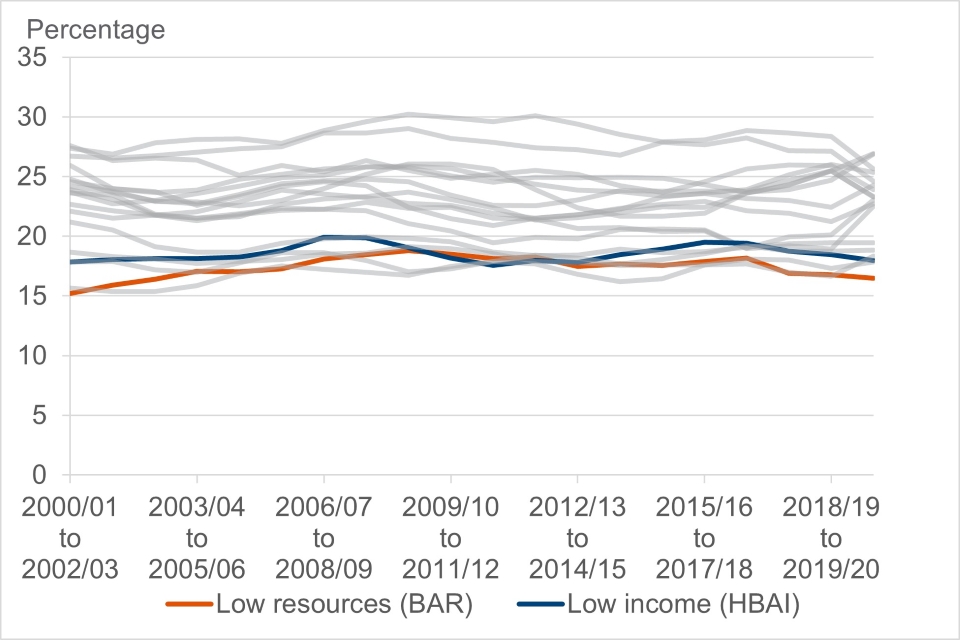
Figure 3.8.7: Percentage of individuals in low resources (BAR) and low income (HBAI) for London, FYE 2003 to FYE 2022
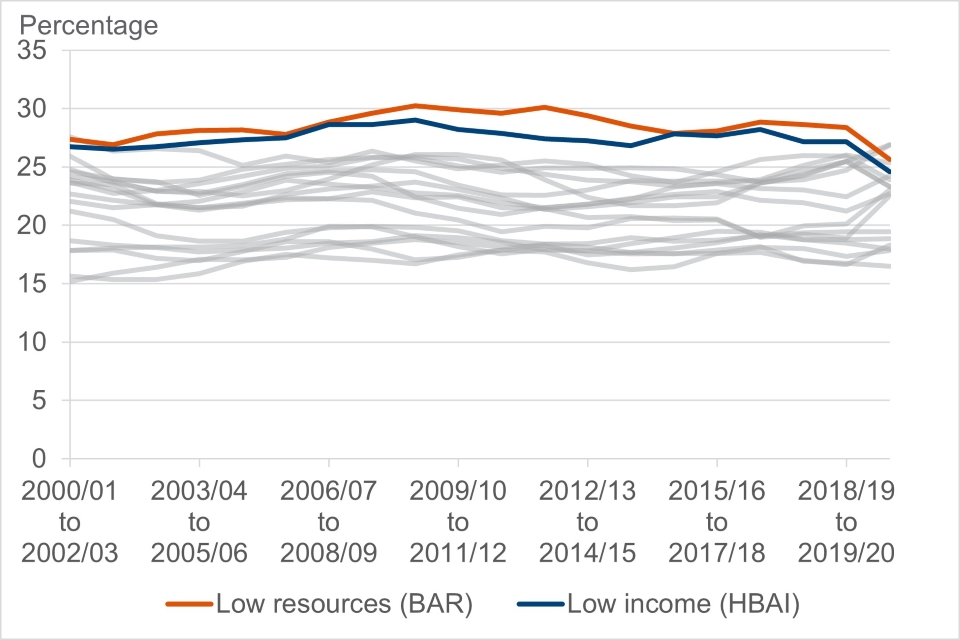
Figure 3.8.8: Percentage of individuals in low resources (BAR) and low income (HBAI) for the South East, FYE 2003 to FYE 2022
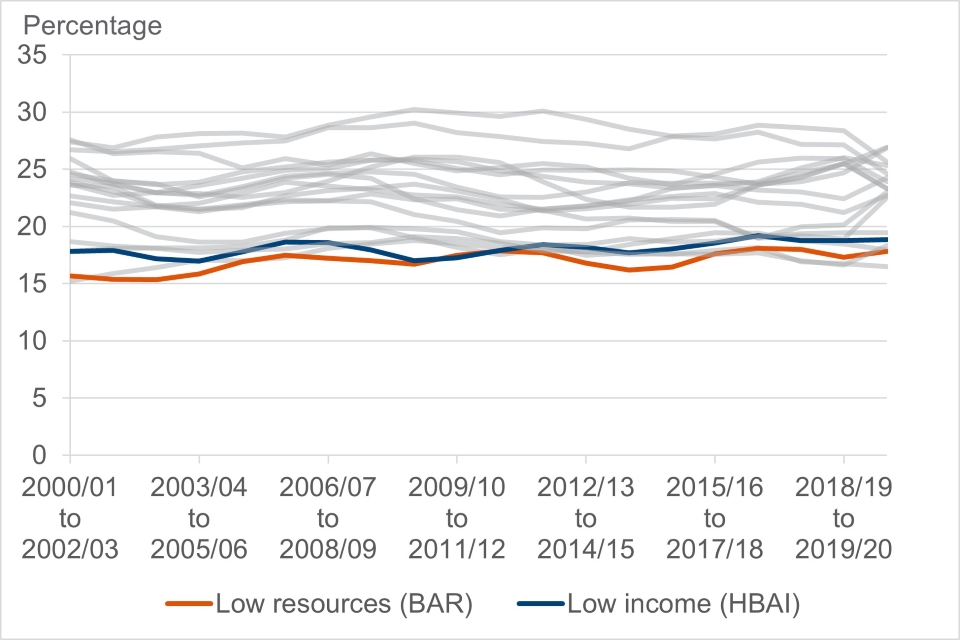
Figure 3.8.9: Percentage of individuals in low resources (BAR) and low income (HBAI) for the South West, FYE 2003 to FYE 2022
Region figure notes (Figures 3.8.1 through to 3.8.9):
- estimates are made using a three-year rolling average. This is an established method used to smooth out observed variation in single year estimates for these groups, which are subject to smaller sample sizes
- single year estimates for FYE 2021 were unavailable due to data quality issues. Therefore, the three-year averages encompassing that year (for example, three-year periods ending FYE 2021 and FYE 2022) are calculated with the single year FYE 2021 omitted, averaging across two years of data instead
- it is only possible to include estimates for regions in England due to small sample sizes
- estimates are presented for FYE 2003 to FYE 2022, although not all years are labelled on the x-axis for interpretability
Overall, the trends by region show a mixed picture when comparing across the low resources and low income measures, with further analysis required to determine the relative importance of factors contributing to the differences found across the period.
The percentage of individuals in low resources was typically found to be higher than for the percentage in low income for the North East and the North West.
For Yorkshire and The Humber, East Midlands, West Midlands and London, the percentage in low resources was higher during the middle of the observed period but differences between the two measures are overall less pronounced than for the North East and the North West.
For the East, South East and South West, the percentage of individuals in low resources is slightly lower than for low income, though the differences between the two measures are not large.
For the period to FYE 2022, the percentages of individuals in low resources across English regions were (from highest to lowest percentage):
- 27% in the West Midlands (compared to 27% low income)
- 26% in London (25% low income)
- 24% in the North East (25% low income)
- 24% in the North West (23% low income)
- 23% in Yorkshire and The Humber (23% low income)
- 23% in the East Midlands (23% low income)
- 18% in the South East (19% low income)
- 18% in the South West (19% low income)
- 17% in the East (18% low income)
Compositional differences
The above analysis showed differences in overarching trends for the BAR (low resources) and HBAI (low income) measures. In this section, the analysis examines further the differences between the two measures by comparing who is in poverty according to only one or both of the measures.
All individuals
Figure 3.9.1: Comparison of who is in poverty according to the HBAI (low income) and BAR (low resources) measures, All individuals, FYE 2022
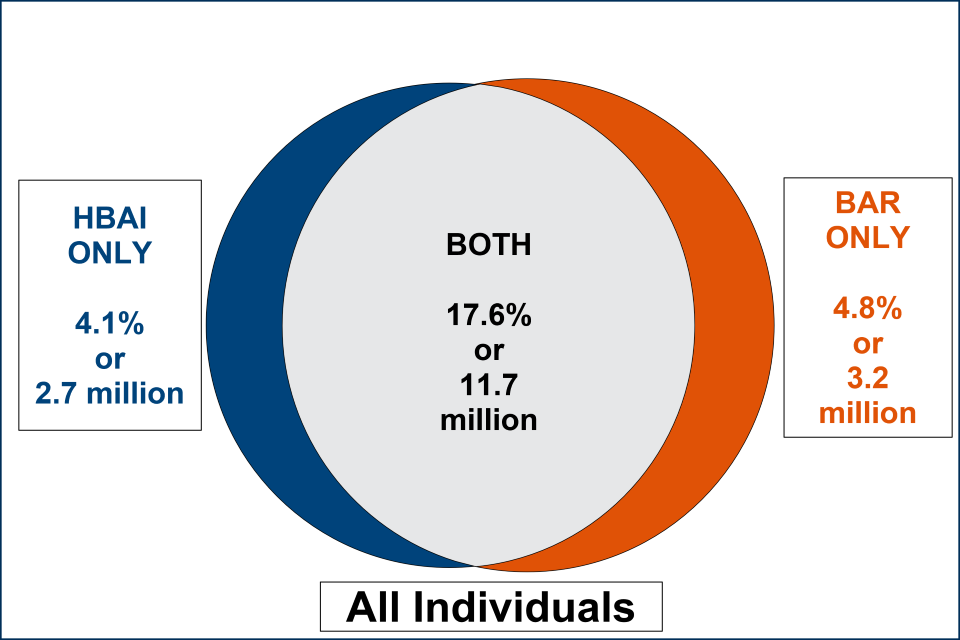
Of the 14.9 million individuals in low resources poverty, 11.7 million were also in low income poverty, whilst 3.2 million were only in low resources poverty. Of the 14.5 million individuals in low income poverty, 2.7 million of these were not found to be in low resources poverty.
Age group
Figure 3.9.2: Comparison of who is in poverty according to the HBAI (low income) and BAR (low resources) measures, Working age, FYE 2022
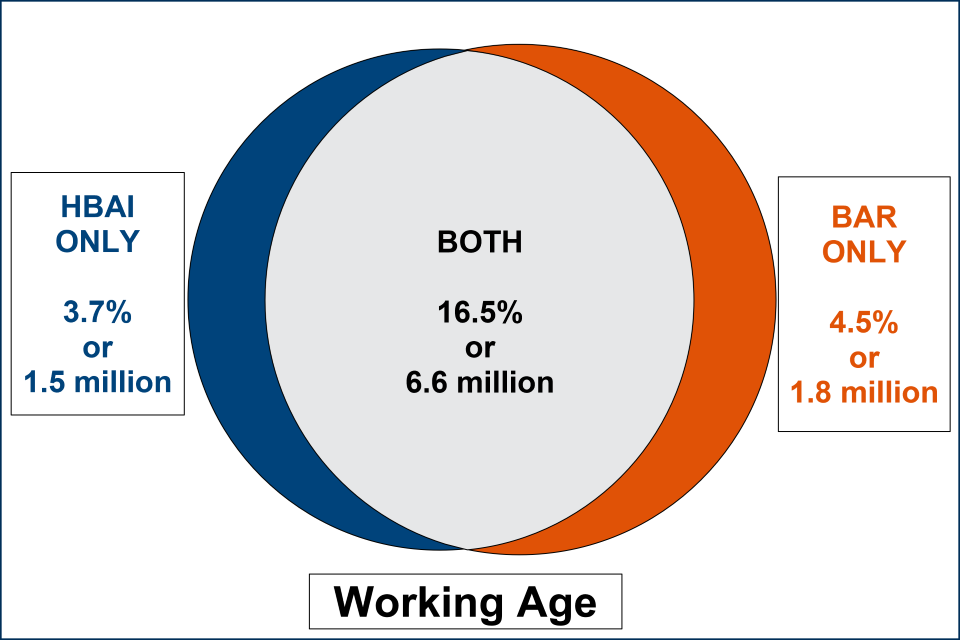
Figure 3.9.3: Comparison of who is in poverty according to the HBAI (low income) and BAR (low resources) measures, Children, FYE 2022
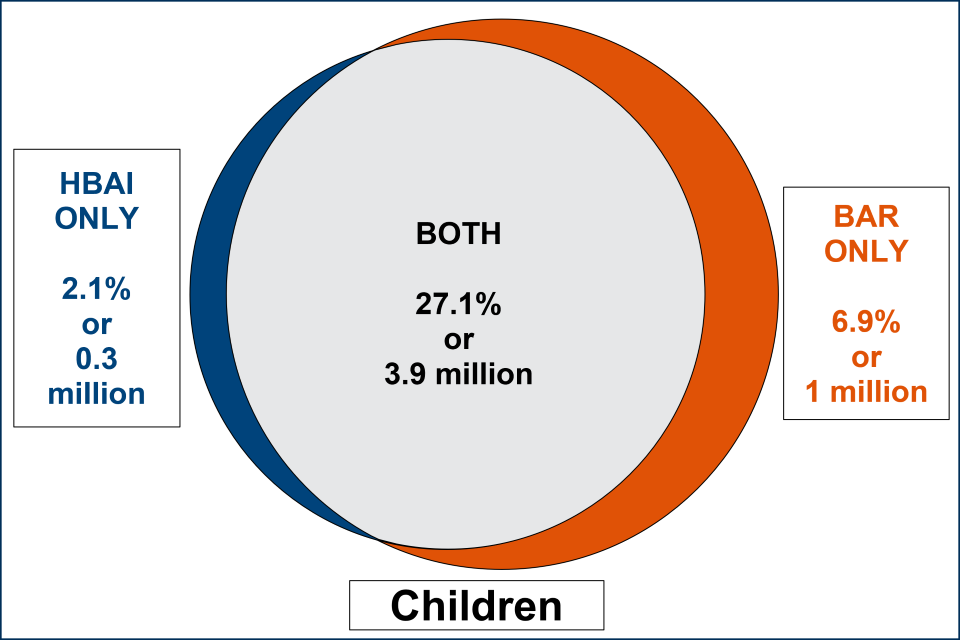
Figure 3.9.4: Comparison of who is in poverty according to the HBAI (low income) and BAR (low resources) measures, Pensioners, FYE 2022
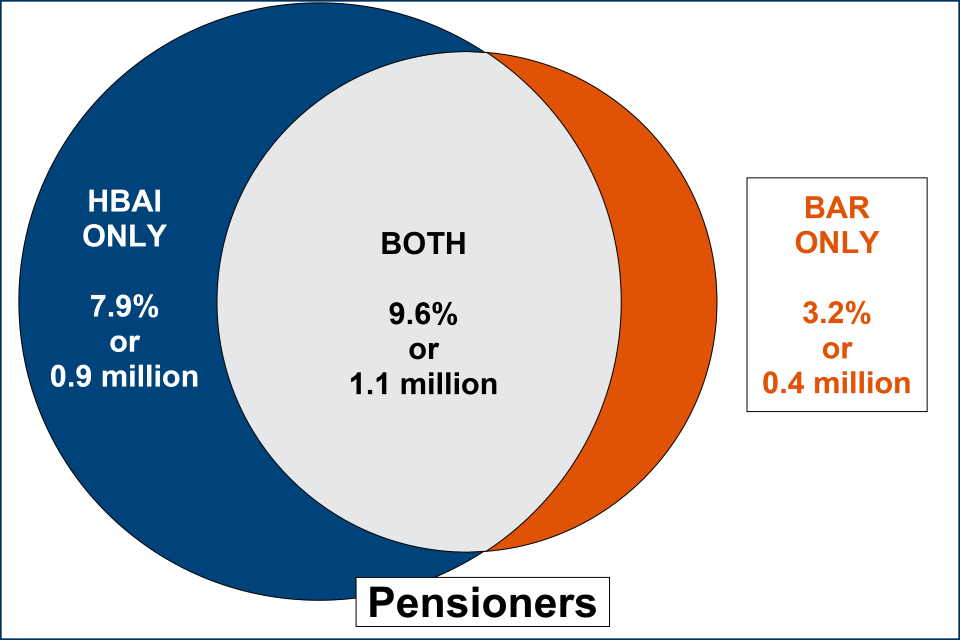
For age groups, the Venn diagrams show that whilst there is significant overlap between individuals being classed as in poverty according to both measures, there are also significant numbers that are counted as in or out of poverty depending on which measure is used.
For working age, 1.5 million individuals are found to be in low income poverty only, whilst 1.8 million are in low resource poverty only.
For children, a larger number are counted as in poverty on the low resources measure (1 million) than counted as out of poverty (0.3 million only in low income poverty).
For pensioners, a smaller number are counted as in poverty on the low resources measure (0.4 million) than counted as out of poverty (0.9 million on low income only).
Disability
Figure 3.9.5: Comparison of who is in poverty according to the HBAI (low income) and BAR (low resources) measures, Individuals with a disabled family member, FYE 2022
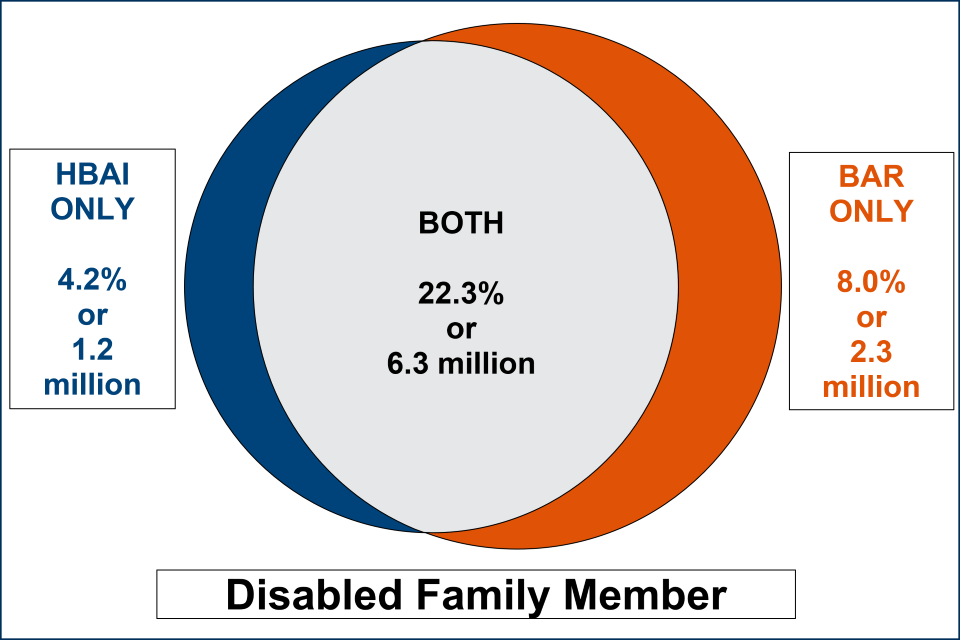
Figure Note:
- while HBAI figures for disability are normally calculated at the benefit unit level, these values have been calculated at a sharing unit level to enable comparison under the Venn diagram approach
For individuals with a disabled family member, a greater number are counted as in poverty on the low resources measure (2.3 million) than counted as out of poverty (1.2 million on low income only).
Household food security
Table 3.10.1: Household food security (%) amongst individuals in poverty on BAR (low resources) and HBAI (low income) measures, FYE 2022
| Low resources ONLY | Low income ONLY | Low resources AND low income | |
|---|---|---|---|
| Food Secure | 83 | 98 | 77 |
| Food Insecure | 17 | 2 | 23 |
Individuals found to be in poverty on only the low resource measure or both of the measures are much more likely to be in food insecure households than individuals who are found to be in poverty only on a low income basis. This suggests the BAR measure better correlates with household food insecurity compared to HBAI.
Material deprivation
Table 3.10.2: Material deprivation rates (%) amongst individuals in poverty on BAR (low resources) and HBAI (low income) measures, by age group, FYE 2012-FYE 2020
| Low resources ONLY | Low income ONLY | Low resources AND low income | |
|---|---|---|---|
| Working Age | 51 | 18 | 59 |
| Children | 33 | 9 | 44 |
| Pensioners | 27 | 6 | 22 |
Table notes:
- the material deprivation rates have been calculated using an average over the period FYE 2012 to FYE 2020 due to small sample sizes
- for pensioners, material deprivation questions are asked of pensioners aged 65 or over. For further details on this, and the material deprivation methodology, please refer to the background and methodology report for this publication and HBAI
- material deprivation is measured differently for different age groups, based on age-appropriate questions asking whether they have access to certain goods and services. See the background and methodology report for more information
Individuals found to be in poverty on only the low resource measure or both measures are more likely to be materially deprived than individuals who are found to be in poverty only on a low income basis. This suggests the BAR measure better correlates with material deprivation than does HBAI.
Summary
The analysis comparing low resources (BAR) and low income (HBAI) estimates suggests:
- overall poverty rates for all individuals are similar across the two measures, as would be expected from the SMC methodological decision to match relative low income AHC estimates in FYE 2017 from HBAI
- the comparative differences between sub-groups shown on the BAR measure are consistent with those on the HBAI measure (i.e. where low income poverty is found to be relatively high for one group in comparison to another, this pattern is also found for those same groups on the low resources poverty measure)
- therefore, the BAR measure does not fundamentally change the view of which groups have the highest poverty rates or are the most disadvantaged (at least based on the analysis presented in this publication)
- however, the BAR measure tends to find even higher poverty rates for the most disadvantaged, and even lower poverty rates for the least disadvantaged, in comparison to HBAI. For example, children, individuals with a disabled family member, single individuals with children and social renters already have relatively high low income poverty rates, but these are comparatively higher on the low resources measure. Conversely, low income poverty is relatively low for pensioners, individuals without a disabled family member, couples with no children and outright home owners, but poverty rates for these groups are even lower on the low resources measure
- therefore, the disparity between more and less disadvantaged groups is greater on the BAR measure, when the additional resources and costs that families face are accounted for in comparison to a low income approach
- the analysis of household food insecurity and material deprivation shows much stronger association of these poverty related measures for individuals who are counted as in poverty on the low resources measure (either on low resources only, or on low resources and low income), than for individuals who are counted as being in poverty on the low income measure only. This provides support for the BAR approach
Consultation question 10: Do you have any comments on the comparisons between the BAR and HBAI poverty measures presented in this section? Are the comparisons as expected?
Consultation question 11: Are there any further breakdowns or comparisons which would be helpful for you as a user? What are these, and how will they add value?
Consultation question 12: Please provide any additional comments you have on the content of this section.
4. Detailed review of Total Resources Available components
This section provides a more detailed account of each of the Total Resources Available (TRA) components included within the Below Average Resources (BAR) measure that are additional to HBAI as shown in Box 1 (repeated here from Diagram 2 in section 2). It sets out the SMC principle for including the components in the measure, as well as how this has been currently realised. Questions are posed to seek user feedback on each of the components of the TRA calculation in turn. Following this, analysis is presented to illustrate the impact of these additional components introduced by the BAR measure against the base of net income (as also calculated in HBAI).
Box 1 – Calculation of TRA components
Box 1: This diagram shows the Total Resources Available (TRA) calculation. It shows that TRA is calculated as Net Income, plus Other resources available i.e. Weekly measure of liquid assets, minus Inescapable family-specific costs i.e. childcare, disability, recurring hosing costs, others that require further research, minus Debt i.e. obligated weekly debt repayments. The debt information is greyed out to demonstrate that it is not used in the current realisation of the measure due to a lack of suitable data.
Assets
Principle
The SMC proposed that assets that are freely available to be turned into cash (‘liquid assets’) should be included as an available resource to meet immediate needs. Liquid assets include savings but would not include non-liquid assets such as housing assets because these are not considered to be accessible to meet immediate needs. Whilst assets are a ‘stock’, these are converted to a ‘flow’ to be treated on the same weekly basis as net income and other components of the calculation.
Measurement
A measure of liquid assets is available in the Family Resources Survey (FRS) and included within the TRA calculation. To convert the stock of liquid assets into a weekly flow measure (to allow calculation on a comparable basis as for other parts of the TRA calculation), an assumption is required around what individuals need and therefore the time it would take to deplete any savings. The SMC propose the assumption that liquid assets would be depleted within one year. In practice, this means that to convert the stock of reported liquid assets into a weekly measure it is divided by (365/7).
Consultation question 13: Should liquid assets be counted as an available resource within the Total Resources Available calculation? What are the relative strengths and limitations of including or excluding it?
Consultation question 14: How should liquid assets be defined, and which should be in scope? Should all types of liquid assets be considered equally?
Consultation question 15: How should liquid assets be converted from a stock to a weekly flow measure? Do you agree with the current basis to assume assets are depleted within one year (i.e. dividing the stock by (365/7))?
Consultation question 16: How should, and can, we account for assets associated with pensions decumulation? Should these be treated differently to the general approach for liquid assets?
Consultation question 17: Should there be a minimum savings buffer to be disregarded (allowing all individuals to have a small amount of savings)? If yes, what should this look like?
Debt
Principle
The SMC proposed that weekly obligated debt repayments should be viewed as an inescapable cost that reduces the resources available and should therefore be deducted from the Total Resources Available (TRA) calculation.
Measurement
Debt data was not available within the FRS for the period considered here, so has not been included within the TRA calculation.
Future work will look to identify how to include debt within the measure. There will be a substantial lag to any newly collected data being fully incorporated into the measure because of the TRA being calculated over three years to smooth the measure, and the associated time it will take before a consistent time series can be built up once the measure is stable.
Consultation question 18: Should obligated debt repayments be counted as an inescapable cost within the Total Resources Available calculation? What are the relative strengths and limitations of including or excluding it?
Consultation question 19: How should obligated debt repayments be defined, and which should be in scope? Should all types of obligated debt repayments be considered equally? Should interest repayments be included? Should capital repayments be included?
Consultation question 20: Should the amount borrowed for debt be accounted for in the Total Resources Available calculation as income, if the debt is also to be counted as a cost? If yes, how should this be done?
Childcare costs
Principle
The SMC propose that childcare costs should be viewed as an inescapable cost that reduces the overall level of resources a family has. The SMC highlight that childcare costs are often associated with working families, and not including them in the measure would mean earnings from work are considered as a resource whilst associated extra costs of going to work are not factored in.
Measurement
A measure of spend on childcare costs is available in the FRS and included in the Total Resources Available (TRA) calculation. The SMC propose this as the best available measure that can be linked across into the wider assessment of TRA (i.e. using the same data source) but note stakeholder feedback that the FRS childcare costs may be under-reported.
The SMC acknowledge that the approach adopted assumes childcare needs are met and does not account for childcare quality or informal childcare use which they deem as not possible to reflect with the available data.
Consultation question 21: Should childcare costs be counted as an inescapable cost within the Total Resources Available calculation? What are the relative strengths and limitations of including or excluding them?
Consultation question 22: How should childcare costs be defined, and which should be in scope? Should all types be considered equally?
Consultation question 23: Is the position that unmet need and informal childcare use are not possible to reflect appropriate? Are there alternative approaches that should be considered here?
Consultation question 24: Should there be an adjustment for quality of childcare, for example including a cap on the maximum costs incurred?
Consultation question 25: If childcare costs are included as an inescapable cost, should income from government childcare schemes e.g. childcare vouchers, tax free childcare, also be included within the TRA calculation?
Extra costs of disability
Principle
The SMC propose that the extra costs that families with a disabled individual face should be viewed as an inescapable cost that reduces the overall level of available resources that a family has.
The SMC highlight that the receipt of extra-cost disability benefits like Personal Independence Payment (PIP), Disability Living Allowance (DLA) and/or Attendance Allowance (AA) is typically included in net income measures like HBAI, without any offsetting to recognise that these payments are received to meet increased costs incurred by families with a disabled individual.
Measurement
The SMC highlight a lack of comprehensive data to fully reflect how the extra costs of disability vary across individuals with different types or severities of disability. At present, the approach used is to proxy the extra costs of disability by deducting the value of extra cost disability benefits (DLA, PIP and AA) within the TRA calculation. These values are uprated in line with observed increases to extra cost benefits. This means the receipt of these benefits is not seen as an available resource to meet non-disability needs, which the SMC argue is the case for measures where their receipt is not offset in this way.
The SMC acknowledge the limitations of this approach, including that not all individuals may take up or be eligible for the extra cost disability benefits, and that in some cases the financial value may exceed the associated costs of disability, whilst not meeting it in others. In a subsequent methodological paper, the SMC also discuss how any increase/decrease in the value of extra cost disability benefits would not impact upon poverty levels using this approach, given that the receipt of the benefits is offset by their deduction. However, the SMC propose this is the best possible approach until a more comprehensive method has been developed with the need for significant further research and testing.
Consultation question 26: Should the extra costs of disability be counted as an inescapable cost within the Total Resources Available calculation? What are the relative strengths and limitations of including or excluding them?
Consultation question 27: How should the extra costs of disability be defined, and which should be in scope? Should all types of disability be considered equally? How should the severity of disability be considered?
Consultation question 28: What types of approach could be used to improve upon the current estimation approach? How can this be undertaken in a way that will be robust but proportionate in terms of data collection?
Housing costs
Principle
The SMC propose that weekly recurring housing costs should be viewed as an inescapable cost that reduces the overall level of available resources that a family has. The costs considered include: rental and mortgage payments (with both the interest and capital repayment element of mortgages); ground rents and service charges; water rates, community water charges and council tax; and structural insurance premiums.
The SMC housing costs are comparable to those included in HBAI AHC measures, with the exception of the mortgage capital repayment which is not included within HBAI. The SMC argued that whilst mortgage capital repayments contribute to the accumulation of illiquid assets and terms of repayment can be changed with lenders, it is not possible for families to change their repayments very quickly and therefore these should be deemed inescapable costs diverting resources from being available to meet other needs.
Measurement
A measure of recurring housing costs is available within the FRS and has been adapted to also include mortgage capital repayments.
Consultation question 29: Should mortgage capital repayments be included in the Total Resources Available calculation? What are the relative strengths and limitations of including or excluding them?
Consultation question 30: If mortgage capital repayments are included, should overpayments of mortgage capital be included, or should this be restricted to minimum payments?
Consultation question 31: Should the amount borrowed through a mortgage, the value of the asset gained by paying back a mortgage or imputed rent be accounted for in the Total Resources Available calculation as income if mortgage capital repayments are counted as a cost? If yes, how should this be done?
Consultation question 32: Are there any other inescapable costs associated with housing that are not currently but should also be considered? If yes, what are these and how could this be approached?
Other inescapable costs
The SMC also highlight other potential inescapable costs that could be considered such as travel to work costs, social care costs and energy costs. They also point to other costs that may become relevant should government policy change, or the measure be developed internationally, such as healthcare costs.
Consultation question 33: Are there any additional inescapable costs, not currently included, that should be considered in the Total Resources Available calculation?
Consultation question 34: If yes, which additional costs are considered important? What approaches could be considered for including these? What are the relative strengths and limitations of their inclusion or exclusion?
Impact of Total Resources Available components against net income
To analyse the impact of the additional TRA components outlined as part of the BAR approach against families’ net income (as calculated in HBAI), the percentage of individuals affected by each component and the average impact of each component is examined here.
Individuals affected by components are defined as those who have income or expenditure related to those components. For example, someone who has a mortgage, childcare costs and liquid assets will be affected by the mortgage capital, childcare and liquid assets components.
Figure 4.1: Percentage of individuals affected by each TRA component, FYE 2001 to FYE 2022
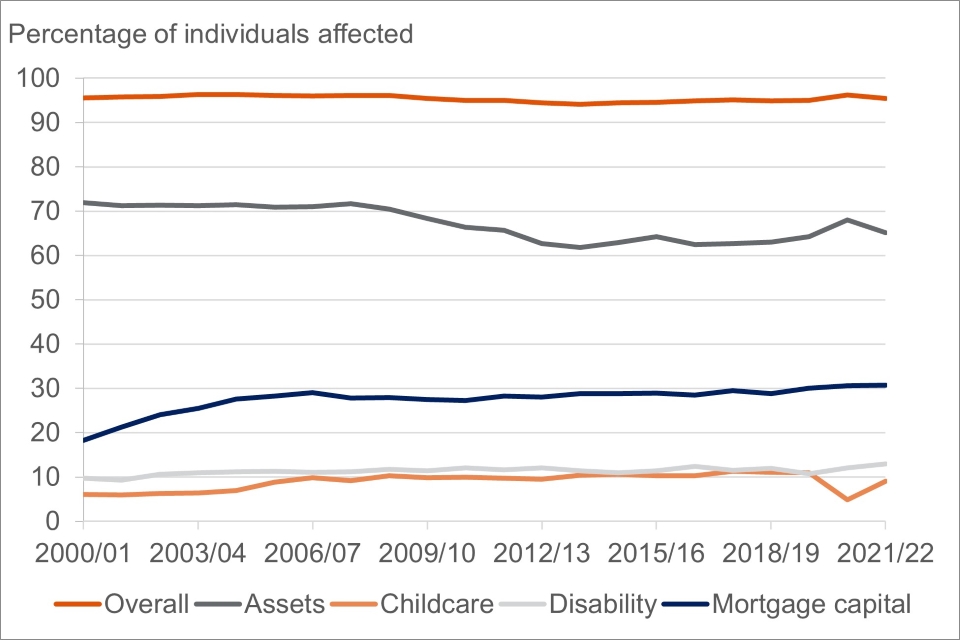
In FYE 2022, 95% of all individuals were affected by at least one component (for example, they have at least one of: liquid assets, childcare costs, extra disability costs or mortgage capital repayments). This means that for only 5% of individuals the additional BAR elements make no difference above the base income calculation that would be same as for the low income after housing costs estimation on HBAI. In the vast majority of cases, individuals are subject to these additional savings and/or costs as captured by the BAR measure, highlighting their relevance.
The component affecting most individuals is liquid assets, followed by mortgage capital repayments, disability costs, then childcare. This trend has been consistent since FYE 2001 except from in FYE 2020 where a marginally higher percentage of individuals were affected by childcare costs than disability costs.
To explore the effect of each component of TRA on individuals across the TRA distribution, the mean impact of each component by TRA vigintile (sum of every 5 percentiles) has been presented below for FYE 2022 (excluding the last vigintile for these charts for interpretability, but full distributions are given in the published data tables).
The figures show the base (in blue) as income without any additional BAR components (i.e. net income as calculated on HBAI AHC), and the positive or negative effect of the BAR components against this are then presented as stacked bars.
For example, the grey bars represent the mean positive effect of assets on the average income per week for each vigintile, the dark blue shows the negative impact of mortgage capital repayments, the light grey shows the negative impact of disability costs and the light orange shows the negative impact of childcare costs.
The mean net impact of all of the components is presented as a dark orange line, i.e. this represents the mean total TRA value for each vigintile after accounting for each of the elements in the calculation on top of net income.
If the dark orange line is above the top of the lighter blue base income, the TRA components on average lead to a higher weekly TRA for that vigintile, i.e. under the new measure they have a larger amount of monetary resources due to the inclusion of additional elements in the BAR calculation compared to the net income calculated in HBAI. If the dark orange line is below the top of the lighter blue base income, the additional elements included in the BAR calculation result in a lower mean amount of monetary resources than when only net income is accounted for. The actual resources available to the family in reality has not changed as the TRA and AHC income measures capture different aspects of a family’s resources, so these should not be directly compared. The BAR measure accounts for a wider range of income sources and inescapable costs than the net income AHC measure used in HBAI.
Figure 4.2: Mean impact of TRA components by vigintile, All individuals up to 19th vigintile, FYE 2022

Figure notes:
- this chart has been restricted to only those in the 19th vigintile for interpretability. See the published data tables for the full data
- vigintiles are the sum of every five percentile. Vigintile groups are taken from the whole population TRA distribution
Figure 4.3: Mean impact of TRA components by vigintile, Working Age Adults, up to the 19th vigintile, FYE 2022
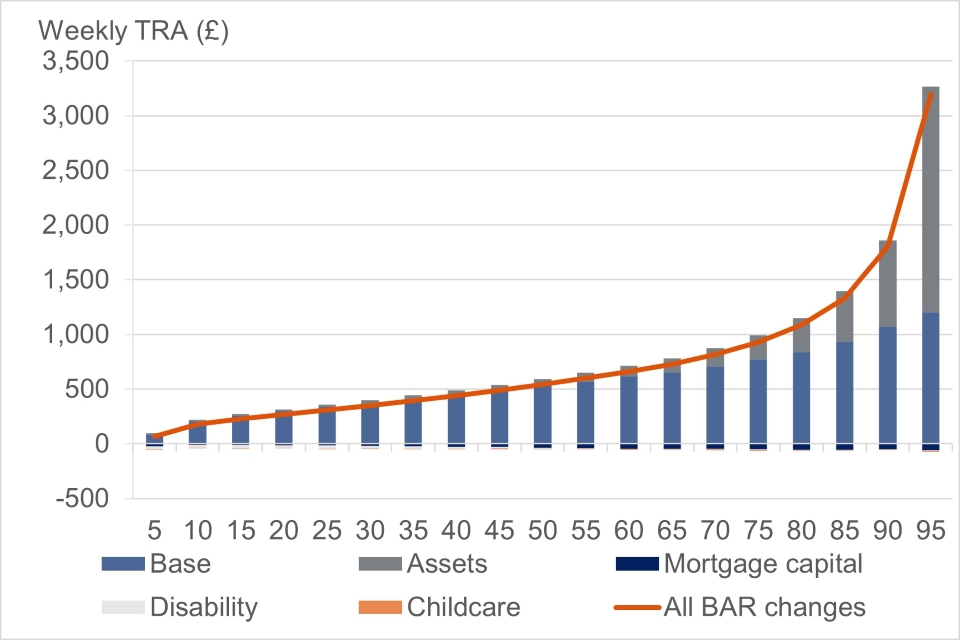
Figure notes:
- this chart has been restricted to only those in the 19th vigintile for interpretability. See the published data tables for the full data
- vigintiles are the sum of every five percentile. Vigintile groups are taken from the whole population TRA distribution. The mean impact for working age individuals within these vigintiles are presented here
Figure 4.4: Mean impact of TRA components by vigintile, Children, up to the 19th vigintile
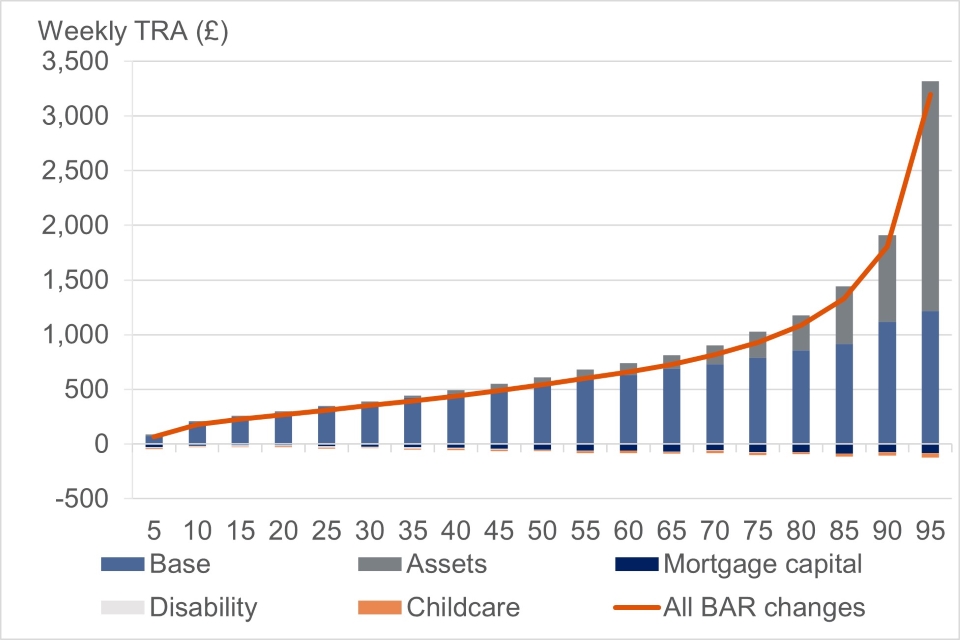
Figure notes:
- this chart has been restricted to only those in the 19th vigintile for interpretability. See the published data tables for the full data
- vigintiles are the sum of every five percentile. Vigintile groups are taken from the whole population TRA distribution. The mean impact for children within these vigintiles are presented here
Figure 4.5: Mean impact of TRA components by vigintile, Pensioners, up to the 19th vigintile, FYE 2022

Figure notes:
- this chart has been restricted to only those in the 19th vigintile for interpretability. See the published data tables for the full data
- vigintiles are the sum of every five percentile. Vigintile groups are taken from the whole population TRA distribution. The mean impact for pensioners within these vigintiles are presented here
Figure 4.6: Mean impact of TRA components by vigintile, Individuals with a Disabled family member, up to the 19th vigintile, FYE 2022
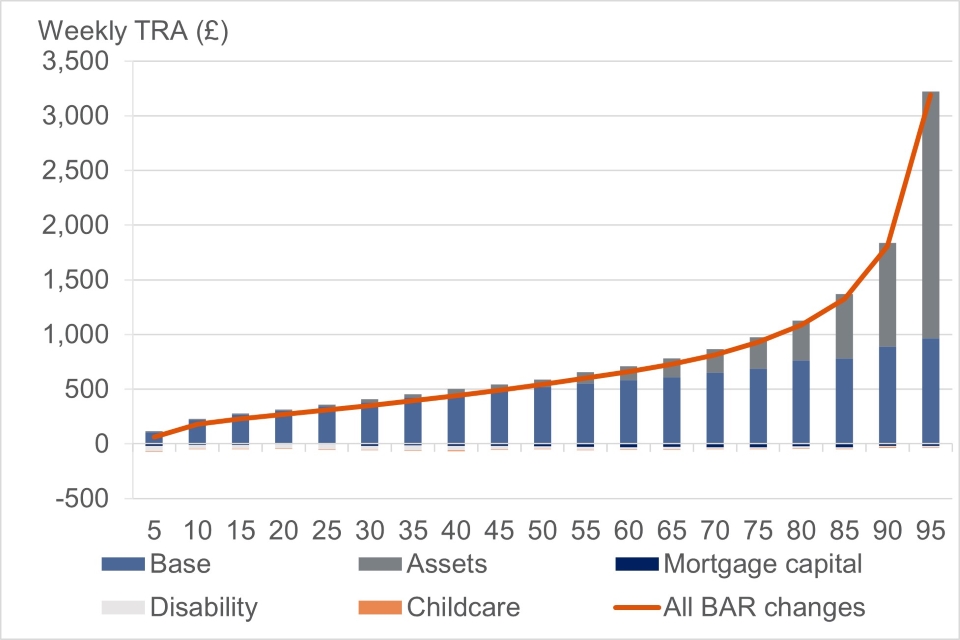
Figure notes:
- this chart has been restricted to only those in the 19th vigintile for interpretability. See the published data tables for the full data
- vigintiles are the sum of every five percentile. Vigintile groups are taken from the whole population TRA distribution. The mean impact for individuals in disabled families within these vigintiles are presented here
Figure 4.7: Mean impact of TRA components by vigintile, Individuals without a disabled family member, up to the 19th vigintile, FYE 2022

Figure notes:
- this chart has been restricted to only those in the 19th vigintile for interpretability. See the published data tables for the full data
- vigintiles are the sum of every five percentile. Vigintile groups are taken from the whole population TRA distribution. The mean impact for individuals in families with no disability within these vigintiles are presented here
This analysis shows that:
- in the bottom half of the income distribution, the addition of the TRA components to the base net income result in a lower TRA monetary amount than the total net income. However, further up the income distribution, the positive impact of liquid assets outweighs the negative impact of the cost components (childcare, disability and mortgage capital repayment costs). This means that for these vigintiles, the TRA monetary values are higher than the net income values. This is true for all groups except for individuals in non-disabled families
- the liquid assets component has an increasingly large impact higher up the income distribution. Pensioners are most affected by liquid assets, with relatively large positive impacts across the distribution. This raises the question of whether the current approach of assuming liquid assets are depleted within one year is appropriate, particularly regarding potential pensions decumulation
- the childcare component affects children more than other groups, with higher childcare costs being reported higher up the income distribution. It is important to note that the measure does not account for the use of informal childcare, childcare quality, or unmet need, so this may not be due to actually higher required costs at the top of the income distribution and may not reflect unmet need at other points of the income distribution
- disability costs are highest for disabled families and are also higher for pensioners. There tend to be lower disability costs at the higher end of the income distribution. Similarly to childcare costs, this may be due to the fact that this measure uses disability benefits received as a proxy for disability costs, and those higher up the income distribution may not claim these, rather than lower disability costs for richer individuals
- mortgage capital repayment costs primarily affect working age adults, children and individuals in non-disabled families, with increasing costs at the top of the income distribution. Pensioners are relatively unaffected by mortgage capital repayment costs
Consultation question 35: Are the percentages of individuals affected and average impact of each component as expected? Are there any findings that appear unexpected or warrant further investigation?
Consultation question 36: Please provide any additional comments you have on the content of this section.
5. Detailed review of poverty estimation method
This section provides a more detailed account of the Below Average Resources (BAR) methodological approach for estimating poverty, highlighting where there are differences in approach from Households Below Average Income (HBAI). This includes the sharing unit level approach from the calculation of the TRA components (see above), and the methodological steps outlined in Box 2 (repeated here from Diagram 2 in section 2).
It sets out the SMC principle for the approach taken and includes some illustrative analysis of the potential impact of these decisions on poverty estimation. The illustrative analysis varies each element of the methodological approach discussed whilst holding everything else constant, to isolate the potential impact of each methodological decision (for example, varying the sharing unit approach whilst everything else stays the same). In practice, decisions may be made based on the joint impact of different combinations of methodological changes (for example, varying the sharing unit approach and the smoothing approach together), which is something that will be explored through further development work.
Box 2 – Poverty threshold calculation and overcrowding adjustment
Box 2: This diagram shows how the poverty threshold is calculated and the overcrowding adjustment applied. The diagram shows that the Total Resources Available (TRA) values from three years (t, t-1, t-2) are equivalised. The smoothed equivalised median TRA (averaged across three years) is then calculated and the poverty threshold calculated from this as 54% of the smoothed equivalised median TRA. Family specific poverty thresholds are then calculated using reverse equivalisation. After this, for those in overcrowded housing, their TRA is calculated as their TRA minus the cost of renting an additional room. Every family’s TRA is then compared to their poverty threshold to determine poverty status.
Sharing unit
Principle
The SMC propose a newly-defined “sharing unit” to capture how resources are shared within households. The sharing unit is defined as everyone who lives within the same household and is related. In practice this is based on anyone self-reporting being related to another individual in the household (for example, including foster, step, in law and other relatives) within the Family Resources Survey (FRS). The SMC refer to this as ‘family’ for shorthand within their reports, as is also the case in this publication.
This approach is narrower than the approach in HBAI which assumes individuals share resources within their household, regardless of whether they are related. The SMC give examples of a household approach assuming that a group of unrelated young individuals living together, or a couple living with a lodger, share resources when this is not necessarily likely to be the case. However, the sharing unit approach adopted is broader than assuming sharing solely within a benefit unit (or smaller such as assuming no sharing between individuals at all) because there are examples where between benefit unit sharing could be more likely (for example, an adult living with their parents, and children within the same households as grandparents).
The SMC acknowledge that the sharing unit approach will still fail to perfectly capture the nature of sharing resources within all situations but propose that it is an improvement upon the household assumption and a practical approach based on available data (i.e. in the absence of data which specifically captures how resources are being shared).
Impact on poverty measurement
Figure 5.1: Percentage in low resources by whether a sharing unit (related) or household sharing assumption is used, FYE 2001 to FYE 2022
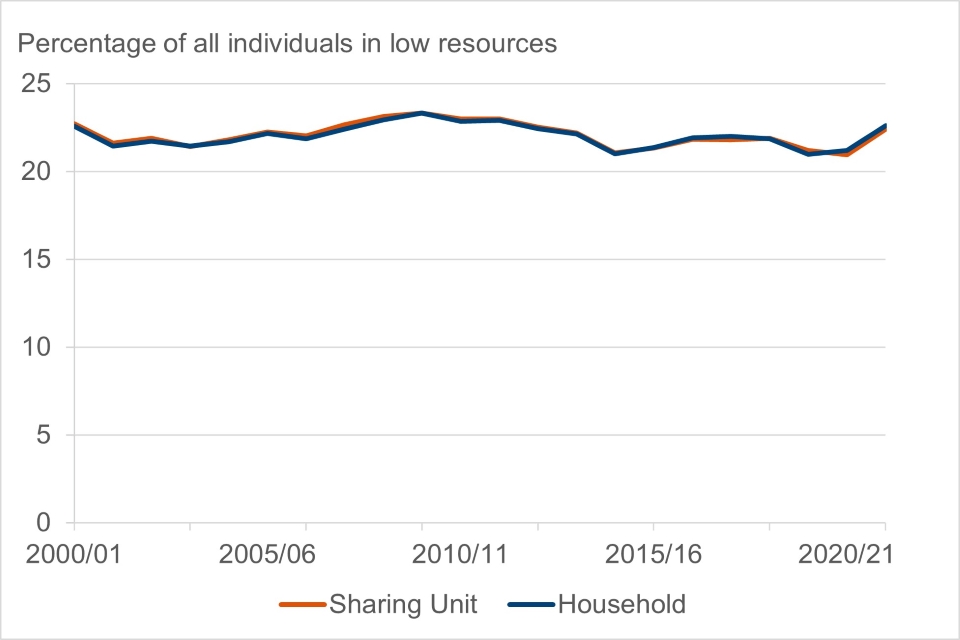
Using a sharing unit assumption rather than household has a very small impact on the percentage of all individuals found to be in low resources, with most differences less than one percentage point. Overall, using the sharing unit rather than household has led to higher levels of low resources since FYE 2001 except in FYE 2004, FYE 2015 to FYE 2019, and FYE 2021 to FYE 2022. However, all differences appear small.
Breakdowns by age group are provided in the published data tables. On average, compared to using household, using the sharing unit decreases the percentage in low resources for children and pensioners, but increases the percentage for working age.
Consultation question 37: Do you agree that a revised approach to defining a sharing unit is required, and why? If so, how is a sharing unit best defined?
Equivalisation
Principle
To allow a consistent basis for assessing the experience of poverty across different families, the SMC propose that a method of equivalisation is required which is based on an accurate assessment of how needs vary between different families, accounting for numbers and ages of adults and children in the family.
Approach
In practice, the SMC argue that an equivalisation approach that meets the requirements set out above does not exist. The SMC review the impact of different equivalisation approaches on poverty estimation, along with relative strengths and limitations in their Equivalisation in Poverty Measures report. The Office for National Statistics have also published a report examining the impact of a new equivalisation scale on income inequality statistics. Both of these reports illustrate that the choice of equivalisation approach can have a large impact on the understanding of poverty levels and set out the case for significant further work required to develop a new equivalisation approach.
In the absence of an appropriate new equivalisation approach, the SMC currently apply the OECD modified AHC equivalisation scale, which is the same as used for HBAI AHC estimates.
The timing of developing any new equivalisation scale will have a dependency on deciding on the other components of the BAR measure, since the scales will need to reflect equivalisation on an after inescapable costs basis (for example, the current modified OECD scale for AHC HBAI reflects needs on an after housing costs basis).
Consultation question 38: Do you agree a revised equivalisation approach is required, and why? Would this add significant value and how will it add value?
Consultation question 39: What are the potential options that should be considered for a new equivalisation approach? Are there existing approaches that should be considered here?
Smoothing
Principle
The SMC propose that being in poverty should be based on an assessment of resources relative to societal norms, which change over time. However, they propose that changes to societal norms should not be reflected in the poverty assessment immediately, but only if such changes are sustained. It was determined that the best way to do this is through a smoothed threshold. The SMC found little evidence to guide the decision on the time period for smoothing but decided to set the threshold as a lagged three-year rolling average of the median equivalised Total Resources Available.
The SMC therefore proposed that the poverty threshold be smoothed over three years so that poverty is assessed relative to sustained changes in social norms. In practice this means that to calculate the poverty threshold, the median is found from the equivalised TRA distributions for the year of interest and the previous two years. The poverty threshold is then set at 54% of this 3-year equivalised median (see below on threshold for discussion of the 54% value).
Impact on poverty measurement
This analysis explores the impact of changing the number of smoothing years on percentages of individuals in low resources and compares to percentages in relative low income AHC (which doesn’t adopt a smoothing approach).
Figure 5.2: Percentage in low resources by number of smoothing years used to calculate the poverty threshold, FYE 2003 to FYE 2022
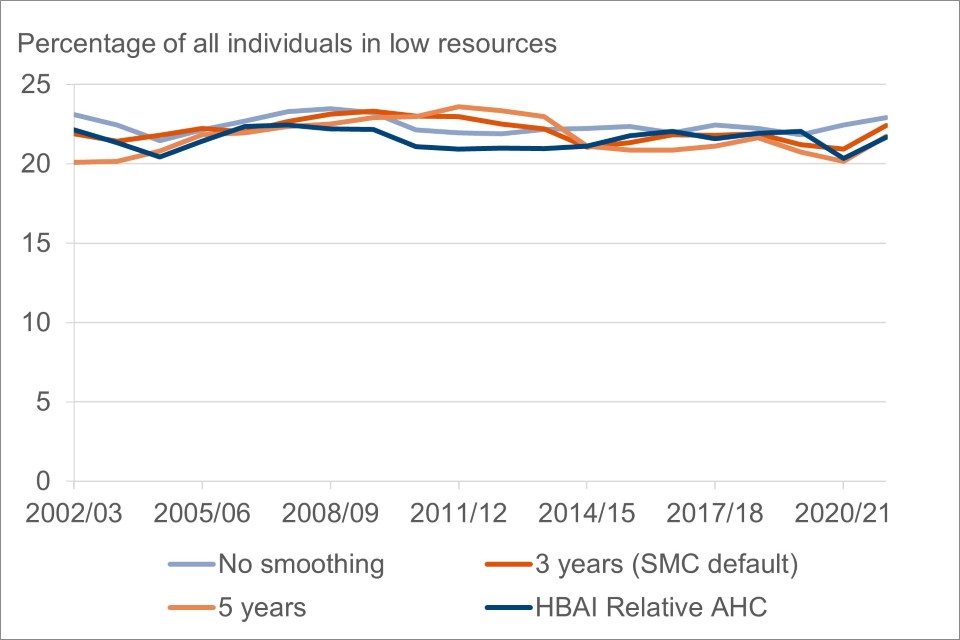
This analysis shows that while the HBAI poverty rate with the unsmoothed threshold stays stable/declines after the FYE 2009 recession, the BAR poverty rate smoothed to 3 years continues to rise. This suggests that the smoothing does counteract the phenomenon of lower poverty rates during a recession, which can be a critique of relative poverty measures.
Figure 5.3: Poverty threshold by number of smoothing years used to calculate the threshold, FYE 1999 to FYE 2022
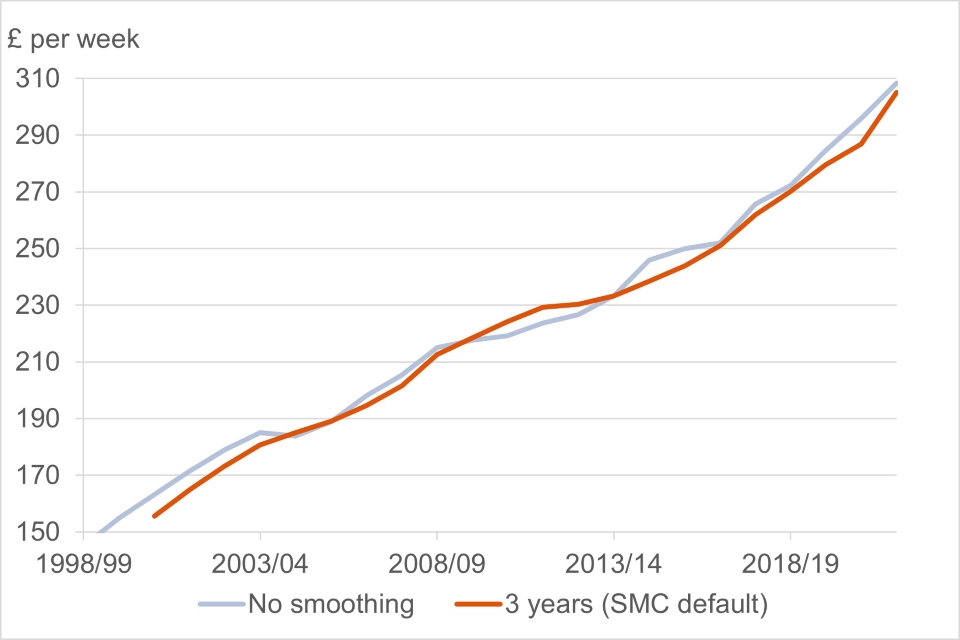
The smoothing approach means the phenomenon of individuals moving out of poverty without an increase in living standards does not occur as the threshold is more stable in time compared to the non-smoothed threshold.
Consultation question 40: If the poverty threshold is relative to social norms, should it be smoothed so that changes to social norms are only reflected in the poverty threshold if they are sustained?
Consultation question 41: If smoothing is appropriate, how many years should the poverty threshold be smoothed for? Is three years appropriate?
Poverty threshold
Principle
The SMC found little evidence to inform a decision on where to set the threshold, relevant to societal norms, beneath which a family would be considered to be in poverty. They therefore considered the choice of threshold as somewhat arbitrary. As their approach aimed to further the understanding of who was in poverty and how levels change over time, rather than significantly change the number of individuals in poverty, the poverty threshold was set to match the number of individuals in low resources to those in relative low income AHC on HBAI in a given reference year (FYE 2017 – the most recent available at the time when the SMC published their first report in 2018). On this basis, the threshold is currently set at 54% of the smoothed equivalised median TRA.
The SMC also propose as the measure develops, where methodological changes significantly change the number of individuals in low resources in FYE 2017, the threshold will be altered so that the overall numbers in low resources remain consistent with those for relative low income AHC on HBAI in FYE 2017.
Impact on poverty measurement
The analysis below shows that as the poverty threshold increases as a percentage of smoothed equivalised median TRA, the low resource rate increases. Whilst these results are unsurprising, it is noteworthy that the choice of threshold can make an important difference for the understanding of how many individuals are in low resource poverty.
Figure 5.4: Percentage in low resources for varying poverty thresholds (as a percentage of the median TRA), FYE 2001 to FYE 2022
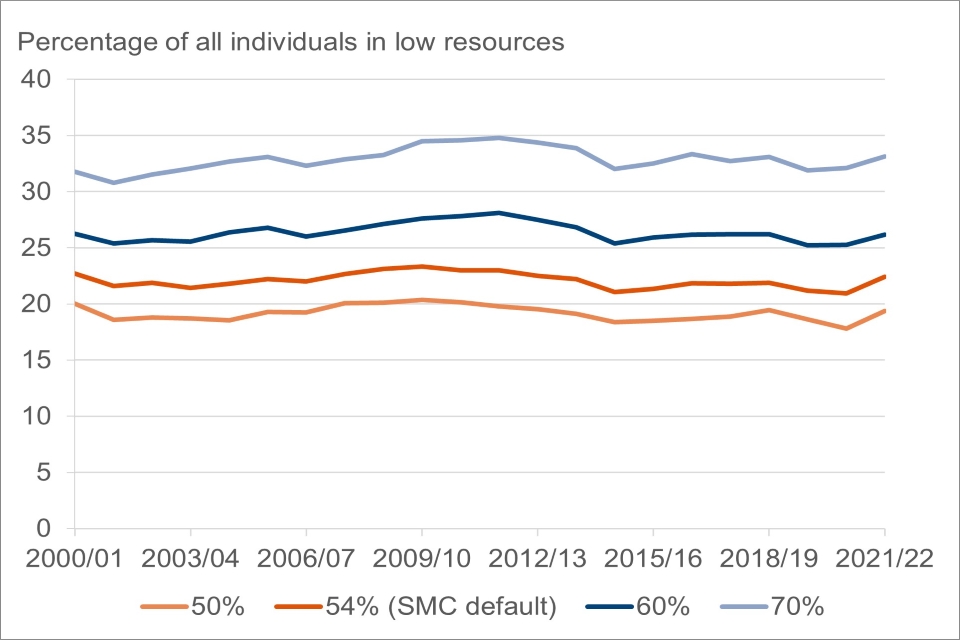
Consultation question 42: Is the determination of a poverty threshold somewhat arbitrary, or is there an objective basis for determining a threshold?
Consultation question 43: If the determination of the threshold is arbitrary, is baselining against a particular year in HBAI the best approach? If so, what year is most appropriate to use?
Consultation question 44: Should the poverty threshold change with methodological revisions to ensure that the low resources rate continues to match the baseline in a given reference year?
Overcrowding adjustment
Principle
In addition to accounting for housing costs, the SMC’s approach accounts for the fact that some families are unable to meet their housing needs due to resource constraint, and therefore live in overcrowded accommodation as a result.
The SMC suggest that in these cases families may have TRA values which are above the low resource threshold, but if their housing needs were met they would not be able to meet other needs (due to resource diversion) and their available resources would in fact bring them below the low resources threshold.
Where families live in a property which has too few bedrooms for the number of occupants, the prevailing market rate for renting an extra room in their region is deducted from the family’s TRA. Where this deduction from the TRA results in the individual falling below the low resource threshold, they are then also counted as being in low resource poverty. This adjustment is applied after the smoothed equivalised median TRA and low resource threshold have been determined.
Impact on poverty measurement
As a result of the overcrowding adjustment, around 200,000 more individuals are in low resource poverty each year, corresponding to a difference of between 0.3 and 0.4 percentage points.
Consultation question 45: Should the measure include an adjustment for overcrowding? If yes, is the current method the most appropriate? Are there other approaches that should be considered?
Consultation question 46: Should any adjustment be applied after the determination of the smoothed median equivalised TRA and low resource threshold? Are there other approaches that should be considered?
Consultation question 47: Should adjustments be made for under occupied houses where individuals choose to have more than the minimum required?
Consultation question 48: Should other adjustments for housing adequacy be made? If yes, what approaches should be considered?
Consultation question 49: Please provide any additional comments you have on the content of this section.
6. Wider poverty measurement framework
As discussed above, the DWP’s development work will focus initially on developing the core basis of the Below Average Resources (BAR) measure focusing on the elements covered in Boxes 1 and 2 (of Diagram 2) and using the Family Resources Survey (FRS). It is possible to examine the poverty depth and rough sleeping parts of the Wider Measurement Framework shown in Box 3 (repeated here from Diagram 2 in section 6) based on the current BAR approach, but the poverty persistence and lived experience indicators are not included in the current publication.
Box 3 – Poverty Measurement Framework
Box 3: This diagram shows the wider measurement framework of the measure as proposed by the SMC. It shows that rough sleepers are added to the total number of people in poverty. It also shows that the poverty depth, poverty persistence and lived experience indicators sit alongside the measure of the number of people in poverty.
Poverty depth
As part of the SMC’s wider poverty measurement framework, they report how far above and below individuals are from the poverty line based on their Total Resources Available (TRA) values compared to the TRA value of the poverty line. This is considered important given the discussion around the somewhat arbitrary nature of setting a poverty threshold, and therefore needing to additionally consider distance from the line rather than simply whether individuals are above or below it. This allows consideration of how far individuals would need to increase their TRA to move them out of low resources, as well as potential risk of falling into low resources for those above the line.
The SMC examine poverty depth by splitting the TRA distribution into bands based on monetary distance from the BAR threshold. The analysis below looks at the equivalised TRA distribution to examine depth of low resources. Note that this approach differs slightly from the poverty depth analysis presented in SMC reports which is based on unequivalised TRA. Equivalised TRA is presented here for consistency with analysis presented throughout the publication.
Table 6.1.1 shows that in the FYE (Financial Year Ending) 2022, 8.2 million individuals (12% of all individuals), had TRA values that were below 25% of the BAR threshold. For children this figure is 2.4 million (17%), for working age it is 5.1 million (13%) and for pensioners it is 0.6 million (5%). This suggests that children are more likely to be in very deep low resources than other age groups. Individuals in this group would have to significantly increase their resources to move above the BAR threshold.
Table 6.1.1: Number and percentage of individuals at different distances from the BAR poverty line, FYE 2022
| BELOW poverty line | All individuals % (and number) | Children % (and number) | Working age % (and number) | Pensioners % (and number) |
|---|---|---|---|---|
| > 50% below | 6% (3.7 million) | 7% (0.9 million) | 6% (2.6 million) | 2% (0.2 million) |
| 25.1% to 50% below | 7% (4.5 million) | 0% (1.5 million) | 6% (2.6 million) | 4% (0.4 million) |
| 10.1% to 25% below | 6% (3.8 million) | 10% (1.4 million) | 5% (1.9 million) | 4% (0.5 million) |
| 5.1% to 10% below | 2% (1.3 million) | 3% (0.4 million) | 2% (0.6 million) | 2% (0.2 million) |
| <=5% below | 2% (1.3 million) | 3% (0.5 million) | 2% (0.7 million) | 2% (0.2 million) |
| ABOVE poverty line | All individuals % (and number) | Children % (and number) | Working age % (and number) | Pensioners % (and number) |
|---|---|---|---|---|
| <=5% above | 2% (1.1 million) | 2% (0.3 million) | 1% (0.6 million) | 2% (0.2 million) |
| 5.1% to 10% above | 2% (1.3 million) | 3% (0.4 million) | 2% (0.7 million) | 2% (0.2 million) |
| 10.1% to 25% above | 5% (3.4 million) | 7% (1 million) | 5% (1.9 million) | 5% (0.5 million) |
| 25.1% to 50% above | 9% (5.7 million) | 12% (1.7 million) | 8% (3.1 million) | 8% (0.9 million) |
| >50% above | 60% (40.1 million) | 43% (6.2 million) | 64% (25.6 million) | 71% (8.3 million) |
Table note: Percentages may not sum exactly to 100%, and numbers may not sum to exact totals, due to rounding.
Table 6.1.1 also shows the distribution of individuals above the BAR threshold. Considering individuals just above the BAR threshold, 1.1 million individuals (2%) were between 0.1% and 5% above the line. This includes 0.3 million children (2%), 0.6 million working age (1%) individuals and 0.2 million pensioners (2%).
Figure 6.1.2: Percentage of individuals in each depth band, for those below the poverty threshold, FYE 2001 to FYE 2022
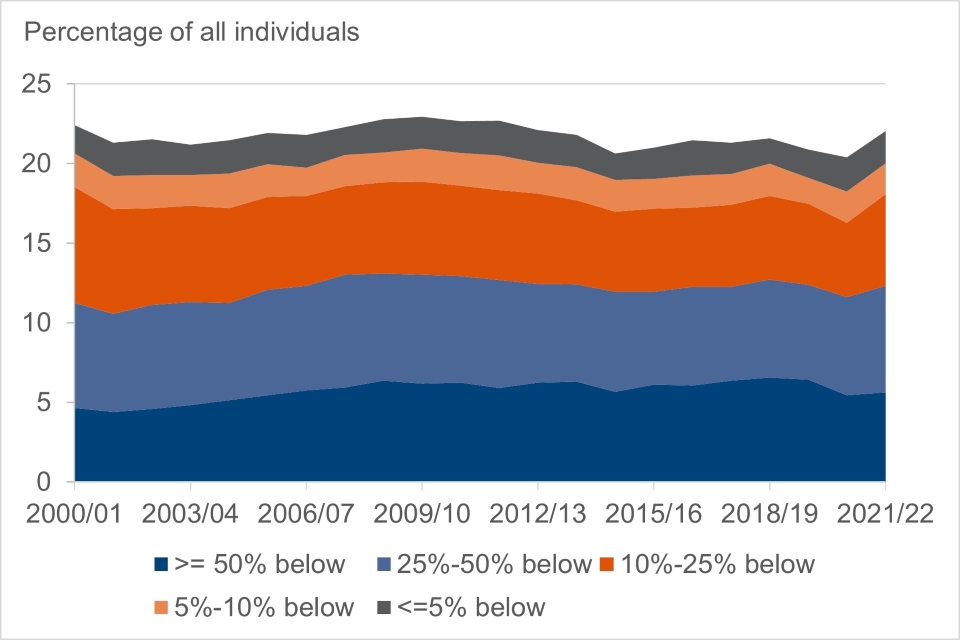
Figure 6.1.2 shows that there has been a one percentage point increase in the percentage of all individuals in low resources below 50% of the BAR threshold since FYE 2001. The percentage of individuals in low resources below 50% of the BAR threshold peaked in FYE 2019 at 7%, and decreased to 6% in FYE 2022.
Figure 6.2: Number of individuals in £10 per week TRA bands by age group, FYE 2022, for those with incomes under £1,000 per week
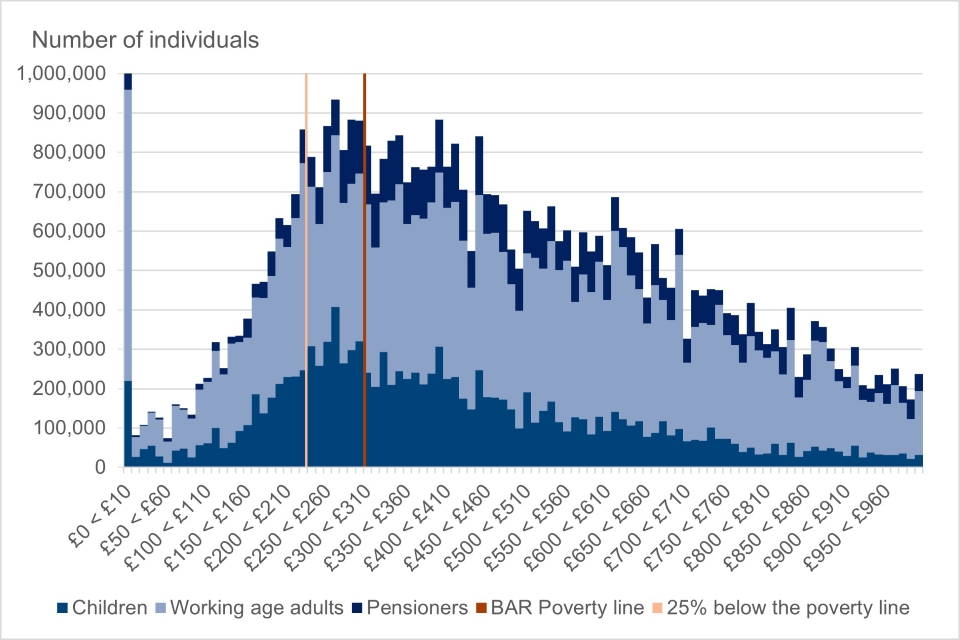
Figure notes:
- in the BAR calculation, anyone with negative TRA is counted as having £0 TRA, hence the large number of individuals in the bottom income bracket
- this figure has been restricted to only those with incomes less than £1,000 per week for interpretability. See the published data tables for the full data
Figure 6.2 shows the number of individuals in each TRA band, split by age group with the depth thresholds overlaid for FYE 2022.
This illustrates that, overall, for those in low resources, more than half were below 25% of the BAR threshold in FYE 2022. This is mostly driven by working age adults (61% are below 25% of the threshold) and children (49% are below 25% of the threshold) in FYE 2022. A lower percentage of pensioners in low resources (41%) were below 25% of the threshold in FYE 2022 and historically.
Consultation question 50: Should poverty depth be considered in addition to who is below the threshold? What value does it add for users?
Consultation question 51: Is using depth bands an appropriate way to measure depth of poverty? Are there alternative approaches that should also be considered? What are the relative strengths and limitations of these?
Rough sleepers
The SMC noted that poverty measures based on household survey data lead to underrepresentation of some groups (for example, sofa surfers) and omission for others (for example, individuals living outside of typical households, such as in prisons, children’s homes, homeless or sleeping rough) meaning that it is not fully representative of the UK population. The SMC suggest the need for further work to consider this issue.
To partially address this, the SMC include all of those who are regarded as sleeping rough in its current measure of poverty by adding the estimate of the number of rough sleepers to the total number of individuals in poverty. The number of individuals included as sleeping rough in the 2018 SMC report was 5,000. Including rough sleepers in the poverty estimate does not impact the rounded poverty rates reported.
The DWP acknowledges the important issue that measures based on household surveys will not be fully representative of the UK population. However, the DWP propose to focus on development of the BAR measure based on the FRS data currently and to acknowledge that this will not include those not represented in household surveys. Given the complexity of meaningfully capturing groups not represented by household surveys, it is agreed that separate substantial work would be required to investigate this issue.
Consultation question 52: Do you agree with the DWP proposal to focus on developing the BAR measure based on household survey data only, whilst acknowledging the limitation of not representing groups outside typical households?
Consultation question 53: Are there meaningful ways to capture groups not currently represented in household surveys within the BAR measure? If so, what would this entail, and what are the relative strengths and limitations of any proposed approaches?
Consultation question 54: Please provide any additional comments you have on the content of this section.
7. Wider considerations
Proportionate data collection
As with any self-reported survey data, there is a question around how accurately and robustly it is possible to measure the various components of the BAR measure whilst balancing the need to not overburden respondents and negatively impact response rates.
An alternative, or complementary, approach could be to use imputation or modelling of some of the income and cost elements, based on self-reported data combined with evidence informed assumptions.
In the longer term, the FRS Administrative Data Transformation Project may offer further opportunities here by linking the survey to administrative data to reduce respondent burden for some types of information. However, this work is in parallel development so the exact scope of potential changes is not yet fully determined.
Consultation question 55: Do you have any views on using modelling and/or imputation for some elements of the BAR measure as an alternative or complement to self-reported data? Are there particular components where this would be beneficial, or should be avoided? What are the potential strengths and limitations of any such approach?
Consultation question 56: Are there any elements of the BAR measure where robust and comprehensive data collection will be too challenging? If yes, what are these and why?
Development timescales
It will take a significant number of years to develop the BAR measure and to build up a consistent time series once the measure is agreed and stable. This is affected by several key factors:
- the extensive work required to fully explore all of the issues outlined above and incorporate user feedback through a series of Official Statistics in Development publications. Through this work, the DWP will make recommendations about the TRA components and methodological approach to ensure a robust BAR measure that best meets user needs and adds value to existing measures
- the timescales involved in adding any new questions, or amending existing questions, to the Family Resources Survey (FRS) if this is required. For example, any changes suggested to the FRS questionnaire in 2024 will go into the field for FYE 2025 to 2026, with data published in 2027
- as mentioned above, the parallel FRS Administrative Data Transformation Project will also be continuing and any work across projects will need to be aligned and coordinated;
- the current three year smoothing basis requires building up three years of consistent data to provide one single year poverty estimate, and then subsequent years are required to add to that to start to build a time series
- the time it will take to develop a new equivalisation approach. Whilst this work can be undertaken in parallel, an appropriate approach cannot be fully developed until the BAR measure is fully developed to ensure it accounts for the relevant inescapable costs when determining needs
Diagram 7 – Potential timescales for development of the BAR measure

Diagram 7 shows the potential timescales for development of the BAR measure. It illustrates two scenarios.
In Scenario 1, new debt data is available for the FRS FYE 2023 in 2024, for the FRS FYE 2024 in 2025 and for the FRS FYE 2025 in 2026. Other existing FRS data and conceptual refinements and revised equivalisation approach is also assumed to be available. To establish a consistent time series, the first single year estimate (based on three year smoothing) would be available in 2026, with subsequent single year estimates available in subsequent years.
In Scenario 2, FRS changes are proposed for 2024 so new data is available for the FRS FYE 2026 in 2027, for the FRS FYE 2027 in 2028 and for the FRS FYE 2028 in 2029. Other existing FRS data and conceptual refinements and revised equivalisation approach is also assumed to be available. To establish a consistent time series, the first single year estimate (based on three year smoothing) would be available in 2029, with subsequent single year estimates available in subsequent years.
Diagram 7 illustrates potential timescales for development of the BAR measure in order to start building a consistent time series.
Scenario 1 is based on not needing to make any further changes to the FRS and new debt data for FYE 2023 becoming available in 2024. This shows the need to build up three years of consistent data to produce a one-year estimate in 2026, with a five year time series built up in 2030.
Scenario 2 accounts for needing to suggest further changes to the FRS during the course of development work in 2024. The knock-on impact will be an initial single year estimate in 2029, with a five year time series in 2033.
Consultation question 57: Do you have any feedback on the timescales set out here? Are there any important considerations missed that could shorten/lengthen these timescales?
Consultation question 58: Is it problematic that it may not be possible to produce a consistent historical time series for the BAR measure? Are there any approaches to address this? What are the relative strengths and limitations?
Consultation question 59: From a user perspective, what is the relative importance of having a consistent time series, versus breaking the time series to continue developing and refining the measure?
Consultation question 60: Please provide any additional comments you have on the content of this section.
8. Next steps
The DWP will continue to develop the measure, working with stakeholders, whilst the consultation runs in parallel. There are several areas for ongoing and future development work, not limited to but including:
- detailed examination of the trends presented in this publication. Further work is required to identify the factors explaining key differences shown between BAR and HBAI measures over time, as well as between different sub-groups within the BAR measure. Subject to sample sizes, this could include multivariate analysis to understand the relative importance of different combinations of factors in relation to low resources poverty
- analysing in more detail, and testing the robustness of, the different elements of the BAR measure (both the TRA components and methodological changes compared to HBAI) with further sensitivity analysis, informed by existing poverty measurement and subject-specific evidence both in the UK and internationally, complemented by further detailed analysis of FRS and other relevant data sources
- consideration of potential refinements to the current approach, including whether more variables can be derived at the sharing unit level, any FRS data collection implications of this and analysis of how much difference any such changes make to estimation
- reviewing potential changes or additions required for the FRS questionnaire to robustly capture and measure the TRA components
- updating the analysis with the latest FRS and HBAI data for FYE 2023 once published
- consideration of the wider SMC framework elements not included in the current publication, such as persistent poverty and lived experience indicators
The user feedback from the consultation will play a direct role in shaping and influencing the priorities for ongoing development of the measure to ensure it best meets user needs. A consultation response will be published within 12 weeks of the consultation closing, summarising the nature of responses received and setting out next steps for ongoing development work and future publications.
Consultation question 61: Please provide any comments you have on the content of this section.
9. Consultation and further feedback
Consultation information
The analytical consultation ran from 18 January to 11 April 2024, and has now closed. We will publish a response to the feedback we received from users by 4 July 2024.
Consultation question 62: Is there any further feedback you would like to provide related to the development of these statistics?
Feedback
We are keen to hear any feedback you have on the development of these statistics, email: team.povertystats@dwp.gov.uk