Experimental statistics – weekly NHS test and trace bulletin, England: 28 May to 10 June 2020
Published 18 June 2020

© Crown copyright 2020
This publication is licensed under the terms of the Open Government Licence v3.0 except where otherwise stated. To view this licence, visit nationalarchives.gov.uk/doc/open-government-licence/version/3 or write to the Information Policy Team, The National Archives, Kew, London TW9 4DU, or email: psi@nationalarchives.gov.uk.
Where we have identified any third party copyright information you will need to obtain permission from the copyright holders concerned.
This publication is available at https://www.gov.uk/government/publications/nhs-test-and-trace-statistics-england-28-may-to-10-june-2020/experimental-statistics-weekly-nhs-test-and-trace-bulletin-england-28-may-to-10-june-2020
These figures have been revised. The most recent figures and reasons for the revisions are available in the latest report.
The data in the tables below reflect the first 2 weeks of operation of the contact tracing element of NHS Test and Trace. They include contact tracing undertaken:
- online
- by local health protection teams
- by contact tracing staff
Main points
NHS contact tracing went live on 28 May.
Between 4 June and 10 June 2020:
- 5,949 people who tested positive for coronavirus (COVID-19) had their case transferred to the contact tracing system
- of these, 4,366 people (73.4%) were reached and asked to provide details of recent close contacts. This compares to 72.0% in the previous week
- 1,435 people (24.1%) could not be reached. An additional 148 people (2.5%) could not be reached at all as no communications details were provided for them
As a result of this, between 4 June and 10 June 2020, 44,895 people were identified as close contacts. Of these, 40,690 people (90.6%) were reached and asked to self-isolate. This compares to 90.5% in the previous week.
In total, since 28 May 2020:
- 14,045 people who tested positive for coronavirus (COVID-19) had their case transferred to the contact tracing system, of whom 72.6% (10,192 people) were reached and asked to provide details of their recent close contacts
- 87,639 people were identified as close contacts and reached through the contract tracing system out of 96,746 reported (90.6%)
Terminology
NHS Test and Trace has 2 principal ways to handle cases depending on their complexity:
- local health protection teams to manage complex cases linked to outbreaks (referred to as complex cases hereafter)[footnote 1]
- wider online and other call centre capacity for less complex cases (referred to as non-complex cases hereafter)
More details on the types of case can be found in the methodology document.
Revisions for 28 May to 3 June
Note that figures for last week’s release have been revised. These revisions are for 2 reasons:
- the figures presented are based on a data cut a number of days after the end of the reporting period to give time for cases reported towards the end of the 7-day period to have an outcome. Some cases may continue to be in progress after this period, and therefore data may need to be revised over time (see methodology for more detail)
- Public Health England (PHE) carried out an audit exercise on historic complex cases and contacts, which has increased the numbers previously reported
Test and trace: number of people who tested positive for coronavirus that were transferred to the contact tracing system
Figure 1: Flowchart showing how people move through the NHS Test and Trace service
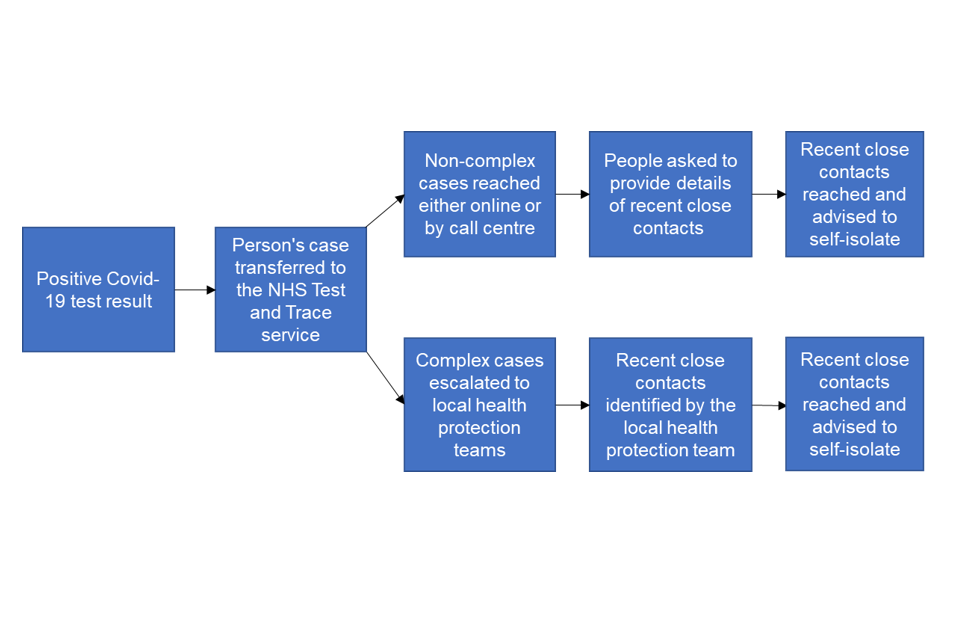
The diagram shows the journey a person can take through the NHS Test and Trace service. This starts with a positive COVID-19 test result. A person’s case is then transferred to the NHS Test and Trace service and can be managed in one of two ways. First, non-complex cases are reached either online or by a call centre. They’re then asked to provide details of recent close contacts. These recent close contacts are then reached by the NHS Test and Trace service and advised to self-isolate. Second, complex cases are escalated to local health protection teams who work to identify and reach recent close contacts and advise them to self-isolate.
Between 4 June and 10 June almost three-quarters of people transferred to the contact tracing system were reached and asked to provide information about their contacts
Table 1: People transferred to the contact tracing system (includes complex and non-complex cases) by whether they were reached and asked to provide contact details,[footnote 2] England
| 28 May to 3 June: number of people (percentage) | 4 June to 10 June (percentage) | Since start of Test and Trace: 28 May to 10 June (percentage) | |
|---|---|---|---|
| People who were reached and asked to provide details of recent close contacts | 5,826 (72.0%) | 4,366 (73.4%) | 10,192 (72.6%) |
| People who were not reached | 2,000 (24.7%) | 1,435 (24.1%) | 3,435 (24.5%) |
| People whose communication details were not provided | 270 (3.3%) | 148 (2.5%) | 418 (3%) |
| Total | 8,096 | 5,949 | 14,045 |
Figure 2: Proportion of people transferred to the contact tracing system (includes complex and non-complex cases) by whether they were reached and asked to provide contact details, England, 28 May to 10 June 2020[footnote 3]
| Percentage | Week 1: 28 May 2020 to 3 June 2020 | Week 2: 4 June 2020 to 10 June 2020 |
|---|---|---|
| Reached and asked to provide details of recent close contacts | 72.0% | 73.4% |
| Not reached | 24.7% | 24.1% |
| Communication details not provided | 3.3% | 2.5% |
After a person’s coronavirus test is confirmed as positive, they will be transferred to the contact tracing system to be contacted.[footnote 4] The number of these people who were reached and asked to provide details of recent close contacts includes complex cases investigated by local public health teams.
The number of these that had no communication details provided are people for which there were no contact details (for example, phone number or email address). This information is only available for people whose cases were non-complex and handled through the contact tracing system, because those handled by local public health teams are managed at a situation rather than individual level.
The number of people who were not reached includes those people who the service has been unable to reach because there has been no response to text, email and call reminders. There may also be a small number of people who have not been reached but where contact tracers are still in the process of trying to make contact.
For non-complex cases most people continued to be successfully reached and asked to provide details about recent close contacts within 24 hours of their case being transferred to contact tracing
Figure 3: Proportion of people who were reached and asked to provide details about recent close contacts by time taken to reach them, England, 28 May to 10 June 2020 (this excludes complex cases)
| Percentage | Week 1: 28 May 2020 to 3 June 2020 | Week 2: 4 June 2020 to 10 June 2020 |
|---|---|---|
| After 72 hours | 8.6% | 7.3% |
| Between 48 hours and 72 hours | 2.4% | 3.8% |
| Between 24 hours and 48 hours | 13.6% | 10.9% |
| Within 24 hours | 75.4% | 78.0% |
Table 2: People who were reached and asked to provide details about recent close contacts by time taken to do so, England, 4 June to 10 June 2020 (this excludes complex cases)
| 28 May to 3 June: number of people (percentage) | 4 June to 10 June: number of people (percentage) | |
|---|---|---|
| Within 24 hours | 3,312 (75.4%) | 2,785 (78.0%) |
| Between 24 and 48 hours | 597 (13.6%) | 391 (10.9%) |
| Between 48 and 72 hours | 106 (2.4%) | 135 (3.8%) |
| After 72 hours | 377 (8.6%) | 261 (7.3%) |
| Total | 4,392 | 3,572 |
Number of recent close contacts identified through the contact tracing system
Close contacts are those people who have been identified as being in recent close contact with someone who has tested positive for coronavirus.
Table 3: Number of people identified as recent close contacts by whether they were reached and asked to self-isolate, England, 28 May to 10 June 2020 (includes contacts related to both complex and non-complex cases)
| 28 May to 3 June: number of people (percentage) | 4 June to 10 June (percentage) | Since start of Test and Trace: 28 May to 10 June (percentage) | |
|---|---|---|---|
| People who were identified as recent close contacts and asked to self-isolate | 46,949 (90.5%) | 40,690 (90.6%) | 87,639 (90.6%) |
| People who were identified as recent close contacts but not reached | 4,902 (9.5%) | 4,205 (9.4%) | 9,107 (9.4%) |
| Total | 51,851 | 44,895 | 96,746 |
Of the people who identified as recent close contacts but were not reached between 4 June and 10 June, 2,137 could not be reached because no communication details were provided for them (for example, a phone number or email address).
Of the people who identified as recent close contacts but were not reached between 28 May and 10 June, 4,631 could not be reached because no communication details were provided for them. This makes up 24.2% of those contacts for 4 June and 10 June and 24.5% of contacts for 28 May to 10 June.[footnote 5]
The number who were not reached includes those people who the service has been unable to reach because there has been no response to text, email and call reminders, or those for which no contact details were provided to NHS Test and Trace (for example, phone number or email address). Further, there are some contacts who were reached but have not agreed to self-isolate.
Figure 4: Proportion of recent close contacts identified by whether they were reached and asked to self-isolate, England, 28 May to 10 June 2020 (includes contacts related to both complex and non-complex cases)
| Percentage | Week 1: 28 May 2020 to 3 June 2020 | Week 2: 4 June 2020 to 10 June 2020 |
|---|---|---|
| Reached and asked to self-isolate | 90.5% | 90.6% |
| Not reached | 9.5% | 9.4% |
For non-complex cases, where recent close contacts have been advised to self-isolate, more than 4 out of 5 of them were reached within 24 hours of being identified
Figure 5: Proportion of recent close contacts who were advised to self-isolate by time taken to reach them, England, 28 May to 10 June 2020 (this does not include complex cases)
| Percentage | Week 1: 28 May 2020 to 3 June 2020 | Week 2: 4 June 2020 to 10 June 2020 |
|---|---|---|
| After 72 hours | 1.8% | 2.3% |
| Between 48 hours and 72 hours | 3.2% | 2.3% |
| Between 24 hours and 48 hours | 10.4% | 9.3% |
| Within 24 hours | 84.6% | 86.1% |
Table 4: People identified as recent close contacts who were advised to self-isolate by time taken to reach them) England, 4 June to 10 June 2020 (this does not include complex cases)
| 28 May to 3 June: number of people (percentage) | 4 June to 10 June: number of people (percentage) | |
|---|---|---|
| Within 24 hours | 4,471 (84.6%) | 4,059 (86.1%) |
| Between 24 and 48 hours | 550 (10.4%) | 438 (9.3%) |
| Between 48 and 72 hours | 168 (3.2%) | 108 (2.3%) |
| After 72 hours | 93 (1.8%) | 110 (2.3%) |
| Total | 5,282 | 4,715 |
Measuring the data
How the data were collected
These data are collected from management information from the NHS Test and Trace service. More details about the methodology used can be found at the methodology page.
Future development
Over June, these data will be integrated with those from other parts of NHS Test and Trace, particularly testing, to provide an end-to-end view of the service that follows the user journey.
This will include both the numbers of people engaged and the speed of the journey through the service, including data on test turnaround times.
The intention is for the NHS Test and Trace service to publish weekly statistics. In addition, NHS Test and Trace will provide information for local authorities and their partners so that they have the information they need to help contain any outbreaks.
In time, NHS Test and Trace intends to publish detailed data from across the programme to support secondary analysis, for example in academic institutions. Over the coming weeks, as the service matures, more information will be provided on a weekly basis.
Further breakdowns of complex and non-complex cases are not currently given as NHS Test and Trace is a single service and some cases are first dealt with as non-complex cases before being escalated. More informative breakdowns are being developed for future releases.
Quality
These statistics have been put together by NHS Test and Trace with advice from the Office for National Statistics on this approach.
More information on quality and how this publication adheres to the Code of Practice for statistics is available in the statement of compliance.
Strengths and limitations
Given the importance of this service and the commitment of NHS Test and Trace to be open and transparent with the public it serves, these data are being released at the earliest possible opportunity.
However, new IT systems and statistical outputs often take a period of time to bed in. These data should therefore be treated with caution as the system and understanding of the data develops.
The figures presented are based on a data cut 6 days after the end of the reporting period, to give time for cases reported at the end of the 7-day period to have an outcome. Some cases may continue to be in progress after this period, and therefore data may need to be revised over time.
Experimental statistics
Experimental statistics are statistics that are in the testing phase and not yet fully developed.
Find out more about experimental statistics from the Governmental Statistics Service (GSS)
-
For example, if someone works in or has recently visited: a health or care setting, such as a hospital or care home; a prison or other secure setting; a school for people with special needs; critical national infrastructure or areas vital for national security. ↩
-
Data for how many people were reached but did not have any recent close contacts is not currently available. ↩
-
Data has been split to show those cases whose communication details were not provided. Previous publication included cases where communication details not provided under ‘Not reached and asked to provide contact details’. Numbers have been revised for previous week to account for new methodology. ↩
-
All people who test positive for coronavirus should be transferred to the test and trace system. However, the methodology for testing data is currently under review (see Number of coronavirus (COVID-19) cases and risk in the UK. We aim to report this figure in future publications. ↩
-
This information is only available for those recent close contacts related to non-complex cases. This data is not available for recent close contacts relating to complex cases because these are usually managed at a situation (for example, care home) rather than individual level. ↩