Background information: Unfulfilled eligibility in the benefit system, 2023 to 2024 estimates
Published 16 May 2024
Applies to England, Scotland and Wales

© Crown copyright 2024
This publication is licensed under the terms of the Open Government Licence v3.0 except where otherwise stated. To view this licence, visit nationalarchives.gov.uk/doc/open-government-licence/version/3 or write to the Information Policy Team, The National Archives, Kew, London TW9 4DU, or email: psi@nationalarchives.gov.uk.
Where we have identified any third party copyright information you will need to obtain permission from the copyright holders concerned.
This publication is available at https://www.gov.uk/government/statistics/unfulfilled-eligibility-in-the-benefit-system-financial-year-2023-to-2024-estimates/background-information-unfulfilled-eligibility-in-the-benefit-system-2023-to-2024-estimates
Purpose of the statistics
Context and purpose of the statistics
This document supports our main publication which contains estimates of the level of unfulfilled eligibility in the benefit system in Financial Year Ending (FYE) 2024.
We measure unfulfilled eligibility so we can understand the levels, trends, and reasons behind it. This understanding supports decision making on what actions DWP can take to ensure claimants tell us accurately about their circumstances so they can get the amount of benefit they are eligible for.
Within DWP these statistics are used to evaluate, develop, and support policy, strategy and operational decisions, initiatives, options, and business plans through understanding the causes of unfulfilled eligibility.
As this is the first time the unfulfilled eligibility statistics have been published, and for the purposes of transparency, the FYE 2024 estimates will feed into the FYE 2024 DWP annual report and accounts.
The unfulfilled eligibility estimates are also used to answer Parliamentary Questions and Freedom of Information requests, and to inform DWP Press Office statements on unfulfilled eligibility.
Limitations of the statistics
The estimates do not include reviews of every benefit each year. In FYE 2024 Disability Living Allowance was measured, whereas in FYE 2023 Employment and Support Allowance was measured instead. Also, this year the Pension Age Housing Benefit client groups were measured, rather than the Non-passported Working Age Housing Benefit client group that was measured in FYE 2023.
This document includes further information on limitations – for example, on benefits reviewed (section 1), omissions to the estimates (section 2), and our sampling approach (section 3).
We are unable to provide sub-national estimates of unfulfilled eligibility as we are unable to break the statistics down to this level.
Comparisons between the statistics
These statistics relate to the levels of unfulfilled eligibility in the benefit system in Great Britain. They estimate how much extra money benefit claimants could be getting if they told us accurately about their circumstances. These people are already getting some money on a certain benefit but may not be getting all the money they could be eligible for on this benefit. This is because people are not eligible for increases in the amount of money they receive until they provide correct information to the department.
The statistics do not cover take-up of benefits, which is where people could have claimed certain benefits based on their current circumstances but have not done so. Income-related benefits: estimates of take-up is a separate DWP publication about take-up of benefits.
The unfulfilled eligibility estimates are based on information that was previously included in the Fraud and error in the benefit system statistics as Claimant Error underpayments. They were removed and reclassified and are now published separately following a planned review of the fraud and error statistics that was referred to in its FYE 2023 publication. The purpose of this review was to align the statistics more closely with benefit legislation. The review determined that the estimates now included in the unfulfilled eligibility publication should not be defined as underpayments. In benefit legislation, people are not eligible for increases in the amount of money they get until they tell us all of the correct information.
For this first publication of the unfulfilled eligibility statistics, estimates are available for FYE 2024 and for FYE 2023, to allow comparisons to be made. Estimates of unfulfilled eligibility are not directly comparable to previous estimates of Claimant Error underpayments published in the fraud and error statistics. While the two calculation methodologies are very similar, there is one difference relating to the netting adjustment. When the estimates were classified as Claimant Error underpayments, a netting adjustment was made to the data where overpayments and underpayments on the same claim were netted off each other, to calculate the net effect of each claim. Following the reclassification, fraud and error and unfulfilled eligibility are defined and published separately, so there is no longer a netting adjustment that can be made to unfulfilled eligibility claims. This led to a minimal increase in the unfulfilled eligibility estimates, when compared to Claimant Error underpayment estimates.
When comparing different years within our publication, we recommend comparing percentage rates of unfulfilled eligibility rather than monetary amounts. This is because the amount of unfulfilled eligibility in pounds could go up, even if the percentage rate of unfulfilled eligibility stays the same or goes down, if the amount of benefit we pay out in total goes up compared to the previous year.
Source of the statistics
We take a sample of benefit claims from our administrative systems. DWP’s Performance Measurement (PM) team contact the benefit claimants to arrange a review. The outcomes of these reviews are recorded on a bespoke internal database called FREDA. We use data from here to produce our estimates.
We also use other data to inform our estimates – for example:
- benefit expenditure data (aligning with the Spring Budget published forecasts)
- Other DWP data sources and models to improve the robustness of, or categorisations within, our estimates Further information on the data we use to produce our estimates is contained within section 3, section 4 and section 5 of this report
Definitions and terminology within the statistics
The main publication presents estimates of unfulfilled eligibility. It estimates how much extra money benefit claimants could be getting if they told us accurately about their circumstances. We present these in percentage terms (of expenditure on a benefit) and in monetary terms, in millions of pounds.
We also report a measure on the proportion of claims with unfulfilled eligibility calculated as follows:
Proportion of claims with unfulfilled eligibility = (number of claims in the sample with unfulfilled eligibility) / (number of claims in the sample).
Further information about the types of unfulfilled eligibility we report on, abbreviations commonly used and statistical methodology can be found in the appendices at the end of this document.
Status of the statistics
Official Statistics (in development)
Official Statistics in Development are Official Statistics that are undergoing a development; they may be new or existing statistics, and will be tested with users, in line with the standards of trustworthiness, quality, and value in the Code of Practice for Statistics. DWP will seek user feedback alongside the publications to inform the ongoing development of the statistics to enhance their public value.
These statistics are designated as Official Statistics in Development because this is a new publication. We welcome user comments on this publication which should be sent to: enquiries.fema@dwp.gov.uk
Read further information about Official Statistics on the UK Statistics Authority website.
Quality statement
Quality in statistics is a measure of their ‘fitness for purpose’. The European Statistics System Dimensions of Quality provide a framework in which statisticians can assess the quality of their statistical outputs. These dimensions of quality are relevance, accuracy and reliability, timeliness, accessibility and clarity, and comparability and coherence.
Section 5 gives information on the application of these quality dimensions to our unfulfilled eligibility statistics.
Feedback
We welcome any feedback on our publication. You can contact us at enquiries.fema@dwp.gov.uk
Lead Statistician: Kezia Rapley
DWP Press Office: 020 3267 5144
Report Benefit Fraud: 0800 854 4400
Useful links
Collection page for the unfulfilled eligibility statistics.
Page for the FYE 2024 unfulfilled eligibility estimates, including reference tables.
1. Introduction to our measurement system
The main statistical release and reference tables provide estimates of unfulfilled eligibility for benefit expenditure administered by the Department for Work and Pensions (DWP). This includes a range of benefits for which we derive estimates using different methods, as detailed below. For further details on which benefits are included in the total unfulfilled eligibility estimates please see Appendix 2. More information can be found on the GOV.UK website about the benefit system and how DWP benefits are administered.
The unfulfilled eligibility statistics estimate the amount of extra money that claimants could have been eligible for had they provided the correct information to the department. The estimates cover all benefits that the department is responsible for. They are based on the same data used for the fraud and error statistics and reviews are undertaken in the same way for both sets of estimates.
The estimates of unfulfilled eligibility for each benefit have been derived using three different methods, depending on the frequency of their review (see section 4 for details):
Benefits reviewed this year
Unfulfilled eligibility has been measured for FYE 2024 for Universal Credit (UC), Housing Benefit (HB), Disability Living Allowance (DLA), Pension Credit (PC), State Pension (SP) and Personal Independence Payment (PIP).
Expenditure on measured benefits accounted for 83% of all benefit expenditure in FYE 2024.
Estimates are produced by statistical analysis of data collected through annual survey exercises, in which independent specially trained staff from the department’s Performance Measurement (PM) team review a randomly selected sample of cases for benefits reviewed this year. See section 3 for more information on the sampling process.
The review process involves the following activity:
- previewing the case by collating information from a variety of DWP or Local Authority (LA) systems to develop an initial picture and to identify any discrepancies between information from different sources
- interviewing the claimant (or a nominated individual where the claimant lacks capacity) using a structured and detailed set of questions about the basis of their claim. The interview is completed as a telephone review in the majority of cases. However, where this is not appropriate, there is usually also the option for a completed review form to be returned by post
- the interview aims to identify any discrepancies between the claimant’s current circumstances and the circumstances upon which their benefit claim was based
Benefits were measured with different sample periods, although all were contained within the period November 2022 to October 2023, except for PIP and DLA, which ran from November 2022 to August 2023 and February 2023 to September 2023, respectively. For more information on the sample period for individual benefits please see Appendix 1 of the statistical report. The following number of benefit claims were sampled and reviewed by the PM team:
| Benefit | Sample size | Percentage of claimant population reviewed |
|---|---|---|
| Universal Credit | 3,989 | 0.09% |
| State Pension | 1,557 | 0.01% |
| Housing Benefit | 3,001 | 0.13% |
| Pension Credit | 1,989 | 0.15% |
| Daily Living Allowance | 1,385 | 0.11% |
| Personal Independence Payment | 1,395 | 0.06% |
| Total | 13,313 | 0.06% |
Overall, approximately 0.06% of all benefit claims in payment were reviewed by the PM team.
Benefits reviewed previously
Since 1995, the department has carried out reviews for various benefits to estimate the level of fraud and error in a particular financial year following the same process outlined above. The unfulfilled eligibility statistics are based on the same reviews, but the calculation methodology is different. As the unfulfilled eligibility estimates are new in FYE 2024, estimates based on this methodology are only available for FYE 2024 and FYE 2023. For benefits last reviewed prior to FYE 2023, the Claimant Error underpayment rate found when they were last reviewed for the fraud and error statistics is used. There is a slight difference in methodology for the calculation of unfulfilled eligibility and Claimant Error underpayments. This relates to the netting adjustment and has a minimal impact on the estimates. For some benefits, both methodologies are identical because the netting adjustment has no impact. In FYE 2024 around 9% of total expenditure related to benefits reviewed previously using the unfulfilled eligibility methodology. Around 2% of total expenditure related to benefits reviewed previously using the Claimant Error underpayment methodology. Please see Appendix 2 for details of benefits reviewed previously.
Benefits never reviewed
The remaining benefits, which account for around 6% of total benefit expenditure, have never been subject to a specific review. These benefits tend to have relatively low expenditure which means it is not cost effective to undertake a review. For these benefits, the estimates are based on assumptions about the likely level of unfulfilled eligibility (for more information please see section 4).
2. Interpretation of the results
Care is required when interpreting the results presented in the main report:
- the estimates are based on a random sample of the total benefit caseload and are therefore subject to statistical uncertainties. This uncertainty is quantified by the estimation of 95% confidence intervals surrounding the estimate. These 95% confidence intervals show the range within which we would expect the true value of unfulfilled eligibility to lie
- when comparing two estimates, users should take into account the confidence intervals surrounding each of the estimates. The calculation to determine whether the results are significantly different from each other is complicated and takes into account the width of the confidence intervals. We perform this robust calculation in our methodology and state in the report whether any differences between reporting years are significant or not
- unless specifically stated within the commentary in the publication or in the reference tables, none of the changes for benefits reviewed this year are statistically significant at a 95% level of confidence when compared to the previous measurement
As well as sampling variation, there are many factors that may also impact on the reported levels of unfulfilled eligibility:
- these estimates are subject to statistical sampling uncertainties. All estimates are based on reviews of random samples drawn from the benefit caseloads. In any survey sampling exercise, the estimates derived from the sample may differ from what we would see if we examined the whole caseload. Further uncertainties occur due to the assumptions that have had to be made to account for incomplete or imperfect data or using older measurements
- the sample year and the financial year do not align. This means that a proportion of expenditure for benefits reviewed this year cannot be captured by the sampling process. This is mainly because of the delay between sample selection and the interview of the claimant, and also the time taken to process new benefit claims, which excludes the newest cases from the review. The estimates in the reference tables in this release have been extrapolated to account for the newest benefit claims which are missed in the benefit reviews and cover all expenditure
- the estimates do not encompass all unfulfilled eligibility. More information on omissions can be found later in this section
Omissions from the estimates
The unfulfilled eligibility estimates do not capture every possible element of unfulfilled eligibility. Some cases are not reviewed due to the constraints of our sampling or reviewing regimes (or it is impractical to do so from a cost or resource perspective) and some cases are out of scope of our measurement process. The time period that our reviews relate to means that any operational or policy changes in the last five months of the financial year are usually not covered by our measurements.
For most omissions from our estimates, we make adjustments or apply assumptions to those cases. For some omissions we assume that the levels of unfulfilled eligibility for those cases are the same as for the cases that we do review, and for other omissions we apply specific assumptions where we expect the levels of unfulfilled eligibility to be different.
This section details the omissions from the estimates as far as possible. The examples that follow are not an exhaustive list but are an attempt at providing further details on known omissions in the estimates.
There are a number of groups of cases that we are unable to review or which we do not review. Some of the main examples of these are as follows:
New and short-term cases
We are unable to review short duration cases (of just a few weeks in duration) due to the time lags involved in accessing data on the benefit caseloads, drawing the samples, and preparing these for reviewing. For these cases, we assume the rates of unfulfilled eligibility are the same as in the rest of the benefit caseloads. We do, however, also make an adjustment using “new cases factors” to try to ensure that the results are representative across the entire distribution of lengths of benefit claims (see section 4 for further details).
It can take time for new cases to be available for sampling, meaning they are potentially under-represented in the sample. Analysis was undertaken to quantify the impact of these potential exclusions.
New cases make up a small proportion of cases for most benefits. The table below shows the yearly average percentage that are less than three months old at a given time.
| Benefit | Average number of cases less than three months old | Source |
|---|---|---|
| Pension Credit | 2.5% | Official quarterly data for August 2022 to May 2023 |
| Disability Living Allowance | 1.7% | Official quarterly data for August 2022 to May 2023 |
| Personal Independence Payment | 4.1% | Official monthly data for November 2022 to October 2023 |
| Housing Benefit | 3.9% | Official monthly new case data September 2022 to August 2023 |
| Universal Credit | 7.8% | Official monthly data for December 2022 to November 2023 |
| State Pension | 0.7% | Estimated using quarterly pension data for May 2022 and ONS population data |
To investigate the impact of this exclusion, a simulation of the sampling process was performed and repeated multiple times with these cases included. Sensitivity analysis was then carried out across all benefits to estimate the impact of excluding new cases if the unfulfilled eligibility rate were doubled, halved, or remained the same.
The age of a case when it becomes available for sampling differs by benefit. Based on these timescales, analyses were undertaken using an exclusion period of either 6 weeks or 3 months.
Overall, this analysis showed that, because short term cases make up such a small percentage of total cases at any given time and many are available to be sampled later in the period, the impact on final published figures for all benefits is negligible.
The impact of excluding new cases is no more than 0.1 percentage points difference in the estimated unfulfilled eligibility rate across all benefits except for DLA, where the impact is 0.2 percentage points.
It would be expected that the rate of unfulfilled eligibility in new cases would typically be lower than the full population of claimants since they have recently been assessed. The outcomes of this analysis fall within the estimated confidence intervals and there is little impact on the published statistics, therefore no adjustment is required.
Unclaimed benefits
We are only able to sample claimants who are in receipt of a benefit payment. Eligible claimants that have not made a benefit claim are not included in these figures. Income-related benefits: estimates of take-up is a separate DWP publication about take-up of benefits.
Nil payment claims
A case is considered to be nil payment if there is a claim in place but the total award being paid is zero. These cases are not included when the sample is selected. Some benefits do not allow a nil award, meaning all active claimants are receiving some payment.
| Nil-award allowed | No nil-award allowed |
|---|---|
| Pension Credit | Housing Benefit |
| Universal Credit | State Pension |
| Personal Independence Payment | - |
Note: For a very small proportion of the PIP caseload (0.2%), the combination of award rates (daily living and mobility) is reported as nil-nil. Investigations suggest that award rates may be temporarily shown as nil for a short period whilst a claim review is in process, after which the new award rate is set. These cases will be monitored.
Nil payment claims are a potential source of unfulfilled eligibility that is not included in the sample.
Pension Credit
Only a very small percentage of Pension Credit claimants are in nil payment at any given time. For the most recent year of data available this number was always below one fifth of one percent. Simulating the sampling process shows that over 99.8% of cases sampled would be the same even if the nil payment cases were included in the group available for sampling. The potential impact of a different unfulfilled eligibility rate in this group thus rounds to zero, even in a worst-case scenario of doubling the unfulfilled eligibility rate in the excluded cases.
Universal Credit
For the year up until August 2023 (the most recent year for which data was available for analysis), the proportion of nil payment claims ranged from 9.5% to 12.3%, with 11.0% being the average. Simulating the sampling process shows around 11.0% of claims that would otherwise be sampled are missed due to this. The potential impact of a different unfulfilled eligibility rate in this group is a decrease of 0.1 percentage points if the unfulfilled eligibility rate is half the measured rate, and an increase of 0.2 percentage points if the unfulfilled eligibility rate in this group is double the measured rate.
Exclusions specific to PIP
The monthly samples are taken from live PIP claims in advance of the scheduling of the benefit reviews. Any benefit record relating to a claimant who meets specific exclusion criteria (e.g. terminally ill, reviewed in the last three months) will not be reviewed. We assume the rates of unfulfilled eligibility for these cases are the same as the rest of the PIP caseload. The potential impact of each excluded group is summarised below.
Terminally ill cases
Terminally ill claimants make up a very small percentage of PIP claimants, typically around 1%. Sensitivity analysis was carried out to test the impact of their exclusion if the unfulfilled eligibility rate on these cases were to differ by as much as double that of the sampled population.
Estimated impact of excluding terminally ill cases on the PIP unfulfilled eligibility rate
| Level of overpayment in excluded group | Estimated change in overpayment | Impact on PIP overpayment estimate | Impact on global overpayment estimate |
|---|---|---|---|
| Double the published rate on terminally ill cases | + £0.3m | 0.0 p.p | 0.0 p.p |
| Half the published rate on terminally ill cases | - £0.2m | 0.0 p.p | 0.0 p.p |
Note that the PIP unfulfilled eligibility analysis applies to cases that are not on the highest award (enhanced mobility with enhanced daily living) as the estimates are already adjusted to account for this exclusion. See the benefit-specific adjustments section for more details.
The above analysis demonstrates that any additional unfulfilled eligibility that may exist in the excluded PIP terminally ill cases is extremely small. The total estimated level of unfulfilled eligibility would have a negligible difference for the above scenarios if terminally ill cases were included in the sample. Therefore, no adjustment has been made to the statistics because of this exclusion.
Scheduled reviews
PIP awards are reviewed regularly. The period between reviews is set on an individual basis and ranges from 9 months to 10 years, with the majority of claimants having a short-term award of 0-2 years. If a claim has had a planned award review in the last 92 days, has a review ongoing, or a review due in the next six weeks then it is not eligible to be sampled.
A simulation of the sampling process was performed and repeated multiple times to investigate the impact of this exclusion.
Cases with an upcoming review would be expected to have a higher propensity for unfulfilled eligibility due to the length of time since their last review. By the same reasoning cases that have had a review completed recently would be expected to have a lower propensity for unfulfilled eligibility.
In our statistics an assumption is made that the excluded cases are similar to those sampled and so no adjustments are made. We investigated the impact of alternative assumptions on our estimates and results are shown in the table below.
For this analysis we assumed that a recent review would resolve potential unfulfilled eligibility. Therefore, we have estimated the impact of the excluded cases having half the unfulfilled eligibility of the sample, and as a worst-case scenario having double the unfulfilled eligibility of the sampled cases.
The table below shows these assumptions and their estimated difference to the published amounts and rates.
| Assumption | Estimated difference to published | Impact on PIP estimate | Impact on global estimate |
|---|---|---|---|
| Assumption of double the sampled unfulfilled eligibility on excluded recently reviewed cases | £176.0m | 0.8 p.p | 0.0 p.p |
| Assumption of half the sampled error on excluded recently reviewed cases | -£86.8m | -0.4 p.p | -0.1 p.p |
These differences fall within the published confidence intervals for the rates of unfulfilled eligibility for PIP in FYE 2024, and the conclusion therefore is no adjustment is needed.
Exclusions specific to DLA
The monthly samples are taken from live DLA claims in advance of the scheduling of the benefit reviews. Any benefit record relating to a claimant who meets specific exclusion criteria (e.g., terminally ill, reviewed in the last three months) will not be reviewed. We assume the rates of fraud and error for these cases are the same as the rest of the DLA caseload. The potential impacts of each excluded group are summarised below.
Working age cases
DLA is being replaced by other benefits. New claims to DLA can only be made for children. Adults of working age and pensioners aged 65 or over prior to 8 April 2013 (DLA 65+), already in receipt of DLA, will continue to get DLA as long as they remain eligible for it.
We have reviewed claims for children and DLA 65+ only. Working age cases are not being reviewed due to being unable to measure a change in rate – DLA working age cases with a change in circumstances have their DLA payments ended and must claim PIP instead. We exclude current pensioners who were under 65 on 8th April 2013 who would also have their DLA payment ended if a change of circumstances was found and they would have to claim PIP. Working age cases account for about 15% of all DLA cases. We considered what proxy to use for the unmeasured working age element of DLA. Analysis of rate combinations of each client group suggests that a combination of Children and 65+ rates, weighted by population factor, best match the working age claimants’ rate. However, lack of review for those cases prevents a more accurate assessment.
As DLA working age claims with a change in circumstances cannot be measured, we have excluded them from our sensitivity analyses and adjustments.
Terminally ill cases
Terminally ill claimants make up a very small percentage of DLA claimants, typically less than 1%. Sensitivity analysis was carried out to test the impact of their exclusion if the unfulfilled eligibility rate on these cases were to differ by as much as double that of the sampled population.
| Level of overpayment in excluded group | Estimated change in overpayment | Impact on PIP overpayment estimate | Impact on global overpayment estimate |
|---|---|---|---|
| Double the published rate | + £0.5m | 0.0 p.p | 0.0 p.p |
| Half the published rate | - £0.3m | 0.0 p.p | 0.0 p.p |
Note that that DLA claims on the highest rate award (higher rate mobility and high care) have been excluded from this analysis as they are in receipt of the full entitlement.
The above analysis demonstrates that any additional unfulfilled eligibility that may exist in the excluded DLA terminally ill cases is extremely small. The total estimated levels of unfulfilled eligibility would have a negligible difference for the above scenarios if terminally ill cases were included in the sample. Therefore, no adjustment has been made to the statistics because of this exclusion.
Scheduled reviews
DLA children awards are reviewed on renewal, however DLA 65+ awards are not routinely reviewed. Around 18% of the sample was abandoned due to cases having a scheduled review or a recent review, and they were therefore excluded from the sample estimates.
In our statistics an assumption is made that the excluded cases are similar to those sampled and so no adjustments are made. We investigated the impact of alternative assumptions on our estimates and results are shown in the table below.
Cases with an upcoming review would be expected to have a higher propensity for unfulfilled eligibility due to the length of time since their last review. By the same reasoning cases that have had a review completed recently would be expected to have a lower propensity for unfulfilled eligibility.
However, it was not possible to break down the excluded cases into the two review types of recent review and scheduled review. Assuming a higher proportion of one or the other would lead to an over or underestimation of the impact on the unfulfilled eligibility estimate. Therefore, we have made the assumption that 50% of each type of review was present in the excluded cases and used this assumption in the analysis.
Two scenarios were tested:
1. Double the sample unfulfilled eligibility rate on the scheduled review cases and half the sample unfulfilled eligibility on the recently reviewed cases.
2. Double the sample unfulfilled eligibility rate on the scheduled review cases and zero unfulfilled eligibility on the recently reviewed cases. The table below shows these assumptions and their estimated difference to the published amounts and rates.
| Assumption | Estimated difference to published | Impact on DLA estimate | Impact on global estimate |
|---|---|---|---|
| Assumption of double the unfulfilled eligibility in scheduled reviews and half the unfulfilled eligibility in recent reviews | £33.0m | 0.5 p.p | 0.0 p.p |
| Assumption of double the unfulfilled eligibility in scheduled reviews and zero unfulfilled eligibility in recent reviews | £0.0m | 0.0 p.p | 0.0 p.p |
These differences all fall within the published confidence intervals for the rates of unfulfilled eligibility for DLA in FYE 2024, and the conclusion therefore is no adjustment is needed.
Time lags
The time lags involved in the unfulfilled eligibility measurement process mean that further omissions are possible. Any policy or operational changes in the last five months of the financial year will not usually be covered by the reviews feeding into the publication, as the reviews tend to finish in the October of that financial year. In addition, some cases do not have a categorisation by the time the estimates are put together. “Estimated outcomes” are generated for these cases for the purposes of the statistics, made by the review officer estimating the most likely outcome of the case, or based on the results from the reviews of similar cases that have been completed.
For all benefits we carried out additional work to better understand any implications of major policy/operational changes within the financial year. The conclusion was that we felt the sample period was representative of the financial year. See section 4 for further details.
UC surplus self-employed profit/loss
For UC, we only measure income in the assessment period we are checking. Self-employed people must report their income on a monthly basis. If they receive income that removes their entitlement to UC in one month, and this is above the surplus earnings threshold, then any extra income is carried forward into the next month (the surplus earnings threshold is defined as £2,500 above the amount that removes their entitlement to UC in that month). If a self-employed claimant incurs a loss of any amount within an assessment period, this loss is also rolled forward to the next assessment period. When reviewing the benefit, any rolled forward income or loss is assumed to be correct.
Rounding policy
In the publication and reference tables, the following rounding conventions have been applied:
- percentages are rounded to the nearest 0.1%
- expenditure values are rounded to the nearest £100 million
- headline monetary estimates are rounded to the nearest £10 million
- monetary estimates for unfulfilled eligibility reasons are rounded to the nearest £1 million
The proportion of claims with unfulfilled eligibility is rounded to the nearest 1% in the publication and expressed in the format “n in 100 cases”. The reference tables present the same values as a percentage rounded to the nearest 0.1%.
Individual figures have been rounded independently, so the sum of component items does not necessarily equal the totals shown.
3. Sampling and data collection
The unfulfilled eligibility statistics are determined using a sample of benefit records, since is it not possible to review every benefit record. The sample of benefit records provide data from which inferences are made about the unfulfilled eligibility levels in the whole benefit claimant population.
The number of benefit records to be reviewed is determined by a sample size calculation. The sample size calculation is used to ensure that a sufficient number of benefit records are sampled, which allows meaningful changes in the levels of unfulfilled eligibility to be detected for the whole benefit claimant population.
Benefit records are selected on a monthly basis from data extracts of the administrative systems. The population from which the samples are drawn are the benefit records that are in payment in a particular assessment period, that is where there is evidence of a payment relating to the previous month. This is known as the liveload.
The monthly samples are taken from the liveload in advance of the scheduling of the benefit reviews, to give time for the sample to be checked and for background information to be gathered on each benefit record sampled. Any benefit record relating to a claimant who has been previously sampled in the last 6 months or meets specific exclusion criteria (e.g. terminally ill) will not be reviewed.
We use simple random sampling to select the sample of benefit records for each benefit that is reviewed in the current year. Benefit records are sampled randomly to ensure an equal chance of being selected for the sample.
The sampling methodology is used to attempt to minimise selection bias in the sample and aims to select a sample that is representative of the entire benefit claimant case population.
The benefits sampled for this year and the methodologies applied are as follows:
Simple random sample:
- Disability Living Allowance
- Pension Credit
- Universal Credit
- State Pension
- Personal Independence Payment
Housing Benefit methodology uses simple random sampling stratified by Primary Sampling Unit (PSU) and four different client groups:
- Working Age in receipt of IS, JSA, ESA, PC or UC
- Working Age not in receipt of IS, JSA, ESA, PC or UC
- Pensioners in receipt of IS, JSA, ESA, PC or UC
- Pensioners not in receipt of IS, JSA, ESA, PC or UC
Note: for HB only the client groups “Pensioners in receipt of IS, JSA, ESA, PC or UC” and “Pensioners not in receipt of IS, JSA, ESA, PC or UC” were reviewed in FYE 2024.
Abandoned cases
Of the benefit records sampled, there are some that are not eligible for a review according to strictly defined criteria for abandonment. Benefit records that fall into this category could include:
- the claimant has a change of circumstances that ends their award before the interview can take place
- the claimant has had a benefit reviewed in the last six months
- if the claimant or their partner is terminally ill
When such cases occur in the sample, they are replaced by another case from a reserve list. However, for a small number of abandoned cases replacement is not possible for practical reasons. This occurs when cases are abandoned towards the end of the review year, which means that there is not enough time for a replacement case to complete the full process.
Abandoned cases FYE 2024
It is the decision of the Performance Measurement (PM) team, during the preview stage of a case, if a case should be abandoned.
The following table shows the main reason for cases abandoned for each benefit
| Abandonment Reason / Benefit | DLA | HB | PC | PIP | SP | UC | Total |
|---|---|---|---|---|---|---|---|
| Benefit not in payment/ceased or suspended | 17 | 145 | 69 | 20 | 8 | 344 | 603 |
| New activity within 6 months of the start of the sample | 320 | – | – | 122 | – | – | 442 |
| Sensitive issues | 39 | 25 | 65 | 16 | 16 | 25 | 186 |
| Allowable Absence | 12 | 30 | 12 | 5 | 4 | 24 | 87 |
| Corporate appointee with no named contact | 6 | 4 | 18 | 34 | 1 | 8 | 71 |
| Miscellaneous | 38 | 71 | 31 | 60 | 59 | 138 | 397 |
| Total cases abandoned by benefit | 432 | 275 | 195 | 257 | 88 | 539 | 1,786 |
| Total cases reviewed | 1,385 | 3,001 | 1,989 | 1,395 | 1,557 | 3,986 | 13,313 |
| Abandonment rate per benefit | 31% | 9% | 10% | 18% | 6% | 14% | 13% |
| Percentage point change from previous year | – | -24 | 2 | 5 | 0 | -1 | -3 |
For FYE 2024, the abandonment reasons ‘operational issues’ & ‘incorrectly sampled’ have been added to the category ‘miscellaneous’. This is due to other abandonment reasons accounting for a greater proportion of cases abandoned.
The five reasons listed (excluding ‘miscellaneous’) accounted for around 78% of total abandonment, a reduction in total proportion from FYE 2023. This is mainly due to less cases being abandoned within the ‘Benefit not in payment/ceased or suspended’ category where this category accounted for 33% of the total abandonments in FYE 2024, compared with 62% in FYE 2023. This difference mainly comes from the change in HB client group measured between years.
DLA has been reviewed for the first time this year, as such there is no previous comparison to be made for abandonments.
For HB, FYE 2024 reviewed the pension age client groups for HB as opposed to the non-passported working age client group in FYE 2023. Different client groups have variation in the rate of abandonment due to the nature of the benefits, with non-passported working age claimants most likely to move off benefit with earnings increasing.
Below are updated descriptions for the top five abandonment reasons for FYE 2024.
- benefit not in payment/ceased or suspended – this remains the largest cause of abandonment, with almost 60% of these abandonments being on UC claims. These are claims no longer in payment either because the claimant is no longer entitled to the benefit or because they are now claiming another benefit. This is primarily related to the time lag of benefit reviews commencing from sample selection period
- new activity within 6 months of the start of the sample – This reason is solely linked to the disability benefits. This is due to actions previously done or planned to be done on a claimant’s case such as renewal of the claim to DLA or the claimant notifying a change to the department before the review process has started. For PIP, this could be appeals or interventions made on their claim
- sensitive issues – this is a reason that affects all benefits reviewed. The claimant/partner being terminally ill or finding out they are recently deceased or bereaved are the main causes for the usage of this reason
- allowable absence – This reason is used when the claimant is under medical care, out of the country for agreeable circumstances, or in prison/on remand during the review week, with no known indication of when they would be able to complete the review
- corporate appointee with no named contact – This reason has been included within ‘miscellaneous’ in previous years. These claims relate to situations where the review has been planned and we are unable to find the correct official to deal with the review on the claimant’s behalf
- miscellaneous – this category covers all remaining categories of abandonment used. These reasons are within the pre-defined criteria for abandonment. All the reasons here are unavoidable, out of our control or cannot be identified at the sample production stage of the process
Unfulfilled eligibility reviews
For all benefits, benefit review officers normally check for unfulfilled eligibility by comparing the evidence obtained from the review to that held by the department.
Recording information
Case details relating to the unfulfilled eligibility reviews are recorded on internal bespoke software (the system is known as FREDA), to create a centrally held data source. This can then be matched against our original sample population to produce a complete picture of unfulfilled eligibility against review cases across our sample.
4. Measurement calculation methodology
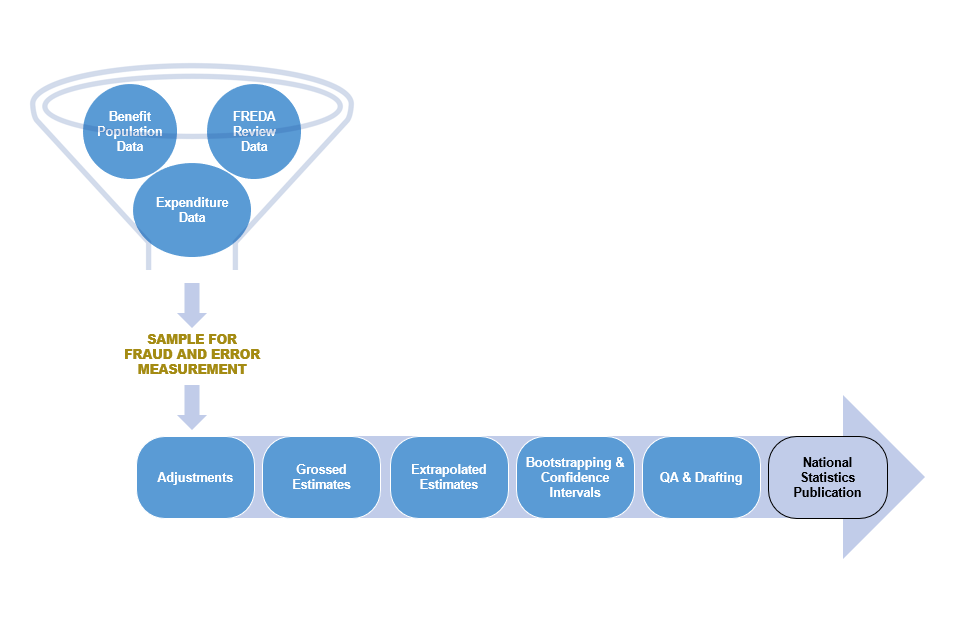
Unfulfilled eligibility measurement relies on three data sources:
- raw sample held on ‘FREDA’ (the database on which the review outcomes are recorded), is used to identify the Monetary Value of Unfulfilled Eligibility (MVUE) for individual cases, categorise its cause and quantify it as a proportion of the sample
- benefit population data to estimate the extent of unfulfilled eligibility across the whole claimant caseload from the sample data
- expenditure data to estimate the total MVUE to the department
Sub-categories of unfulfilled eligibility reasons are used to provide more details about the nature of the unfulfilled eligibility. Details on unfulfilled eligibility classifications can be found in the glossary in Appendix 3.
Detailed below are the main calculation steps that the Fraud & Error Measurement and Analysis (FEMA) team carry out to produce the final unfulfilled eligibility estimates.
Methodology for benefits reviewed this year
Benefits that have been reviewed this year account for 83% of the total benefit expenditure.
For each of the benefits reviewed this year a random sample of cases was taken. See section 3 for further details.
The claimant is contacted and a review carried out with evidence requested to verify their circumstances as outlined in the unfulfilled eligibility reviews part of section 3.
Finally, a case is categorised as having unfulfilled eligibility or no unfulfilled eligibility. There are specific scenarios and adjustments that we then taken into account. These are detailed below:
Adjustments
A series of adjustments are made to the sample data, to allow for various characteristics of the benefits and how their data is collected and recorded. The following table highlights which adjustments apply to each of the benefits reviewed in FYE 2024.
| Adjustment | SP | DLA | PC | HB | UC | PIP |
|---|---|---|---|---|---|---|
| Capping | Y | Y | Y | Y | Y | Y |
| Estimated Outcomes | Y | Y | Y | Y | Y | Y |
| New Cases Factor | N | N | Y | Y | N | N |
Capping
A case may have unfulfilled eligibility of more than one ‘type’ which sum to a total greater than the award difference. To ensure that the total unfulfilled eligibility does not exceed the total award difference, we ‘cap’ the unfulfilled eligibility amount.
Estimated outcomes
For a number of cases reviewed this year, the review process had not been completed at the time of the analysis and production of results. Predictions for the final outcomes for these cases have been made in the analysis using either the review officer (RO) estimation of the most likely outcome, or the results from the reviews of similar cases that had been completed.
New cases factors
New cases factors are an adjustment applied to help ensure that the durations on the sample accurately reflect the duration on benefit within the population.
As a result of the time required to collect the information needed to review a case, as well as other operational considerations, there is an unavoidable delay between sample selection and case review. This delay means that fewer low duration claims will be represented in the sample of cases, which artificially introduces a bias around claim durations at the point of interview.
Benefit-specific adjustments
This section contains details of any benefit-specific sampling issues, or things that we only do for certain benefits when we calculate our estimates.
Universal Credit
Zero payment cases: Universal Credit cases still live but with zero entitlement are not included in our sample for benefit reviews. However, when calculating the proportion of claims with unfulfilled eligibility on Universal Credit we scale the final figure to account for these cases.
Personal Independence Payment
PIP claimants are considered to be particularly vulnerable, therefore it is not always deemed appropriate to put a claimant through the review process. This is the case for terminally ill PIP claimants.
Instead, an adjustment is made to the PIP estimates to account for their exclusion from the sample. 96% of terminally ill PIP claimants receive the highest award. For this reason, the unfulfilled eligibility rate in this group is not considered to be the same as for the rest of the PIP population, and an adjustment is made based on this assumption.
The impact of the SRTI adjustment can be found in section 2.
Grossing
Grossing is the term used to describe the creation of population estimates from the sample data; sample results are scaled up to be representative of the whole population. Example of a simple grossing factor ‘G’, if we were to sample 100 cases from a population of 1,000:
G = N ÷ n
= 1000 ÷ 100
= 10
Where ‘N’ is the population or sampling frame from which the cases are selected and ‘n’ is the sample size taken.
The above grossing factor shows that, in this example (sampling 100 cases from a population of 1,000), then each case would have a grossing factor of 10 (i.e. each sample case represents 10 cases from the population). Hence if a case was shown to have unfulfilled eligibility, this would represent 10 cases with unfulfilled eligibility once grossed.
UC is replacing a selection of legacy benefits. As this process continues the UC caseload will increase whilst those other benefit caseloads will decrease. As a result, grossing for all benefits is calculated on a monthly basis. This ensures that unfulfilled eligibility identified at the start of the year is grossed up by less than unfulfilled eligibility identified at the end of the year if the caseload is increasing (or vice versa if it is decreasing).
Grossing factors are different for each benefit due to the sample, population and adjustments made.
Percentage with unfulfilled eligibility
The grossing factors are then applied to the sample data to calculate values for the grossed awards and the grossed unfulfilled eligibility amounts i.e. these are scaled up proportionally to what we would expect to find in the population. In turn, the resulting grossed values are used to calculate the total (global) annual unfulfilled eligibility rate.
Extrapolation
The grossed results provide a core estimate of levels of unfulfilled eligibility. Extrapolation aligns the monetary amount with the benefit expenditure, which is particularly important given the sample period and the financial year do not fully align.
Monetary Value of Unfulfilled Eligibility (MVUE)
To then calculate the MVUE across the benefits, we apply the unfulfilled eligibility percentage rates to the total annual expenditure for each benefit. This means that the MVUE is affected by increases and decreases in expenditure, even if unfulfilled eligibility percentages are stable. We see the impacts of this in our estimates for benefits not reviewed in the current year, where we use the same rate of unfulfilled eligibility from previous years but apply it to the expenditure on the benefit in the current year (which will have changed from the year before).
Although expressing unfulfilled eligibility in monetary terms (i.e. MVUE terms) might be helpful for a reader to contextualize the figures, we recommend making comparisons on a year-on-year basis based on the percentage rates of unfulfilled eligibility. This is particularly important for benefits where the expenditure changes a lot each year, as comparisons of monetary amounts can be misleading. For example, on a benefit with growing expenditure, it can be possible for the monetary amount of unfulfilled eligibility to increase, even if the percentage rate of unfulfilled eligibility has actually gone down.
Central estimates and confidence intervals
The central estimates produced following extrapolation are based on reviews of random samples and hence are subject to variability. Therefore, confidence intervals are provided with the central estimates to quantify the uncertainty associated with these estimates.
The central estimates and confidence intervals are incorporated into the global (overall) estimates of unfulfilled eligibility. These combine all separate DWP benefits to calculate an overarching set of unfulfilled eligibility rates.
Total unfulfilled eligibility
The unfulfilled eligibility estimates need to include all expenditure on benefits by DWP. Some benefits have been reviewed for unfulfilled eligibility in the current year, and some have been reviewed in previous years. We also need to include estimates for benefits which have never been reviewed. A full list of which benefits are in scope for each release of the unfulfilled eligibility in the benefit system estimates is included within Appendix 2 of this document.
Methodology for benefits previously reviewed
Some benefits which were not measured this year were measured in previous years. For these benefits we apply the rate from the last time the benefit was measured to the current year’s expenditure, to get an estimate of the monetary value of unfulfilled eligibility.
As the unfulfilled eligibility estimates are new in FYE 2024, estimates based on this methodology are only available for FYE 2024 and FYE 2023. For benefits last reviewed prior to FYE 2023, the Claimant Error underpayment rate found when they were last reviewed for the fraud and error statistics is used. There is a slight difference in methodology for the calculation of unfulfilled eligibility and Claimant Error underpayments. This relates to the netting adjustment and has a minimal impact on the estimates. For some benefits, both methodologies are identical because the netting adjustment has no impact. In FYE 2024 around 9% of total expenditure related to benefits reviewed previously using the unfulfilled eligibility methodology. Around 2% of total expenditure related to benefits reviewed previously using the Claimant Error underpayment methodology. Please see Appendix 2 for details of benefits reviewed previously.
Methodology for benefits never reviewed
We use multi criteria decision analysis to choose which benefits we should measure each year. Some benefits have a small amount of expenditure and therefore are unlikely to ever be selected for measurement. For each of the benefits that have never been reviewed, we use a similar benefit’s rate of unfulfilled eligibility as a proxy. We then apply that to the expenditure on that unreviewed benefit to get an estimate of the monetary value of unfulfilled eligibility.
For more information on the proxies used, please see the “Benefits never reviewed” section of Appendix 2.
Benefits that have never been reviewed account for around 6% of total benefit expenditure.
Central estimates and confidence intervals
The percentage estimate (i.e. the overall rate of unfulfilled eligibility) is the sum of the monetary value of unfulfilled eligibility for all benefits reviewed this year, those reviewed in previous years, and those never reviewed, divided by the overall expenditure.
The central estimate is the estimate obtained from the sample data. It provides our best guess of the unknown value that we are trying to measure.
Confidence intervals are calculated for the percentage estimates, to quantify the statistical uncertainty associated with the central estimate. Some adjustments are made to the individual benefits before this is calculated for overall unfulfilled eligibility:
- confidence intervals for benefits reviewed previously are deliberately widened
- confidence intervals may be widened further if it is believed that non-sample error could impact the accuracy of the estimates. For more information on non-sample error please see section 5 “Accuracy and reliability”
- confidence intervals are widened for the benefits never reviewed, whereby the standard error is assumed to be 40% of the central estimate, to reflect greater uncertainty given the less robust method of estimation for these benefits
The uncertainty surrounding a central estimate is associated with both the variance of the outcome within the sample and the size of the sample from which it is calculated. A 95% confidence interval is used to indicate the level of uncertainty. It shows the range of values within which we would expect the true value of the estimate to lie. A wider range for the confidence interval implies greater uncertainty in the estimate.
Confidence intervals are calculated using a statistical technique called bootstrapping. It is used to approximate the sampling distribution for the central estimate. The sampling distribution describes the range of possible values, for the central estimate, that could occur if different random samples had been used.
Bootstrapping is a computationally intensive technique that simulates resampling. A computer program is used to take 4,000 resamples with replacement, of equal size, from the initial sample data. The percentage rate of unfulfilled eligibility is calculated for each of the resamples. These estimates are ordered from smallest to largest and this gives the approximated sampling distribution.
The 95% confidence intervals are obtained from the bootstrapping results, by taking the 100th estimate (2.5th percentile) and the 3,900th estimate (97.5th percentile). We also check the median estimate (50th percentile) against our actual central estimate to ensure that no bias exists.
5. Quality report
Introduction
This section of the document assesses the quality of the unfulfilled eligibility in the benefit system official statistics using the European Statistics System Quality Assurance Framework. This is the method recommended by the Government Statistical Service Quality Strategy. Statistics are of good quality when they are fit for their intended use.
The European Statistics System Quality Assurance Framework measures the quality of statistical outputs against the dimensions of:
- relevance
- accuracy and reliability
- timeliness and punctuality
- comparability and coherence
- accessibility and clarity
The Government Statistical Service also recommends assessment against 3 other principles in the European Statistics System Quality Assurance Framework. These are:
- trade-offs between output quality and components
- balance between performance, cost, and respondent burden
- confidentiality, transparency, and security
These dimensions and principles cross the three pillars of trustworthiness, quality and value in the Code of Practice for Statistics.
Relevance
Relevance is the degree to which statistics meet the current and potential needs of users.
The Department for Work and Pensions (DWP) unfulfilled eligibility in the benefit system statistics provide estimates of unfulfilled eligibility for benefits administered by the DWP and local authorities.
The series has been developed to provide information to various users for policy development, monitoring and accountability, as well as providing academics, journalists, and the general public data to aid informed public debate.
The statistics:
- include DWP benefits and those administered by local authorities
- are the primary DWP indicator for levels of unfulfilled eligibility in the benefit system
The publication is essential for providing our stakeholders with:
- a consistent time series for assessing unfulfilled eligibility trends over time
- data to assess current DWP policy and evaluate recent changes to these or business processes
- the evidence base for assessing the potential effect of future policy options and programmes
- robust data to inform future measurement options
- data to measure government performance relating to priority outcome 4 of the DWP outcome delivery plan: deliver a reliable, high-quality welfare and pensions system which customers have confidence in. Read the latest plan (correct at the time of publication of this document, May 2024)
We recognise that our users will have different needs and we use a range of different methods to contact them. We frequently meet internal DWP users to discuss their requirements. As for external stakeholders, we often contact the National Audit Office, and we occasionally contact HM Revenue and Customs and Cabinet Office.
Engagement with other external users is usually through the DWP statistical pages of this website where we:
- invite users to share their comments or views about our official statistics, or to simply advise us how they use our statistics
- advise users of updates and changes to our statistics through the future statistics release calendars and our unfulfilled eligibility in the benefit system collection page.
- consult with customers on developments and changes to our statistical methodologies, publications, or publication processes. We carried out user engagement early in 2024 on the reclassification of Claimant Error underpayments to unfulfilled eligibility.
Accuracy and reliability
Accuracy is the closeness between an estimated result and the unknown true value. Reliability is the closeness of early estimates to subsequent estimated values.
The statistics are calculated from the results of a survey sample, which are recorded on an internal DWP database. The survey combines data collated from DWP administrative systems and local authority owned Housing Benefit systems, with data collected from the claimant during an interview.
The estimates obtained are subject to various sources of error, which can affect their accuracy. Both sampling and non-sampling error are considered in producing the statistics.
Sampling error arises because the statistics are based on a survey sample. The survey data is used to make conclusions about the whole benefit caseload. Sampling error relates to the fact that if a different sample was chosen, it would give different sample estimates. The range of these different sample estimates expresses the sample variability. Confidence intervals are calculated to indicate the variability for each of the estimates. More detail on central estimates and confidence intervals is provided in section 2.
Sources of non-sampling error are difficult to measure. However, where possible, these uncertainties have been quantified and combined with the sampling uncertainties, to produce the final estimates. Quality assurance processes are undertaken to mitigate against particular types of error (for example, data entry error).
Possible sources of non-sampling error that may occur in the production of the unfulfilled eligibility statistics include:
- Data entry error – the survey data is recorded on a database by DWP staff. Data may be transcribed incorrectly, be incomplete, or entered in a format that cannot be processed. This is minimised by internal validation checks incorporated into the database, which can prevent entry of incorrect data and warn staff when an unusual value has been input. Analysts undertake further data consistency checks that are not covered by the internal database validations
- Measurement error – the survey data collected from the benefit reviews are used to categorise an outcome for each case. The correct categorisation is not always obvious, and this can be recorded incorrectly, particularly for complex cases. To reduce any inaccuracies, a team of expert checkers reassess a selection of completed cases before any statistical analysis is carried out. This evidence is used as a feedback mechanism for the survey sample staff and also for the statistical analysis
- Processing error – errors can occur during processing that are caused by a data or programming error. This can be detected by a set of detailed quality assurance steps that are completed at the end of each processing stage. Outputs are compared at each stage to identify any unexpected results, which can then be rectified
- Non-response error – missing or incomplete data can arise during the survey. Supporting evidence to complete the benefit review may not be provided, or the claimant may not engage in the review process altogether. In other cases, the benefit review may not have been completed in time for the analysis and production of results. An outcome is imputed or estimated in these cases, by different methods that are detailed in this document.
- Coverage error – not all of the benefit caseload can be captured by the sampling process. There is a delay between the sample selection and the claimant interview, and also a delay due to the processing of new benefit claims, which excludes the newest cases from being reviewed. An adjustment is applied to ensure that the duration of benefit claims within the sample accurately reflects the durations within the whole caseload
The list above is not exhaustive and there are further uncertainties that occur due to assumptions made when using older measurements for benefits that have not been reviewed this year. There are also some benefit-specific adjustments that are part of the data processing.
More detailed information about the quality of the statistics can be found earlier in this document. This includes discussion of the limitations of the statistics, possible sources of bias and error, and elements of unfulfilled eligibility that are omitted from the estimates.
Timeliness and punctuality
Timeliness refers to the time gap between the publication date and the reference period for the statistics. Punctuality is the time lag between the actual and planned dates of publication for the statistics.
The unfulfilled eligibility in the benefit system report will usually be published around 8 months after the main reference period.
Due to the time taken to undertake the interviews and gather follow up information, final data from the reviews is not made available to analysts until 4-5 months after the start date of the last interviews. The production of the statistics and reference tables, and the associated clearance processes, then takes the analytical team about 2 months to prepare.
DWP pre-announce the date of release of the unfulfilled eligibility in the benefit system report 4 weeks in advance on this website and the UK Statistics Authority publication hub, in accordance with the Code of Practice for Statistics.
The statistics are published at 9.30am on the day that is pre-announced. The online release calendar is updated at the earliest opportunity to inform users of any change to the date of the statistical release and will include a reason for the change. All statistics will be published in compliance with the release policies in the Code of Practice for Statistics.
Comparability and coherence
Comparability is the degree to which data can be compared over time, region or another domain. Coherence is the degree to which the statistical processes that generate two or more outputs use the same concepts and harmonised methods.
Our publication provides information on the estimates over time.
Any changes made to the DWP or local authority administrative system data are assessed in terms of their impact on unfulfilled eligibility strategy and policy. These are then impacted against the unfulfilled eligibility measurement review process and communicated to our internal users and the National Audit Office through our change of methodology log. The same is true for any changes made to business guidance, processes, and review methodology, as well as our own calculation methodology.
We agree some methodology changes in advance with internal stakeholders using change request and change notification procedures.
External users are notified of any changes to methodology in the ‘methodology changes’ section of the unfulfilled eligibility in the benefit system report. Substantial changes to the report structure or content will be announced in advance on the unfulfilled eligibility in the benefit system collection.
The unfulfilled eligibility in the benefit system statistics form the definitive set of estimates for Great Britain. They are underpinned by reviews of benefit claimants in England, Wales, and Scotland.
The benefit expenditure figures used in the publication also include people resident overseas who are receiving United Kingdom benefits, except for Financial Assistance Scheme payments, which also cover Northern Ireland. All other benefit expenditure on residents of Northern Ireland is the responsibility of the Northern Ireland Executive. The benefit expenditure figures do not include amounts devolved to Scottish Government (which totalled £4.4 billion in FYE 2024).
Accessibility and clarity
Accessibility is the ease with which users can access the statistics and data. It is also about the format in which data are available and the availability of supporting information. Clarity refers to the quality and sufficiency of the commentary, illustrations, accompanying advice and technical details.
The reports and reference tables can be accessed on the statistics pages on this website and the UK Statistics Authority publication hub.
Unfulfilled eligibility in the benefit system statistics follow best practice and guidance from the Government Digital Service and Government Statistical Service, in publishing statistics that give equality of access to all users.
For data protection reasons, the underlying datasets are not available outside DWP. However, the reference tables published alongside the report provide detailed estimates, giving a breakdown of into the different types of unfulfilled eligibility for the benefits measured in that year. The reference tables are available in both standard and accessible formats.
Technical language is avoided where possible within the report. To help users the report contains definitions of key terms such as unfulfilled eligibility. A more extensive glossary of terms and unfulfilled eligibility types is included in the appendices in this document.
Contact details are provided for further information on the statistics, guidance on using the statistics, data sources, coverage, data limitations and other necessary relevant information to enable users of the data to interpret and apply the statistics correctly.
Trade-offs between output quality and components
Trade-offs are the extent to which different dimensions of quality are balanced against each other.
The main trade-off for these statistics is timeliness against accuracy. We always assess the right balance taking into account fitness for purpose, and fully explaining any compromises in accuracy for improved timeliness.
As detailed in the timeliness and punctuality section, we wait a considerable amount of time for the data to be as complete as possible before our publication process begins, to ensure that the estimates are based on data which is as final and robust as possible. This means that we will usually publish data around 8 months after the main reference period.
Balance between performance, cost, and respondent burden
The DWP unfulfilled eligibility in the benefit system statistics are produced from survey data which have a high respondent burden. A compulsory interview, lasting between approximately 30 minutes and 2 hours, is required for all cases sampled.
The total DWP cost for production of these statistics is approximately 150 staff (full-time equivalent).
DWP are continuously looking at more cost effective and efficient options for sourcing and collecting data, reducing the burden on the respondent and the production of the estimates.
Confidentiality, transparency, and security
All of our data is handled, stored, and accessed in a manner which complies with government and departmental standards regarding security and confidentiality, and fully meets the requirements of the Data Protection Act (2018).
Access to this data is controlled by a system of passwords and strict business need access control.
Any revisions to our publications are handled in accordance with the department’s revisions policy.
6. Future reporting
The future coverage and scope of the official statistics “Unfulfilled eligibility in the benefit system” is kept under review and users are kept informed of our plans via our publication strategy document.
Appendix 1: Glossary of abbreviations
| Abbreviation | Definition |
|---|---|
| AA | Attendance Allowance |
| CA | Carer’s Allowance |
| CE | Claimant Error |
| CF | Claimant Fraud |
| DLA | Disability Living Allowance |
| DWP | Department for Work and Pensions |
| ESA | Employment and Support Allowance |
| FEMA | Fraud and Error Measurement and Analysis |
| FYE | Financial Year Ending |
| HB | Housing Benefit |
| HMRC | His Majesty’s Revenue and Customs |
| IB | Incapacity Benefit |
| IS | Income Support |
| JSA | Jobseeker’s Allowance |
| LA | Local Authority |
| MVFE | Monetary Value of Fraud and Error |
| OE | Official Error |
| OP | Overpayment |
| PC | Pension Credit |
| PIP | Personal Independence Payment |
| PM | Performance Measurement team |
| PSU | Primary Sampling Unit |
| SP | State Pension |
| UC | Universal Credit |
| UP | Underpayment |
Appendix 2: List of benefits included in unfulfilled eligibility estimates
Benefits reviewed this year
Universal Credit
State Pension
Housing Benefit
Disability Living Allowance
Pension Credit
Personal Independence Payment
Benefits reviewed previously using unfulfilled eligibility methodology
Employment and Support Allowance (last reviewed FYE 2023)
Attendance Allowance (last reviewed FYE 2022)
Carer’s Allowance (last reviewed FYE 2020)
Benefits reviewed previously using Claimant Error underpayment methodology
Jobseeker’s Allowance (last reviewed FYE 2019)
Income Support (last reviewed FYE 2015)
Incapacity Benefit (last reviewed FYE 2011)
Benefits never reviewed
Maternity Allowance – proxy measure: Employment and Support Allowance rates relating to Abroad, Eligibility Conditions and Earnings only
Severe Disablement Allowance – proxy measure: Employment and Support Allowance rates relating to Abroad, Eligibility Conditions and Earnings only
Financial Assistance Scheme – proxy measure: No unfulfilled eligibility
Industrial Death Benefit – proxy measure: Pension Credit Living Together rate only
Winter Fuel Payments – proxy measure: No unfulfilled eligibility
State Pension Transfers – proxy measure: State Pension
Cold Weather Payments – proxy measure: No unfulfilled eligibility
Widow’s Benefit / Bereavement Benefit – proxy measure: Employment and Support Allowance Contributory only element and rates relating to Eligibility Conditions only
Industrial Disablement Benefit – proxy measure: Personal Independence Payment
Armed Forces Independence Payment – proxy measure: Personal Independence Payment
Christmas Bonus – proxy measure: No unfulfilled eligibility
Cost of Living Payments – proxy measure: No unfulfilled eligibility
Statutory Sick Pay – proxy measure: No unfulfilled eligibility
Statutory Maternity Pay – proxy measure: No unfulfilled eligibility
Appendix 3: Further information on types of unfulfilled eligibility reported
The definition of unfulfilled eligibility is included at the start of this document. This section includes additional information on how we classify unfulfilled eligibility, including a detailed list of the types of unfulfilled eligibility we report for benefits reviewed in the current year.
Note that our methodology states that all unfulfilled eligibility found on a case is recorded separately and the full values of each unfulfilled eligibility are recorded in isolation of one another. This can lead to the sum of the unfulfilled eligibility values being higher than the difference between the claimant’s award pre and post review. In such cases a capping calculation is performed to ensure that the sum of the unfulfilled eligibility does not exceed this difference, so that the monetary value of unfulfilled eligibility is not over-reported. This can lead to some of the originally captured unfulfilled eligibility raw sample values being reduced during the calculation of the estimates.
A glossary of the current unfulfilled eligibility types is given below:
- Abroad – failing to report or incorrectly reporting when the claimant or partner has returned to live in Great Britain
- Capital – failing to report a decrease or incorrectly reporting the amount of savings in bank or building society accounts, cash, ISA/PEPs, premium bonds, other property interests or shares
- Childcare costs – failing to report or incorrectly reporting the amount of childcare costs paid
- Earnings/employment – failing to report a decrease or incorrectly reporting the amount of earnings from full or part-time work undertaken during the claim by the claimant or their partner. This work can be for an employer or self-employment
- Elements – failing to report or incorrectly reporting that the claimant or partner is caring for a disabled person for at least 35 hours per week
- Eligibility conditions – failing to report changes or incorrectly reporting the personal circumstances of an ineligible partner, for example immigration status
- Functional needs – failing to report a deterioration in their condition or a new medical condition, or incorrectly reporting their condition, where this affects their ability to carry out any of the activities on which PIP or DLA or AA is considered
- Hospital/registered care home – failing to report or incorrectly reporting when the claimant or partner is no longer in hospital or a registered care home
- Household composition – failing to report or incorrectly reporting changes in household composition, for example a non-dependant leaving
- Housing costs – failing to report increases or incorrectly reporting the amount of housing costs they pay, including rent and service charges
- Income - occupational and personal pensions – failing to report decreases or incorrectly reporting income received from a non-state pension obtained through contributions paid in past employment schemes, annuities, or personal investments
- Income - other – failing to report decreases or incorrectly reporting income coming into the household from sources such as sick pay from work, spousal maintenance, partner’s student income, unemployment, or similar insurance policy payments
- Income - other benefits – failing to report decreases or incorrectly reporting income received from another benefit
- Living together – failing to report or incorrectly reporting when a claimant lives with another person and maintains a joint household
- Other – this covers a range of different cases not covered in the categories above or below
- Tax credits – failing to report a decrease or incorrectly reporting the amount or existence of tax credits
Appendix 4: Glossary of statistical terms
Key statistical terms used in this report are explained below.
95% confidence interval
The range of values within which we can be 95% sure that the true value we are trying to estimate lies. It is used as a measure of the statistical uncertainty in an estimate
Estimate
An estimate is an indication of the value of an unknown quantity based on observed data. It provides information about unknown values in the population that we are trying to measure
Population
A population is any entire collection of items from which we may collect data. It is the entire group that we are interested in, which we wish to describe or to draw conclusions about (generally benefit claimants or expenditure in the context of this report). There are two different types of population referred to in sampling:
1. The target population – consists of the group of population units from whom we would like to collect data (for example, all people claiming a benefit).
2. The survey population – consists of the group of population units from whom we can collect data (for example, all claimants with sufficient case details on our datasets). The survey population is sometimes referred to as the ‘sampling frame.’
Sample
A group selected (randomly in the context of this report) from a larger group (known as the ‘population’). Through analysing the sample, we aim to draw valid conclusions about the larger group.
ISBN: 978-1-78659-673-4