Reported road casualties Great Britain, provisional results: 2020
Published 24 June 2021

© Crown copyright 2021
This publication is licensed under the terms of the Open Government Licence v3.0 except where otherwise stated. To view this licence, visit nationalarchives.gov.uk/doc/open-government-licence/version/3 or write to the Information Policy Team, The National Archives, Kew, London TW9 4DU, or email: psi@nationalarchives.gov.uk.
Where we have identified any third party copyright information you will need to obtain permission from the copyright holders concerned.
This publication is available at https://www.gov.uk/government/statistics/reported-road-casualties-great-britain-provisional-results-2020/reported-road-casualties-great-britain-provisional-results-2020
The recent trends in reported road casualties have been impacted by the national restrictions implemented from March 2020 onwards following the coronavirus (COVID-19) pandemic. More information can be found in our release investigating this impact on road safety.
In line with the Government Digital Service guidance, we have published our latest releases in HTML. We have launched a survey to gather stakeholder feedback in relation to this change of format.
About this release
This release provides the number of personal injury road traffic accidents in Great Britain that were reported by the police in 2020 using the STATS19 reporting system. It also includes the number of people killed or injured in these accidents and which road user group they were in. More information on STATS19, how road accident data is collected and how these figures are produced can be found in the background notes.
Headline figures
These provisional statistics show:
- an estimated 1,472 reported road deaths in 2020 which includes a total of 4 months of national lockdown (April to June and November)
- an estimated 23,486 killed or seriously injured (KSI) casualties in 2020, a decrease of 22% compared to the same period in 2019
- 115,333 casualties of all severities in 2020, a decrease of 25% from 2019
- the reduction in road traffic followed a similar trend in the same period and decreased by 21%
- pedal cyclist casualty rates saw the greatest percentage decrease (34%) compared to all other road user types
A monthly breakdown can be found in our COVID analysis release.
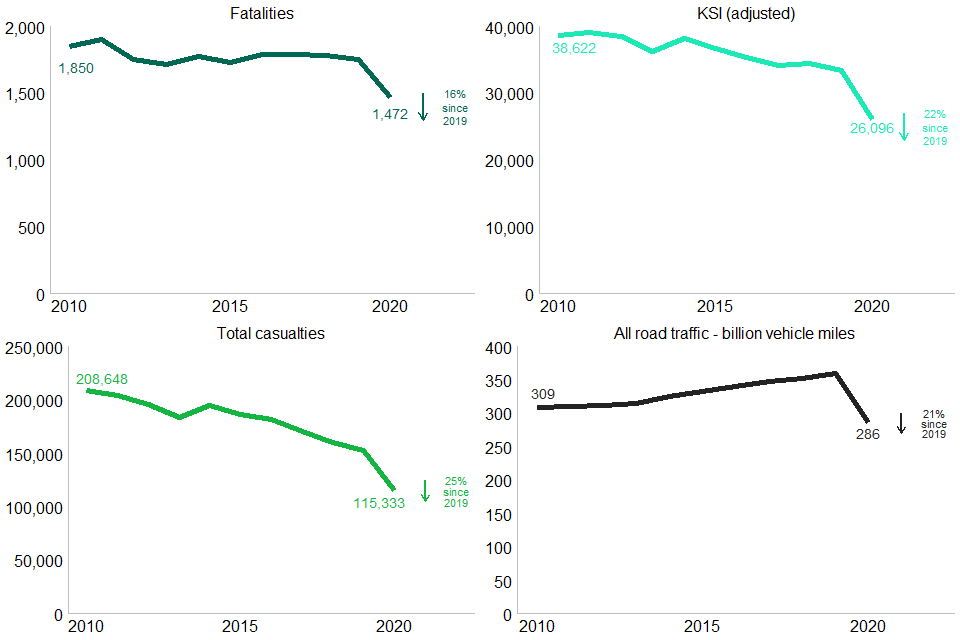
Chart 1: Total casualties, all road traffic (billion vehicle miles), fatalities and KSI in Great Britain, 2010 to 2020 (RAS30001)
Things you need to know
Provisional figures
Figures in this release are provisional and will be revised in the annual report in September after further validation, although this is not expected to have any noticeable impact on the trends and changes identified. Missing data for Wiltshire police force has been estimated for four months of 2020. This is unlikely to affect the national trends but will have a bigger impact on figures for the police force area.
Severity adjustment
From 2016 onwards, figures on the severity of injury have been affected by a large number of police forces changing their reporting systems. In previous years, serious injuries may have been classified as slight injuries which impacts the comparability of these figures over time.
The figures in this release are based on adjusting figures reported by the police to take account of changes in the reporting of injury severity by some police forces in recent years. These adjusted figures can reliably be used to compare trends over time across the country. They are based on what we estimate the totals would be if all police forces were using injury-based severity reporting systems. More details on severity adjustments and changes in reporting systems can be found in the severity adjustments section in our 2019 annual report and we welcome user feedback on them.
Figures as reported by the police (before adjustment) are presented alongside adjusted figures in the accompanying data tables.
Data coverage
There is no obligation for people to report all personal injury accidents to the police. These figures, therefore, do not represent the full range of all accidents or casualties in Great Britain. All accidents that were reported by the police and that occurred on a public highway involving at least one motor vehicle, horse rider or pedal cyclist, and where at least one person was injured are included in these statistics.
Further information about the data collected, notes, definitions and guidance is available in the background notes and more detailed guidance.
Overall casualties
In early March 2020, the UK government set out its response to the coronavirus pandemic, including restrictions on travel. Coronavirus has had a wide impact on UK society and economic activity since March 2020. Our report investigating this impact provides more detail.
As these figures are affected by the coronavirus (COVID-19) pandemic in the UK, this should be considered when comparing them with previous time periods.
Summary of trends
The summary table below shows the number of reported road casualties in Great Britain in 2020 compared with 2019 and 2010.
Table 1: Reported road casualties by severity and road traffic (billion vehicles miles) Great Britain, 2020 compared to 2019 and 2010 (RAS30001)
| Severity | 2020 | Percentage change from 2019 | Percentage change from 2010 |
|---|---|---|---|
| All road traffic - billion vehicle miles | 286 | -21 | -8 |
| Casualties | 115,333 | -25 | -45 |
| Fatalities | 1,472 | -16 | -20 |
| KSI | 23,486 | -22 | -32 |
| Serious | 22,014 | -22 | -32 |
| Slight | 91,847 | -25 | -47 |
Note
- adjusted estimates following methodology from the Office for National Statistics Methodology Advisory Service analysis accounting for changes in severity reporting
- KSI - killed or seriously injured
- road traffic includes all motor vehicles and pedal cyclist traffic (billion vehicle miles)
Fatalities
There were 1,472 fatalities in reported road accidents in 2020, a decrease of 16% from the previous year.
The overall trend in fatalities between 2010 and 2019 was broadly flat. However, road traffic saw a gradual increase of 17% from 2010 to 2019, causing fatality rates to fall.
The decrease in fatalities in 2020 is associated with the reduction in road traffic in response to the COVID-19 pandemic (Table 1). Compared to 2019, fatality rates increased in 2020 (Chart 8).
Fatal casualties in 2020 saw a smaller reduction than injured casualties compared to both 2019 and 2010 (Table 1).
Serious and slight injuries
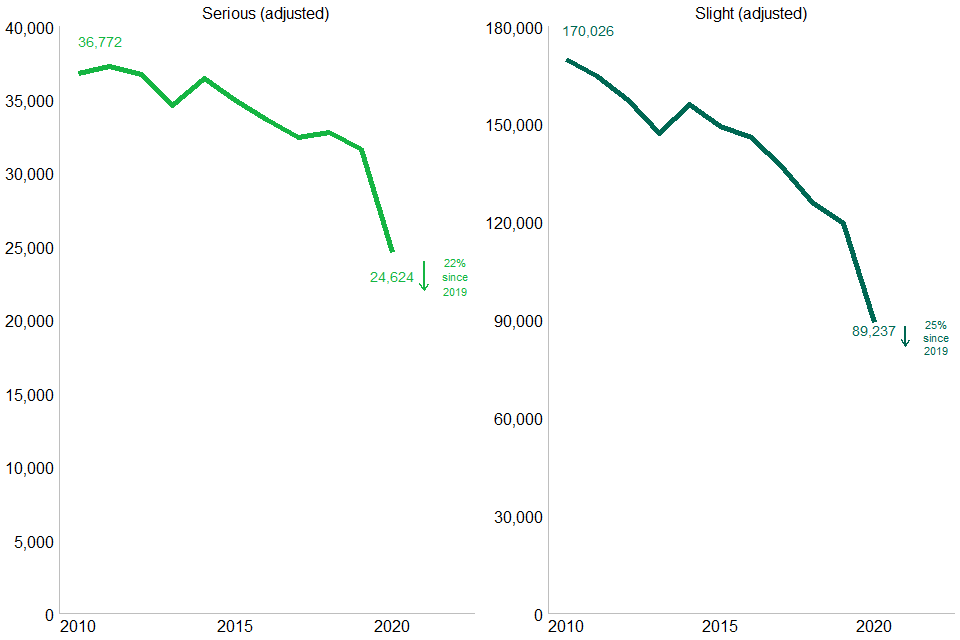
Our best estimate, after adjusting for changes in reporting by police, is that there were 22,014 seriously injured and 91,847 slightly injured casualties, decreases of 22% and 25% since 2019, respectively.
Since 2010, there has been a greater decline in serious injuries compared to fatalities (Chart 2).
Chart 2: Serious and slight casualties in Great Britain: 2010 to 2020 (RAS30001)
All casualties
There were a total of 115,333 casualties of all severities in reported road traffic accidents in 2020, 25% lower than in 2019.
This figure should be interpreted with caution for 2 reasons:
It has long been known that non-fatal (and particularly slight) casualties are underreported to the police and therefore this figure is likely to be an underestimate of the total.
The introduction of online self-reporting by the Metropolitan Police Service at the end of 2016 and a few other forces in 2018 may have affected the number of non-fatal casualties reported in these forces and therefore impact the total for Great Britain. See our reported road casualties annual report 2019 on online self-reporting for more details.
While the total number of injuries is likely to be an underestimate, we have no reason to believe that the level of under-reporting has changed over time so that the trends shown for 2020 are likely to reflect a genuine fall in the number of casualties. We will include comparisons to other available data sources as part of our main annual publication in September.
Trends in casualty rates
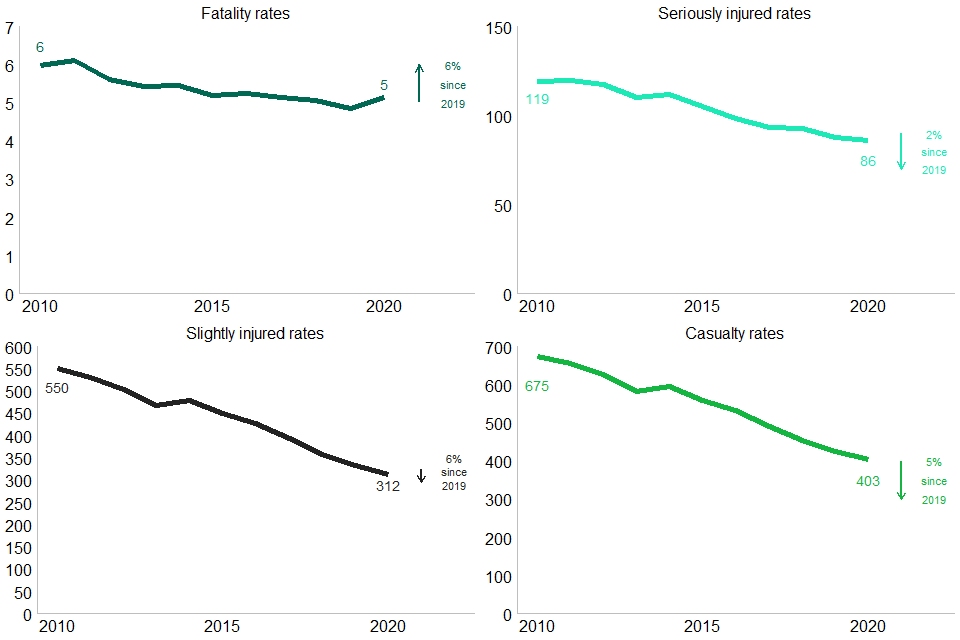
The overall casualty rate saw a small decrease in 2020, which suggests a correlation between road traffic and road casualties (Chart 3).
Fatality rates differed to the overall trend and increased by 6% for 2020, compared to 2019. This may be related to the road user types involved in road accidents. We will explore this further in our publication in September.
Seriously and slightly injured casualty rates decreased by 2% and 6%, respectively (Chart 3).
Chart 3: Casualty rates per billion vehicle miles by severity in Great Britain 2010 to 2020 (RAS30001)
Casualties by road user type
In 2020, there was a shift in travel behaviours due to the COVID-19 pandemic, which varied by transport mode. The National Travel Attitudes Study reported 79% of survey respondents used buses less when comparing travel before and during the pandemic. For the same period, 34% of pre-pandemic cyclists reported they were cycling more. Further details can be found in the National Travel Attitudes Study release.
The reduction in casualties varied by road user type. There were smaller reductions for pedal cyclist casualties (4%), and larger reductions for bus occupants (51%) and pedestrian casualties (32%) (Table 3). For information on the impact of COVID by road user type, see our COVID analysis release.
In 2020, there was an 18% increase for other vehicle occupant casualties (Table 3). This may be linked to the increase in vehicles classified in this group, for example e-scooters. We will investigate this further in our September publication.
Chart 4: Fatalities by road user type in Great Britain in 2020 compared with 2019 (RAS30001)
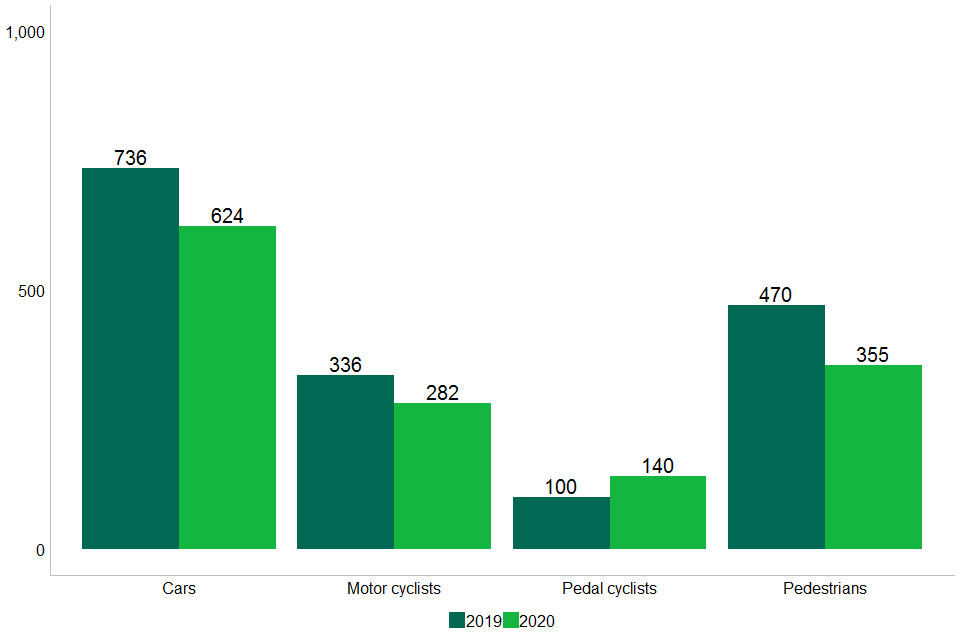
Table 2: Reported fatalities by road user type in Great Britain in 2020 compared with 2019 and 2010. (RAS30001)
| Road user type | 2020 | Percentage change from 2019 | Percentage change from 2010 |
|---|---|---|---|
| Bus and Coach Occupant | 4 | -71 | -56 |
| Car Occupant | 624 | -15 | -25 |
| Goods Vehicle Occupant | 54 | -18 | -13 |
| Motor Cyclist | 282 | -16 | -30 |
| Other Vehicle Occupant | 13 | -57 | -48 |
| Pedal Cyclist | 140 | 40 | 26 |
| Pedestrian | 355 | -25 | -12 |
Chart 5: Total casualties by road user type in Great Britain in 2020 compared with 2019 (RAS30001)
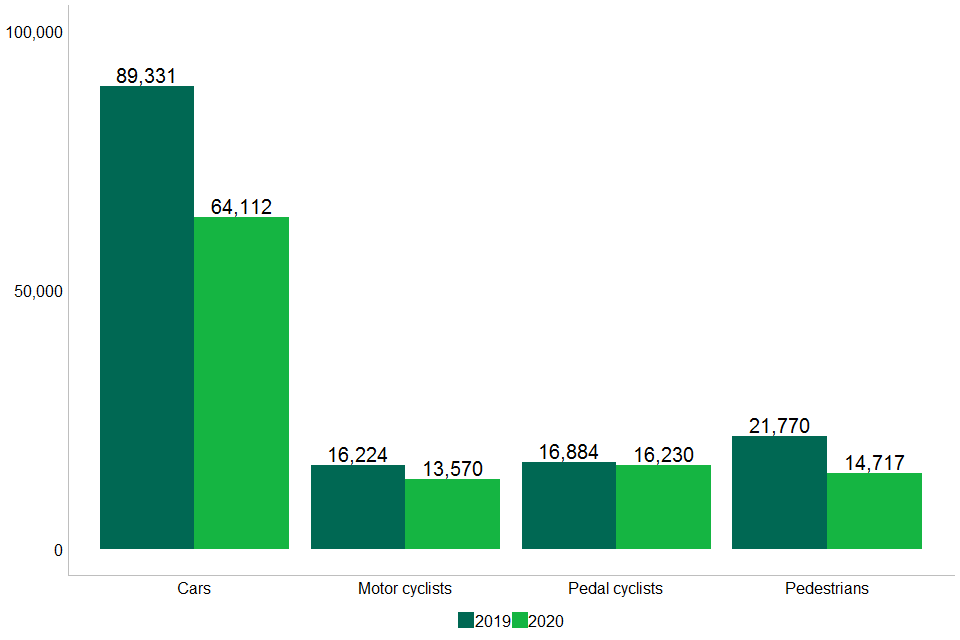
Table 3: Reported road casualties by road user type in Great Britain in 2020 compared with 2019 and 2010. (RAS30001)
| Road user type | 2020 | Percentage change from 2019 | Percentage change from 2010 |
|---|---|---|---|
| Bus and Coach Occupant | 1,505 | -51 | -76 |
| Car Occupant | 64,112 | -28 | -52 |
| Goods Vehicle Occupant | 4,166 | -16 | -31 |
| Motor Cyclist | 13,570 | -16 | -27 |
| Other Vehicle Occupant | 1,034 | 18 | -25 |
| Pedal Cyclist | 16,230 | -4 | -6 |
| Pedestrian | 14,717 | -32 | -43 |
Casualty rates by road user type
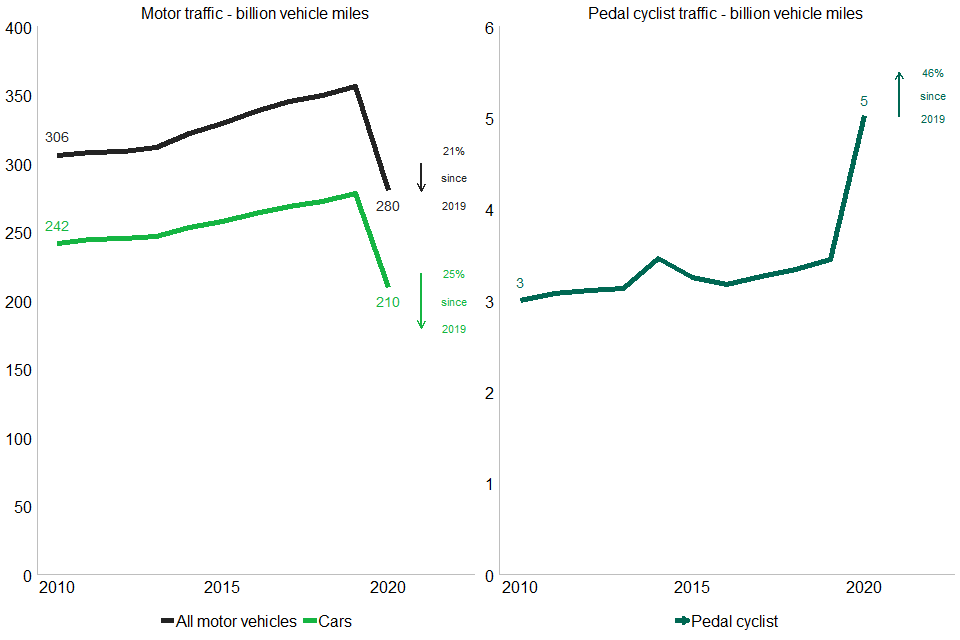
Pedal cyclist traffic increased by 46% in 2020 compared to 2019, whereas all motor vehicle traffic decreased by 21%. Compared to other road users, pedal cyclist casualty rates saw the greatest reduction of 34% (Chart 6). This may be as a result of reduced motor vehicle traffic and increased pedal cyclist traffic.
More details on pedal cycle traffic can be found at road traffic statistics.
Pedestrian casualty rates will be provided in the September release when data on distance walked is available from the National Travel Survey.
We will reflect on the presentation of casualty rates for our September publication and will investigate the vulnerability and risk for different road user types.
Chart 6: Casualty rate per billion vehicle miles by road user type in Great Britain in 2020 compared with 2019
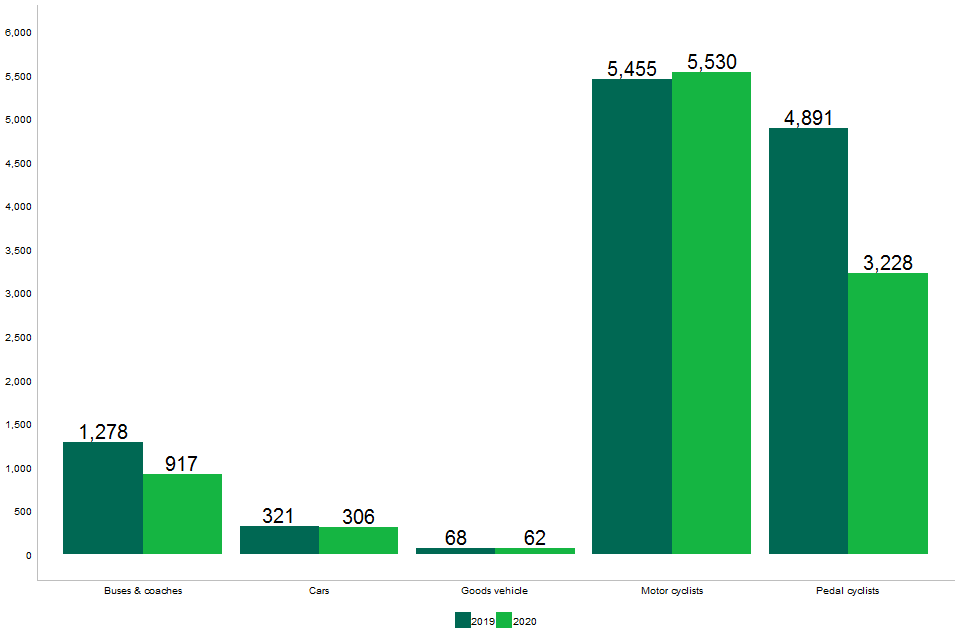
Chart 7: Road traffic levels (billion vehicle miles) by road user type: Great Britain, 2010 to 2020
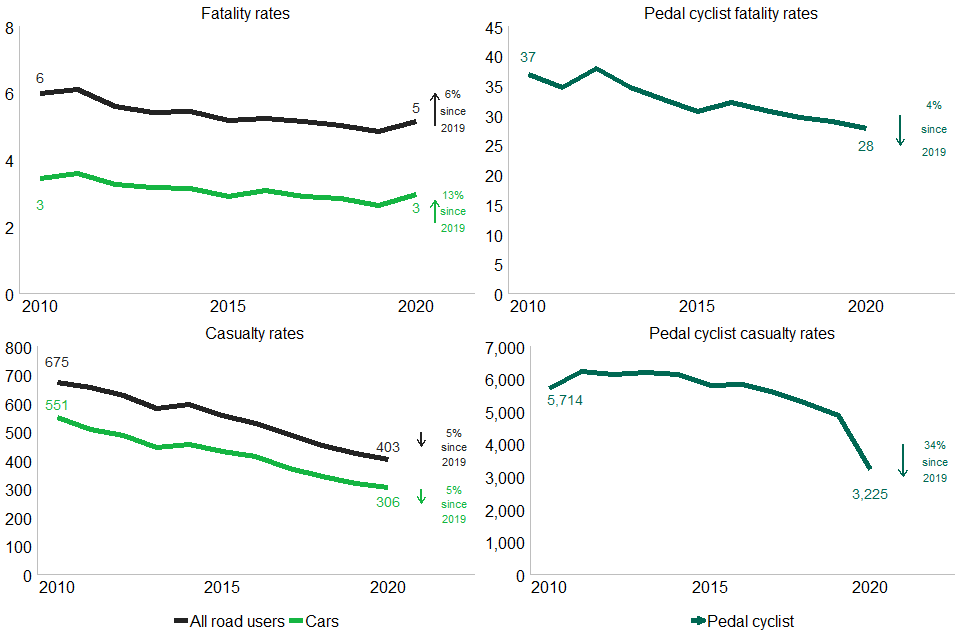
For all road user types, and for car occupants, fatality rates increased in 2020 while casualty rates fell slightly in line with recent trends.
However, despite an increase in pedal cycle fatalities, there was a slight (4%) reduction in fatality rates for pedal cyclists and a much larger reduction in the pedal cycle casualty rate of 34% between 2019 and 2020 - as casualties did not increase by as much as cycle traffic (Chart 8).
Chart 8: Fatality and casualty rates (per billion vehicle miles) by road user type Great Britain: 2010 to 2020
Casualties by age and sex
A smaller percentage decrease was observed for male casualties of all ages compared to female casualties for 2020 compared to 2019 (Table 5).
This could be linked to how people spent their time under lockdown. The Office for National Statistics reported females spent less time travelling and working not from home compared to males in March to April 2020.
For both sexes, children (those aged 0 to 16 years) and older people (aged 60 years and over) saw a greater reduction in casualties compared to younger people (aged 17 to 24 years) and adults (aged 25 to 59) (Table 4).
This may be linked to the guidance to reduce the spread of COVID-19. See our report analysing the impact of the pandemic.
In contrast, child fatalities (those aged 0 to 16 years) increased in 2020 compared to 2019. In 2020, there were 52 child fatalities, an increase of 3 from 49 casualties in 2019. This should be interpreted with caution due to the small number of child fatalities (Table 5).
We will able to explore different groups travel patterns in September, following the publication of the National Travel Survey.
Chart 9: Reported road fatalities by age group and sex in Great Britain in 2020.
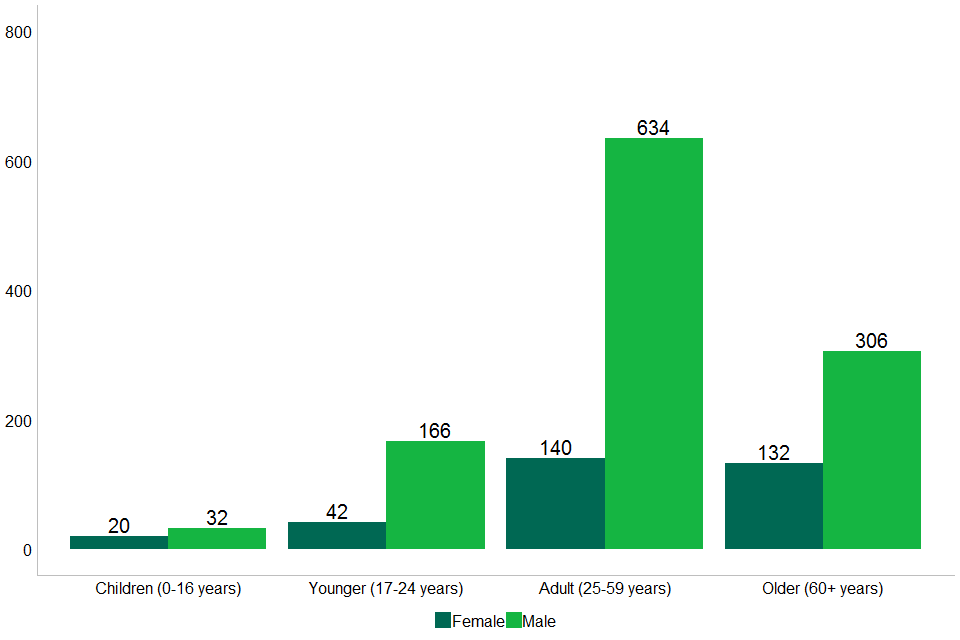
Table 4: Reported road fatalities by age group and sex in Great Britain in 2020 compared with 2019 and 2010. (RAS30024/RAS30010)
| Sex | Age group | 2020 | Percentage change from 2019 | Percentage change from 2010 |
|---|---|---|---|---|
| Female | Child casualties (0 to 16 years old) | 20 | 5 | -13 |
| Female | Younger casualties (17 to 24 years old) | 42 | -7 | -54 |
| Female | Adult casualties (25 to 59 years old) | 140 | 2 | -21 |
| Female | Older casualties (60 years and over) | 132 | -47 | -31 |
| Male | Child casualties (0 to 16 years old) | 32 | 7 | -43 |
| Male | Younger casualties (17 to 24 years old) | 166 | -18 | -46 |
| Male | Adult casualties (25 to 59 years old) | 634 | -7 | -12 |
| Male | Older casualties (60 years and over) | 306 | -22 | 10 |
Note
Includes casualties where age and sex is known.
Chart 10: Reported road casualties by age group and sex in Great Britain in 2020.
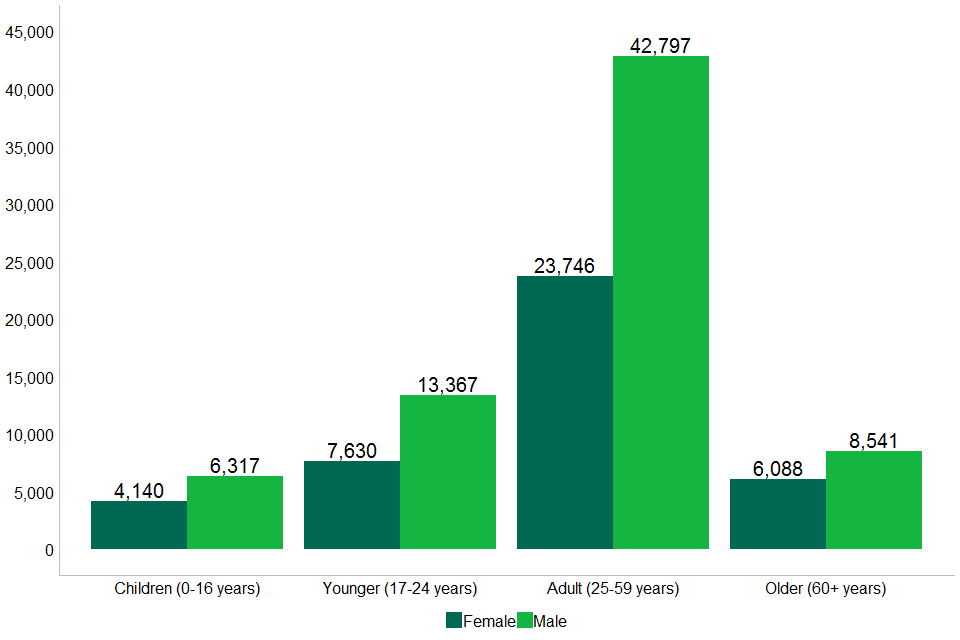
Table 5: Reported road casualties by age group and sex in Great Britain in 2020 compared with 2019 and 2010. (RAS30024/RAS30010)
| Sex | Age group | 2020 | Percentage change from 2019 | Percentage change from 2010 |
|---|---|---|---|---|
| Female | Child casualties (0 to 16 years old) | 4,140 | -34 | -57 |
| Female | Younger casualties (17 to 24 years old) | 7,630 | -25 | -62 |
| Female | Adult casualties (25 to 59 years old) | 23,746 | -29 | -47 |
| Female | Older casualties (60 years and over) | 6,088 | -40 | -48 |
| Male | Child casualties (0 to 16 years old) | 6,317 | -29 | -53 |
| Male | Younger casualties (17 to 24 years old) | 13,367 | -20 | -52 |
| Male | Adult casualties (25 to 59 years old) | 42,797 | -19 | -34 |
| Male | Older casualties (60 years and over) | 8,541 | -24 | -28 |
Note
Includes casualties where age and sex is known.
Quality and methodology
Provisional estimates
Figures in this release are provisional and will be revised in the annual report in September after further validation, although this is not expected to have any noticeable impact on the trends and changes identified. Most of this validation is focused on accident coordinates and therefore some of the geographical results presented here might slightly change. The validation will also impact parameters used in the adjustment model for severity and therefore estimates for serious injuries, and to a lesser extent, slight injuries, might marginally change.
Data supply from forces
In 2020, there have been significant challenges in closing the dataset. The COVID-19 pandemic impacted on the ability of some police forces to process and supply STATS19 data.
The provisional 2020 results are based on complete figures provided by 41 police authorities with partial data for one authority. Data is incomplete for various months in 2020 for Wiltshire.
Imputed data accounts for approximately 0.3% of the total number of accidents.
Estimation methodology
Imputation was conducted for police forces with missing months of data in 2020.
Police forces which have consistently used the same reporting systems were used to calculate the growth rate based on key variables (road user type, month, severity, road class, sex, age band and speed limit) and average casualty counts for 2017 to 2019.
The scaling factor was applied to 2019 data for Wiltshire, at casualty record level, with missing data to estimate the number of casualties in 2020.
Strengths and weaknesses
Underreporting
Comparisons of road accident reports with death registrations show that very few, if any, road accident fatalities are not reported by the police.
However, a considerable proportion of non-fatal casualties are not known to the police, as hospital, survey and compensation claims data all indicate a higher number of casualties than those recorded in police accident data. More information on the coherence of the police reported data with alternative sources can be found in our 2019 annual report.
Changes in reporting systems used by police forces
From 2016 onwards, figures on the severity of injury have been affected by a large number of police forces changing their reporting systems. It is likely that the recording of injury severity is more accurate for forces using these new reporting systems.
The Office for National Statistics (ONS) Methodology Advisory Service have completed analysis to quantify the effect of the introduction of new injury based reporting systems (CRASH and COPA) on the number of slight and serious injuries reported to the police, and to estimate the level of slight and serious injuries as if all police forces were using injury-based reporting systems.
In 2020, no new forces adopted CRASH. For more information on which forces have adopted CRASH and our severity adjustments please see our 2019 release.
Online self-reporting
Online self-reporting is part of a wider project for digital public contact called Single Online Home funded by the Home Office to allow people involved in road traffic accidents to report the collision to the police online should they choose to do so rather than having to physically report it at a police station.
The principle of online reporting is to make it easier for members of the public to report accidents. It is expected that the introduction of online reporting will affect the number of non-fatal (and particularly slight) casualties reported and therefore impact the total for Great Britain, as the public will have more reporting options available to them. This is particularly likely to impact numbers for slight injuries, which might not have been reported otherwise.
An analysis of the impact of online reporting was included in the 2019 annual report and this will be updated as part of the final annual statistics in September.
Background information
Publication timeline
Reported road casualties Great Britain, provisional results 2020 contains the first release of provisional headline accident and casualty figures for 2020.
This will be followed by the publication of the 2020 annual report in September 2021. The department aims to publish mid-year estimates for 2021 in November 2021.
These publications were previously published in PDF and this release has been published in HTML for the first time. Feedback from users regarding this format change are welcome at road safety statistics.
A first iteration of a reported road casualty dashboard will be released alongside the annual release in September 2021.
STATS19 review
Road accident data is collected from the police with the STATS19 collection. As with any collection system, it needs to be periodically reviewed to keep up with changes in technology, to make improvements to completeness and accuracy, and to reduce the reporting burden.
The STATS19 review started in autumn 2018 and has made a number of recommendations on changes to STATS19 going forward. These were based on evidence and detailed discussion with the review group.
Key recommendations can be found in the full STATS19 review report.
For further information please contact the STATS19 review team.
Data tables
Tables providing more details of accidents and casualties, along with information about the variables collected on the STATS19 form, historical publications and factsheets, are available at road safety statistics.
Definitions
A full list of the definitions used in this publication can be found in our notes and definitions.
National Statistics and pre-release access
National Statistics are produced to high professional standards as set out in the Code of Practice for Statistics. They undergo quality assurance reviews to ensure that they meet customer needs.
Details of ministers and officials who receive pre-release access to these statistics up to 24 hours before release can be found in our pre-release access list.
*[COVID-19}: Coronavirus *[KSI]: Killed or seriously injured