Employment Data Lab analysis: Merseyside Youth Association Talent Match Plus
Published 5 December 2023

© Crown copyright 2023
This publication is licensed under the terms of the Open Government Licence v3.0 except where otherwise stated. To view this licence, visit nationalarchives.gov.uk/doc/open-government-licence/version/3 or write to the Information Policy Team, The National Archives, Kew, London TW9 4DU, or email: psi@nationalarchives.gov.uk.
Where we have identified any third party copyright information you will need to obtain permission from the copyright holders concerned.
This publication is available at https://www.gov.uk/government/statistics/employment-data-lab-analysis-merseyside-youth-association-talent-match-plus-programme/employment-data-lab-analysis-merseyside-youth-association-talent-match-plus
This Employment Data Lab report presents an estimate of the impact of Merseyside Youth Association’s (MYA) employment support provision, called Talent Match Plus, on the benefit, employment, and education outcomes of the programme participants. MYA’s programme is aimed at supporting young people not in education, employment, or training (NEET) into employment or education.
The results in this report have been generated using quasi-experimental techniques which introduce some uncertainty. The results should be used with a degree of caution. Further information can be found in section 8, and in an associated methodology document.
This is the second Employment Data Lab report, the layout and presentation of future versions may differ.
Headline results
No statistically significant impact on employment*
The percentage of programme participants who were classed as Employed two years after starting the programme, was between 1 percentage point lower and 3 percentage points higher than had they not participated in the programme. This result was not statistically significant.
Increase in education and training courses passed
The percentage of programme participants who passed an education or training course at any point during the two years since starting the programme, was between 16 and 20 percentage points greater than it would have been had they not participated in the programme. This result was statistically significant.
Decrease in the numbers on inactivity benefits
The percentage of programme participants classed as being on inactivity benefits two years after starting the programme was between 1 and 5 percentage points less than it would have been had they not participated in the programme. This result was statistically significant.
*Other employment related impact estimates were statistically significant (see Table 6 for more details).
- The main analysis focuses on a sub-group of 2,526 participants who were between the ages of 18 and 29 when they started the programme, and received the intervention between 1st November 2015 and 1st April 2020
- Additional sub-analyses were carried out exploring the impact of regional differences and the COVID-19 pandemic
- For this report the Employment Data Lab team followed participants for two years after starting the programme irrespective of programme end date
- Participants were compared to a comparison group of “similar” individuals to evaluate the programme
- The three headline results were chosen as the primary outcomes measures to assess the success of the programme. Other secondary outcome measures are also reported
1. What you need to know
What is the Employment Data Lab?
The Employment Data Lab is a service provided by a team of analysts at the Department for Work and Pensions (DWP). The Data Lab provides group-level benefits and employment information to organisations who have worked with people to help them into employment. The purpose is to provide these organisations with information to help them understand the impact of their programmes.
What is the Talent Match Plus Programme?
The Talent Match Plus Programme, created and managed by MYA, aims to support young people into employment, training, and other positive outcomes. The programme is targeted at individuals who are aged between 15 and 29, not in education, employment or training for 12 months or more in the Liverpool City Region who face multiple highly complex personal barriers to employment such as:
- low levels of confidence, motivation, and self-esteem
- negative perceptions and attitudes to employment, education and training and alienation from existing services
- lack of social and basic skills required to achieve in education, learning and employment
- complex, and often severe, social needs including disabilities and health, mental health conditions, substance misuse, housing finance and debt, learning difficulties and challenging behaviours
- lack of awareness and understanding of the learning and employment opportunities available and how to access them
- lack of, or no, work experience history and limited access to available employment opportunities
- lack of vocational and occupational skills and associated qualifications to gain entry to employment in the areas of employment demand
- care responsibilities including child and dependent care
- offending and re-offending history
Participants were referred to the programme via multiple referral routes including referral by Job Centres, referral by other employability services, and self-referral. A mentor/agent or the young personal themselves (in the case of self-referral) will complete and submit a Talent Match Plus referral form to MYA. As the European Social Fund (ESF) co-financed the programme, MYA then completes an eligibility assessment to ensure participants meet ESF eligibility requirements.
Some participants left the programme early. Estimates provided by MYA indicate 65%-70% of participants per year go on to complete the programme while 30%-35% leave the programme early. This analysis includes all who start the programme, irrespective of whether they complete the programme or leave the programme early.
The programme offers participants support that can involve intensive mentoring, therapeutic interventions, speech, language and basic skills support, work and enterprise tasters, volunteering opportunities, personal development activities, and residentials. To help participants find and sustain employment, education, or training opportunities, the programme offered activities to help participants build self-promotion skills such as CV writing, interview skills, and self-support skills including utilising coping strategies independently. Post-employment mentoring and business support was also provided; with post-employment mentoring restricted to 4 weeks after completing the programme, in line with ESF regulations.
There is no fixed duration for programme participation. The median time spent on the programme for those evaluated was approximately 6 months.
Participant information
Of the 2,526 participants included in this analysis, the available administrative data indicated:
- 58% were male and 42% were female
- the average age was 22 years
- 85% were white
- 22% had a restricted ability to work (RATW) when they started the programme
- 51% had previously been eligible for free school meals
- 52% had previously had Special Educational Needs
- 6% had ever been in care
- 13% had ever been classed as a child in need
- 11% were lone parents of a dependent child
- 27% had claimed housing benefit in the 2 years before starting the programme
Further information about those who were (and were not) included in the analysis and those missing markers in the administrative data can be found in Appendix A and Appendix B.
Who was evaluated as part of this analysis?
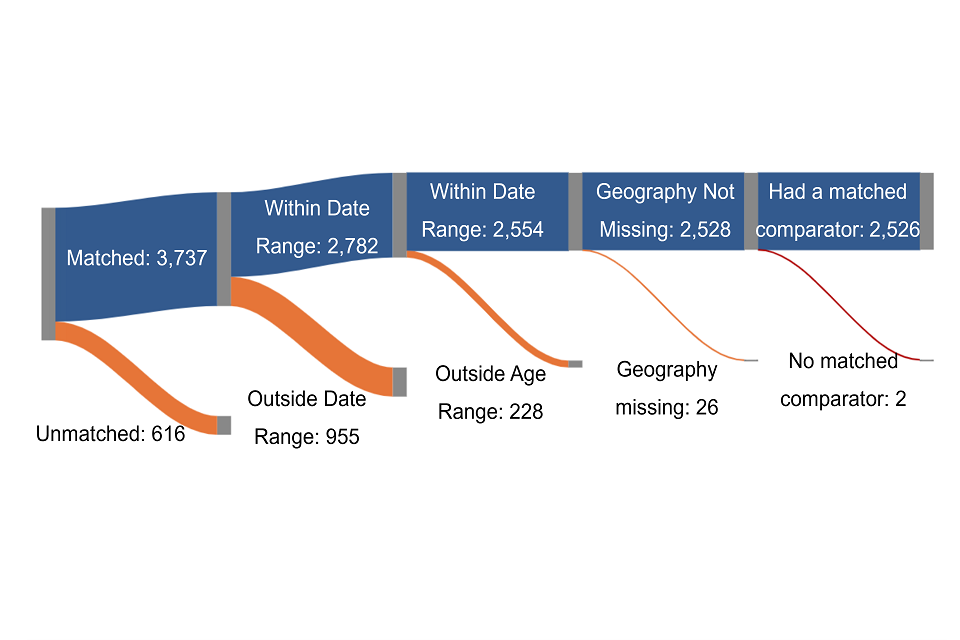
MYA shared data on 4,353 participants who took part in the programme between November 2015 and December 2022. The main impact analysis focusses on a subset of 2,526 participants who were between 18 and 29 when they started the programme. For more details see Appendix A.
The analysis in this report
This report presents analysis on the impact of the Talent Match Plus programme by comparing employment, benefit, and education-related outcomes of participants to those of a matched comparison group who did not participate. The comparison group is used to estimate the outcomes of participants had they not participated in the programme and was created using a method called propensity score matching (PSM). Further information about how the analysis was conducted can be found in the associated methodology document.
Three primary outcome measures were selected for this evaluation before the analysis was undertaken.
Primary outcome measures
The primary outcome measures for this analysis are:
- the percentage of the group classed as employed two years after starting on the programme
- the percentage of the group who passed an education or training course at any time during the two years after starting the programme
- the percentage of the group classed as being on inactivity benefits two years after starting on the programme
2. The labour market impacts of the programme over time
This report uses four categories of labour market status in this analysis (see section 8 for more details).
The results show that the programme led to:
- no statistically significant impact on those classed as Employed, at two years
- more classed as Looking for Work, at two years
- fewer classed as Inactive, at two years
- fewer classed as Other, at two years
No statistically significant impact on those classed as Employed, at two years
Between 1 percentage point less and 3 percentage points more participants were classed as Employed two years after starting the programme, than had they not participated. This result was not statistically significant.
More classed as Looking for Work, at two years
Between 7 and 11 percentage points more participants were classed as being on looking-for-work benefits two years after starting the programme, than had they not participated. This result was statistically significant.
Fewer classed as Inactive, at two years
Between 1 and 5 percentage points fewer participants were classed as being on inactivity benefits two years after starting the programme, than had they not participated. This result was statistically significant.
Fewer classed as Other, at two years
Between 2 and 4 percentage points fewer participants were classed as Other two years after starting the programme, than had they not participated. This result was statistically significant.
The figures and tables in this section show the impact of the programme on the numbers of people in each labour market category over the two years after starting the intervention. The participants are compared to a comparison group used to estimate the outcomes had the participants not participated in the programme.
Figure 1 and Table 1 show the percentages of the participant and comparison groups in each labour market category in the two years after participants started the programme. The difference shown between the groups, can be interpreted as an estimate of the impact of the programme. The results show that the programme had no statistically significant impact upon employment at two years after the programme start, but that the programme did lead to a statistically significant decrease in participants claiming inactivity benefits as well as a statistically significant increase in participants claiming looking-for-work benefits.
To explore the labour market impacts further, Table 2 shows an additional labour market impact measure – the percentage of each group who were in work at any point during the one and two years after starting the programme. The results indicate the programme led to a statistically significant increase in people having some experience of work during the two years after starting the programme, of between 2 and 6 percentage points. However, as noted above, this did not result in increases in the rates of employment at two years after the programme start. This may suggest that while more participants went into employment at some point during the two years after starting the programme, they sustained employment at a lower rate than the comparison group.
Further variables can be found in Table 12 in Appendix E, including labour market transition variables which track changes in labour market status from start to one and two years later.
Figure 1: Plots showing the impact of the programme on the numbers in each labour market category over time
The plots on the left (in orange) show the percentages of the participant and comparison groups in each category. The difference (or impact of the programme) is shown on the right in blue. The darker blue line shows the central estimate, and the shaded blue area is the 95% confidence interval.
1(a & b) – Employed: The impact plot (b) shows the programme had a small and mostly non statistically significant effect on the percentage of participants who were employed. Plot (a) shows the percentage of the participant and comparison group employed at start is similar and the percentages increase at a similar rate over the two years after start.
1(c & d) – Looking for work: The impact plot (d) shows the programme resulted in a sharp and sustained increase in those on looking-for-work benefits. Plot (c) shows a decrease in the percentage of both groups in the ‘looking for work’ category with the percentage of the comparison group ‘looking for work, decreasing at a faster rate.
1(e & f) – Inactive: The impact plot (f) shows that the programme led to a statistically significant reduction in the percentage of participants in receipt of ‘inactive’ benefits, that was sustained over the two-year follow-up period. Plot (e) shows the percentage of both groups on ‘inactive’ benefits increased over the two-year follow-up period with the percentage for the comparison group increasing at a faster rate.
1(g & h) – Other: The impact plot (h) shows that the programme led to a statistically significant and sustained reduction in the percentage of participants in the ‘other’ category. Plot (g) shows the percentage of the participant group classed as ‘other’ remained constant over the two-year follow-up period while the percentage of the comparison group classed as ‘other’ increased in the first year but remained fairly constant in the second year.
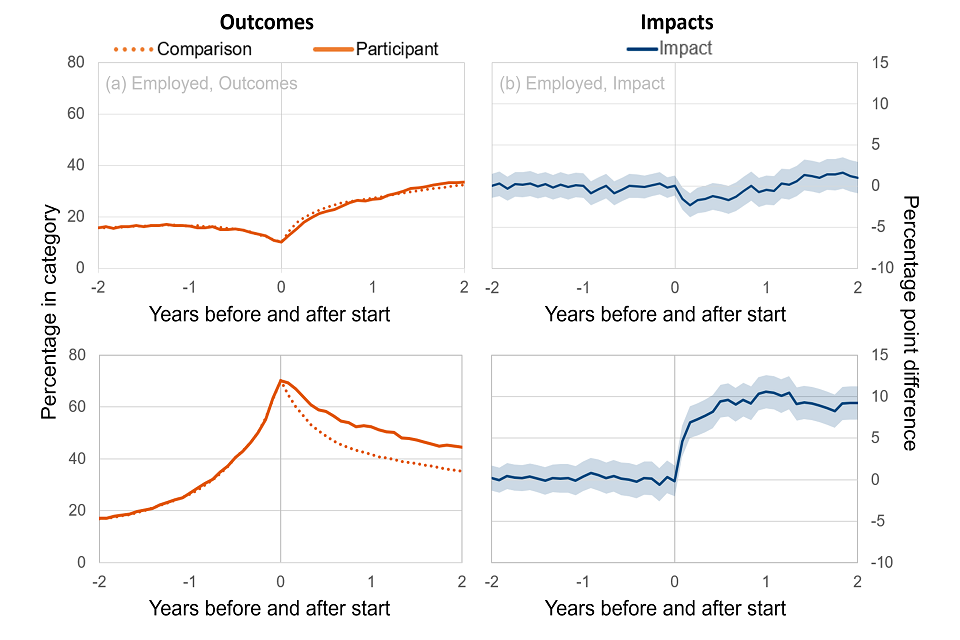
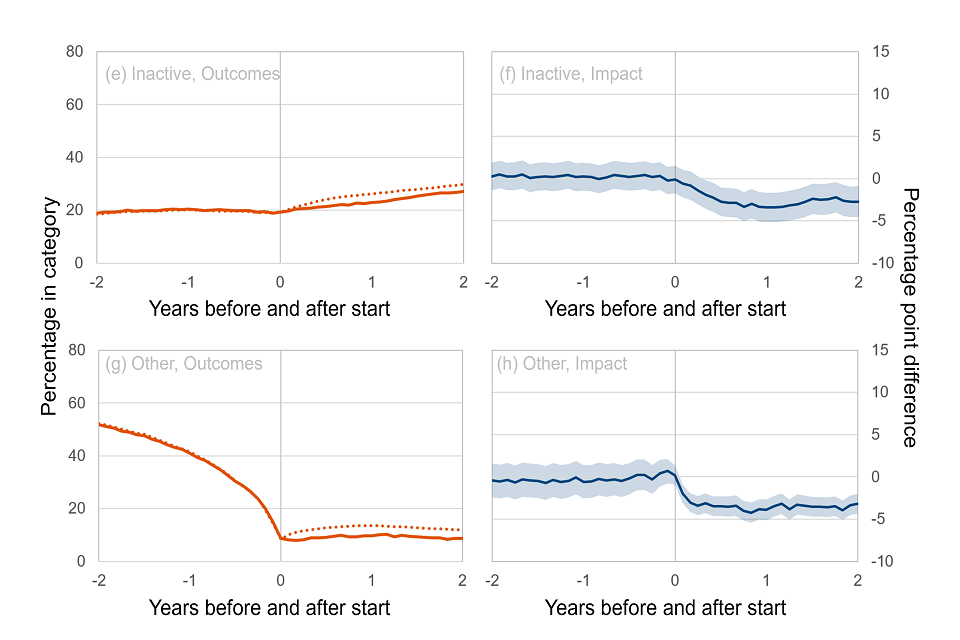
Table 1: Showing the percentage of each group in each category at one and two years after starting the programme
The impact, or difference, is shown along with an indication of statistical significance. The “upper” and “lower” give the confidence interval around the central estimate of the impact.
| Percentage of group in category | Participant group (%) | Comparison group (%) | Impact: Central (ppt) | Impact: Lower (ppt) | Impact: Upper (ppt) | Sig. |
|---|---|---|---|---|---|---|
| Employed (1 year) | 27 | 27 | 0 | -2 | 1 | no |
| Looking for Work (1 year) | 52 | 42 | 11 | 9 | 13 | yes |
| Inactive (1 year) | 23 | 26 | -3 | -5 | -2 | yes |
| Other (1 year) | 10 | 14 | -4 | -5 | -3 | yes |
| Employed (2 years) | 33 | 32 | 1 | -1 | 3 | no |
| Looking for Work (2 years) | 44 | 35 | 9 | 7 | 11 | yes |
| Inactive (2 years) | 27 | 30 | -3 | -5 | -1 | yes |
| Other (2 years) | 9 | 12 | -3 | -4 | -2 | yes |
Note: Categories are not mutually exclusive, so percentages in category do not sum to 100% and impacts do not sum to 0.
Table 2: Showing the percentage of each group in the Employed category at any point during the one and two years after starting the programme
The impact, or difference, is shown along with an indication of statistical significance.
| Category | Participant group (%) | Comparison group (%) | Impact: Central (ppt) | Impact: Lower (ppt) | Impact: Upper (ppt) | Sig. |
|---|---|---|---|---|---|---|
| Employed (at any point in 1 year) | 42 | 41 | 1 | -1 | 3 | no |
| Employed (at any point in 2 years) | 55 | 52 | 4 | 2 | 6 | yes |
3. Impact on education and training
Increase in the percentage entering education or training
The percentage of participants entering education or training at any point in the two years after programme start was between 12 and 16 percentage points greater than it would have been had they not participated.
This result was statistically significant.
Increase in the percentage passing an education or training course
The percentage of participants who passed an education or training course at any time during the two years after programme start was between 16 and 20 percentage points greater than it would have been had they not participated.
This result was statistically significant.
The figures and tables in this section show the impact of the programme on people entering, and also passing, an education or training course during the one and two years after starting on the programme.
Table 3 shows the impact on the percentage of participants entering education or training and Table 4 shows the impact on the percentage of participants passing a course of any level. In both cases the results suggest the programme resulted in a large statistically significant increase in the year after starting and that this continued into year two.
Figure 2 shows the percentage of participants in each group who passed at least one course at the stated level during the two years after starting the programme. The results show that most courses passed during the two years after start were level two or lower and that the largest impact was on the percentage of participants who passed a level one course. The results also show a small statistically significant negative impact on the percentage of participants who passed level three or higher courses during the two years after start. For more information see the full table of results in Table 12 in Appendix E.
Table 3: Showing the percentage of the participant and comparison groups who entered any level of education at any time during the year after programme start or two years after programme start
The impacts (difference between the two groups) are shown along with an indication of statistical significance.
| Percentage of group classed as in education at any point… | Participant group (%) | Comparison group (%) | Impact (Central) | Impact (Lower) | Impact (Upper) | Sig. |
|---|---|---|---|---|---|---|
| …during the year after start | 36 | 25 | 11 | 9 | 13 | yes |
| …during the two years after start | 43 | 29 | 14 | 12 | 16 | yes |
Table 4: Showing the percentage of the participant and comparison groups classed as passing a course during the year after programme start and during the two years after programme start
The impacts (difference between the two groups) are shown along with an indication of statistical significance.
| Percentage of group who passed a course… | Participant group (%) | Comparison group (%) | Impact (Central) | Impact (Lower) | Impact (Upper) | Sig. |
|---|---|---|---|---|---|---|
| …during the year after start | 27 | 13 | 14 | 12 | 15 | yes |
| …during the two years after start | 37 | 20 | 18 | 16 | 20 | yes |
Figure 2: Showing the percentage of the participant and comparison groups who passed at least one entry level, level one, level two, and level three or higher course at any point during the two years after programme start
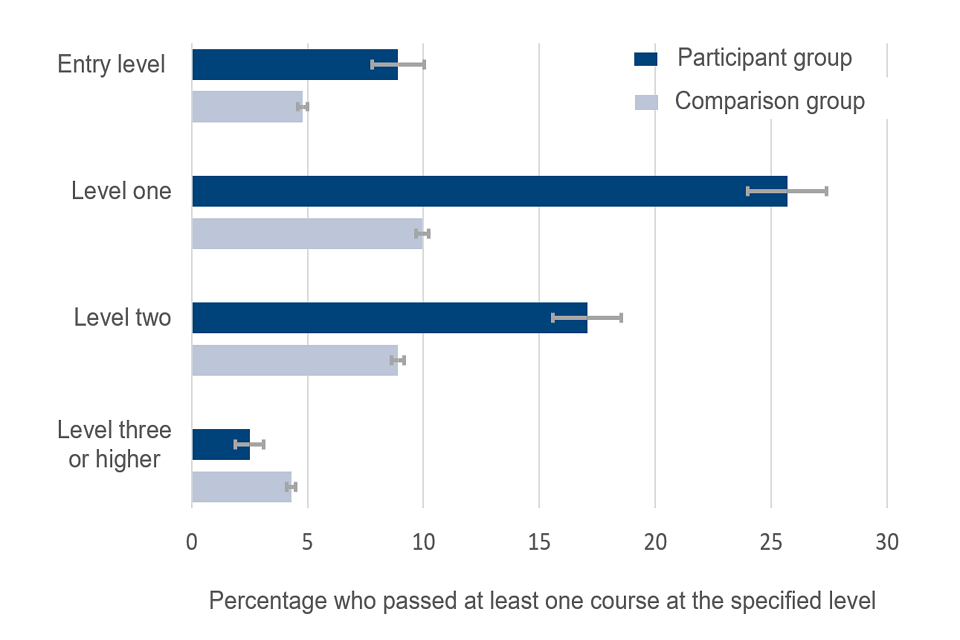
Note: Level three and higher passed course outcomes were combined for statistical disclosure control reasons.
Note: These levels are not mutually exclusive, so where an individual passed different courses at different levels, multiple levels would all be recorded.
4. COVID-19 impact
The programme spans the period of the COVID-19 pandemic. The pandemic and the associated lockdowns which took place between March 2020 and the summer of 2021 had significant impacts on the labour market in England, with large swings in employment, unemployment, and inactivity rates. See Coronavirus: Impact on the labour market (House of Commons Library briefing) for further details.
To explore the impacts of the pandemic on the participants and their outcomes, a sub-analysis was carried out that split the participants into two cohorts; one whose follow-up period was not impacted by the pandemic, and the other where it was:
-
Pre-COVID – Participants who started the programme before 26 March 2018. For this group the two-year outcomes would be unaffected by the COVID-19 pandemic.
-
COVID impacted – Participants who started the programme between 26 March 2018 and 1 April 2020. For this group the two-year outcomes were impacted by the COVID-19 pandemic.
The analysis was repeated for each cohort and the results of each run can be found in tables 13 and 14 in Appendix E. Participant details for each cohort can be found in Table 8 in Appendix B. Outcomes plots can be found in Figure 5 in Appendix B.
Table 5 below, shows for each of these two cohorts, the percentages in each labour market category two years after starting the programme. The results show that the impacts were largely similar for both cohorts. The most notable difference was in the impact of the programme on the numbers of people in receipt of inactivity benefits. There was a larger, and statistically significant reduction of between 2 and 7 percentage points for the COVID Impacted group at two years after starting. For the pre-COVID group the impact appeared smaller and was not statistically significant.
The table also shows that whilst the impact of the programme on those claiming looking-for-work benefits was similar for both cohorts, the percentage of participants claiming these benefits differed. 40% of participants in the pre-COVID group were claiming looking-for-work benefits two years after starting compared to 49% for the COVID-impacted group.
Table 5: Showing the percentage of each group in each category at two years after starting the programme for the Pre-COVID and COVID impacted groups
The impact, or difference, is shown along with an indication of statistical significance. The “upper” and “lower” give the confidence interval around the central estimate of the impact.
| Percentage of group in category at 2 years after start: | Participant group (%) | Comparison group (%) | Impact: Central (ppt) | Impact: Lower (ppt) | Impact: Upper (ppt) | Sig. |
|---|---|---|---|---|---|---|
| Employed (Pre Covid) | 33 | 33 | 0 | -2 | 3 | no |
| Employed (Covid impacted) | 34 | 32 | 2 | 0 | 5 | no* |
| Looking for work (Pre Covid) | 40 | 30 | 9 | 6 | 12 | yes |
| Looking for work (Covid Impacted) | 49 | 41 | 8 | 6 | 11 | yes |
| Inactive (Pre Covid) | 27 | 29 | -2 | -4 | 1 | no |
| Inactive (Covid Impacted) | 27 | 31 | -4 | -7 | -2 | yes |
| Other (Pre Covid) | 12 | 15 | -3 | -5 | -1 | yes |
| Other (Covid Impacted) | 6 | 9 | -3 | -4 | -1 | yes |
*This result is statistically significant at the 90% level of confidence
Note: Categories are not mutually exclusive, so percentages in category do not sum to 100% and impacts do not sum to 0.
5. Exploring regional impacts
The programme was delivered in the six local authorities in the Liverpool City Region:
- Halton
- Knowsley
- Liverpool
- Sefton
- St. Helens
- Wirral
To explore any impacts the different regions may have had on the impact estimates, a sub-analysis was carried out that split the participants into four groups. The grouping was based on a cluster analysis that used local labour market characteristics to identify similar Local Authorities. More information on this can be found in Appendix D.
- Group 1 – Liverpool
- Group 2 – Wirral
- Group 3 – Sefton and St. Helens
- Group 4 – Halton and Knowsley
The analysis was repeated for each of the subgroups and the results for each region can be found in tables 15 to 18 in Appendix E. Participant details for each region can be found in Table 9 in Appendix B. Outcomes plots can be found in Figure 6 in Appendix B.
The results show some differences between the regions. The most notable difference was in the impact of the programme on employment across the regions. Table 6 shows the employment rates two years after starting the programme. This shows that the programme had a large statistically significant impact on employment in the City of Liverpool (of between 2 and 9 percentage points) but that this was not repeated in the other regions, where no statistically significant impact was observed.
Table 6: Looking at the percentage of participants and comparators in the ‘Employed’ category at two years after starting the programme in each regional labour market group
| Percentage of group in employment at 2 years after start in: | Participant group (%) | Comparison group (%) | Impact (Central) | Impact (Lower) | Impact (Upper) | Sig. |
|---|---|---|---|---|---|---|
| Liverpool | 38 | 33 | 5 | 2 | 9 | yes |
| Wirral | 32 | 32 | 0 | -4 | 4 | no |
| Sefton and St. Helens | 30 | 30 | -1 | -5 | 3 | no |
| Halton and Knowsley | 31 | 34 | -2 | -6 | 2 | no |
6. How to use the results of this report?
Three primary outcome measures were chosen to assess the success of this programme. The results suggest that the programme had pronounced, positive, and statistically significant impacts on two of the three measures. Notably the programme was successful at:
- increasing the number of participants passing an education or training course in the two years after starting the program, and
- reducing the number of participants on an inactive benefit two years after starting the programme
The analysis found no statistically significant impact on the numbers of participants classed as employed two years after starting, which was the third primary outcome measure.
A range of secondary outcome measures and subgroups were also analysed in this report (see Appendix E) and can be used to learn more about the impacts of the programme. Results marked as statistically significant indicate an estimate that is unlikely to have occurred by chance (and more likely to be real). If a result is not statistically significant it does not mean that there was no impact, it just means there was insufficient evidence to verify this to the required threshold.
The estimates in this report were generated using quasi-experimental methods that can be less reliable than experimental methods such as a randomised control trial. The results should be used with a degree of caution.
The estimates were also generated using a subset of MYA participants, most notably those who were over 18 years old on starting. Care should be taken in generalising the results to those under 18.
The estimates relate to a programme working in a particular context. This report makes no assessment as to whether these impacts are generalisable to different contexts. The estimates were also made in a “business as usual” setting where participants and comparators were free to go on to access other support.
7. MYA in their own words
Our organisation
Liverpool’s Talent Match Plus Programme (TMP) is one of the region’s innovative employability programmes, with a trauma-informed intensive mentoring approach to long-term youth unemployment. Our bespoke SELF Toolkit, co-developed with our young people over the past 9 years, supports improvement in skills, employment prospects, future life goals and aspirations. Specifically, our person-centre approach includes a variety of interventions aimed at stabilizing personal circumstances, enhancing personal and social development, and equipping young people with transferable and essential life skills. Making young people employable not just employed.
Talent Match provides personalised support in an accessible, secure, and safe environment so young people can receive a dedicated, intensive mentor, who co creates a personalised journey that enables the breaking down of any barriers. Within this unique programme is a multifaceted therapeutic offer (encompassing counselling, speech and language therapy, and resilience workshops). Our intensive mentors have become the golden thread and the enablers of progression for the young people for this region. They build a trusted and quality relationship that is both responsive and flexible, and gives young people a meaningful foundation on which to further build their future achievements.
We transition young people into positive destinations, offering personalised pathways to structured volunteering, customised pre-employment training, education, moving them closer towards the labour market, and eventually into work. Acknowledging the intricate relationship between extended unemployment and mental well-being, we understand the importance of addressing and overcoming each young person’s individual barriers. This vital element within an employability programme is the overarching approach needed to sustain success in both training, education, and employment.
Previous independent evaluation of our impact can demonstrate over £93 million in social value and economic savings to the public treasury, since 2018 alone, as assessed by our Social Return on Investment framework (developed from HACT methodology and Public Sector Unit Cost Database). Talent Match is currently participating in an Impact Pilot with Youth Futures Foundation, undergoing evaluation by King’s College London and London School of Economics.
Our response to the analysis
The results highlight an increased impact on employment in the city of Liverpool compared to other local authorities within which we work. Given this significant impact, we credit our uniquely bespoke approach that recognizes the link between mental health and long-term unemployment. Our own data shows Talent Match interventions achieve success rates of up to 81% in improving barriers to health and wellbeing, specifically feelings of life control, self-confidence, and anxiety/depression. We believe that this approach provides an individualized programme of no fixed length that improves participants’ readiness to attain and sustain EET (education, employment, and training) outcomes.
We recognise, from our own data collection, that 25-27% of our cohort engage with us as Hidden NEET status (unknown to services/DWP and not in receipt of any benefits) TM plays a crucial role in supporting young people to navigate the complexity of the benefit system and other services such as housing, GP’s, etc. Our goal is to enhance access to services including government benefits, to allow them to focus on their employment journey with TM while considering that being in receipt of these benefits that personal circumstances are stabilised. We meticulously tailor our interventions to align with an individual’s journey, promoting the attainment of both mental and financial stability.
We are a safe space, and we have become the ‘go to’ programme for young people and referral agencies playing an integral part in reducing NEET figures in Liverpool City Region while improving mental health and wellbeing. Our programme remains dynamic and responsive to the needs of young people, emphasizing a person-centred approach and adopting a ‘no wrong door’ attitude. Informed decisions ensure that we are not only aiding them in sustaining employment and advancing their careers but also in improving mental health and resilience.
8. About these statistics
This report presents estimates of the impact of a programme. This is achieved by comparing the outcomes of the programme participants to a credible estimate of their outcomes had they not participated in the programme.
This is often referred to as the counterfactual. In this report the counterfactual was generated using a quasi-experimental technique called propensity score matching. This involves constructing a comparison group of individuals, who did not participate in the programme but who are matched on key characteristics that affect whether an individual takes part in the programme and the outcomes that they experience as a result of participation.
Once this comparison group has been constructed the outcomes of the two groups can be compared to generate the estimate of the impact of the programme.
More information about this technique and how it is used in the Data Lab can be found in the methodology report.
Categorisation
The analysis in this report is based on the labour market outcomes of the participants (and a matched comparison group) in the two years before and after starting the intervention. This report uses four categories of labour market status for the analysis:
- Employed – people who are either employed or self-employed
- Looking for Work – people who are in receipt of Jobseekers Allowance (JSA), or in the Universal Credit (UC) “intensive work search”, “light touch out of work”, “light touch in work” conditionality regimes, or in the UC “working enough” conditionality regime and not in employment
- Inactive – people who are in receipt of inactive benefits such as Employment and Support Allowance (ESA) or in the UC “no work requirements” or “work focused interview” conditionality regimes. Several other benefits also fall into this category, though the numbers of people on these benefits is small. See the methodology report for details
- Other – people who do not fall into any of the above three categories. This could include people who are in full-time education and not working or receiving benefits or those who are in custody
These categories are not mutually exclusive, and it is possible to be in more than one category. For example, someone working fewer than 16 hours a week may also be in receipt of JSA and would be classed as “employed” and “looking for work”.
In addition to the above categories, data is also used on an individual’s education or training status at specific time points up to two years after starting. An individual is classed as NEET at a point in time, if they do not have an active employment, education or training spell at that time, irrespective of age. More information on how benefit, employment, and education spells are generated can be found in the methodology report.
Statistical significance
The report highlights if the results are statistically significant or not. A statistically significant result is one that is unlikely to have occurred by chance because of sampling error. If a result is not statistically significant it does not mean that the intervention has no impact, it simply means that there is not enough evidence to verify this to a required threshold. In this report, unless otherwise stated, the threshold for significance is 95%.
This report sometimes presents the central estimate of a result along with the upper and lower confidence values. These upper and lower values create a range that you would expect the estimate to fall within if the test was to be redone, within a certain level of confidence. This level is set at 95% unless otherwise stated. The confidence intervals will typically be stated in the tables of results and be presented on graphs and plots as either error bars or shaded regions.
Limitations
The validity of the technique used in this report rests on the assumption that all the characteristics that are linked to a person’s participation in the programme and the outcome variables of interest have been sufficiently accounted for in the analysis, either explicitly or otherwise. This is a strong assumption that cannot be tested and depends on the data available and on the nature of each programme and its participants. This is reviewed on a case-by-case basis in the Data Lab and impact evaluations are only carried out where the validity of this assumption is plausible. That said, these are quasi-experimental techniques that tend to be less robust than true experimental methods, such as a randomised control trial, and the results must be treated with a degree of caution.
Where to find out more
Read the Employment Data Lab analysis, information and guidance.
9. Statement of compliance with the Code of Practice for Statistics
The Code of Practice for Statistics (the Code) is built around 3 main concepts, or pillars:
- trustworthiness – is about having confidence in the people and organisations that publish statistics
- quality – is about using data and methods that produce statistics
- value – is about publishing statistics that support society’s needs
The following explains how we have applied the pillars of the Code in a proportionate way.
Trustworthiness
Employment Data Lab reports, such as this, are published to provide User Organisations with an estimate of the impact of their programmes that support employment. Releasing them via an ad hoc publication will give equal access to all those with an interest in them.
Quality
The methodology used to produce the information in this report has been developed by DWP analysts in conjunction with the Institute for Employment Studies. The information is based on data from the User Organisation and Government administrative data. The calculations have been quality assured by DWP analysts to ensure they are robust.
Value
Producing and releasing these estimates provides User Organisations and the public with useful information about employment support provision that they may not have otherwise been able to generate or obtain.
Appendix A: Exclusions from the participant group
MYA shared data on 4,353 participants who took part in the programme between November 2015 and December 2022. The analysis focussed on a subset of these participants who were between 18 and 29 years old when they started the programme and started the programme on or before 1st April 2020. This was to ensure that participants were unlikely to be in compulsory full-time education one year and two years after starting the programme and had at least two full years of labour market outcomes in the data available.
The distribution of programme start dates and exclusions, in Figure 3, shows that for the participants who started on or before 1st April 2020, exclusions from the evaluation were fairly evenly distributed throughout the period.
Figure 4 shows the final group of 2,526 participants, comprising the main analysis group used in the PSM, represented approximately 91% of the matched participants who took part during the relevant period.
Figure 3 shows the distribution of start dates of the programme participants
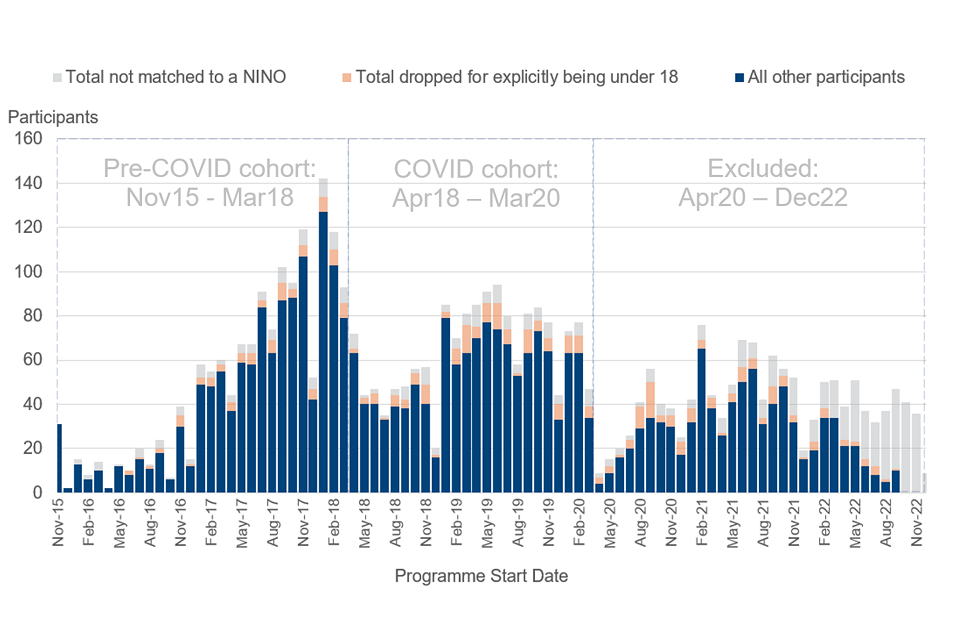
The grey bars show the participants who were excluded from the analysis because they could not be linked to the administrative data, the orange bars show the linked participants who were excluded because they were under 18, and the blue bars show all other participants.
Figure 4 presents a diagram showing the numbers of participants and the stages at which they were excluded from the analysis
Appendix B: Participant group information
This appendix includes the following tables:
-
Table 7 shows personal characteristics of the 2,526 evaluated participants, the 1,211 non-evaluated participants who could be linked to admin data, and the combined total. This shows that the evaluated participants are similar to the non-evaluated participants and all participants in terms the barriers they face to employment such as restricted ability to work, special educational needs, and free school meal eligibility
-
Table 8 shows the personal characteristics of the 1,239 participants who started the programme in the Pre Covid period and the 1,285 participants who started the programme in the Covid Impacted period. This shows the participants evaluated participants across the two periods had similar characteristics
-
Table 9 shows the personal characteristics of the evaluated participants across the four local labour market groups (Group 1 – Liverpool, Group 2 – Wirral, Group 3 – Sefton and St Helens, and Group 4 – Halton and Knowsley). This shows participant characteristics were broadly similar across the different local labour market groups
Table 7: Showing characteristics, benefits and employment information for the participant group
This is broken down into the “evaluated”; those who were selected for the evaluation, the “non-evaluated”; those who were excluded from the evaluation, and “all” of the participants, for whom data was available. This table only includes participants who could be linked to the administrative data.
| Variable | Evaluated | Non-evaluated | All (with data) | |
|---|---|---|---|---|
| Observations | 2526 | 1211 | 3737 | |
| Duration on the programme (mean days) | 306 | 196 | 271 | |
| Age (mean years) | 22 | 20.2 | 21.4 | |
| <18 years (%) | 0 | 29 | 9 | |
| 18-24 years (%) | 76 | 59 | 71 | |
| 25-30 years (%) | 24 | 12 | 20 | |
| >30 years (%) | 0 | 0 | 0 | |
| Male (%) | 58 | 57 | 58 | |
| RATW at start marker set (%) | 22 | 21 | 21 | |
| Partner marker set (%) | 4 | 2 | 3 | |
| Partner marker missing (%) | 38 | 75 | 50 | |
| Dependent children marker (%) | 15 | 8 | 13 | |
| Dependent… missing (%) | 25 | 73 | 41 | |
| Lone parent marker set (%) | 11 | 6 | 9 | |
| Lone parent marker missing (%) | 29 | 84 | 47 | |
| SEN marker set (%) | 52 | 45 | 50 | |
| SEN marker missing (%) | 3 | 4 | 3 | |
| FSM marker set (%) | 51 | 52 | 51 | |
| FSM marker missing (%) | 3 | 4 | 3 | |
| Care leaver/adopted marker (%) | 6 | 11 | 8 | |
| Care leaver… missing (%) | 0 | 0 | 0 | |
| Child in need marker (%) | 13 | 24 | 17 | |
| Child in need missing (%) | 60 | 47 | 56 | |
| Exclusion marker (%) | 15 | 22 | 17 | |
| Exclusion marker missing (%) | 7 | 7 | 7 | |
| Permanent exclusion marker (%) | x | x | x | |
| Permanent … missing (%) | 7 | 7 | 7 | |
| Housing benefit marker (%) | 27 | 13 | 22 | |
| DLA/PIP marker set (%) | 14 | 19 | 15 | |
| DLA/PIP at start marker set (%) | 11 | 17 | 13 | |
| White ethnicity (%) | 85 | 89 | 87 | |
| Other ethnicity (%) | 15 | 11 | 13 | |
| Level 1 qualification (%) | 94 | 83 | 91 | |
| Level 2 qualification (%) | 81 | 66 | 76 | |
| Level 3 qualification (%) | 29 | 20 | 26 | |
| Level 4 qualification (%) | 5 | 5 | 5 | |
| Level 5 qualification (%) | 4 | 4 | 4 | |
| Level 6 qualification (%) | x | x | x | |
| Level 7 qualification (%) | x | x | x | |
| Level 8 qualification (%) | x | x | x | |
| NEET at start (%)* | 73 | 68 | 72 | |
| NEET and not receiving looking-for-work or inactivity benefits at start (%) | 7 | 17 | 10 | |
| Employed at start (%)** | 10 | 8 | 9 | |
| Looking for Work at start (%) | 70 | 54 | 65 | |
| Inactive at start (%) | 19 | 13 | 17 | |
| Other at start (%) | 9 | 30 | 15 | |
| Number of weeks Employed in the previous two years | 16 | 15 | 16 | |
| Number of weeks Looking for Work in the previous two years | 33 | 28 | 32 | |
| Number of weeks Inactive in the previous two years | 21 | 11 | 18 | |
| Number of weeks Other in the previous two years | 39 | 55 | 44 |
Note: Some figures which have been suppressed for disclosure control purposes are denoted by an x.
*NEET percentage is based on presence in certain administrative datasets and is not necessarily reflective of the results of Talent Match Plus referral assessments conducted by MYA. For example, education flags may show individuals are present in administrative data but may not reflect actual school attendance.
**Employment flags are generated for individuals present in administrative datasets but may not reflect current employment status for some individuals such as those on zero hour contracts with no earnings.
Table 8: Showing characteristics, benefits and employment information for the subsets of the evaluated participant group who started before and after 26 March 2018
Broken down into two groups: Pre-COVID and COVID impacted.
| Variable | Pre-COVID | COVID Impacted |
|---|---|---|
| Observations | 1238 | 1285 |
| Duration on the programme (mean days) | 356 | 258 |
| Age (mean years) | 22.4 | 21.7 |
| <18 years (%) | 0 | 0 |
| 18-24 years (%) | 73 | 79 |
| 25-30 years (%) | 27 | 21 |
| >30 years (%) | 0 | 0 |
| Male (%) | 60 | 57 |
| RATW at start marker set (%) | 24 | 19 |
| Partner marker set (%) | 5 | 3 |
| Partner marker missing (%) | 24 | 52 |
| Dependent children marker (%) | 16 | 14 |
| Dependent… missing (%) | 7 | 43 |
| Lone parent marker set (%) | 12 | 11 |
| Lone parent marker missing (%) | 10 | 47 |
| SEN marker set (%) | 52 | 52 |
| SEN marker missing (%) | 3 | 2 |
| FSM marker set (%) | 50 | 52 |
| FSM marker missing (%) | 3 | 2 |
| Care leaver/adopted marker (%) | 7 | 6 |
| Care leaver… missing (%) | 0 | 0 |
| Child in need marker (%) | 13 | 13 |
| Child in need missing (%) | 61 | 59 |
| Exclusion marker (%) | 15 | 15 |
| Exclusion marker missing (%) | 7 | 7 |
| Permanent exclusion marker (%) | x | x |
| Permanent … missing (%) | 7 | 7 |
| Housing benefit marker (%) | 31 | 23 |
| DLA/PIP marker set (%) | 13 | 14 |
| DLA/PIP at start marker set (%) | 11 | 11 |
| White ethnicity (%) | 82 | 89 |
| Other ethnicity (%) | 18 | 11 |
| Level 1 qualification (%) | 93 | 95 |
| Level 2 qualification (%) | 77 | 84 |
| Level 3 qualification (%) | 26 | 33 |
| Level 4 qualification (%) | 4 | 6 |
| Level 5 qualification (%) | 4 | 5 |
| Level 6 qualification (%) | x | x |
| Level 7 qualification (%) | x | x |
| Level 8 qualification (%) | x | x |
| NEET at start (%) | 76 | 71 |
| NEET and not receiving looking-for-work or inactivity benefits at start (%) | 8 | 5 |
| Employed at start (%) | 9 | 11 |
| Looking for Work at start (%) | 65 | 75 |
| Inactive at start (%) | 22 | 16 |
| Other at start (%) | 10 | 7 |
| Number of weeks Employed in the previous two years | 15 | 18 |
| Number of weeks Looking for Work in the previous two years | 34 | 33 |
| Number of weeks Inactive in the previous two years | 24 | 17 |
| Number of weeks Other in the previous two years | 36 | 41 |
Note: Some figures which have been suppressed for disclosure control purposes are denoted by an x.
Table 9: Showing characteristics, benefits and employment information for the subsets of the evaluated participant group who participated in each of the four regional labour market groups
Broken down into four groups: Group 1 (Liverpool), Group 2 (Wirral), Group 3 (Sefton and St Helens), and Group 4 (Halton and Knowsley).
| Variable | Group 1 | Group 2 | Group 3 | Group 4 |
|---|---|---|---|---|
| Observations | 867 | 484 | 579 | 584 |
| Duration on the programme (mean days) | 323 | 291 | 317 | 285 |
| Age (mean years) | 22 | 22 | 22.1 | 21.9 |
| <18 years (%) | 0 | 0 | 0 | 0 |
| 18-24 years (%) | 75 | 79 | 75 | 77 |
| 25-30 years (%) | 25 | 21 | 25 | 23 |
| >30 years (%) | 0 | 0 | 0 | 0 |
| Male (%) | 57 | 60 | 58 | 60 |
| RATW at start marker set (%) | 22 | 24 | 23 | 18 |
| Partner marker set (%) | 3 | 5 | 5 | 4 |
| Partner marker missing (%) | 40 | 33 | 36 | 42 |
| Dependent children marker (%) | 14 | 14 | 16 | 15 |
| Dependent… missing (%) | 21 | 28 | 25 | 31 |
| Lone parent marker set (%) | 10 | 10 | 12 | 11 |
| Lone parent marker missing (%) | 25 | 33 | 28 | 33 |
| SEN marker set (%) | 48 | 56 | 50 | 55 |
| SEN marker missing (%) | 4 | 2 | 2 | 2 |
| FSM marker set (%) | 49 | 51 | 46 | 58 |
| FSM marker missing (%) | 4 | 2 | 2 | 2 |
| Care leaver/adopted marker (%) | 6 | 7 | 8 | 5 |
| Care leaver… missing (%) | 0 | 0 | 0 | 0 |
| Child in need marker (%) | 11 | 15 | 14 | 14 |
| Child in need missing (%) | 65 | 56 | 63 | 54 |
| Exclusion marker (%) | 11 | 18 | 13 | 21 |
| Exclusion marker missing (%) | 10 | 5 | 7 | 5 |
| Permanent exclusion marker (%) | x | x | x | x |
| Permanent … missing (%) | 10 | 5 | 7 | 5 |
| Housing benefit marker (%) | 25 | 32 | 27 | 24 |
| DLA/PIP marker set (%) | 12 | 20 | 16 | 10 |
| DLA/PIP at start marker set (%) | 10 | 16 | 12 | 8 |
| White ethnicity (%) | 78 | 89 | 88 | 89 |
| Other ethnicity (%) | 22 | 11 | 12 | 11 |
| Level 1 qualification (%) | 91 | 98 | 94 | 95 |
| Level 2 qualification (%) | 81 | 84 | 79 | 80 |
| Level 3 qualification (%) | 32 | 35 | 26 | 25 |
| Level 4 qualification (%) | 6 | 6 | x | x |
| Level 5 qualification (%) | 5 | 6 | x | x |
| Level 6 qualification (%) | x | x | x | x |
| Level 7 qualification (%) | x | x | x | x |
| Level 8 qualification (%) | x | x | x | x |
| NEET at start (%) | 74 | 75 | 76 | 70 |
| NEET and not receiving looking-for-work or inactivity benefits at start (%) | 7 | 6 | 7 | 5 |
| Employed at start (%) | 11 | 9 | 7 | 12 |
| Looking for Work at start (%) | 68 | 69 | 70 | 74 |
| Inactive at start (%) | 19 | 21 | 21 | 16 |
| Other at start (%) | 10 | 7 | 9 | 8 |
| Number of weeks Employed in the previous two years | 18 | 15 | 13 | 20 |
| Number of weeks Looking for Work in the previous two years | 30 | 36 | 36 | 33 |
| Number of weeks Inactive in the previous two years | 20 | 22 | 23 | 18 |
| Number of weeks Other in the previous two years | 41 | 37 | 37 | 39 |
Note: Some figures which have been suppressed for disclosure control purposes are denoted by an x.
Appendix C: Matching the comparison group
The analysis in the report uses a technique called propensity score matching to construct a comparison group of individuals that are matched on key characteristics that are linked to a person’s participation in the Programme and the outcome variables of interest. More information about this technique and how it is used in the Data Lab can be found in the methodology report.
Before proceeding with the analysis, the Data Lab team assessed the plausibility of constructing a comparison group that satisfies the conditional independence assumption that underlies PSM (see methodology report for more details). The programme was targeted at individuals with characteristics that were largely well represented in the available data. Characteristics that were not well represented, e.g. offending and reoffending history, only accounted for small numbers of participants, according to data provided by MYA.
The comparison pool was selected from the Department for Education’s (DfE) administration data and was restricted to only include individuals who were in the same age range as the participants at the time of the programme start. This group was then randomly assigned a pseudo-start date (in lieu of an actual start date) in a way that matched the distribution of participant start dates. This group was then reduced further in a number of steps:
- Firstly, individuals who were known to have participated in other ESF programmes were excluded.
- The group was then restricted to geographic locations that were similar to, but excluded, the locations that the programme was delivered in. The selection of these locations was based on cluster analysis that used local labour market characteristics and indicators to group Local Authorities in Great Britain into 14 groups. See Appendix D for more information.
- The comparison pool was restricted further by stratified sampling that matched the distributions of the comparison and participant groups on their education and employment status at programme start/pseudo-start.
These steps resulted in a comparison pool of approximately 95,000 individuals who were then used in the matching process.
The matching estimator used to generate the impact estimates presented in this report was nearest neighbour matching using 100 nearest neighbours and a bandwidth of 0.01. Nearest neighbour matching involves running through each participant and matching them with the closest eligible individuals from the comparison pool, determined by closeness of the propensity scores. The sensitivity of the impact estimates to the choice of matching estimator was tested using a range of estimators and found to be insensitive. Further information about matching estimators can be found in the methodology document and literature review document.
Table 10 below shows a sample of the variables used in the matching process and the mean values of these variables both before and after matching. The table shows that before matching, the participant and comparison groups are not well matched, or balanced, as shown by sizeable differences in the mean values. After matching, the mean values of the participant and comparison groups are much closer. The percent bias and p-value columns provide information on how big the residual difference is and if this difference is statistically significant. Ideally one would like the percent biases to be small (below 5%) and there to be no statistically significant differences i.e., p-values above 0.05 (the 95% confidence level threshold). This is the case for all matching variables used in this analysis.
Table 11 also presents summary statistics that relate to how well matched the participant and comparison groups are for the main run. It shows values for Rubin’s B, Rubin’s R and the maximum and median percent biases, all of which meet commonly accepted thresholds for the selected approach (see the methodology report for more details). The table also shows there were only 2 participants (0.8%) who were off support (had no matched comparator). This is a sufficiently small percentage so as not to raise concerns about the representativeness of the results.
Table 10: Showing mean value of each control variable, for each group, before and after matching
The residual percent bias and p-value (after matching) are also shown.
| Variable | un-matched comparison group | un-matched participant group | matched comparison group | matched participant group | percent bias | p value |
|---|---|---|---|---|---|---|
| a_week_m1 | 8.5 | 9.7 | 10.5 | 9.7 | -2.8 | 0.34 |
| a_month_m_6 | 9.8 | 15.3 | 16.2 | 15.3 | -2.8 | 0.37 |
| a_start | 8.5 | 9.4 | 10.2 | 9.4 | -2.8 | 0.34 |
| a_month_m_12 | 13.4 | 21.6 | 22.6 | 21.6 | -2.7 | 0.38 |
| a_month_m_9 | 12 | 19.1 | 20.1 | 19.1 | -2.7 | 0.38 |
| a_month_m_3 | 8.9 | 12.2 | 13 | 12.2 | -2.7 | 0.38 |
| a_month_m_21 | 16.7 | 27.7 | 28.6 | 27.6 | -2.3 | 0.46 |
| a_month_m_24 | 17.4 | 28.5 | 29.3 | 28.4 | -2.2 | 0.48 |
| a_month_m_15 | 14.1 | 23.6 | 24.4 | 23.6 | -2.1 | 0.5 |
| a_month_m_18 | 14.8 | 25.4 | 26.1 | 25.3 | -1.8 | 0.56 |
| intervention_year | 2018.1 | 2018.0 | 2018.0 | 2018.0 | 1.8 | 0.53 |
| binary_uc_misshist | 0.8 | 2.2 | 2.3 | 2.1 | -1.5 | 0.66 |
| wp_start | x | x | x | x | -1.5 | 0.66 |
| c_month_m_3 | 6.9 | 12.7 | 13.1 | 12.7 | -1.4 | 0.66 |
| exclusion_pit | 17.7 | 15.3 | 14.8 | 15.3 | 1.4 | 0.61 |
| f_sex | 52.9 | 58.3 | 57.7 | 58.4 | 1.4 | 0.62 |
| o_month_m_21 | 35.9 | 49.4 | 50.1 | 49.4 | -1.4 | 0.64 |
| missing_level_1_start | 0.1 | 0.3 | 0.2 | 0.3 | 1.3 | 0.68 |
| c_month_m_9 | 10 | 18.3 | 18.8 | 18.3 | -1.3 | 0.67 |
| sen_pit | 40.6 | 51.7 | 51.1 | 51.7 | 1.3 | 0.65 |
| c_month_m_24 | 13.5 | 22.9 | 23.4 | 22.9 | -1.3 | 0.68 |
| o_month_m_15 | 31.9 | 44.3 | 44.8 | 44.2 | -1.2 | 0.67 |
| o_month_m_12 | 29.9 | 40.9 | 41.5 | 40.9 | -1.2 | 0.67 |
| f_dfe_ethnicity_white | 70 | 85.2 | 84.7 | 85.2 | 1.2 | 0.62 |
| c_month_m_6 | 8.6 | 15.6 | 16 | 15.6 | -1.2 | 0.7 |
| level_3_start | 30.1 | 29.4 | 29.9 | 29.4 | -1.2 | 0.67 |
| c_start | 5.2 | 9.7 | 10 | 9.7 | -1.2 | 0.71 |
| f_age | 23.6 | 22 | 22 | 22 | 1.2 | 0.67 |
| c_week_m1 | 5.4 | 9.9 | 10.2 | 9.9 | -1.2 | 0.72 |
| missing_sen_pit | 1.9 | 2.6 | 2.4 | 2.6 | 1.1 | 0.7 |
| missing_fsm_pit | 1.9 | 2.6 | 2.4 | 2.6 | 1.1 | 0.7 |
| f_dfe_ethnicity_other | 26.8 | 13.6 | 14.1 | 13.6 | -1.1 | 0.64 |
| c_month_m_12 | 10.8 | 19.1 | 19.5 | 19.1 | -1.1 | 0.72 |
| binary_esahist | 20.7 | 19.3 | 18.8 | 19.3 | 1.1 | 0.69 |
| o_month_m_9 | 27.1 | 36.3 | 36.8 | 36.3 | -1.1 | 0.71 |
| h_month_m_3 | 4 | 1 | 1.2 | 1 | -1.1 | 0.57 |
| c_month_m_21 | 12.7 | 21.6 | 22 | 21.6 | -1.1 | 0.73 |
| o_month_m_18 | 34.1 | 47.7 | 48.1 | 47.6 | -1 | 0.73 |
| c_month_m_18 | 11.5 | 19.7 | 20 | 19.7 | -1 | 0.75 |
| c_month_m_15 | 11.2 | 19.6 | 20 | 19.6 | -1 | 0.75 |
| f_age_sq | 566.4 | 494.9 | 493.5 | 495 | 1 | 0.72 |
| h_week_m1 | 3.9 | x | x | x | -1 | 0.55 |
| h_start | 3.9 | x | x | x | -1 | 0.56 |
| l_month_m_12 | 24.9 | 26.7 | 26.4 | 26.8 | 0.9 | 0.76 |
| h_month_m_6 | 4.2 | 1.4 | 1.6 | 1.4 | -0.9 | 0.68 |
| o_month_m_24 | 37.8 | 51.9 | 52.3 | 51.9 | -0.8 | 0.77 |
| o_month_m_3 | 18.4 | 23.6 | 23.9 | 23.6 | -0.8 | 0.79 |
| missing_cin_flag | 63.1 | 60 | 60.4 | 60 | -0.8 | 0.78 |
| level_2_start | 75.5 | 80.8 | 81.1 | 80.8 | -0.7 | 0.78 |
| h_month_m_12 | 5 | 2.5 | 2.6 | 2.5 | -0.7 | 0.76 |
| o_start | 8.3 | 8.7 | 8.4 | 8.6 | 0.7 | 0.8 |
| h_month_m_9 | 4.7 | 2.1 | 2.2 | 2.1 | -0.7 | 0.75 |
| fsm_pit | 38.3 | 50.9 | 51.2 | 50.8 | -0.7 | 0.81 |
| binary_ishist | 15.3 | 11.2 | 11.4 | 11.2 | -0.7 | 0.8 |
| i_month_m_15 | 25.3 | 20.2 | 19.9 | 20.2 | 0.7 | 0.8 |
| cluster13 | 20.3 | 23.3 | 23.6 | 23.3 | -0.7 | 0.82 |
| i_month_m_21 | 24.4 | 19.5 | 19.2 | 19.5 | 0.7 | 0.81 |
| i_month_m_24 | 24 | 18.8 | 18.5 | 18.8 | 0.6 | 0.81 |
| l_month_m_21 | 17.1 | 18.3 | 18.1 | 18.3 | 0.6 | 0.83 |
| binary_uc_ltoowhist | 5.4 | 3.9 | 4 | 3.9 | -0.5 | 0.83 |
| i_month_m_12 | 25.5 | 20.5 | 20.2 | 20.5 | 0.5 | 0.84 |
| l_month_m_9 | 29.6 | 32.1 | 31.9 | 32.1 | 0.5 | 0.85 |
| missing_exclusion_pit | 9.3 | 7.2 | 7.3 | 7.2 | -0.5 | 0.84 |
| missing_permanent_pit | 9.3 | 7.2 | 7.3 | 7.2 | -0.5 | 0.84 |
| f_children | 26.6 | 14.9 | 15.1 | 14.9 | -0.5 | 0.83 |
| f_partner | 9.7 | 3.9 | 4 | 3.9 | -0.5 | 0.81 |
| int_start | 3.3 | 4 | 4.1 | 4 | -0.5 | 0.86 |
| level_m1_start | 4.3 | 3.3 | 3.2 | 3.3 | 0.5 | 0.84 |
| i_month_m_18 | 24.9 | 19.8 | 19.6 | 19.8 | 0.5 | 0.85 |
| binary_jsahist | 27.1 | 25.3 | 25.1 | 25.3 | 0.5 | 0.86 |
| l_month_m_24 | 15.7 | 17.1 | 16.9 | 17.1 | 0.5 | 0.86 |
| h_month_m_15 | 5 | 2.9 | 3 | 2.9 | -0.5 | 0.84 |
| w_month_m_21 | 26.3 | 16.1 | 15.9 | 16.1 | 0.5 | 0.85 |
| o_month_m_6 | 23.3 | 30.3 | 30.5 | 30.3 | -0.5 | 0.87 |
| i_month_m_6 | 25.4 | 19.9 | 19.7 | 19.9 | 0.5 | 0.86 |
| binary_cbhist | 22.2 | 13.1 | 13.3 | 13.1 | -0.5 | 0.86 |
| f_loneparent | 16.7 | 11.1 | 11.2 | 11.1 | -0.4 | 0.86 |
| w_month_m_15 | 26.1 | 16.9 | 16.8 | 16.9 | 0.4 | 0.86 |
| f_miss_children | 23.2 | 25.4 | 25.2 | 25.4 | 0.4 | 0.88 |
| o_week_m1 | 9.7 | 9.3 | 9.2 | 9.3 | 0.4 | 0.88 |
| dlapip_start | 11.4 | 11 | 10.9 | 11 | 0.4 | 0.88 |
| i_month_m_3 | 24.9 | 19.3 | 19.2 | 19.3 | 0.4 | 0.88 |
| cluster2 | 33.9 | 34.3 | 34.1 | 34.3 | 0.4 | 0.89 |
| cin_flag | 10.6 | 13.3 | 13.4 | 13.3 | -0.4 | 0.9 |
| binary_uc_wfihist | 2.4 | 2.2 | 2.2 | 2.2 | -0.4 | 0.89 |
| i_month_m_9 | 25.6 | 20 | 19.8 | 20 | 0.4 | 0.89 |
| l_month_m_15 | 21.4 | 23.2 | 23 | 23.2 | 0.4 | 0.9 |
| f_miss_partner | 35.9 | 38.1 | 38 | 38.2 | 0.4 | 0.9 |
| l_month_m_18 | 18.9 | 20.1 | 20 | 20.2 | 0.3 | 0.9 |
| l_start | 65.2 | 70.1 | 70.3 | 70.2 | -0.3 | 0.9 |
| binary_emphist | 50.8 | 42.1 | 41.9 | 42.1 | 0.3 | 0.9 |
| w_month_m_3 | 17.6 | 13.3 | 13.1 | 13.2 | 0.3 | 0.9 |
| f_dfe_ethnicity_black | 3.2 | 1.2 | 1.3 | 1.2 | -0.3 | 0.88 |
| i_week_m1 | 24 | 18.9 | 19 | 18.9 | -0.3 | 0.91 |
| wp_hist | x | x | x | x | 0.3 | 0.92 |
| cla_flag | 5.4 | 6.4 | 6.5 | 6.5 | -0.3 | 0.92 |
| w_week_m1 | 10.1 | 10.2 | 10.1 | 10.2 | 0.3 | 0.91 |
| l_month_m_3 | 46.1 | 50 | 49.9 | 50 | 0.3 | 0.91 |
| binary_wtchist | 7.5 | 3.3 | 3.4 | 3.3 | -0.3 | 0.9 |
| binary_uc_eehist | 10.7 | 7.8 | 7.7 | 7.8 | 0.2 | 0.92 |
| i_start | 24 | 19.2 | 19.3 | 19.2 | -0.2 | 0.93 |
| f_miss_loneparent | 26 | 28.8 | 28.7 | 28.8 | 0.2 | 0.94 |
| cluster7 | 20 | 19.5 | 19.4 | 19.5 | 0.2 | 0.94 |
| snc_hst_flg | 14.5 | 16.8 | 16.7 | 16.8 | 0.2 | 0.94 |
| h_month_m_21 | 5.1 | 3.4 | 3.4 | 3.4 | -0.2 | 0.94 |
| binary_dlapiphist | 13.3 | 13.9 | 13.8 | 13.9 | 0.2 | 0.94 |
| w_month_m_9 | 23.4 | 16.2 | 16.1 | 16.2 | 0.2 | 0.94 |
| int_hist | 2.1 | 3.8 | 3.8 | 3.8 | -0.2 | 0.95 |
| binary_uc_wprephist | 2.1 | 1.4 | 1.4 | 1.4 | -0.2 | 0.95 |
| level_5_start | 7.2 | 4.4 | 4.4 | 4.4 | -0.2 | 0.95 |
| f_ratw_start | 20 | 19.1 | 19 | 19.1 | 0.1 | 0.96 |
| level_7_start | 1 | x | x | x | -0.1 | 0.95 |
| level_6_start | 6.1 | 3.7 | 3.7 | 3.7 | 0.1 | 0.96 |
| level_4_start | 8.2 | 5 | 5.1 | 5 | -0.1 | 0.96 |
| binary_uc_iwshist | 51.3 | 59.8 | 59.8 | 59.7 | -0.1 | 0.96 |
| level_8_start | x | x | x | x | -0.1 | 0.96 |
| w_month_m_6 | 21.4 | 15.2 | 15.2 | 15.2 | 0.1 | 0.97 |
| binary_uc_ltiwhist | 7.8 | 5.3 | 5.3 | 5.3 | 0.1 | 0.97 |
| w_start | 9.4 | 10.1 | 10.1 | 10.1 | 0.1 | 0.97 |
| level_1_start | 90.8 | 94.1 | 94.1 | 94.1 | 0.1 | 0.97 |
| binary_sahist | 2.2 | 1.5 | 1.5 | 1.5 | 0.1 | 0.98 |
| binary_icahist | 5 | 4.5 | 4.5 | 4.5 | 0.1 | 0.98 |
| w_month_m_24 | 26 | 15.6 | 15.6 | 15.6 | 0.1 | 0.98 |
| binary_hbhist | 35.1 | 26.9 | 26.9 | 26.9 | -0.1 | 0.98 |
| w_month_m_12 | 24.9 | 16.3 | 16.2 | 16.3 | 0.1 | 0.98 |
| binary_ctchist | 20.2 | 11.2 | 11.2 | 11.2 | -0.1 | 0.98 |
| h_month_m_18 | 5 | 3.2 | 3.3 | 3.2 | -0.1 | 0.98 |
| h_month_m_24 | 5.2 | 3.1 | 3.1 | 3.1 | -0.1 | 0.98 |
| w_month_m_18 | 26.3 | 16.2 | 16.3 | 16.2 | -0.1 | 0.98 |
| intervention_month | 6 | 6 | 6 | 6 | 0 | 1 |
| l_month_m_6 | 36.2 | 40.5 | 40.5 | 40.5 | 0 | 1 |
| l_week_m1 | 63 | 69.7 | 69.8 | 69.8 | 0 | 1 |
| level_0_start | 93.5 | 95.4 | 95.4 | 95.4 | 0 | 1 |
| cluster10 | 25.8 | 22.9 | 22.9 | 22.9 | 0 | 1 |
| binary_bbhist | x | x | x | x | 0 | 1 |
| binary_bsphist | x | x | x | x | 0 | 1 |
| binary_ibhist | x | x | x | x | 0 | 1 |
| binary_pibhist | x | x | x | x | 0 | 1 |
| binary_sdahist | x | x | x | x | 0 | 1 |
| binary_wbhist | x | x | x | x | 0 | 1 |
| permanent_pit | x | x | x | x | 0 | 1 |
| uasc_flag | x | x | x | x | 0 | 1 |
| missing_cla_flag | x | x | x | x | 0 | 1 |
Notes: Some figures which have been suppressed for disclosure control purposes are denoted by an x. The definition of the matching variables can be found in the methodology document.
Table 11: PSM summary statistics used to assess the success of the matching for the main analytical run
All the metrics fall within the commonly accepted thresholds, see the methodology report for more details.
| Summary statistics | |
|---|---|
| Matching estimator | 100 Nearest Neighbours |
| bandwidth/calliper | 0.01 |
| Rubin’s B | 8.24 |
| Rubin’s R | 0.93 |
| Max % bias | 2.83% |
| Median % bias | 0.52% |
| Number on support | 2,526 |
| Number off support | 2 |
| Percent off support | 0.08% |
Appendix D: Regional cluster analysis
For all of the analysis presented in this report the comparison pool was selected from outside the regions where the programme was implemented. As discussed in the methodology report, care must be taken when doing this as local factors such as the availability of employment and public transport, levels of disadvantage, etc. all have an impact on the likelihood of someone finding and maintaining employment.
This analysis took advantage of cluster analysis carried out within DWP that groups the Local Authorities of Great Britain into 14 groups based on a range of variables about key features of the local labour market. These include local employment rates, unemployment-related benefit caseload, qualification levels, variables related to mental and physical health / disability characteristics of the local population.
This cluster information was used as a way of selecting the comparison pool from “similar” regions of Great Britain, and as a control variable in the propensity score matching. The cluster information was also used in the regional sub analysis to group the local authorities in which the programme was delivered.
As part of the quality assurance processes the analysis was re-run using a comparison pool selected from within the regions in which the programme was delivered, which produced similar results.
Appendix E: Tables of results
Table 12: Showing the full list of generated results for the main run featuring all participants aged 18 or over who started the programme on or before 1 April 2020
| Outcome measure | Participant group | Comparison group | Impact central | Impact lower | Impact upper | p-value |
|---|---|---|---|---|---|---|
| no. weeks at 1 year - employed | 11.3 | 11.9 | -0.6 | -1.3 | 0.1 | 0.10 |
| no. weeks at 1 year – looking for work | 31.0 | 26.8 | 4.2 | 3.4 | 5.1 | 0.00 |
| no. weeks at 1 year - inactive | 11.2 | 12.4 | -1.2 | -2.0 | -0.4 | 0.00 |
| no. weeks at 1 year - other | 4.5 | 6.2 | -1.7 | -2.2 | -1.2 | 0.00 |
| no. weeks at 2 years - employed | 27.6 | 27.7 | -0.1 | -1.5 | 1.3 | 0.87 |
| no. weeks at 2 years - looking for work | 56.0 | 46.8 | 9.2 | 7.5 | 10.8 | 0.00 |
| no. weeks at 2 years – inactive | 24.3 | 27.0 | -2.6 | -4.2 | -1.1 | 0.00 |
| no. weeks at 2 years - other | 9.2 | 12.7 | -3.5 | -4.4 | -2.6 | 0.00 |
| % employed during 1 year | 41.9 | 40.9 | 1.0 | -1.0 | 3.0 | 0.31 |
| % employed during 2 years | 55.1 | 51.6 | 3.5 | 1.5 | 5.5 | 0.00 |
| % at 1 year - employed | 26.7 | 27.2 | -0.5 | -2.3 | 1.3 | 0.58 |
| % at 2 years -employed | 33.4 | 32.4 | 1.0 | -0.9 | 2.9 | 0.30 |
| % at 1 year - looking for work | 52.3 | 41.7 | 10.6 | 8.6 | 12.6 | 0.00 |
| % at 2 years - looking for work | 44.5 | 35.2 | 9.2 | 7.2 | 11.2 | 0.00 |
| % at 1 year - inactive | 22.8 | 26.2 | -3.4 | -5.1 | -1.7 | 0.00 |
| % at 2 years -inactive | 27.1 | 29.8 | -2.7 | -4.5 | -0.9 | 0.00 |
| % at 1 year - other | 9.7 | 13.5 | -3.9 | -5.1 | -2.7 | 0.00 |
| % at 2 years - other | 8.8 | 12.0 | -3.2 | -4.3 | -2.0 | 0.00 |
| % passed any course during 1 year | 27.0 | 13.4 | 13.6 | 11.8 | 15.4 | 0.00 |
| % passed any course during 2 years | 37.4 | 19.7 | 17.7 | 15.8 | 19.6 | 0.00 |
| % passed at least 1 entry level course during 1 year | 6.0 | 3.3 | 2.7 | 1.7 | 3.6 | 0.00 |
| % passed at least 1 level 1 course during 1 year | 18.6 | 6.5 | 12.1 | 10.6 | 13.7 | 0.00 |
| % passed at least 1 level 2 course during 1 year | 10.5 | 5.2 | 5.2 | 4.0 | 6.4 | 0.00 |
| % passed at least 1 level 3 course during 1 year | x | X | -1.5 | -1.9 | -1.2 | 0.00 |
| % passed at least 1 level 4 course during 1 year | x | x | 0.0 | -0.1 | 0.0 | 0.41 |
| % passed at least 1 level 5 course during 1 year | x | x | 0.0 | -0.1 | 0.0 | 0.36 |
| % passed at least 1 level 6 course during 1 year | x | x | -0.1 | -0.2 | 0.0 | 0.01 |
| % passed at least 1 level 7 course during 1 year | x | x | 0.0 | -0.1 | 0.0 | 0.01 |
| % passed at least 1 level 8 course during 1 year | x | x | 0.0 | 0.0 | 0.0 | . |
| % passed at least 1 entry level course during 2 years | 8.9 | 4.8 | 4.1 | 3.0 | 5.2 | 0.00 |
| % passed at least 1 level 1 course during 2 years | 25.7 | 9.9 | 15.7 | 14.0 | 17.5 | 0.00 |
| % passed at least 1 level 2 course during 2 years | 17.1 | 8.9 | 8.2 | 6.7 | 9.7 | 0.00 |
| % passed at least 1 level 3 course during 2 years | x | x | -1.5 | -2.1 | -0.9 | 0.00 |
| % passed at least 1 level 4 course during 2 years | x | x | -0.1 | -0.3 | 0.0 | 0.02 |
| % passed at least 1 level 5 course during 2 years | x | x | 0.0 | -0.2 | 0.1 | 0.55 |
| % passed at least 1 level 6 course during 2 years | x | x | -0.3 | -0.4 | -0.1 | 0.00 |
| % passed at least 1 level 7 course during 2 years | x | x | 0.0 | -0.1 | 0.2 | 0.70 |
| % passed at least 1 level 8 course during 2 years | x | x | 0.0 | 0.0 | 0.0 | 0.77 |
| % in education during 1 year | 35.8 | 24.8 | 11.0 | 9.1 | 12.9 | 0.00 |
| % in education during 2 years | 43.2 | 29.4 | 13.8 | 11.8 | 15.8 | 0.00 |
| % in education at 3 months | 21.1 | 17.4 | 3.7 | 2.1 | 5.4 | 0.00 |
| % in education at 6 months | 19.4 | 15.5 | 3.9 | 2.4 | 5.5 | 0.00 |
| % in education at 9 months | 16.9 | 14.4 | 2.4 | 0.9 | 3.9 | 0.00 |
| % in education at 12 months | 14.7 | 12.9 | 1.8 | 0.4 | 3.2 | 0.01 |
| % in education at 15 months | 13.0 | 12.0 | 1.0 | -0.3 | 2.3 | 0.15 |
| % in education at 18 months | 11.4 | 10.5 | 0.9 | -0.3 | 2.2 | 0.15 |
| % in education at 21 months | 10.6 | 9.9 | 0.8 | -0.5 | 2.0 | 0.22 |
| % in education at 24 months | 9.3 | 9.6 | -0.3 | -1.4 | 0.9 | 0.67 |
| % neet at 3 months | 64.4 | 66.5 | -2.1 | -4.0 | -0.2 | 0.03 |
| % neet at 6 months | 62.4 | 64.9 | -2.5 | -4.5 | -0.6 | 0.01 |
| % neet at 9 months | 62.0 | 64.0 | -2.0 | -4.0 | -0.1 | 0.04 |
| % neet at 12 months | 62.7 | 64.2 | -1.5 | -3.5 | 0.4 | 0.12 |
| % work (start) to work (1 yr) | 6.2 | 7.1 | -1.0 | -1.9 | 0.0 | 0.05 |
| % work (start) to education (1 yr) | 1.7 | 1.3 | 0.4 | -0.1 | 0.9 | 0.16 |
| % work (start) to NEET (1 yr) | 3.3 | 2.6 | 0.7 | 0.0 | 1.4 | 0.04 |
| % education (start) to work (1 yr) | 5.8 | 5.8 | 0.0 | -0.9 | 0.9 | 1.00 |
| % education (start) to education (1 yr) | 5.5 | 7.1 | -1.7 | -2.6 | -0.8 | 0.00 |
| % education (start) to NEET (1 yr) | 9.1 | 7.8 | 1.4 | 0.2 | 2.5 | 0.02 |
| % NEET (start) to work (1 yr) | 15.8 | 15.6 | 0.2 | -1.3 | 1.7 | 0.81 |
| % NEET (start) to education (1 yr) | 8.3 | 5.2 | 3.1 | 2.0 | 4.2 | 0.00 |
| % NEET (start) to NEET (1 yr) | 51.1 | 54.2 | -3.1 | -5.1 | -1.1 | 0.00 |
| %employed (start) to employed (2yr) | 6.3 | 6.9 | -0.6 | -1.6 | 0.4 | 0.25 |
| %employed (start) to looking for work (2yr) | 3.6 | 2.8 | 0.9 | 0.1 | 1.6 | 0.02 |
| %employed (start) to inactive (2yr) | 1.5 | 1.5 | 0.0 | -0.5 | 0.5 | 0.95 |
| %employed (start) to other (2yr) | x | x | 0.0 | -0.3 | 0.4 | 0.93 |
| %looking for work (start) to employed (2yr) | 25.4 | 24.8 | 0.6 | -1.1 | 2.4 | 0.50 |
| %looking for work (start) to looking for work (2yr) | 37.7 | 31.9 | 5.9 | 3.9 | 7.8 | 0.00 |
| %looking for work (start) to inactive (2yr) | 12.5 | 14.5 | -2.0 | -3.3 | -0.6 | 0.00 |
| %looking for work (start) to other (2yr) | 5.1 | 6.9 | -1.8 | -2.7 | -0.9 | 0.00 |
| %inactive (start) to employed (2yr) | 4.0 | 2.8 | 1.2 | 0.4 | 2.0 | 0.00 |
| %inactive (start) to looking for work (2yr) | 3.4 | 2.2 | 1.2 | 0.5 | 1.9 | 0.00 |
| %inactive (start) to inactive (2yr) | 13.2 | 14.7 | -1.5 | -2.8 | -0.1 | 0.04 |
| %inactive (start) to other (2yr) | x | x | -0.2 | -0.5 | 0.2 | 0.38 |
| %other (start) to employed (2yr) | 2.5 | 3.0 | -0.5 | -1.1 | 0.2 | 0.14 |
| %other (start) to looking for work (2yr) | 2.9 | 1.1 | 1.8 | 1.1 | 2.4 | 0.00 |
| %other (start) to inactive (2yr) | x | x | 0.6 | 0.2 | 1.0 | 0.01 |
| %other (start) to other (2yr) | 2.5 | 3.9 | -1.4 | -2.0 | -0.8 | 0.00 |
| % at 1 year in work only | 15.4 | 18.6 | -3.2 | -4.7 | -1.8 | 0.00 |
| % at 2 years in work only | 19.8 | 23.1 | -3.3 | -4.9 | -1.7 | 0.00 |
| % at 1 year in looking for work only | 42.4 | 34.4 | 8.0 | 6.0 | 10.0 | 0.00 |
| % at 2 years in looking for work only | 33.2 | 27.8 | 5.3 | 3.4 | 7.2 | 0.00 |
| % at 1 year in inactive only | 21.1 | 24.7 | -3.6 | -5.3 | -2.0 | 0.00 |
| % at 2 years in inactive only | 24.6 | 27.8 | -3.1 | -4.9 | -1.4 | 0.00 |
| % at 1 year in other | 9.7 | 13.5 | -3.9 | -5.1 | -2.7 | 0.00 |
| % at 2 years in other | 8.8 | 12.0 | -3.2 | -4.3 | -2.0 | 0.00 |
| % at 1 year in looking for work & work | 9.7 | 7.2 | 2.6 | 1.4 | 3.8 | 0.00 |
| % at 2 years in looking for work & work | 11.2 | 7.3 | 3.9 | 2.6 | 5.2 | 0.00 |
| % at 1 year in inactive and work | 1.6 | 1.4 | 0.2 | -0.3 | 0.7 | 0.48 |
| % at 2 years in inactive and work | 2.4 | 2.0 | 0.4 | -0.2 | 1.0 | 0.18 |
| % at 1 year in looking for work & inactive | x | x | 0.0 | -0.1 | 0.2 | 0.55 |
| % at 2 years in looking for work & inactive | x | x | 0.0 | -0.1 | 0.0 | 0.41 |
| % on a DWP intervention within 2 years of start | 31.0 | 20.5 | 10.5 | 8.7 | 12.4 | 0.00 |
Note: Some figures which have been suppressed for disclosure control purposes are denoted by an x.
Table 13: Showing a list of generated results for the Pre-COVID group who started before 26 March 2018
This table lists only the key labour market and education outcomes
| Outcome measure | Participant group | Comparison group | Impact: central | Impact: lower | Impact: upper | p-value |
|---|---|---|---|---|---|---|
| % employed during 1 year | 41.2 | 41.6 | -0.4 | -3.3 | 2.4 | 0.77 |
| % employed during 2 years | 53.6 | 52.0 | 1.6 | -1.3 | 4.5 | 0.28 |
| % at 1 year - employed | 27.1 | 28.2 | -1.1 | -3.7 | 1.5 | 0.41 |
| % at 2 years -employed | 32.9 | 32.5 | 0.3 | -2.4 | 3.1 | 0.81 |
| % at 1 year - looking for work | 45.7 | 36.5 | 9.2 | 6.4 | 12.1 | 0.00 |
| % at 2 years - looking for work | 39.7 | 30.5 | 9.2 | 6.4 | 12.0 | 0.00 |
| % at 1 year - inactive | 24.7 | 26.4 | -1.7 | -4.2 | 0.8 | 0.19 |
| % at 2 years -inactive | 27.2 | 28.9 | -1.6 | -4.2 | 1.0 | 0.22 |
| % at 1 year - other | 12.1 | 16.6 | -4.5 | -6.4 | -2.6 | 0.00 |
| % at 2 years - other | 11.8 | 15.2 | -3.4 | -5.3 | -1.5 | 0.00 |
| % passed any course during 1 year | 27.5 | 13.8 | 13.7 | 11.1 | 16.2 | 0.00 |
| % passed any course during 2 years | 39.3 | 21.5 | 17.8 | 15.0 | 20.6 | 0.00 |
| % in education during 1 year | 35.8 | 24.0 | 11.8 | 9.1 | 14.6 | 0.00 |
| % in education during 2 years | 43.9 | 29.1 | 14.8 | 11.9 | 17.6 | 0.00 |
| % at 1 year in work only | 17.7 | 20.6 | -2.9 | -5.2 | -0.7 | 0.01 |
| % at 2 years in work only | 21.3 | 25.6 | -4.2 | -6.6 | -1.8 | 0.00 |
| % at 1 year in looking for work only | 37.2 | 30.2 | 7.1 | 4.3 | 9.9 | 0.00 |
| % at 2 years in looking for work only | 30.2 | 25.1 | 5.1 | 2.5 | 7.8 | 0.00 |
| % at 1 year in inactive only | 23.3 | 24.8 | -1.6 | -4.0 | 0.9 | 0.21 |
| % at 2 years in inactive only | 25.1 | 27.1 | -2.0 | -4.5 | 0.5 | 0.12 |
| % at 1 year in other | 12.1 | 16.6 | -4.5 | -6.4 | -2.6 | 0.00 |
| % at 2 years in other | 11.8 | 15.2 | -3.4 | -5.3 | -1.5 | 0.00 |
| % at 1 year in looking for work & work | 8.2 | 6.2 | 2.1 | 0.5 | 3.7 | 0.01 |
| % at 2 years in looking for work & work | 9.5 | 5.3 | 4.1 | 2.5 | 5.8 | 0.00 |
| % at 1 year in inactive and work | x | x | -0.2 | -0.9 | 0.4 | 0.46 |
| % at 2 years in inactive and work | x | x | 0.5 | -0.4 | 1.3 | 0.29 |
| % at 1 year in looking for work & inactive | x | x | 0.1 | -0.2 | 0.4 | 0.44 |
| % at 2 years in looking for work & inactive | x | x | -0.1 | -0.1 | 0.0 | 0.00 |
| % on a DWP intervention within 2 years of start | 22.1 | 14.4 | 7.7 | 5.3 | 10.0 | 0.00 |
Note: Some figures which have been suppressed for disclosure control purposes are denoted by an x.
Table 14: Showing a list of generated results for the COVID impacted group who started on or after 26 March 2018 and on or before 1 April 2020
This table lists only the key labour market and education outcomes.
| Outcome measure | Participant group | Comparison group | Impact: central | Impact: lower | Impact: upper | p-value |
|---|---|---|---|---|---|---|
| % employed during 1 year | 42.6 | 39.6 | 3.0 | 0.2 | 5.8 | 0.04 |
| % employed during 2 years | 56.7 | 50.7 | 6.0 | 3.2 | 8.9 | 0.00 |
| % at 1 year - employed | 26.4 | 25.9 | 0.5 | -2.0 | 3.0 | 0.71 |
| % at 2 years -employed | 33.9 | 31.6 | 2.3 | -0.3 | 5.0 | 0.09 |
| % at 1 year - looking for work | 58.6 | 47.0 | 11.6 | 8.8 | 14.4 | 0.00 |
| % at 2 years - looking for work | 49.1 | 40.7 | 8.4 | 5.5 | 11.2 | 0.00 |
| % at 1 year - inactive | 21.0 | 26.5 | -5.5 | -7.8 | -3.2 | 0.00 |
| % at 2 years -inactive | 26.8 | 31.0 | -4.2 | -6.7 | -1.6 | 0.00 |
| % at 1 year - other | 7.2 | 10.0 | -2.8 | -4.2 | -1.3 | 0.00 |
| % at 2 years - other | 5.9 | 8.6 | -2.6 | -4.0 | -1.3 | 0.00 |
| % passed any course during 1 year | 26.4 | 12.7 | 13.6 | 11.2 | 16.1 | 0.00 |
| % passed any course during 2 years | 35.4 | 17.8 | 17.6 | 14.9 | 20.2 | 0.00 |
| % in education during 1 year | 35.9 | 25.2 | 10.7 | 8.0 | 13.3 | 0.00 |
| % in education during 2 years | 42.6 | 29.5 | 13.2 | 10.4 | 15.9 | 0.00 |
| % at 1 year in work only | 13.2 | 16.5 | -3.3 | -5.2 | -1.4 | 0.00 |
| % at 2 years in work only | 18.3 | 19.8 | -1.5 | -3.7 | 0.7 | 0.18 |
| % at 1 year in looking for work only | 47.3 | 39.0 | 8.3 | 5.5 | 11.1 | 0.00 |
| % at 2 years in looking for work only | 36.0 | 31.1 | 5.0 | 2.3 | 7.7 | 0.00 |
| % at 1 year in inactive only | 19.0 | 25.0 | -6.0 | -8.3 | -3.8 | 0.00 |
| % at 2 years in inactive only | 24.0 | 28.7 | -4.7 | -7.1 | -2.2 | 0.00 |
| % at 1 year in other | 7.2 | 10.0 | -2.8 | -4.2 | -1.3 | 0.00 |
| % at 2 years in other | 5.9 | 8.6 | -2.6 | -4.0 | -1.3 | 0.00 |
| % at 1 year in looking for work & work | 11.2 | 7.9 | 3.3 | 1.5 | 5.1 | 0.00 |
| % at 2 years in looking for work & work | 12.9 | 9.6 | 3.3 | 1.4 | 5.2 | 0.00 |
| % at 1 year in inactive and work | x | x | 0.5 | -0.3 | 1.3 | 0.20 |
| % at 2 years in inactive and work | 2.7 | 2.2 | 0.5 | -0.4 | 1.4 | 0.27 |
| % at 1 year in looking for work & inactive | x | x | 0.0 | -0.1 | 0.2 | 0.74 |
| % at 2 years in looking for work & inactive | x | x | 0.0 | -0.2 | 0.2 | 1.00 |
| % on a DWP intervention within 2 years of start | 39.6 | 26.7 | 12.9 | 10.1 | 15.6 | 0.00 |
Note: Some figures which have been suppressed for disclosure control purposes are denoted by an x.
Table 15: Showing a list of generated results for evaluated participants in regional labour market group 1 (Liverpool)
This table lists only the key labour market and education outcomes.
| Outcome measure | Participant group | Comparison group | Impact: central | Impact: lower | Impact: upper | p-value |
|---|---|---|---|---|---|---|
| % employed during 1 year | 44.2 | 41.6 | 2.6 | -0.9 | 6.0 | 0.14 |
| % employed during 2 years | 58.1 | 51.6 | 6.5 | 3.1 | 10.0 | 0.00 |
| % at 1 year – employed | 28.5 | 27.8 | 0.6 | -2.5 | 3.8 | 0.69 |
| % at 2 years -employed | 38.3 | 32.9 | 5.4 | 2.0 | 8.8 | 0.00 |
| % at 1 year – looking for work | 49.4 | 40.0 | 9.3 | 5.9 | 12.8 | 0.00 |
| % at 2 years – looking for work | 42.9 | 34.7 | 8.2 | 4.8 | 11.7 | 0.00 |
| % at 1 year – inactive | 21.7 | 25.6 | -3.9 | -6.8 | -1.0 | 0.01 |
| % at 2 years -inactive | 25.0 | 28.6 | -3.6 | -6.6 | -0.6 | 0.02 |
| % at 1 year – other | 10.6 | 14.4 | -3.8 | -5.9 | -1.6 | 0.00 |
| % at 2 years – other | 9.0 | 12.9 | -3.9 | -5.9 | -1.9 | 0.00 |
| % passed any course during 1 year | 24.8 | 13.4 | 11.4 | 8.5 | 14.4 | 0.00 |
| % passed any course during 2 years | 36.4 | 19.7 | 16.7 | 13.4 | 20.0 | 0.00 |
| % in education during 1 year | 33.3 | 25.0 | 8.3 | 5.1 | 11.6 | 0.00 |
| % in education during 2 years | 40.8 | 29.7 | 11.1 | 7.7 | 14.5 | 0.00 |
| % at 1 year in work only | 18.6 | 20.1 | -1.6 | -4.3 | 1.2 | 0.26 |
| % at 2 years in work only | 23.1 | 23.9 | -0.8 | -3.8 | 2.1 | 0.58 |
| % at 1 year in looking for work only | 40.8 | 33.4 | 7.4 | 4.0 | 10.8 | 0.00 |
| % at 2 years in looking for work only | 30.0 | 27.5 | 2.4 | -0.7 | 5.6 | 0.13 |
| % at 1 year in inactive only | 19.8 | 24.2 | -4.4 | -7.2 | -1.6 | 0.00 |
| % at 2 years in inactive only | 22.7 | 26.6 | -3.8 | -6.8 | -0.9 | 0.01 |
| % at 1 year in other | 10.6 | 14.4 | -3.8 | -5.9 | -1.6 | 0.00 |
| % at 2 years in other | 9.0 | 12.9 | -3.9 | -5.9 | -1.9 | 0.00 |
| % at 1 year in looking for work & work | 8.3 | 6.5 | 1.8 | -0.1 | 3.7 | 0.07 |
| % at 2 years in looking for work & work | 12.9 | 7.0 | 5.9 | 3.6 | 8.2 | 0.00 |
| % at 1 year in inactive and work | x | x | 0.4 | -0.5 | 1.3 | 0.36 |
| % at 2 years in inactive and work | x | x | 0.3 | -0.7 | 1.4 | 0.52 |
| % at 1 year in looking for work & inactive | x | x | 0.1 | -0.2 | 0.5 | 0.43 |
| % at 2 years in looking for work & inactive | x | x | -0.1 | -0.2 | 0.0 | 0.00 |
| % on a DWP intervention within 2 years of start | 30.1 | 19.0 | 11.1 | 8.0 | 14.3 | 0.00 |
Note: Some figures which have been suppressed for disclosure control purposes are denoted by an x.
Table 16: Showing a list of generated results for evaluated participants in regional labour market group 2 (Wirral)
This table lists only the key labour market and education outcomes.
| Outcome measure | Participant group | Comparison group | Impact: central | Impact: lower | Impact: upper | p-value |
|---|---|---|---|---|---|---|
| % employed during 1 year | 39.5 | 39.2 | 0.2 | -4.4 | 4.8 | 0.92 |
| % employed during 2 years | 53.3 | 50.1 | 3.2 | -1.5 | 7.9 | 0.18 |
| % at 1 year - employed | 24.6 | 26.2 | -1.6 | -5.7 | 2.4 | 0.43 |
| % at 2 years -employed | 32.4 | 32.4 | 0.1 | -4.3 | 4.5 | 0.97 |
| % at 1 year - looking for work | 53.3 | 40.0 | 13.3 | 8.6 | 18.0 | 0.00 |
| % at 2 years - looking for work | 44.8 | 32.9 | 11.9 | 7.3 | 16.6 | 0.00 |
| % at 1 year - inactive | 25.0 | 29.8 | -4.8 | -8.9 | -0.7 | 0.02 |
| % at 2 years -inactive | 28.5 | 33.5 | -5.0 | -9.3 | -0.7 | 0.02 |
| % at 1 year - other | 8.5 | 12.4 | -3.9 | -6.6 | -1.2 | 0.00 |
| % at 2 years - other | 9.7 | 10.8 | -1.1 | -3.9 | 1.7 | 0.44 |
| % passed any course during 1 year | 25.2 | 12.1 | 13.1 | 9.1 | 17.1 | 0.00 |
| % passed any course during 2 years | 35.5 | 18.3 | 17.2 | 12.8 | 21.7 | 0.00 |
| % in education during 1 year | 35.3 | 22.2 | 13.1 | 8.7 | 17.5 | 0.00 |
| % in education during 2 years | 43.8 | 27.0 | 16.9 | 12.2 | 21.5 | 0.00 |
| % at 1 year in work only | 13.2 | 17.9 | -4.7 | -7.9 | -1.4 | 0.00 |
| % at 2 years in work only | 16.9 | 22.9 | -5.9 | -9.5 | -2.4 | 0.00 |
| % at 1 year in looking for work only | 43.6 | 33.1 | 10.5 | 5.9 | 15.1 | 0.00 |
| % at 2 years in looking for work only | 32.6 | 25.4 | 7.3 | 2.9 | 11.7 | 0.00 |
| % at 1 year in inactive only | 23.3 | 28.2 | -4.8 | -8.9 | -0.8 | 0.02 |
| % at 2 years in inactive only | 25.2 | 31.3 | -6.1 | -10.2 | -2.0 | 0.00 |
| % at 1 year in other | 8.5 | 12.4 | -3.9 | -6.6 | -1.2 | 0.00 |
| % at 2 years in other | 9.7 | 10.8 | -1.1 | -3.9 | 1.7 | 0.44 |
| % at 1 year in looking for work & work | 9.7 | 6.8 | 2.9 | 0.2 | 5.7 | 0.04 |
| % at 2 years in looking for work & work | 12.2 | 7.4 | 4.8 | 1.8 | 7.8 | 0.00 |
| % at 1 year in inactive and work | x | x | 0.1 | -1.1 | 1.3 | 0.86 |
| % at 2 years in inactive and work | x | x | 1.2 | -0.4 | 2.9 | 0.14 |
| % at 1 year in looking for work & inactive | x | x | -0.1 | -0.2 | 0.0 | 0.01 |
| % at 2 years in looking for work & inactive | x | x | -0.1 | -0.2 | -0.1 | 0.00 |
| % on a DWP intervention within 2 years of start | 33.7 | 20.6 | 13.0 | 8.7 | 17.4 | 0.00 |
Note: Some figures which have been suppressed for disclosure control purposes are denoted by an x.
Table 17: Showing a list of generated results for evaluated participants in regional labour market group 3 (Sefton and St Helens)
This table lists only the key labour market and education outcomes.
| Outcome measure | Participant group | Comparison group | Impact: central | Impact: lower | Impact: upper | p-value |
|---|---|---|---|---|---|---|
| % employed during 1 year | 34.7 | 37.2 | -2.5 | -6.5 | 1.5 | 0.22 |
| % employed during 2 years | 50.1 | 48.8 | 1.3 | -2.9 | 5.5 | 0.54 |
| % at 1 year - employed | 20.6 | 25.0 | -4.4 | -7.9 | -1.0 | 0.01 |
| % at 2 years -employed | 29.5 | 30.2 | -0.7 | -4.5 | 3.2 | 0.74 |
| % at 1 year - looking for work | 55.3 | 42.7 | 12.6 | 8.4 | 16.8 | 0.00 |
| % at 2 years - looking for work | 46.8 | 35.7 | 11.1 | 6.9 | 15.2 | 0.00 |
| % at 1 year - inactive | 23.3 | 27.4 | -4.1 | -7.6 | -0.5 | 0.03 |
| % at 2 years -inactive | 28.5 | 30.7 | -2.2 | -6.1 | 1.6 | 0.25 |
| % at 1 year - other | 10.7 | 13.4 | -2.7 | -5.3 | -0.1 | 0.04 |
| % at 2 years - other | 8.1 | 11.8 | -3.7 | -6.0 | -1.3 | 0.00 |
| % passed any course during 1 year | 29.0 | 13.4 | 15.6 | 11.8 | 19.3 | 0.00 |
| % passed any course during 2 years | 39.4 | 19.5 | 19.9 | 15.9 | 24.0 | 0.00 |
| % in education during 1 year | 39.7 | 24.7 | 15.1 | 11.0 | 19.1 | 0.00 |
| % in education during 2 years | 46.8 | 29.7 | 17.1 | 13.0 | 21.3 | 0.00 |
| % at 1 year in work only | 11.1 | 16.7 | -5.6 | -8.3 | -3.0 | 0.00 |
| % at 2 years in work only | 16.8 | 21.8 | -5.0 | -8.2 | -1.9 | 0.00 |
| % at 1 year in looking for work only | 46.6 | 35.7 | 10.9 | 6.7 | 15.1 | 0.00 |
| % at 2 years in looking for work only | 36.3 | 29.2 | 7.0 | 3.0 | 11.1 | 0.00 |
| % at 1 year in inactive only | 21.8 | 25.8 | -4.1 | -7.6 | -0.6 | 0.02 |
| % at 2 years in inactive only | 26.1 | 28.7 | -2.6 | -6.3 | 1.1 | 0.17 |
| % at 1 year in other | 10.7 | 13.4 | -2.7 | -5.3 | -0.1 | 0.04 |
| % at 2 years in other | 8.1 | 11.8 | -3.7 | -6.0 | -1.3 | 0.00 |
| % at 1 year in looking for work & work | 8.3 | 6.9 | 1.4 | -0.9 | 3.7 | 0.22 |
| % at 2 years in looking for work & work | 10.4 | 6.4 | 3.9 | 1.4 | 6.5 | 0.00 |
| % at 1 year in inactive and work | x | x | -0.2 | -1.2 | 0.7 | 0.61 |
| % at 2 years in inactive and work | x | x | 0.4 | -0.8 | 1.7 | 0.50 |
| % at 1 year in looking for work & inactive | x | x | 0.2 | -0.3 | 0.7 | 0.34 |
| % at 2 years in looking for work & inactive | x | x | -0.1 | -0.1 | 0.0 | 0.00 |
| % on a DWP intervention within 2 years of start | 27.5 | 21.9 | 5.5 | 1.8 | 9.3 | 0.00 |
Note: Some figures which have been suppressed for disclosure control purposes are denoted by an x.
Table 18: Showing a list of generated results for evaluated participants in regional labour market group 4 (Halton and Knowsley)
This table lists only the key labour market and education outcomes.
| Outcome measure | Participant group | Comparison group | Impact: central | Impact: lower | Impact: upper | p-value |
|---|---|---|---|---|---|---|
| % employed during 1 year | 47.4 | 44.4 | 3.0 | -1.2 | 7.2 | 0.17 |
| % employed during 2 years | 57.2 | 55.0 | 2.2 | -2.0 | 6.4 | 0.31 |
| % at 1 year - employed | 32.2 | 29.1 | 3.1 | -0.9 | 7.0 | 0.13 |
| % at 2 years -employed | 31.2 | 33.5 | -2.4 | -6.3 | 1.6 | 0.24 |
| % at 1 year - looking for work | 52.7 | 43.2 | 9.6 | 5.3 | 13.8 | 0.00 |
| % at 2 years - looking for work | 44.0 | 37.1 | 6.9 | 2.7 | 11.1 | 0.00 |
| % at 1 year - inactive | 22.4 | 24.6 | -2.1 | -5.7 | 1.4 | 0.24 |
| % at 2 years -inactive | 27.2 | 28.5 | -1.3 | -5.1 | 2.5 | 0.49 |
| % at 1 year - other | 7.9 | 13.0 | -5.1 | -7.5 | -2.8 | 0.00 |
| % at 2 years - other | 8.6 | 11.4 | -2.8 | -5.2 | -0.5 | 0.02 |
| % passed any course during 1 year | 29.6 | 14.0 | 15.6 | 11.8 | 19.4 | 0.00 |
| % passed any course during 2 years | 38.5 | 20.5 | 18.1 | 14.0 | 22.1 | 0.00 |
| % in education during 1 year | 36.1 | 25.3 | 10.8 | 6.8 | 14.8 | 0.00 |
| % in education during 2 years | 43.0 | 29.6 | 13.4 | 9.3 | 17.6 | 0.00 |
| % at 1 year in work only | 17.0 | 19.3 | -2.4 | -5.5 | 0.8 | 0.15 |
| % at 2 years in work only | 20.4 | 23.0 | -2.6 | -6.0 | 0.8 | 0.13 |
| % at 1 year in looking for work only | 39.4 | 34.9 | 4.5 | 0.4 | 8.7 | 0.03 |
| % at 2 years in looking for work only | 34.9 | 28.5 | 6.5 | 2.4 | 10.5 | 0.00 |
| % at 1 year in inactive only | 20.5 | 22.9 | -2.4 | -5.8 | 1.1 | 0.18 |
| % at 2 years in inactive only | 25.2 | 26.5 | -1.4 | -5.1 | 2.3 | 0.47 |
| % at 1 year in other | 7.9 | 13.0 | -5.1 | -7.5 | -2.8 | 0.00 |
| % at 2 years in other | 8.6 | 11.4 | -2.8 | -5.2 | -0.5 | 0.02 |
| % at 1 year in looking for work & work | 13.4 | 8.3 | 5.1 | 2.3 | 7.9 | 0.00 |
| % at 2 years in looking for work & work | 8.9 | 8.6 | 0.3 | -2.1 | 2.7 | 0.78 |
| % at 1 year in inactive and work | x | x | 0.3 | -0.8 | 1.5 | 0.60 |
| % at 2 years in inactive and work | x | x | -0.1 | -1.2 | 1.1 | 0.89 |
| % at 1 year in looking for work & inactive | x | x | -0.1 | -0.1 | 0.0 | 0.09 |
| % at 2 years in looking for work & inactive | x | x | 0.1 | -0.2 | 0.5 | 0.43 |
| % on a DWP intervention within 2 years of start | 33.6 | 20.7 | 12.9 | 8.9 | 16.8 | 0.00 |
Note: Some figures which have been suppressed for disclosure control purposes are denoted by an x.
Appendix F: COVID-19 and regional subgroup outcomes plots
Figure 5: Plots showing the percentage of participants and comparators in the four labour market categories over time
The solid lines show the participant group, and the dotted lines show the comparison group. The dark blue lines show the ‘Employed’ category, the dark orange lines show the ‘Looking for work’ category, the light blue lines show the ‘Inactive’ category, and the light orange lines show the ‘Other’ category.
5(a) – Shows the labour market outcomes of the Pre-COVID starters in the participant and comparison groups.
5(b) – Shows the labour market outcomes of the COVID impacted starters in the participant and comparison groups.
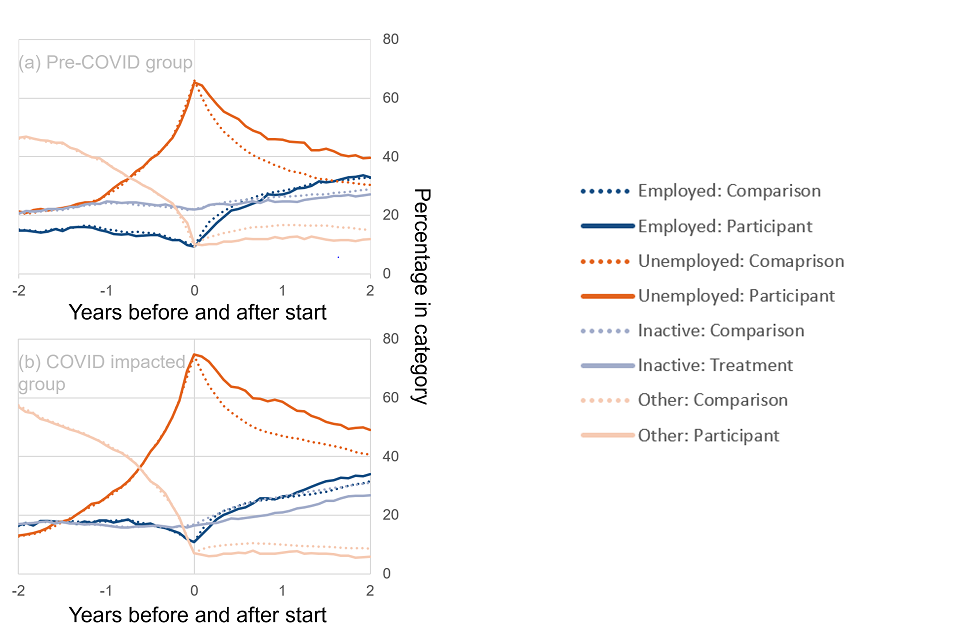
Figure 6: Plots showing the percentage of participants and comparators in the four labour market categories over time
The solid lines show the participant group, and the dotted lines show the comparison group. The dark blue lines show the ‘Employed’ category, the dark orange lines show the ‘Looking for work’ category, the light blue lines show the ‘Inactive’ category, and the light orange lines show the ‘Other’ category.
6(a) – Shows the labour market outcomes of the participants and comparisons group in regional labour market group 1 (Liverpool).
6(b) – Shows the labour market outcomes of the participants and comparisons group in regional labour market group 2 (Wirral).
6(c) – Shows the labour market outcomes of the participants and comparisons group in regional labour market group 3 (Sefton and St. Helens).
6(d) – Shows the labour market outcomes of the participants and comparisons group in regional labour market group 4 (Halton and Knowsley).
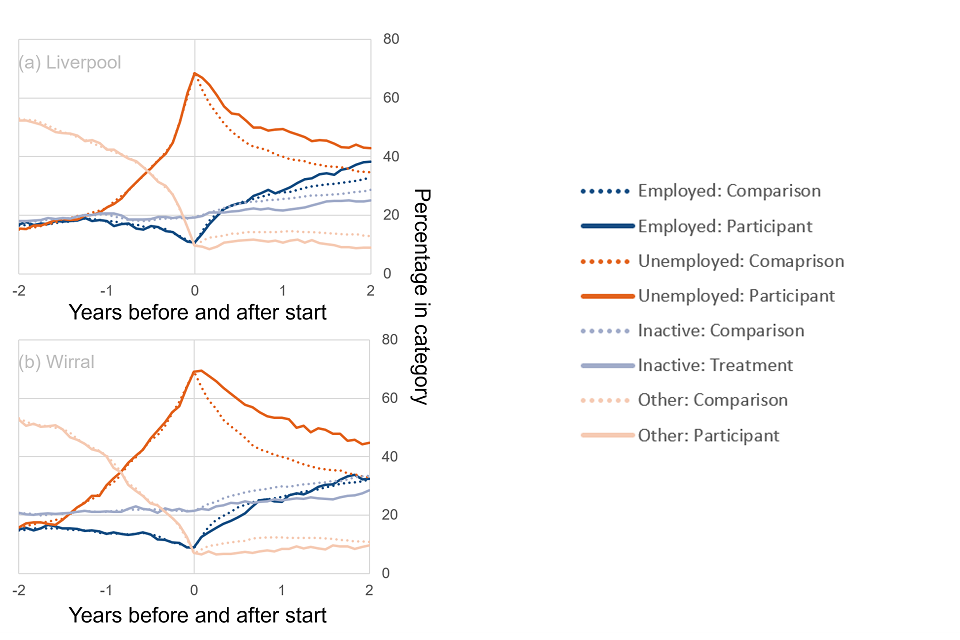
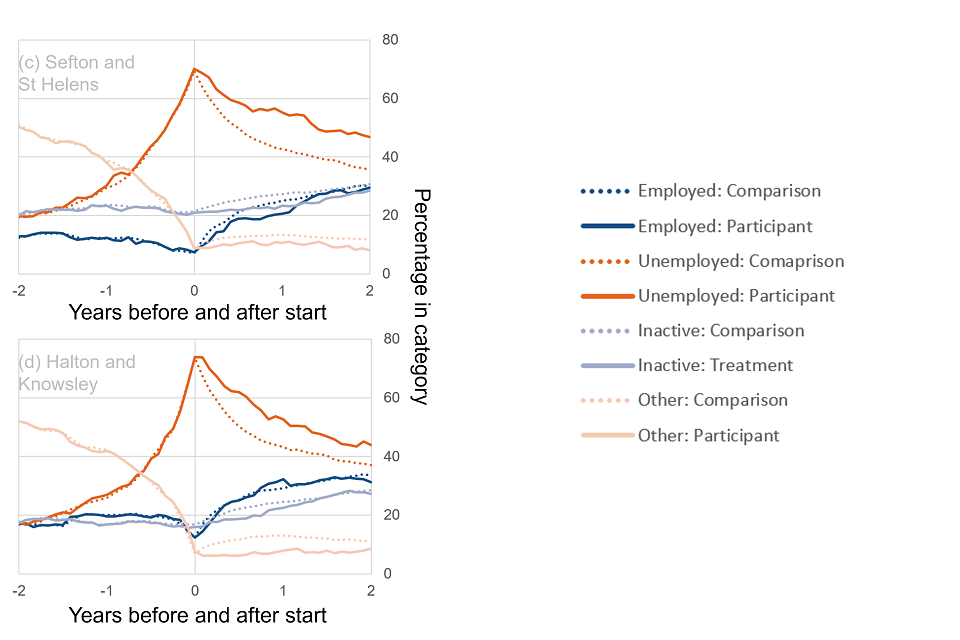
Appendix G: Glossary of terms
| Term | Definition |
|---|---|
| Common support/On Support/Off support | Once propensity scores have been assigned for each observation, the overlap of propensity scores between the participants and comparison group is called ‘common support’. Those who fall in the overlap are referred to as ‘on support’, those who do not fall into the overlap are ‘off support’. |
| Comparison group | Carefully selected subset of the comparison pool, selected to have outcomes as similar as possible, to act as a counterfactual. |
| DfE | Department For Education |
| DLA | Disability Living Allowance |
| DWP | The Department for Work and Pensions |
| ESA | Employment and Support Allowance |
| ESF | European Social Fund |
| FSM | Free School Meals |
| JSA | Jobseeker’s Allowance |
| NEET | Not in Employment, Education or Training |
| Participant group | The people who took part in the programme being evaluated. |
| PIP | Personal Independence Payment |
| Programme | The employment support provision under investigation. |
| Pseudo-start date | Dates assigned to the comparison pool in lieu of the real programme start dates of the participant group. |
| PSM | Propensity Score Matching |
| Quasi-Experimental | An experimental technique that looks to establish a cause-and-effect relationship between two variables, where the assignment to the participant or comparison group is not random. |
| Rubin’s B & R | A test used to evaluate the matching in PSM. |
| SEN | Special Educational Needs |
| Statistically significant | Describes a result where the likelihood of observing that result by chance, where there is no genuine underlying difference, is less than a set threshold. In the Data Lab reports, this is set at 5%. |
| UC | Universal Credit |
| User Organisation | The organisation using the employment data lab service. |