Days with 'Moderate' or higher air pollution
Updated 30 April 2024
Accredited Official Statistics
Air quality statistics in the UK, 1987 to 2023 - Days with ‘Moderate’ or higher air pollution
Updated 30 April 2024
1. Why quantify days of ‘Moderate’ or higher pollution?
Categorising ambient measured concentrations of pollutants into different bands related to their impacts to health helps inform the public about general exposure to air pollution. This is done because estimating the impact to health of numerical values taken directly from monitoring measurements is not intuitive.
Categorisation of concentrations of air pollutants in the UK is done according to the Daily Air Quality Index Index (DAQI), which was developed following advice from the Committee on Medical Effects of Air Pollutants (COMEAP). This index, numbered 1-10, standardises the measured values of different pollutants by categorising them into 4 bands (‘Low’, ‘Moderate’, ‘High’, and ‘Very High’). The DAQI provides information about the health risk of different levels of pollutants in a simple and comparable format, and is similar to the sun index or pollen index used in weather forecasts.
2. Days with ‘Moderate’ or higher air pollution
2.1 All pollutants combined
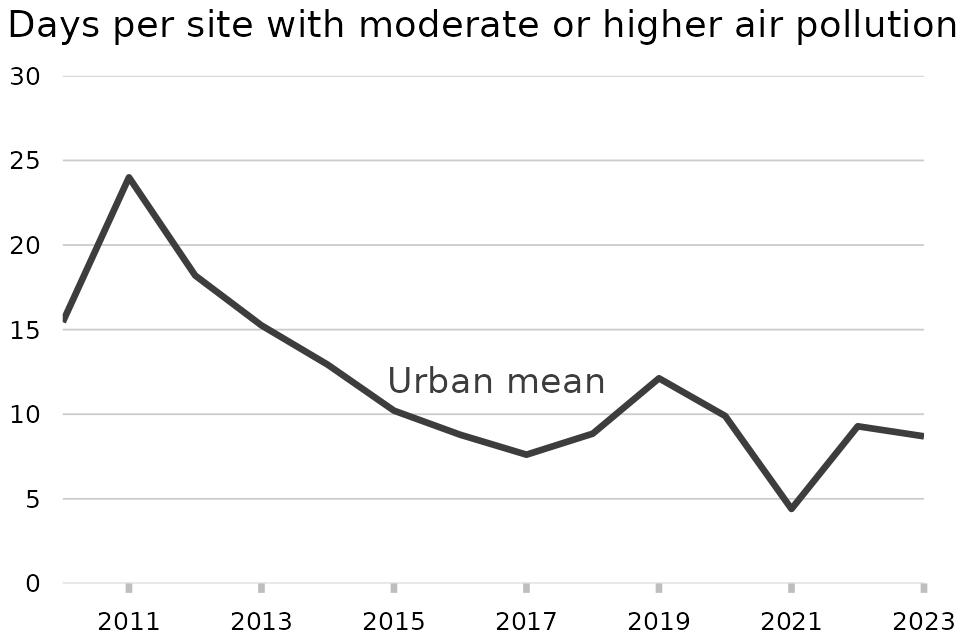
Figure 17: Mean number of days per urban site when air pollution was ‘Moderate’ or higher in the UK, 2010 to 2023

Notes:
-
Where more than one pollutant exceeds the ‘Moderate’ threshold on any given day this counts as 1 day in this graph, regardless of number of pollutants exceeding on that particular day.
-
In order to be included in the ‘urban mean’, urban monitoring sites must measure PM10.
Download the data for this chart in CSV format
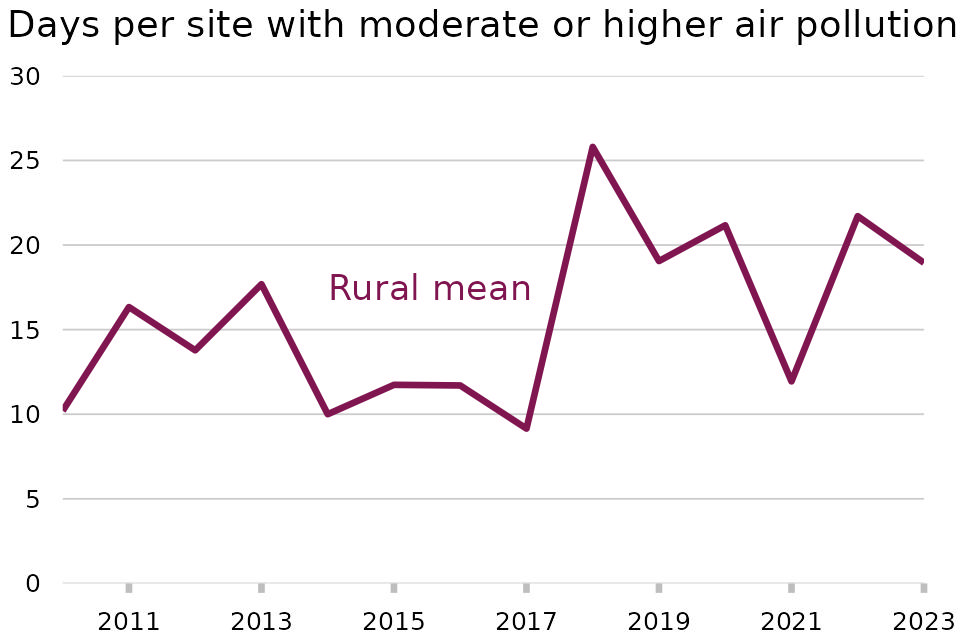
Figure 18: Mean number of days per rural site when air pollution was ‘Moderate’ or higher in the UK, 2010 to 2023

Notes:
-
Where more than one pollutant exceeds the ‘Moderate’ threshold on any given day this counts as 1 day in this graph, regardless of number of pollutants exceeding on that particular day.
-
In order to be included in the ‘rural mean’, rural monitoring sites must measure ozone.
Download the data for this chart in CSV format
Trends in the number of days of moderate or higher air pollution vary between urban and rural sites. Before 2015 urban sites on average experienced more days of ‘Moderate’ or higher pollution than rural sites due to PM2.5 and PM10 pollution. Since 2015 the mean number of days of ‘Moderate’ or higher pollution has been higher at rural sites than urban sites predominantly due to ozone pollution, which is typically higher in rural areas.
Between 2011 and 2017, there was a year-on-year decrease in the average number of days of ‘Moderate’ or higher pollution at urban monitoring sites. The mean number of days of ‘Moderate’ or higher pollution increased from 8 days in 2017 to 12 days in 2019. This was followed by a decrease to 4 days in 2021, the lowest in the times series. The mean number of days of ‘Moderate’ or higher pollution increased to 9 days for urban sites in 2022 and remained at that level for 2023.
Between 2017 and 2018 there was a notable rise in the average number of days of ‘Moderate’ or higher pollution at rural monitoring sites. The average number of days increased from 9 days in 2017 to 26 days in 2018. This was largely driven by a rise in ozone pollution between 2017 and 2018, which was more pronounced at rural monitoring sites than urban monitoring sites (see Figure 18 and 19). Since reaching the highest value in the time series in 2018, the number of days of ‘Moderate’ or higher air pollution has remained comparatively high but shows no clear trend.
2.2 Urban sites
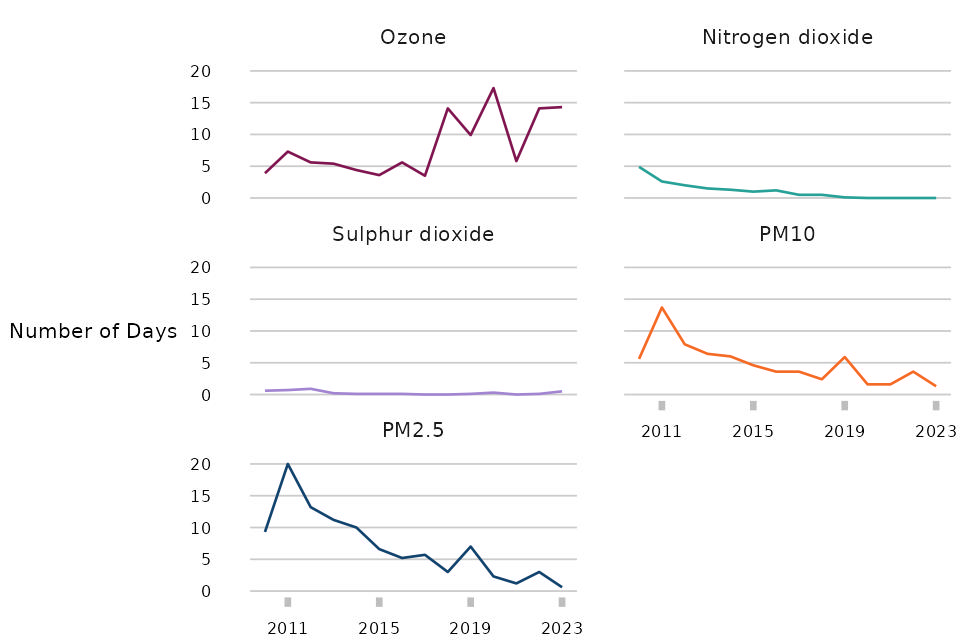
Figure 19: Average number of days when levels of ozone, particulate matter, nitrogen dioxide and sulphur dioxide were ‘Moderate’ or higher at urban sites in the UK, 2010 to 2023

Note:
- In order to be included, urban monitoring sites must measure PM10.
Download the data for this chart in CSV format
In 2023, PM2.5 caused on average less than 1 day of ‘Moderate’ or higher pollution and PM10 caused 1 day. At urban sites the average number of days above the ‘Moderate’ threshold generally decreased year-on-year for both PM2.5 and PM10 since peaks in 2011. 2023 had the fewest days with ‘Moderate’ or higher PM10 and PM2.5 pollution in the time series.
The decreasing trend for both PM2.5 and PM10 was notably interrupted in 2019. Meteorological analysis indicated that two UK-wide particulate pollution episodes occurred in February and April of 2019. Both of these events were likely caused by a combination of warm, sunny weather resulting in increased local and foreign particulate suspension along with light, easterly winds transporting a substantial amount of particulate matter from Europe. It is probable that these events contributed to the relatively high number of hours of particulate matter pollution observed in 2019 - see Air Pollution in the UK 2019
Ozone caused on average 14 days of ‘Moderate’ or higher pollution in 2023. Prior to 2017 the trend was fairly flat. However, between 2017 and 2018 there was a large increase in ‘Moderate’ or higher air pollution days attributable to ozone pollution between (from 4 to 14 days per site). Since 2018, the average number of days of ozone pollution at urban sites has remained high and in 2020 this metric was the highest in the time series (17 days per site). This recent trend is probably due to the prolonged hot and sunny conditions in the spring and summer of 2018, 2019, 2020, 2022, and 2023. In 2020, reductions in NOx concentrations in urban environments as a result of COVID-19 restrictions were probably also a large contributing factor to increased ozone pollution since less nitrogen oxide (NO) will have been available to react with ozone.
Nitrogen dioxide has caused on average 0 days of ‘Moderate’ or higher pollution in urban areas during 2023. This represents a decline since 2010 which had 5 days per site of ‘Moderate’ or higher nitrogen dioxide pollution.
Sulphur dioxide caused on average less than 1 day of ‘Moderate’ or higher pollution in 2023. This reflects the large reductions in emissions since the early 1990s, following stricter limits being placed on the sulphur content of liquid fuels and a transition away from coal use in power stations.
2.3 Rural sites
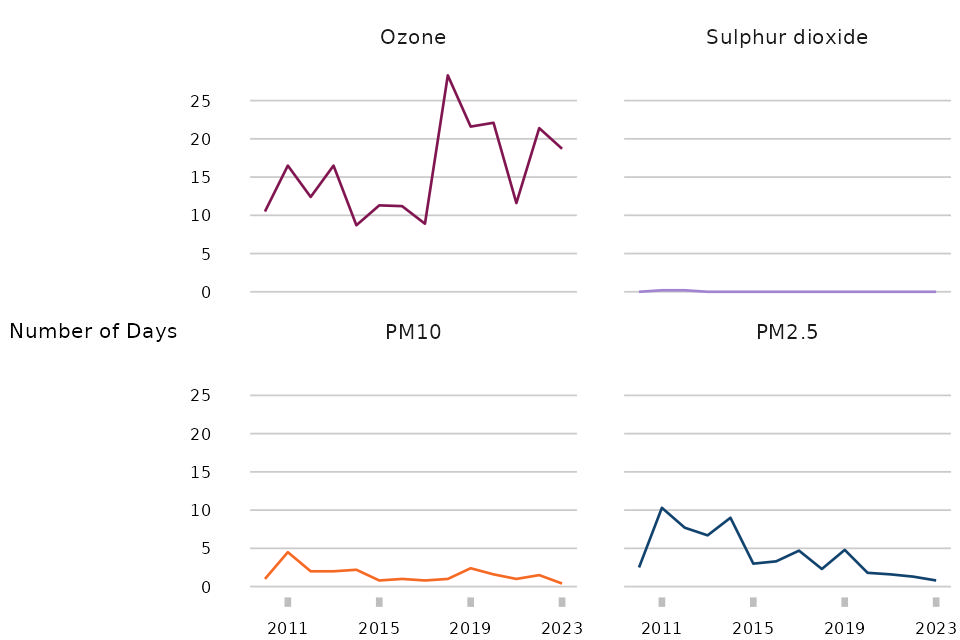
Figure 20: Average number of days when levels of ozone, particulate matter, and sulphur dioxide were ‘Moderate’ or higher at rural sites in the UK, 2010 to 2023

Notes:
-
In order to be included, rural monitoring sites must measure ozone.
-
There were no days when levels of nitrogen dioxide were ‘Moderate’ or higher at rural sites in the UK between 2010 and 2023, hence data for this pollutant are not shown.
Download the data for this chart in CSV format
Across the time series, ozone has been the main cause of ‘Moderate’ or higher pollution days at rural sites. The number of days of ozone pollution has remained high since 2018 after a substantial increase from 9 days in 2017 to 28 days in 2018, the highest in the time series. This recent trend could be in part due to the prolonged hot and sunny conditions in spring and summer of most years since 2018.
PM10, PM2.5 and ozone caused all of the ‘Moderate’ or higher pollution days at rural sites in recent years, either separately or in combination with each other. Levels of these pollutants are particularly influenced by weather, which contributes to the variability over time.
Sulphur dioxide did not directly contribute to the ‘Moderate’ or higher pollution days at rural sites, with no recorded days of ‘Moderate’ or higher pollution attributed to these sources at any of the rural monitoring sites since 2013.
3. Sections in this release
Background to concentrations of air pollutants
Concentrations of nitrogen dioxide
