Particulate matter (PM10/PM2.5)
Updated 30 April 2024

© Crown copyright 2024
This publication is licensed under the terms of the Open Government Licence v3.0 except where otherwise stated. To view this licence, visit nationalarchives.gov.uk/doc/open-government-licence/version/3 or write to the Information Policy Team, The National Archives, Kew, London TW9 4DU, or email: psi@nationalarchives.gov.uk.
Where we have identified any third party copyright information you will need to obtain permission from the copyright holders concerned.
This publication is available at https://www.gov.uk/government/statistics/air-quality-statistics/concentrations-of-particulate-matter-pm10-and-pm25
Accredited Official Statistics
Air quality statistics in the UK, 1987 to 2023 - Particulate matter (PM10/PM2.5)
Updated 30 April 2024
1. Why measure PM?
Particulate matter (PM) is everything in the air that is not a gas. It consists of a huge variety of chemical compounds and materials, some of which can be toxic. Due to the small size of many of the particles that form PM some of these toxins may enter the bloodstream and be transported around the body, lodging in the heart, brain and other organs. Therefore, exposure to PM can result in serious impacts to health, especially in vulnerable groups of people such as the young, elderly, and those with respiratory problems. As a result, particulates are classified according to size. The UK is currently focused on measuring the fractions of PM where particles are less than 10 micrometres in diameter (PM10) and less than 2.5 micrometres in diameter (PM2.5) based on the latest evidence on the effects of PM to health.
Fine PM (PM2.5) and the precursor pollutants (that can form secondary PM) can travel large distances in the atmosphere. A proportion of the concentrations of PM that people in the UK are exposed to come from naturally occurring sources such as pollen and sea spray and some is transported to the UK from other European countries or international shipping. However, around half of UK concentrations of PM comes from anthropogenic sources in the UK such as domestic wood burning and tyre and brake wear from vehicles. As such, it is in the interest of the UK to measure concentrations of PM in a range of locations that are both typical of population exposure and that have a greater influence from sources originating from human activity. This approach enables us to assess both exposure to PM and understand contributions from key sources that can be tackled via UK policies.
The Air Quality Standards Regulations (2010) require that concentrations of PM in the UK must not exceed:
-
An annual average of 40 µg/m3 for PM10;
-
A 24-hour average of 50 µg/m3 more than 35 times in a single year for PM10;
-
An annual average of 20 µg/m3 for PM2.5.
The Environmental Targets (Fine Particulate Matter) (England) Regulations (2023) require that in England by the end of 2040:
-
An annual average of 10 µg/m3 for PM2.5 is not exceeded at any monitoring station (the Annual Mean Concentration Target or AMCT).
-
Population exposure to PM2.5 is at least 35 per cent less than in 2018 (the Population Exposure Reduction Target or PERT).
Population exposure as assessed for the PERT refers to the average concentration someone in England is exposed to and is based on urban, or in some case suburban background measurements, which are located to be representative of the type of environment most people live and work.
The Environmental Improvement Plan 2023 for England set interim targets that by January 2028:
-
An annual average of 12 µg/m3 for PM2.5 is not exceeded at any monitoring station.
-
Population exposure to PM2.5 is at least 22 per cent less than in 2018.
2. Trends in concentrations of PM10 in the UK, 1992 to 2023
2.1 Annual mean concentrations of PM10 in the UK, 1992 to 2023
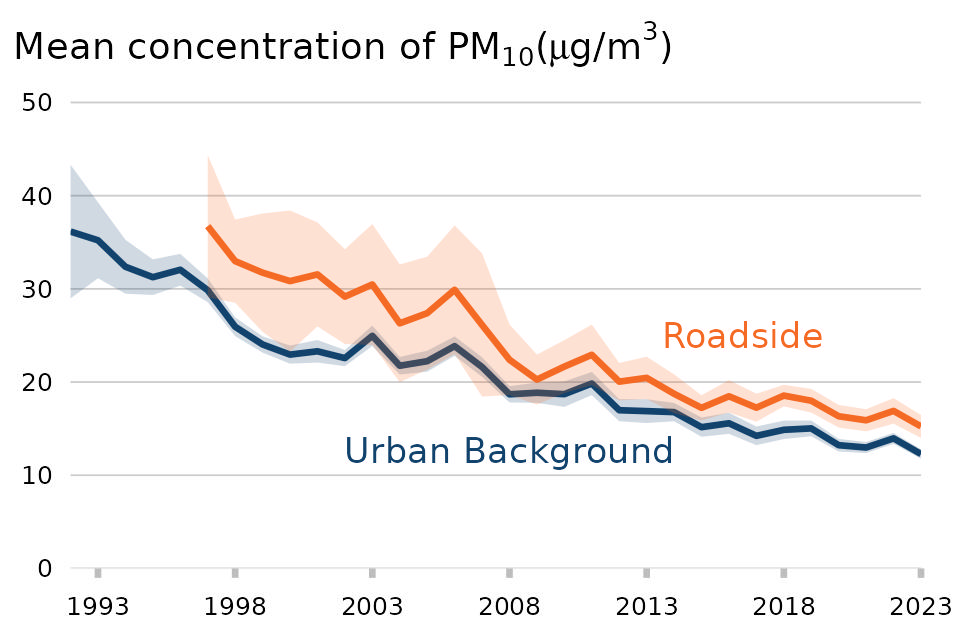
The PM10 index shows the annual mean, averaged over all included sites that had annual data capture greater than or equal to 75 per cent. The shaded areas represent the 95 per cent confidence interval for the annual mean concentration for roadside sites and urban background sites. These intervals narrow over time because of an increase in the number of monitoring sites for both roadside and urban background sites; and also because there is a reduction in the spatial variation as PM10 emissions decrease. Annual means for individual sites can be found in the PM10 statistical tables that accompany this report.
Figure 5: Annual mean concentrations of PM10 in the UK, 1992 to 2023
Download the data for this chart in CSV format
Urban background PM10 pollution has reduced in the long-term despite a period of little change between 2015 and 2019.
There has been an overall decrease in annual mean concentrations of PM10 at urban background sites from 36.1 µg/m3 in 1992 to 12.3 µg/m3 in 2023, the lowest recorded.
Between 1992 and 2000 inclusive, the annual mean PM10 concentration at urban background sites rapidly decreased by an average of 1.7 µg/m3 each year. This is likely a consequence of the large reduction in emissions of PM10 over the same period in the UK (reduction in the burning of coal and improved emission standards for transport and industrial processes).
Between 2000 and 2006 the annual mean concentration fluctuated with no clear trend, and this was observed at most monitoring sites across the UK. Emissions of PM10 in the UK were still decreasing over this period but the reductions were largely driven by changes to the fuels used for energy generation which mainly occurs outside of urban areas and therefore may have had a minimal impact on urban air quality.
Between 2006 and 2015 inclusive, the annual mean PM10 concentration at urban background sites decreased by an average of 1 µg/m3 each year. Concentrations were then stable from 2015 to 2019, after which there was a notable decrease of 12 per cent to 13.2 µg/m3 in 2020, likely due to restrictions on economic activity during the COVD-19 pandemic. Since then, concentrations have remained below pre-2020 levels, despite rising slightly in 2022 most likely due to the lifting of COVID-19 restrictions and the subsequent rise in transport and other economic activities.
Roadside PM10 pollution has reduced in the long-term.
Annual average concentrations of PM10 at the roadside steadily declined from 36.7 µg/m3 in 1997 to 17.2 µg/m3 in 2015. Between 1997 and 2015 inclusive, the annual mean PM10 concentration at roadside sites decreased by an average of 1.1 µg/m3 each year. This reduction could be a consequence of the large reduction in emissions of PM10 over the same period in the UK, particularly from road transport sources.
Concentrations of PM10 at the roadside remained relatively stable between 2015 and 2019 before falling slightly in 2020 to 16.3 µg/m3. Since then concentrations have remained below pre-2020 levels, despite rising slightly in 2022. The mean concentration at the roadside in 2023 was 15.2 µg/m3, the lowest recorded.
The annual mean PM10 concentration is greater at roadside sites compared to urban background sites. This is likely due to the contribution of PM10 emissions from road transport sources, predominantly from non-exhaust sources (brakes, tyres and road wear), as well as the impact of resuspension due to vehicle movements. In earlier years, the PM10 emissions from vehicle exhausts were higher, but these have reduced over time, which would have contributed towards the reduction in the difference between urban background and roadside concentrations over time.
3. Trends in concentrations of PM2.5 in the UK, 2009 to 2023
3.1 Annual mean concentrations of PM2.5 in the UK, 2009 to 2023
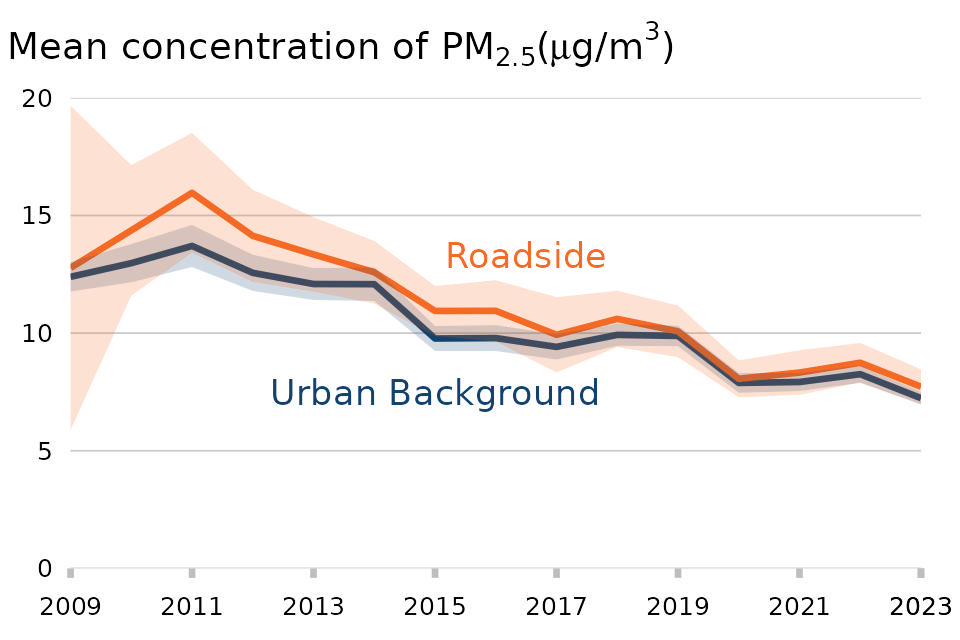
The PM2.5 index shows the annual mean, averaged over all sites that had annual data capture greater than or equal to 75 per cent. The shaded areas represent the 95 per cent confidence interval for the annual mean concentration for roadside sites and urban background sites. The interval for roadside sites narrows over time because of an increase in the number of monitoring sites and a reduction in the variation between annual means for PM2.5 measured at roadside sites. Annual means for individual sites can be found in the PM2.5 statistical tables that accompany this report.
Figure 6: Annual concentrations of PM2.5 in the UK, 2009 to 2023
Download the data for this chart in CSV format
Urban background PM2.5 pollution has generally decreased despite a period of little change between 2015 and 2019
In general, annual average concentrations of PM2.5 at urban background sites have decreased from 12.4 µg/m3 in 2009 to 7.2 µg/m3 in 2023, the lowest recorded. The decline in concentrations of PM2.5 at urban background sites approximately follows the trends seen for PM10 at urban background sites (PM2.5 is a subset of PM10).
Concentrations increased between 2009 and 2011, when a downward trend began towards 2015 followed by a period of relatively little change through to 2019.
Concentrations dropped in 2020, due in part to COVID-19 restrictions on activity, and concentrations have remained relatively stable since. In 2023, mean concentrations showed a decrease of 12 per cent from 2022 levels.
Roadside PM2.5 pollution has generally decreased despite a period of little change between 2015 and 2019.
In general, annual mean concentrations of PM2.5 at the roadside have decreased from 12.8 µg/m3 in 2009 to 7.7 µg/m3 in 2023, the lowest level recorded. The decline in concentrations of PM2.5 at roadside sites approximately follows the trends seen for PM10 at roadside sites (PM2.5 is a subset of PM10).
Urban background and roadside PM2.5 concentrations are similar (more similar for PM2.5 than for PM10, partly because PM2.5 travels further from its original source than PM10 does). There were 3 roadside monitoring sites in 2023 which recorded an annual mean greater than the maximum mean captured by any urban background monitoring site. In recent years, the gap between roadside and urban background concentrations has diminished, in part due to a reduction in emissions from road transport sources.
Concentrations of PM2.5 tend to be greatest in urban environments in the southern and eastern areas of the UK due to a variety of factors, including higher population density, weather conditions and greater exposure to pollution sources from mainland Europe. In 2023 4 of the 5 sites in urban environments (3 roadside and 2 background) with the greatest annual mean concentration of PM2.5 were located in the South or East (including London), the other was in the Midlands.
4. Average hours spent in ‘Moderate’ or higher PM pollution
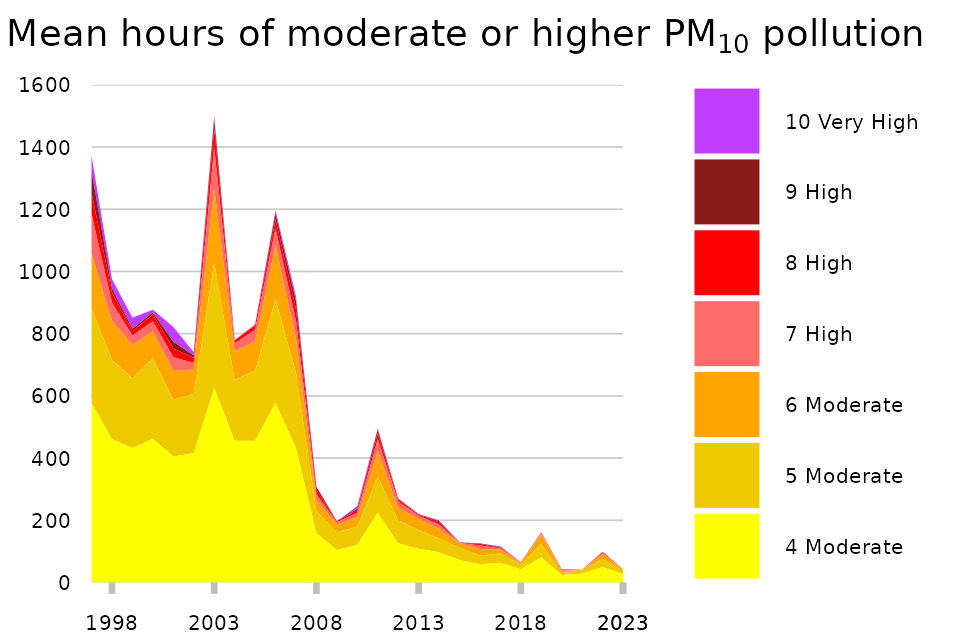
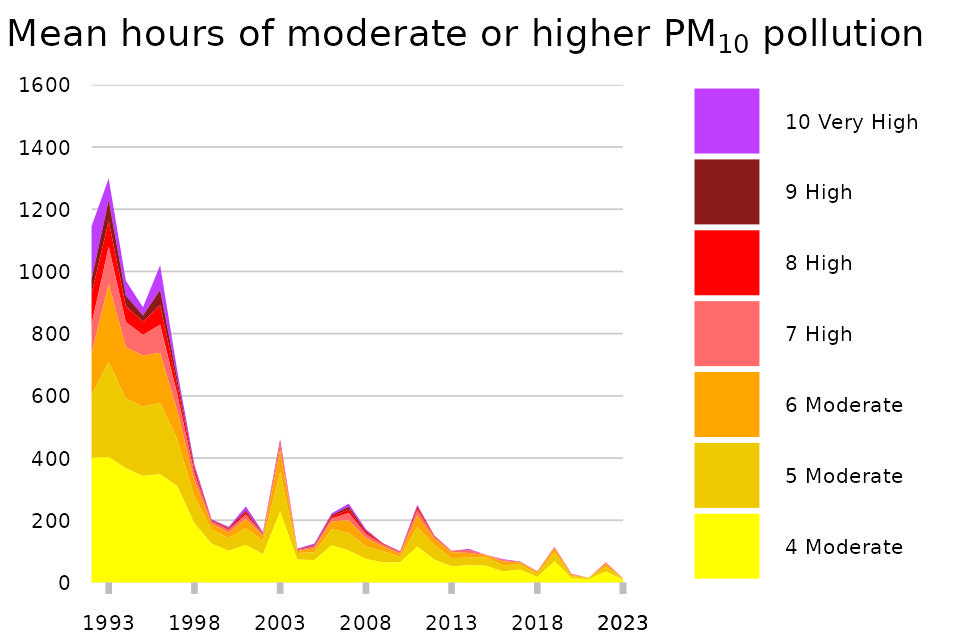
This metric measures the annual trend in the number of hours per monitoring site that concentrations are recorded at levels of moderate or higher. For example, ‘Moderate’ air pollution (which requires action by citizens who are vulnerable to the health impacts of air pollution) for PM10 is triggered when the latest 24-hour running mean concentration is greater than 50 µg/m3. The coloured categories relate to the categories of the Daily Air Quality Index - see the Daily Air Quality Index Table in the statistical tables that accompany this release.
Figure 7: Annual mean hours when PM10 pollution was ‘Moderate’ or higher, for roadside sites, 1997 to 2023
Download the data for this chart in CSV format
Figure 8: Annual mean hours per site when PM10 pollution was ‘Moderate’ or higher, for urban background sites, 1992 to 2023
Download the data for this chart in CSV format
Roadside and urban background monitoring sites have recorded fewer hours of ‘Moderate’ or higher PM10 air pollution in the long term
At roadside and urban background sites the long-term trend has been a decline in the number of hours for which the mean PM10 concentration over the previous 24 hours exceeded 50 µg/m3.
At the roadside the mean number of hours where PM10 concentrations exceeded this ‘Moderate’ threshold for a monitoring site showed a decrease of 97 per cent between 1997 and 2023 to 42 hours; they decreased by an average of 51.1 hours per year over this period.
At urban background sites the mean number of hours where PM10 concentrations exceeded the ‘Moderate’ threshold for a monitoring site showed a decrease of 99 per cent between 1992 and 2023 to 13 hours. This represents an average reduction of 37 hours per year over the period.
The downward trend in the time series has been interrupted in several years; most notably in 2003. In March and April 2003, meteorological analysis showed that concentrations at many monitoring sites were elevated due to primary emissions from Northern or Central Europe along with secondary particles caused by chemical reactions in the atmosphere. When cleaner Atlantic airflows became dominant in April 2003, pollution levels dropped considerably - see Air Pollution in the UK, 2003.
More recently, the downward trend was interrupted in 2019, but to a lesser degree. Meteorological analysis indicated that two UK-wide particulate pollution episodes occurred in February and April of 2019. Both of these events primarily resulted from a combination of warm, sunny weather causing increased local and foreign particulate suspension along with light, easterly winds transporting a substantial amount of particulate matter from Europe. It is likely that these events contributed to the relatively high number of hours of PM10 pollution observed in 2019 - see Air Pollution in the UK, 2019.
For PM2.5, ‘Moderate’ air pollution (which requires action by citizens who are vulnerable to the health impacts of air pollution) is triggered when the latest 24-hour running mean concentration is greater than 35 µg/m3. The coloured categories relate to the categories of the Daily Air Quality Index - see the Daily Air Quality Index Table in the statistical tables that accompany this release.
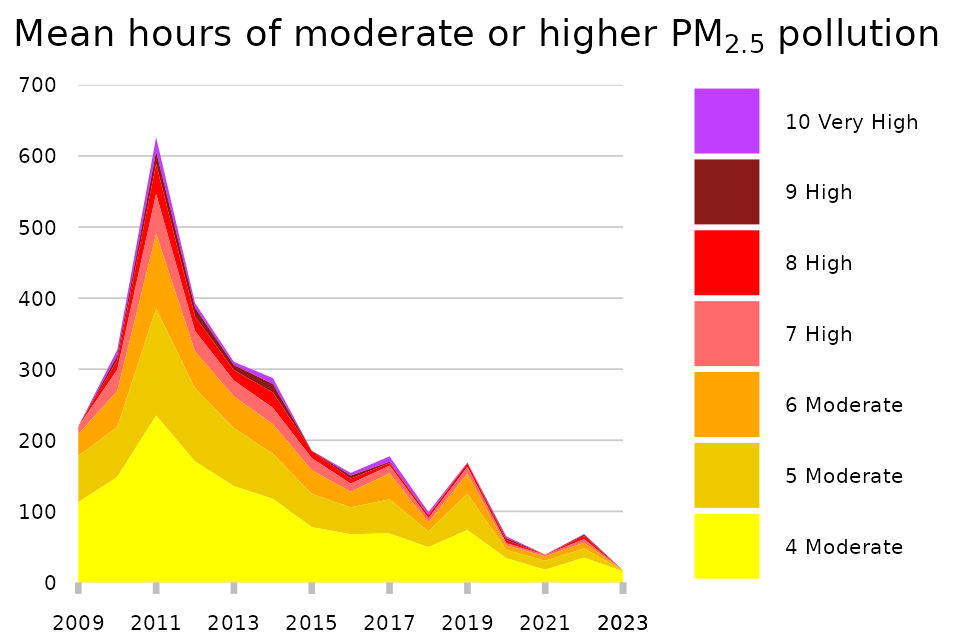
Figure 9: Annual mean hours when PM2.5 pollution was ‘Moderate’ or higher for roadside sites, 2009 to 2023
Download the data for this chart in CSV format
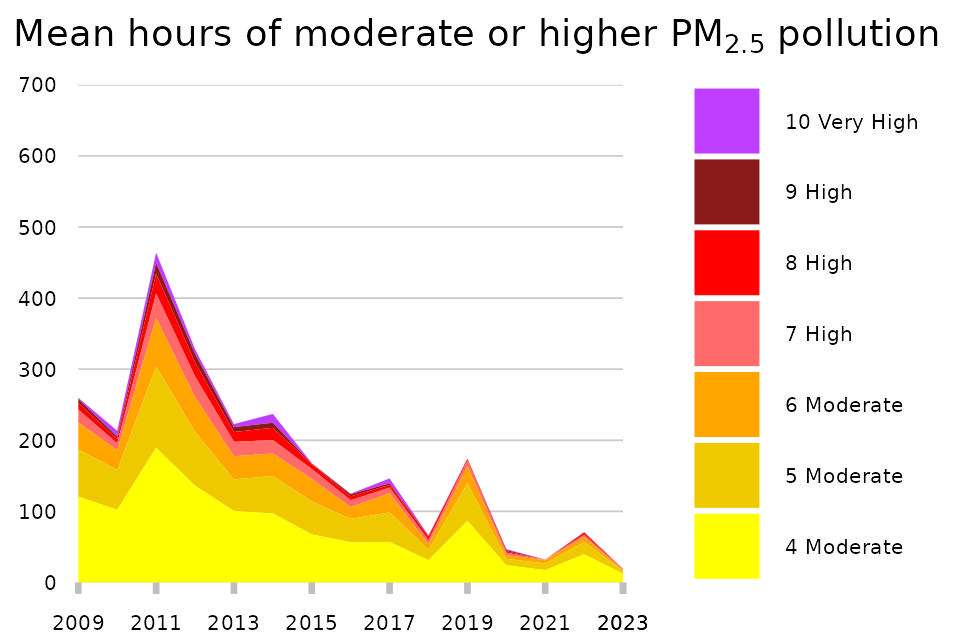
Figure 10: Annual mean hours when PM2.5 pollution was ‘Moderate’ or higher for urban background sites, 2009 to 2023
Download the data for this chart in CSV format
Overall, roadside and urban background monitoring sites have recorded a decreasing trend in hours of ‘Moderate’ or higher PM2.5 air pollution since 2011.
At roadside and urban background sites there has been a downward trend in the number of hours for which the mean PM2.5 concentration over the previous 24 hours exceeded 35 µg/m3 since 2011.
At the roadside the mean number of hours where PM2.5 concentrations exceeded this ‘Moderate’ threshold for a monitoring site showed a decrease of 97 per cent from the peak in 2011 to 17 per site in 2023.
At urban background sites the mean number of hours where PM2.5 concentrations exceeded the ‘Moderate’ threshold for a monitoring site showed a decrease of 96 per cent from the peak in 2011 to 19 per site in 2023.
Particulate pollution was particularly high in March and April 2011 due to a combination of secondary pollution being formed over mainland Europe and wind conditions carrying this pollution to the UK. A period of low wind conditions followed which allowed emissions from UK sources to build up in the atmosphere, leading to unusually high concentrations of particulate matter, see Air Pollution in the UK, 2011. Similar events occurred in February and April of 2019, resulting in a relatively high number of hours of PM2.5 pollution in that year.
5. Temporal variations in concentrations of PM2.5 in the UK, 2023
5.1 Monthly variations
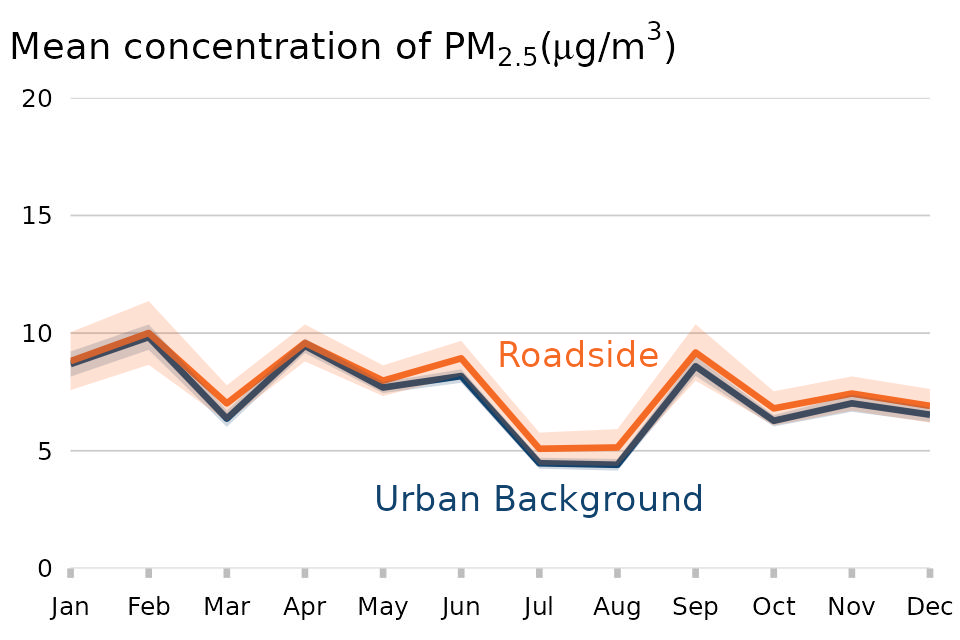
The PM2.5 index shows the monthly mean, averaged over all sites that had monthly data capture greater than or equal to 75 per cent in a given year. The shaded areas represent the 95 per cent confidence interval for the monthly mean concentration for roadside sites and urban background sites.
Figure 11: Monthly mean PM2.5 concentration at roadside and urban background sites, 2023
Download the data for this chart in CSV format
In recent years the highest PM2.5 concentrations in urban areas have tended to occur during the spring and winter months, although in 2023 there was also a peak in concentrations during September.
The greatest monthly mean concentration in 2023 was in February (10.0 µg/m3 for roadside sites and 9.8 µg/m3 for urban background sites). Residential combustion of wood and coal in stoves and open fires is a large contributor to emissions of particulate matter both in the UK and across Europe. This is a contributing factor towards elevated concentrations in winter months. Emissions from this source are typically located closer to urban background sites than roadside sides, which may partially explain the reduction in the gap between concentrations recorded at urban background and roadside sites throughout the winter months.
The next highest concentrations for both site types were in April. A peak in early spring is typical for PM2.5 concentrations, as elevated concentrations of nitrates are transported from agricultural operations across UK and continental Europe (e.g., from fertilisers) - see the Air Quality Expert Group report.
September also had a peak in concentrations in 2023. All monitoring sites which recorded high concentrations in September recorded this on a day between the 7th and 10th of September. There was a significantly warm and dry start to September - see Met Office blog. Once this pattern subsided, we had increased periods of winds and rain, as well as Storm Agnes late in the month, which would have reduced particulate concentrations in the air.
It should be noted that there are a large number of emission sources for particulate matter and other sources contribute to this pattern. There can also be considerable sources originating from outside of the UK. The level of transboundary derived particulates is determined by weather conditions and prevailing winds.
5.2 Hourly variations
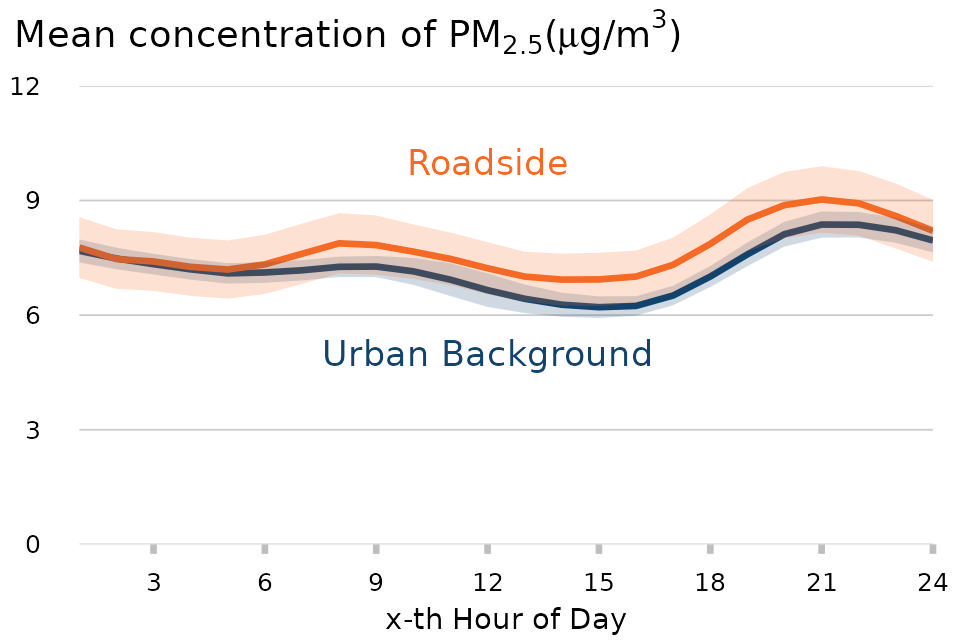
The PM2.5 index shows the hourly mean, averaged over all included sites that had data capture greater than or equal to 75 per cent for all instances of that hour in a given year. The shaded areas represent the 95 per cent confidence interval for the hourly mean concentration for roadside sites and urban background sites.
Figure 12: Hourly mean PM2.5 concentration at roadside and urban background sites, 2023
Download the data for this chart in CSV format
PM2.5 concentrations were greater in the evening compared to other times of the day; in 2023 the greatest mean concentrations were at 9pm for both roadside and urban background sites (9.0 µg/m3 and 8.4 µg/m3 respectively). This is thought to be the result of households burning wood, coal or other solid fuels in stoves or open fires for heating in the evenings, particularly in winter months.
Although the lowest concentrations still occur in the afternoon in both seasons, winter concentrations can often show more substantial morning and late evening peaks than do the summer values. This is likely related to greater domestic heating requirements at these times of day.
6. Sections in this release
Background to concentrations of air pollutants
Concentrations of nitrogen dioxide
Days with ‘Moderate’ or higher air pollution (includes sulphur dioxide)