Research on UK managed service providers
Published 12 February 2024

© Crown copyright 2024
This publication is licensed under the terms of the Open Government Licence v3.0 except where otherwise stated. To view this licence, visit nationalarchives.gov.uk/doc/open-government-licence/version/3 or write to the Information Policy Team, The National Archives, Kew, London TW9 4DU, or email: psi@nationalarchives.gov.uk.
Where we have identified any third party copyright information you will need to obtain permission from the copyright holders concerned.
This publication is available at https://www.gov.uk/government/publications/research-on-managed-service-providers/research-on-uk-managed-service-providers
Executive summary
Background to the research
Perspective Economics (with data support from glass.ai) has been commissioned by the Department for Science, Innovation and Technology (DSIT) to undertake an independent market study exploring the size and scale of the Managed Service Provider (MSP) market in the UK.
This document sets out the findings of the research, conducted between June 2023 to September 2023. Please note that this research is experimental, given the need to draw upon a wide range of data, including web data to identify potential providers, and understand the range of services provided.
As such, it provides an estimate of the number of Managed Service Providers active in the UK, and explores key market metrics such as size, revenue, estimated employment, and Gross Value Added. For purposes of this research, the full definition for Managed Service Providers is set out in Section 2.1; however, this is aligned to the definition outlined in the Government’s response to the call for views on proposals to improve the UKs cyber resilience, in that MSPs are entities that provide:
-
A service which is provided by one business to another business (i.e a third party) and,
-
A service which is related to the provision of IT services such as systems, infrastructure, networks and applications , and/or the security thereof and,
-
A service which relies on the use of network and information systems, whether these are of the provider, their customers or a third party’s and,
-
A service which provides regular and ongoing management support, active administration and/or monitoring of IT systems, IT infrastructure, applications and/or IT networks, and/or the security thereof.
Key findings
We set out some of the key findings from this research below.
Number and scale of providers
-
The UK MSP market consists of an estimated 11,492 active providers.
-
We estimate that in 2022, the MSP sector generated annual combined revenue from managed services activity of £52.6 billion. This also supported £29.1 billion in direct Gross Value Added (GVA), and that the sector employs an estimated 294,340 FTEs. This demonstrates the sector’s significant economic contribution to the UK economy.
-
We estimate that of these providers, where known, 4% (460) are large, 9% (1,052) are medium, 28% are small (3,182) and 59% are micro (6,623).[footnote 1]
The analysis highlights the breadth of scale of MSPs in the UK. For example:
-
Large MSPs account for just 4% of firms but generate 74% of total estimated revenue (£38.8 billion). Further, the largest ten MSPs alone contribute an estimated 27% of all sector revenue, highlighting a market with significant concentration among the largest providers.
-
There is a considerable proportion of medium-sized MSPs (9% of firms) that generate 16% of total estimated revenues (£8.4 billion). This indicates that mid-tier firms, while fewer in number than smaller firms, have a notable impact on the market.
-
There are over 3,100 small (28%) and over 6,600 micro MSPs (59%) serving markets across the UK, collectively generating £5.3 billion in estimated revenue (10% of total).
Business models and service offering
-
There is a relatively even split between ‘dedicated’ or ‘pure-play’ MSPs (53%) focused primarily on managed services, and diversified MSPs (47%) offering a wider range of IT products and services. This highlights the range of business models in use.
-
This research explores the key services and offerings provided by the market, and develops a market taxonomy to explore provision. We find that key services include cloud solutions, IT infrastructure management, IT service management, and managed security services.
-
We also explore partnerships, with the data suggesting that 56% of MSPs have partnerships with Microsoft, 43% with AWS and 15% with Google Cloud. This shows the extensive partnerships between MSPs, vendors, and major cloud providers.
Role of public procurement
- Public procurement is an important source of revenue for MSPs. We estimate that the public sector awarded over £7 billion annually in IT contracts to MSPs (2022). This highlights the role of government as a major buyer of managed services.
Implications for number of MSPs in potential scope of the NIS Regulations
-
We estimate that between 1,500 – 1,700 large and medium MSPs could potentially be in scope of the plans to update the NIS regulations to include managed services. We also estimate that these MSPs account for 90% of MSP sector revenue.
-
We estimate that there are just over 9,800 small (3,182) and micro (6,623) which would not be in scope of NIS Regulations under current proposals, as they would be subject to the small and micro exemption.
Areas for further consideration
In addition to the key findings, this research also explores a number of themes relating to how the Managed Service Provider market operates in the UK. We set out some of the areas for consideration, or potential further research below.
- MSPs and Cyber Security Provision: The research identifies approximately 3,000 MSPs which mention offering cyber security related solutions to their customers. To further consider how MSPs contribute to the cyber resilience of the UK, it may be useful to further map cyber security accreditation levels across providers. This could include exploring the take-up and roll-out of standards such as ISO27001 and Cyber Essentials, as well as mapping the complementarity and variance between cyber security as offered by MSPs and MSSPs in the UK.
This research also highlights the importance of MSPs as part of the UK’s overall supply chain security. Further research, potentially aligned to the DSIT Cyber Security Breaches Survey which explores the use of IT and cyber security outsourcing, regarding the use of MSPs and MSSPs, risk analysis through breaches or attempted breaches, customer spend, and any buyer or supplier feedback on the security landscape may be useful.
- Supporting the growth of the MSP sector: We find evidence of a diverse and growing sector. We also anticipate the MSP market is well placed for further growth, with an estimated Compound Annual Growth Rate (CAGR) of 12% to 2027. However, the scale of providers is varied, and includes a small number of very large multinationals driving the majority of revenue, followed by several hundred ‘mid-market’ providers, and thousands of small and micro providers.
This research explores a number of themes relating to supporting growth within the MSP sector (see Section 6). Areas to support growth could include:
- Supporting technical and commercial skills: MSPs offer a broad range of technical solutions, and this means they have to continually refine their offering and partnerships to support customers. There may be potential to support MSPs to develop staff with specific skills programmes in areas such as cloud, AI and cyber security. There may also be potential to support MSPs with leadership and management skills to further unlock growth.
The MSP sector also contains several well-established IT firms that recruit talent on an ongoing basis. There may be opportunities to work with providers on developing skills initiatives at a regional and national level.
-
Access to finance: We find that external investment is much lower among MSPs than other sectors, given the focus on service provision. However, for firms seeking to expand, they may use facilities such as debt finance. It may be worthwhile exploring access to growth finance for high potential SME MSPs, including potential benefits and challenges, particularly where smaller MSPs are seeking to merge or acquire new practices to expand their capabilities.
-
Public Procurement: We estimate that at least one in six providers have secured at least one public contract within the last three years; however, as set out, the volume awarded to SMEs is considerably lower than larger providers. Whilst increasing SME access is a key theme, it may be worth undertaking further review into the role of frameworks such as G-Cloud 13, the role of local procurement, the potential to integrate or subcontract SMEs into managed service supply chains, and the role of innovation competitions and partnerships.
-
Industry and Cluster Development: There may be potential to support cluster development and capacity building in geographic areas or sectors with potential for growth in demand for managed services. This could align to existing regional cluster initiatives (e.g. regional clusters that focus on the role of MSPs in cyber security), or involve a deeper review of outsourcing statistics to explore how MSPs are used by buyers across the country and sectors. Exploring capacity building in areas with lower MSP saturation may also be worthwhile to understand how barriers (e.g. cost or limited awareness) may be overcome within regional markets.
-
Monitoring Growth and Market Dynamics: This study is a baseline to understand the size and scale of the Managed Services market currently. However, monitoring market revenue, employment and investment on an ongoing basis can support an understanding of how the market is developing, and support understanding the potential competitiveness impacts of bringing large and medium MSPs under NIS regulations
1. Introduction and background
1.1 Background to the research
Perspective Economics and glass.ai were commissioned by the Department for Science, Innovation and Technology (DSIT) in July 2023 to undertake a market study of Managed Service Providers (MSPs) in the UK, to build the evidence base for exploring the impact of bringing MSPs into NIS as well as an understanding of wider policy considerations and interventions. This analysis provides an assessment of:
-
The estimated number of Managed Service Providers (MSPs) active in the UK
-
The sector’s contribution to the UK economy (measured through revenue and Gross Value Added)
-
The estimated number of employees in the UK working in the MSP sector
-
The range of services provided by these firms
This research has required an experimental methodology to help identify and measure provider activity; as such, it should be viewed as indicative based on the best available data.
1.2 Research objectives
The research commissioned by DSIT included two main objectives - to build an understanding of the MSP market (as above), and, building on this, to understand the potential impacts of bringing large and medium MSPs under the scope of the NIS regulations.
1.3 Overview of methodology
The Managed Service Provider sector does not have a formal Standard Industrial Classification (SIC) code. As such, this study draws upon:
-
A market taxonomy and definition (see Section 2.1) for Managed Service Providers (MSPs) to help identify and classify companies in scope, developed and refined through review of over 10,000 company websites, identification of over 600 keywords (products and services), and three taxonomy workshops with industry and policy teams.
-
An established data partnership with data intelligence firm glass.ai, using Artificial Intelligence (AI) techniques [footnote 2] to identify relevant businesses using web data, and developing agreed markers for understanding the MSP sector
-
Identification of company registrations with Companies House (and annual accounts where available) to support estimation of revenue, employment and Gross Value Added of the MSP sector.
-
Use of data partnerships with intelligence platforms - Beauhurst (a leading investment analysis platform, which enables users to discover, track and understand some of the UK’s high-growth companies) and Tussell (market insight into public sector procurement through identifying key contracts, spend, buyers and suppliers).
The figure below sets out the overview of the methodology. A full methodology is set out in Annex A.
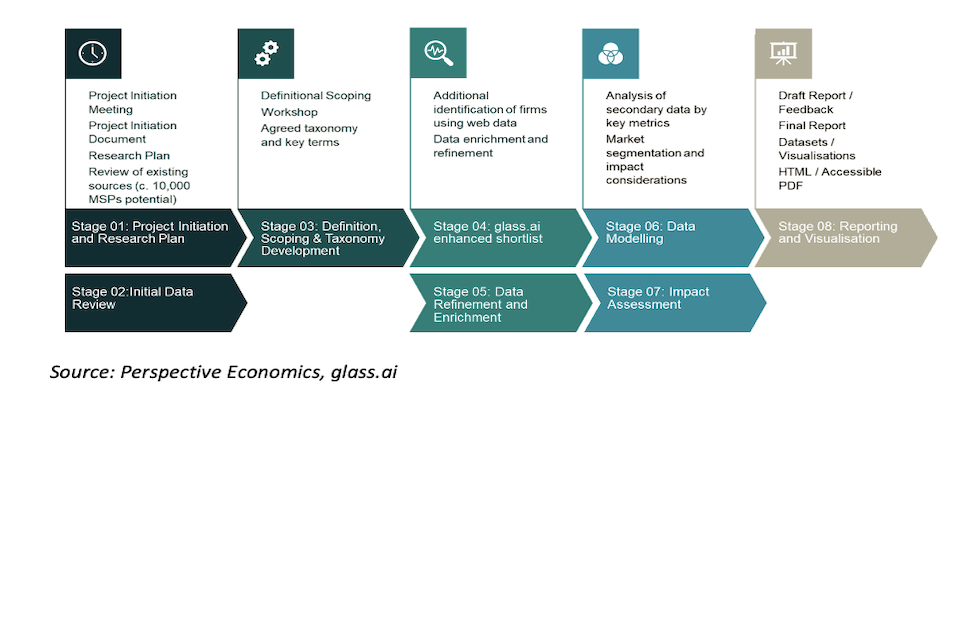
| Stage 01: Project Initiation and Research Plan and Stage 02: Initial Data Review | Project Initiation Meeting, Project Initiation Document, Research Plan, Review of existing sources (c. 10,000 MSPs potential) | |
| Stage 03: Definition, Scoping and Taxonomy Development | Definitional Scoping Workshop, Agreed Taxonomy and key terms | |
| Stage 04: glass.ai enhanced shortlist and Stage 05: Data Refinement and Enrichment | Additional identification of firms using web data, Data enrichment and refinement | |
| Stage 06: Data Modelling and Stage 07: Impact Assessment | Analysis of secondary data by key metrics, Market segmentation and impact considerations | |
| Stage 08: Reporting and Visualisation | Draft Report / Feedback, Final Report, Datasets / Visualisation, HTML / Accessible PDF |
Source: Perspective Economics, glass.ai
1.4 Acknowledgements and feedback
The authors would like to thank the DSIT team for their support across the study. DSIT and the report authors would also like to thank those that participated within this research, including those that participated within the workshops to help define and segment the MSP sector.
Contact: nis@dsit.gov.uk
2. Defining the Managed Service Provider (MSP) market
2.1 Defining Managed Service Providers
The Department for Science, Innovation and Technology (DSIT) is proposing to bring managed services under the scope of the Network and Information Systems (NIS)[footnote 3] (2018) regulations. These regulations establish legal measures to increase the level of cyber and physical security of network and information systems where essential and digital services are provided.
Following a consultation in 2022, the government announced its intention to update the NIS regulations to ‘bring managed service providers (MSPs) into scope of the regulations to keep digital supply chains secure’.
Managed Service Providers (MSPs) offer a broad range of IT services; however, there is no Standard Industrial Classification (SIC) code for relevant companies to be measured, nor is there a unified definition. As such, to identify managed service providers active in the UK, there is a need to:
-
Develop a working definition and scope for Managed Service provision, including the type of services, solutions, or approach to market considered relevant.
-
Develop trading criteria, whereby firms must demonstrate certain criteria to be considered in scope (e.g. registered in the UK with Companies House, and active at the time of writing)
-
Agree a series of characteristics that may enable a company with relevant services to be considered as an ‘MSP’ both under a broad definition, but also under potential regulatory considerations.
At a high-level, Gartner defines a Managed Services Provider[footnote 4] as one that:
delivers services, such as network, application, infrastructure and security, via ongoing and regular support and active administration on customers’ premises, in their MSP’s data centre (hosting), or in a third-party data centre.
MSPs may deliver their own native services in conjunction with other providers’ services (for example, a security MSP providing sys admin on top of a third-party cloud IaaS). Pure-play MSPs focus on one vendor or technology, usually their own core offerings. Many MSPs include services from other types of providers. The term MSP traditionally was applied to infrastructure or device-centric types of services but has expanded to include any continuous, regular management, maintenance and support.
The government set out its response to the public consultation on proposals to improve cyber legislation[footnote 5] in November 2022. This set out updated proposed characteristics for managed services in scope of NIS regulation. A managed service is one that meets all of the following characteristics:
-
A service which is provided by one business to another business (i.e a third party) and,
-
A service which is related to the provision of IT services such as systems, infrastructure, networks and applications , and/or the security thereof and,
-
A service which relies on the use of network and information systems, whether these are of the provider, their customers or a third party’s and,
-
A service which provides regular and ongoing management support, active administration and/or monitoring of IT systems, IT infrastructure, applications and/or IT networks, and/or the security thereof.
To be in scope of NIS, a managed service provider must provide managed services to organisations in the UK and not be a small or micro business (i.e. employ not less than 50 people, or where annual turnover or balance sheet is not less than €10 million).
The characteristics set out above align closely with the broader market definitions for Managed Service Providers. As such, this research seeks to:
-
Establish a broad definition to help identify relevant MSPs in the UK
-
Review and assess the services and solutions provided by MSPs, to help identify further similar provision across similar firms in the UK
-
Develop a long-list of potential MSPs operating in the UK
-
Undertake market analysis on an agreed set of providers
This market analysis seeks to identify businesses active within the UK that provide managed IT services to a third party, and meet the four characteristics set out above. Further, this analysis is primarily focused upon organisations that include all of the following attributes:
-
Have a clear presence within the UK market, typically through a UK registered business that reports to Companies House on an annual basis (or clear identification of an office in the UK)
-
Demonstrate an active provision of commercial activity (e.g. through the presence of an active website / social media presence)
-
Provide IT services to the market aligned to the taxonomy set out in Section 2.4
-
Have identifiable revenue or employment within the UK related to managed IT services
-
Appear to be active at the time of writing (i.e. have not, or are not in the process of dissolution)
-
Are not charities, universities, networks, and individual contractors (non-registered) – which are all excluded for analysis purposes
We set out the full methodology, definition, and scope of the research within the annex.
2.2 Developing an MSP taxonomy and research markers
This research seeks to identify a wide range of Managed Service Providers active in the UK market. There is no Standard Industrial Classification (SIC) code to identify this provision; and as such, there are a range of services and solutions potentially in (or out of) scope when seeking to identify providers.
The research team held a workshop with senior policy leads and industry representatives from organisations including DSIT, ICO and NCSC in July 2023. This workshop had the following objectives:
-
Identify a range of agreed ‘gold standard’ Managed Service Providers operating in the UK. These include example providers with known provision, whereby the research team could review the services provided to help build out the definitional scope.
-
Identify a range of potential web sources for identifying MSPs, including where large cloud providers have ‘MSP partnerships’ on their websites, and sources such as G-Cloud.
-
Develop a long-list of potential keywords to help identify MSPs trading in the UK
-
Agree how services might be grouped to develop a market taxonomy
Following this workshop, the research team reviewed over 4,000 potential Managed Services Providers (identified through secondary sources and web data) to develop a list of over 500 unique potential keywords and develop a high-level taxonomy of services provided.
Overview of the Managed Services Taxonomy used in this research:
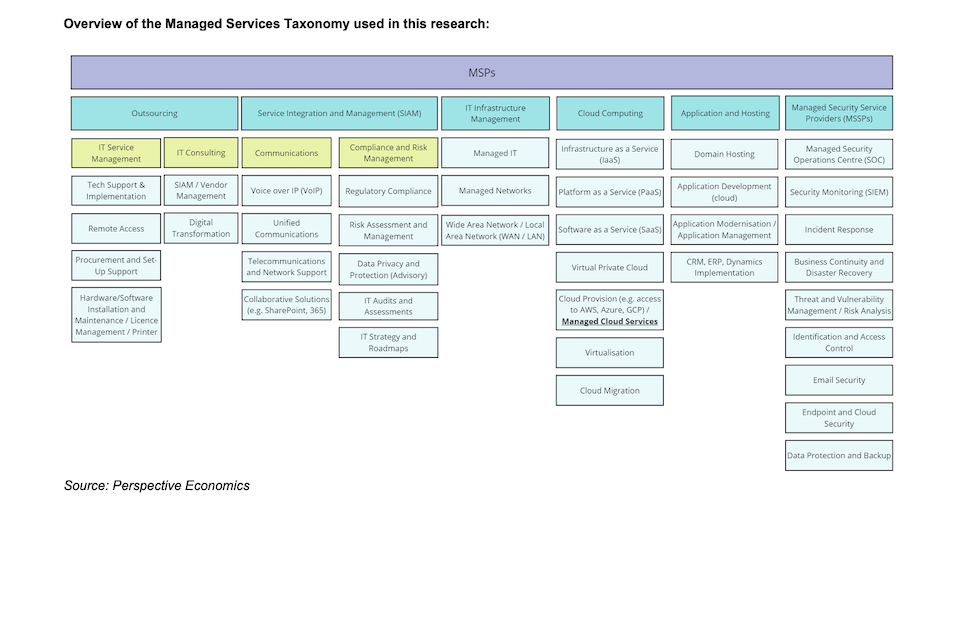
Source: Perspective Economics
We have applied taxonomy markers against each company identified (further detail set out in Section 3.3). High-level definitions (in alphabetical order) include:
| Taxonomy category | Agree definition (Short) |
| Application and Hosting | Offering platforms or environments to host, deploy, and manage storage or applications e.g. data hosting. |
| Cloud Computing | Providing (or enabling access to) scalable IT resources and solutions on demand via the cloud, including access to storage, compute, or solutions. |
| Communications | Management of communication tools and platforms, including VoIP, unified communications, and other collaborative tools. |
| Compliance and Risk Management | Services and solutions that ensure IT practices align with legal, regulatory, and risk-based requirements. |
| IT Consulting | Professional advisory services such as implementing IT strategies, solutions, and architectures. (For MSPs, this must have an ‘ongoing element’). |
| IT Outsourcing | IT organisations that are able to take responsibility for delegated IT functions or services by their customers. |
| IT Service Management | Oversight and management of end-to-end IT service delivery, including tech support, remote access and business support. |
| IT Infrastructure Management | Services focused on overseeing, managing, and ensuring the efficient operation of IT resources, including servers, networks, and storage. |
| Managed Security Services Providers (MSSPs) | Offering security services such as monitoring, detection, and incident response on behalf of third parties. |
We have also identified some of the most commonly mentioned products and services cited by MSPs on their websites (e.g. cloud migration, storage and backups, managed SOC) etc. This is also covered in Section 3.3.
This analysis is based upon our analysis of web data and company trading descriptions in their own words. It provides an indicative view of commonly provided services within the MSP sector.
2.3 Developing sector markers
This research is highly experimental, given some of the novel methods used, and the challenges in defining such a broad sector. However, in order to provide high-quality analysis of how this market performs, and provide insight into the services and dynamics involved - we have developed a series of ‘sector markers’ applied on a firm-by-firm basis.
These are developed using a range of open and proprietary sources, including but not limited to:
Primary markers:
-
Company Name and Registered Number (where available)
-
Company Identifiers: Website, Social Media and Description
-
Estimated number of employees (web data and accounts) and MSP related estimate
-
Estimated annual turnover (web data and accounts) and MSP related estimate, and Gross Value Added (GVA)
-
Location of companies (registered, local offices, and international)
-
Exports and import markers (web data)
-
Company incorporations (date)
-
Types of products and services provided, and sectors served (taxonomy)
-
MSP partnerships and focus markets
-
Funding and investment deals, including value, volume, and forms/sources of investment
-
Procurement / award data by MSPs by public buyers (including CNI and essential services)
Secondary markers:
-
Regulatory Markers: where firms align to the proposed definition of an MSP under potential NIS regulations, or may already be in scope due to cloud provision.
-
Adjacent Sector Markers: where a firm is aligned to a wider sector such as telecoms, cyber security, cloud, or data centres.
This will support DSIT and wider organisations to understand the size, scale, extent, and range of provision that exists within the UK’s MSP market. We set out relevant findings throughout subsequent chapters.
3. Market profile
3.1 Number of MSPs identified
We estimate that there are currently 11,492[footnote 6] Managed Service Providers active within the UK. This reflects a glass.ai and Perspective Economics estimate as of August 2023. Throughout this study, given the experimental nature of this work, the research team emphasise the need to draw upon a wide range of existing sources, alongside the development and deployment of a cyber security taxonomy against Companies House data, analysis of relevant domains, and in-depth workshops.
Within the research process, the research team:
-
Identified over 4,000 potentially relevant MSPs and extracted over 500 keywords to inform the initial web crawl and web scraping by glass.ai
-
Undertook an initial web crawl, reviewing over 1 million active UK companies to identify c. 16,000 potentially relevant companies to this study
-
Manual and automated review was undertaken to identify the quality of results, including relevance of keywords and description, match to a UK registration, activity on website, and identification of sectoral / ‘false positives’
-
A second crawl was undertaken which refined the list to c. 11,000 providers.
-
Subsequent refinement was undertaken to ensure no major known MSPs were omitted from the dataset, and that the list was subject to further quality control (e.g. improved matching to Companies House, removal of duplicate values etc). Any inactive or dissolved entities were also removed.
-
Final matches against other known lists of UK MSPs were also undertaken, resulting in a final list of 11,492 Managed Service Providers.
This process yields 11,492 firms in scope, and the research team considers this to be an appropriate figure to gauge the health and composition of the sector. We note that with any study of this type, the count of firms will always be subject to definitional boundaries and considerations – and as such, this is perceived as a reflective estimate of activity in the UK. Please note that for the 11,492 firms identified, given the use of web data, the research team has been able to match 10,291 (89%) accurately to Companies House CRNs.
However, the web data has identified a further 1,201 providers that, whilst unable to match accurately to a registered entity, may reflect international firms (or very small firms trading on a ‘sole trader’ basis in the UK) and we have, where appropriate, sought to include them within this study.
3.2 Firmographics of UK MSPs
This section explores the size and scale of UK MSPs identified within this research. This includes an overview of the number of companies by size; running count of incorporations; the breakdown between companies that appear dedicated or diversified; and the products and or services provided by each company.
3.2.1 MSPs by size
Figure 3.1 sets out the estimated size<sup class[footnote 7] of the MSPs in scope in the UK. This size relates to the UK entity taking into account the total revenue and employment activity – either known through company accounts, or estimated as set out in the methodology.
To be in scope of NIS, a managed service provider must provide managed services to organisations in the UK and not be a small or micro business (i.e. employ not less than 50 people, or where annual turnover or balance sheet is not less than €10 million).
This suggests that 4% (460) of firms are large and 9% (1,052) are medium, suggesting that just over 1,500 UK registered MSPs might be considered in scope of potential NIS regulations. However, these size estimates relate to the UK entity only (i.e. the revenue or employment identified within the UK branch). The use of web data suggests that at a global level, based on employment across the entire global firm, up to 1,700 providers may be large or medium in structure.
A further 28% are small (3,182) and 59% are micro (6,623), highlighting that, in line with the wider UK economy, the majority of providers are small or micro providers. This size composition is similar to the recent DSIT UK Cyber Security Sectoral Analysis (2023) exercise, which suggested that 8% of firms providing cyber security solutions are large, and 10% are medium.
Figure 3.1 Estimated size of Managed Service Providers
| Large | 4% (460) |
| Medium | 9% (1,052) |
| Small | 28% (3,182) |
| Micro | 59% (6,623) |
Source: Perspective Economics, glass.ai (n = 11,316)[footnote 8]
With regards to size data, there are two key findings that can be interpreted:
-
We estimate that between 1,500 – 1,700 MSPs are potentially in scope of the NIS regulations where the aforementioned conditions are applied. We also estimate that up to 600 of these may already be captured under existing cloud provision to their customers, suggesting an additional 900 – 1,100 large and medium-sized MSPs may need to consider the impact of regulatory compliance under NIS.
-
There are almost 3,200 small MSPs and a further 6,600 micro MSPs operating in the UK, which would be subject to a size exemption. These may not directly be impacted by regulation; however, could be impacted by wider competition or standards embedded by larger competitors. Further, these providers may also be critically important for particular sub-sectors or sub-geographies within the UK.
3.2.2 MSPs by incorporation date
For registered MSPs with a known incorporation date (n = 10,215), we have analysed company formation trends. This suggests a relatively linear trend over recent years, with the majority of firms (54%) registering at some stage after 2010.
Over the most recent full decade (2010 – 2020), there has been approximately 500 new registrations every year (just over one new MSP registered every day). However, growth in the count of companies has typically been concentrated among micro providers, as shown in Figure 3.3. As these charts reflect incorporation dates of firms currently in the MSP dataset, this does not include where firms may previously have been active and have since dissolved – and therefore should be viewed as indicative of the trend. It also captures the current size of firms, rather than the size at incorporation. This does however suggest significant growth in smaller scale MSPs (by volume) across the UK in the last decade.
Figure 3.2 Running count of company registrations
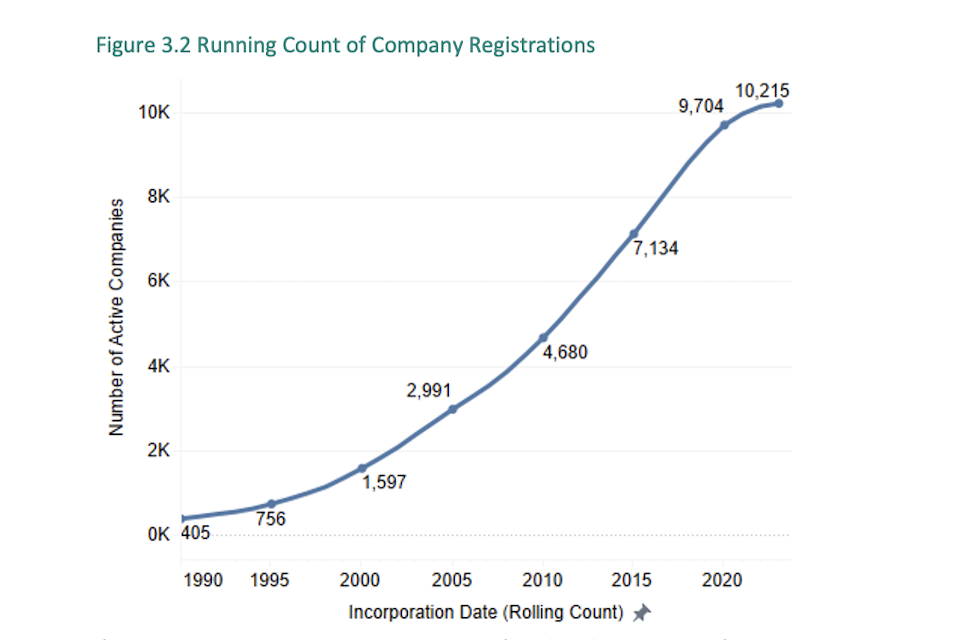
Source: Perspective Economics, glass.ai (n = 10,215 registered firms with a known incorporation date)
Figure 3.3 Running count of company registrations by size
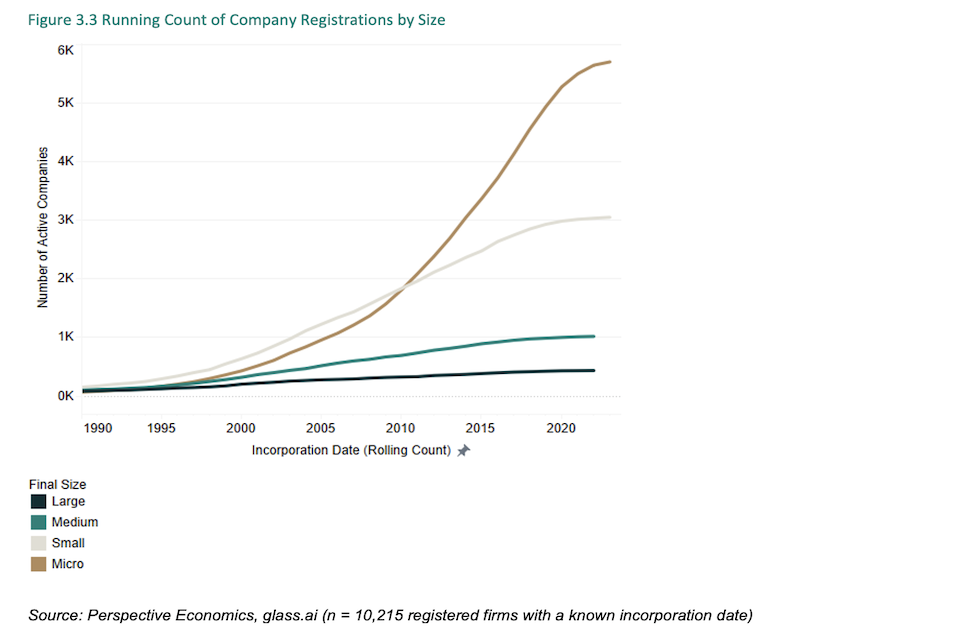
Source: Perspective Economics, glass.ai (n = 10,215 registered firms with a known incorporation date)
3.3 Product and service offering of MSPs
As set out in Section 2.2, the research team has collated trading descriptions, and reviewed company websites to identify the range of products and services provided by MSPs in the UK. This is not exhaustive; however, it can be seen to broadly capture the range of services provided by UK MSPs. As this research concentrates on identifying ‘managed services’ with an ongoing element, this has the effect of increasing coverage for areas such as infrastructure management (mentioned by 71% of firms). This includes where managed providers are supporting organisations with areas such as IT service requests or incident management (e.g. raising tickets for ensuring staff have access to IT devices) or configuration management (e.g. ensuring sufficient software, licencing and updates are in place).
However, it is interesting to note that 60% of providers typically mention some form of cloud solution on their website – typically covering cloud migration, implementation or managed cloud solutions. It is also common to see firms mentioning direct relationships with vendors such as Microsoft (Azure), Google (Google Cloud Platform), and Amazon Web Services (AWS). The role of partnerships is explored in further detail in Section 6.
Further, 30% of providers mention some form of managed security provision. This figure is higher than that set out in the UK Cyber Security Sectoral Analysis (which typically focused on security vendors or accredited service providers) – and highlights the importance of security provision – either directly or via a third-party, as part of MSP offering.
Figure 3.4 Taxonomy breakdown
| IT Infrastructure Management | 71% |
| Cloud Computing | 60% |
| IT Service Management | 57% |
| Managed Security Services Providers (MSSPs) | 30% |
| Communications | 26% |
| IT Consulting | 24% |
| Compliance and Risk Management | 23% |
| Application and Hosting | 17% |
| IT Outsourcing | 8% |
Source: Perspective Economics, glass.ai (n = 11,492 providers classified based on keywords and trading descriptions)
Figure 3.5 Key products and services: word cloud
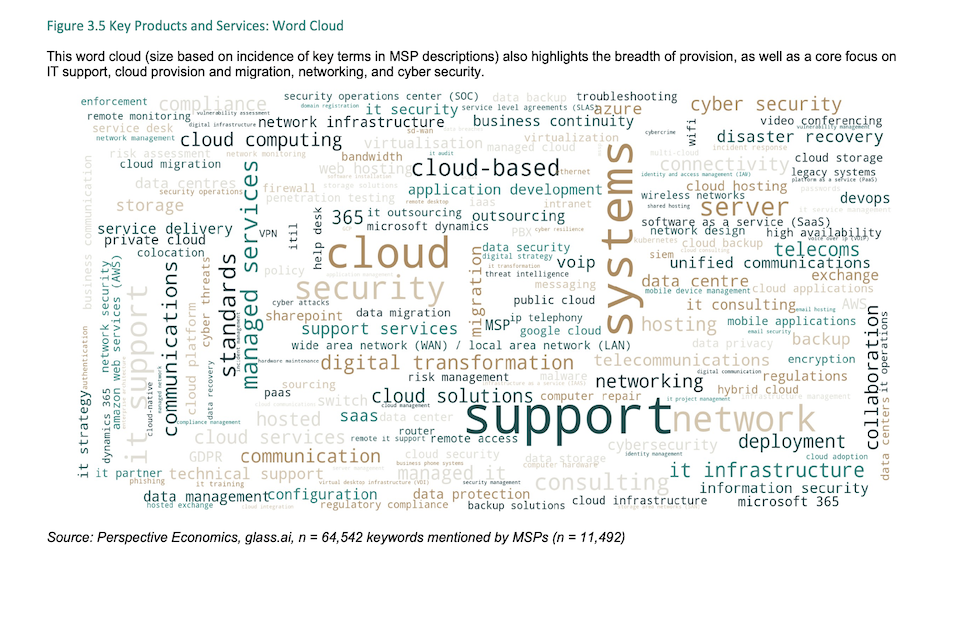
This word cloud (size based on incidence of key terms in MSP descriptions) also highlights the breadth of provision, as well as a core focus on IT support, cloud provision and migration, networking, and cyber security.
Source: Perspective Economics, glass.ai, n = 64,542 keywords mentioned by MSPs (n = 11,492)
Figure 3.6 also highlights the key products and services mentioned by MSPs (based on language extracted from web data). Several terms have been classified into sub-taxonomy areas, and as anticipated – we find that IT support and helpdesk and managed IT are the most commonly cited service offerings (57%, and likely higher in reality due to incidence of terms used).
Providers also commonly mention provision of cloud services (53%) including support with migration, implementation and storage, commonly with partners such as Microsoft Azure / Microsoft 365, AWS, or Google Cloud Platform. Support with network infrastructure and servers (28%) is the fourth most commonly mentioned provision, alongside provision of managed security (26%) – explored further in Section 6. This list is indicative of the services offered due to the nature of text data; however, it provides an indication of the scale of services offered by MSPs.
Figure 3.6 Key products and services: percentage mentioned by MSPs
| IT Support and Helpdesk | 57% |
| Managed IT | 57% |
| Cloud Services | 53% |
| Networking and Servers | 28% |
| Managed Networks | 26% |
| Managed Security Services Providers (MSSPs) | 26% |
| Communications | 17% |
| IT Consulting | 16% |
| Compliance and Risk Management | 13% |
| Domain Hosting | 13% |
| MSP | 11% |
| Wide Area Network (WAN) / Local Area Network (LAN) | 10% |
| Telecommunication and Network Support | 10% |
| Cloud Provision / Managed Cloud Services | 8% |
| Digital Transformation | 8% |
| Regulatory Compliance | 8% |
| IT Outsourcing | 8% |
| Data Storage | 7% |
| Collaborative Solutions (e.g. 365, SharePoint) | 6% |
| IT Strategy and Roadmaps | 5% |
Source: Perspective Economics, glass.ai, n = 11,492
3.4 Dedicated and diversified provision (and overlap with other sectors)
3.4.1 Dedicated and diversified
Within this research, we attempt to categorise firms by whether they are either:
-
Dedicated (or ‘pure-play’), i.e., most (>75%) of the business’ revenue or employment can be attributed to the provision of IT managed services
-
Diversified, i.e., less than 75% of the business’ revenue or employment can be attributed to the provision of IT managed services
We have used the following data (where available) to estimate this marker:
-
The use of glass.ai web data where the following calculation is applied:
-
(Estimated Number of Staff in IT service roles) / (Estimated Number of Staff in UK operations) = Percentage
For large businesses, we also undertake a manual review of the trading description and structure to apply a ‘dedicated’ or ‘diversified’ marker. Where limited web data or company accounts data is available, we assume that the majority of micro firms are likely to be ‘dedicated’ focused on supplying managed services only.
We estimate that just over half (53%) of managed service providers are ‘dedicated’ in scope (i.e. they focus primarily on IT service provision), with the remaining 47% ‘diversified’ (i.e. they offer other products or services in addition to managed services, such as hardware or telecommunications infrastructure, or wider consultancy services).
Figure 3.7 Dedicated and diversified provision
| Dedicated | 53% (6,053) |
| Diversified | 47% (5,439) |
Source: Perspective Economics, glass.ai, n = 11,492
Figure 3.8 explores this variable by size, and also finds that larger, medium and small firms are more likely to have ‘diversified’ characteristics (i.e. they offer managed services or aligned solutions as part of their business offering, rather than all). Section 6.2 explores the proportion of revenue generated by MSPs from managed services.
Figure 3.8 Dedicated and diversified provision (by size)
| Size | Dedicated | Diversified |
|---|---|---|
| Large | 27% | 73% |
| Medium | 10% | 90% |
| Small | 18% | 82% |
| Micro | 76% | 24% |
Source: Perspective Economics, glass.ai, n = 11,316 with an estimated size and provision marker
3.4.2 MSPs and adjacent sectors
As Managed Service Providers (MSPs) typically focus on the management, monitoring and maintenance of IT infrastructure and systems – this means that there is a considerable overlap between the MSP ‘sector’ and areas such as cloud, telecommunications, data centres, and cyber security. As many businesses have moved their IT infrastructure into cloud platforms, MSPs must typically offer solutions that help them to manage and secure an array of storage, compute, and communications approaches.
As such, we have identified four main areas of sectoral overlap – where either large infrastructure providers offer managed services, or where Managed Service Providers may already have characteristics of these other sectors (e.g. Managed Security Service Providers).
These include:
-
Cloud: We have sought to identify where firms either offer cloud infrastructure services directly (typically covering larger providers such as AWS and Microsoft), or more broadly – where firms are mentioning use or development of cloud-based products (typical under Platform-as-a-Service (PaaS) or Software-as-a-Service (SaaS) models, or are implementing cloud solutions on behalf of other parties e.g. cloud migration solutions. We have identified 44 infrastructure providers, and 4,942 firms mentioning cloud products more broadly.
-
Telecommunications: We have identified 687 providers of telecommunications products and services within the MSP dataset. This includes some of the largest businesses such as BT and Vodafone which also offer managed services to customers, as well as broader managed communication providers.
-
Cyber security is a significant area of demand by businesses and organisations in receipt of managed services. This can include managed security (e.g. managed SOCs, monitoring and incident response), or where broader IT support organisations are supporting with basic provision such as installing firewalls, user controls, or backups. We have identified 2,992 organisations mentioning they provide managed security, or use third party security.
This analysis is extracted from review of company web data and descriptions. The figures set out above set out where sufficient detail has been identified by glass.ai to consider the business to be aligned to one (or more) of the following sectors; however, this relates to the MSPs identified within this study only – it does not capture the ‘full estimate’ of each sector’s potential breadth.
For the 11,492 MSPs identified within this study, the research suggests the vast majority will not directly be impacted by the proposed NIS regulations for managed services. Further, many MSPs are also likely to currently undertake a range of security controls and checks (e.g. Cyber Essentials Plus, ISO27001), or may already be impacted by NIS regulations as Relevant Digital Service Providers.
As set out previously, based upon this data and size estimates, we estimate that between 1,500 – 1,700 MSPs could potentially be in scope of the NIS regulations.
We also estimate that up to 600 of these may already be captured under existing cloud provision to their customers, suggesting an additional 900 – 1,100 large and medium-sized MSPs may need to consider the impact of regulatory compliance under NIS.
4. Location of UK MSPs
This chapter explores the registered location (i.e., where each business has located its registered address with Companies House), and the active office locations (i.e., where each business has a trading presence or office across the UK) of MSPs.
Understanding the trading locations of firms in the UK enables regional analysis and supports the evidence-based identification of notable clusters or hotspots of activity. We have identified 19,064 UK office locations for the 11,492 firms identified within this study. In other words, on average, each firm has approximately two office locations across the UK (of which, one will be a ‘registered’ location with Companies House).
We have also identified over 10,000 additional non-UK offices for these firms, which we explore in Section 4.2.
4.1 Location of UK MSPs
Figure 4.1 sets out the breakdown of firms by number of UK office locations identified in each of the twelve regions. This highlights that just over half (52%) of offices are based outside of London and the South East of England. However, the regional distribution (at an office level) is relatively similar to wider business demography.
Figure 4.1 Number of MSP offices across the UK regions
| Region | All Offices | Registered |
|---|---|---|
| London | 28% | 28% |
| South East | 20% | 21% |
| North West | 9% | 9% |
| East of England | 9% | 9% |
| South West | 7% | 7% |
| West Midlands | 6% | 7% |
| Yorkshire and the Humber | 6% | 5% |
| East Midlands | 5% | 5% |
| Scotland | 5% | 4% |
| Wales | 2% | 2% |
| North East | 2% | 2% |
| Northern Ireland | 1% | 1% |
Source: Perspective Economics, glass.ai, n = 10,292 registered, n = 19,064 (all offices)
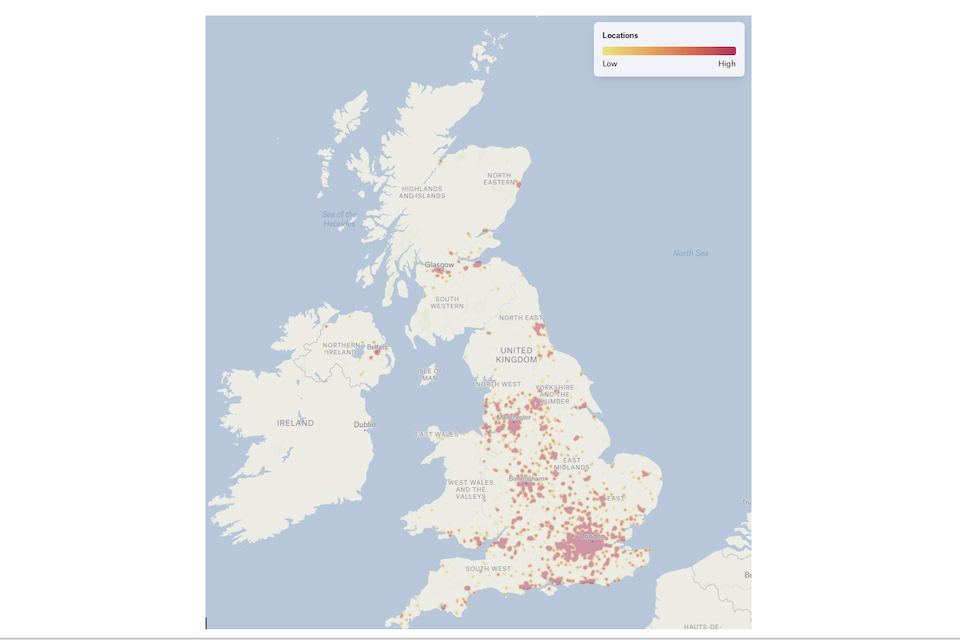
Figure 4.2 also highlights the number of active offices by Travel to Work Area, and identifies hotspots in areas such as London, Manchester, Reading, Leeds, Bristol and Cambridge.
Figure 4.2 Heatmap of MSP offices (by Travel to Work Area)
Source: Perspective Economics, glass.ai, n = 19,064 (all offices)
4.2 Cluster analysis
The distribution of Managed Service Providers across the UK provides an interesting insight into areas of particular concentration. Further, the data may also support analysis where MSPs are less concentrated than the national average, which may have implications for how organisations across the UK can access managed service provision for their IT systems.
Table 4.1 highlights the top Travel to Work Areas[footnote 9] with respect to the identified MSP office count (both in absolute number of offices) and relative to the estimated local unit count[footnote 10]. We calculate Location Quotients for each area – a LQ of 1 means the count of offices is expected relative to the national average, a LQ>1 means there is a higher concentration of MSPs compared to the national average. We calculate LQs for any area with more than 100 offices.
This data highlights that London, Manchester, Slough and Heathrow, Reading and Birmingham have the highest volume of active MSPs. However, relative to business population, there are significant clusters evident in Reading (2.5x the national average), Basingstoke (2.3x), Milton Keynes (1.9x), Guildford and Aldershot (1.8x) and Leeds (1.6x).
This highlights the importance that many MSPs place upon locating offices within geographies with accessibility and reach to national clients – to be in a position to serve wider geographies and sectors.
Table 4.1 Number of MSP offices by Travel to Work Area (TTWA) (Absolute Rank by number, and relative rank by Location Quotient)
| Top Travel to Work Areas (TTWAs) by Count | Count of MSP offices | Top Travel to Work Areas by Relative Concentration of MSPs (Rank) | Location Quotient[footnote 11] |
| 1. London | 5,285 | 1. Reading | 2.5 (472) |
| 2. Manchester | 955 | 2. Basingstoke | 2.3 (179) |
| 3. Slough and Heathrow | 746 | 3. Milton Keynes | 1.9 (246) |
| 4. Reading | 472 | 4. Guildford and Aldershot | 1.8 (410) |
| 5. Birmingham | 437 | 5. Leeds | 1.6 (362) |
| 6. Guildford and Aldershot | 410 | 6. Bournemouth | 1.6 (158) |
| 7. Leeds | 362 | 7. London | 1.5 (5,285) |
| 8. Bristol | 329 | 8b. Brighton | 1.5 (178) |
| 9. Cambridge | 291 | 9. Leamington Spa | 1.5 (145) |
| 10. Luton | 291 | 10. High Wycombe and Aylesbury | 1.5 (229) |
| 11. Crawley | 288 | 11. Edinburgh | 1.4 (247) |
| 12. Glasgow | 278 | 12. Bristol | 1.3 (329) |
| 13. Edinburgh | 247 | 13. Crawley | 1.3 (288) |
| 14. Milton Keynes | 246 | 14. Slough and Heathrow | 1.3 (137) |
| 15. High Wycombe and Aylesbury | 229 | 15. Manchester | 1.3 (955) |
| 16. Warrington and Wigan | 208 | 16. Stevenage and Welwyn Garden City | 1.2 (137) |
| 17. Newcastle | 208 | 17. Cambridge | 1.2 (291) |
| 18. Oxford | 205 | 18. Luton | 1.2 (291) |
| 19. Belfast | 204 | 19. Swindon | 1.2 (142) |
| 20. Southampton | 195 | 20. Portsmouth | 1.2 (156) |
Source: PE analysis of glass.ai location data
Further review of the TTWA data also highlights that cities such as Birmingham (1.0), Glasgow (1.0), Newcastle (1.0), Belfast (0.9), Cardiff (0.9), Sheffield (0.9) have MSP concentrations in line with the national average. This may suggest capacity is as expected within these areas; however, may also bring challenges in future should regulation increase demand for MSPs within these geographies around skills, capacity, and growth constraints.
We also note some geographies have a lower concentration of MSPs than the national average, including Norwich (0.8), Leicester (0.7), Coventry (0.7), Liverpool (0.6) and Wolverhampton (0.6). Whilst managed services are typically mobile, this may represent that these areas may have lower demand for such services.
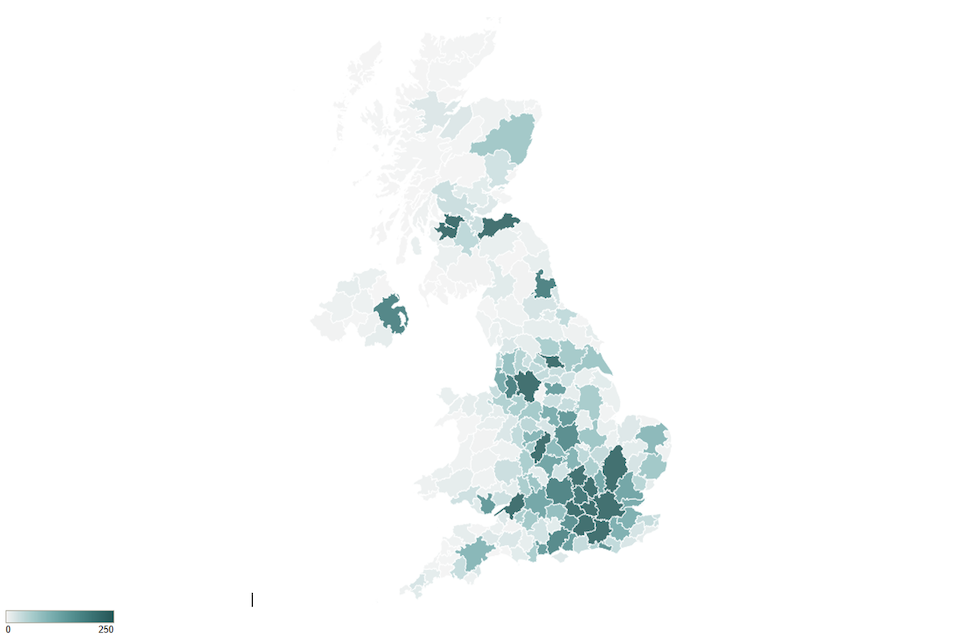
Figure 4.3 provides a further heatmap of all UK MSP offices, highlighting areas of high density for office locations.
Figure 4.3 Heatmap of MSP offices
Source: Perspective Economics, glass.ai, n = 19,064 (all offices)
4.3 International offices
This section outlines where UK registered MSPs have an established physical presence in another country. This helps to inform a further understanding of where firms are exporting, are engaged in international markets, or where multinational firms have a presence in the UK. For the MSPs in scope, we have identified:
-
928 firms headquartered outside of the UK, with a physical presence in the UK
-
1,392 UK-headquartered firms with a physical presence in international markers
This means that of the 11,492 firms identified within this study:
-
92% are headquartered in the UK, and 8% (928 firms) are headquartered elsewhere, but have a physical presence in the UK (see Fig 4.4) . There is particularly strong evidence of inward investment in managed services by firms from the United States, Ireland, Australia and India.
-
This highlights the importance of international trade and inward investment for the MSP sector as it means that 928 international firms have invested in the UK – bringing significant employment and growth. Indeed, these 928 firms employ an estimated 119,000 FTEs in the UK, which means approximately two in five MSP related roles in the UK are backed by FDI activity.
-
Export activity is also important for UK MSPs. We estimate that 13% of UK headquartered firms (1,392 out of 10,564) appear to have a physical presence in other countries. This suggests that UK firms have a significant export opportunity to sell managed services and solutions globally, and establish global partnerships with other vendors.
Figure 4.4 highlights the number of internationally headquartered MSPs (top 12 countries) with a UK presence.
Figure 4.4 International firms with a physical presence in the UK MSP market (FDI)
| United States | 46% (427) |
| Ireland | 8% (75) |
| Australia | 6% (55) |
| India | 6% (52) |
| France | 4% (35) |
| Germany | 3% (32) |
| Canada | 3% (29) |
| Netherlands | 2% (23) |
| Switzerland | 2% (19) |
| Belgium | 2% (17) |
| South Africa | 2% (15) |
| Sweden | 2% (15) |
| Spain | 1% (11) |
| Singapore | 1% (10) |
| Finland | 1% (9) |
| UAE | 1% (9) |
| Italy | 1% (8) |
| Norway | 1% (7) |
| New Zealand | 1% (6) |
| Estonia | 1% (5) |
| Hong Kong | 1% (5) |
| Israel | 1% (5) |
| Pakistan | 1% (5) |
Source: Perspective Economics, glass.ai, n = 928 firms headquartered outside of the UK, with a physical presence in the UK
Figure 4.5 also highlights the mutual trading relationship between the UK and countries such as the United States, India, Australia, Ireland and Canada with respect to managed services activity – as almost 1,400 UK headquartered firms have a physical presence within these geographies. These are typically driven by large and medium-sized firms with the ability to scale or serve clients globally.
Figure 4.5 also identifies potential opportunities for UK firms across the European Union, as well as Singapore, South Africa, United Arab Emirate, and across Asia-Pacific.
Figure 4.5 UK Firms with a physical presence in international markets (external)
| United States | 49% (680) |
| India | 18% (245) |
| Australia | 13% (177) |
| Ireland | 10% (139) |
| Canada | 9% (125) |
| Germany | 9% (119) |
| Netherlands | 7% (92) |
| Singapore | 6% (90) |
| South Africa | 6% (83) |
| France | 5% (73) |
| United Arab Emirates | 5% (72) |
| Spain | 5% (69) |
| Poland | 4% (49) |
| Hong Kong | 3% (38) |
| Sweden | 3% (37) |
| Italy | 2% (33) |
| Malaysia | 2% (33) |
| Pakistan | 2% (33) |
| Bulgaria | 2% (28) |
| Japan | 2% (28) |
Source: Perspective Economics, glass.ai, n = 1,392 UK HQ’d firms with a physical presence in international markets
5. Economic contribution of UK MSPs
5.1 Estimated revenue
In the most recent financial year, annual MSP related revenue within the sector is estimated at £52.6 billion. This relates to Managed Service Provider activity only, and is a baseline estimate derived from data modelling.
This figure is estimated using:
-
Identification of reported revenue for all identified MSP firms that publish annual accounts to Companies House. Using accounts data, we find 1,575 companies with full accounts reporting £255.2 billion in annual revenue.
-
Use of estimated revenue using the BvD FAME platform, with 8,630 firms estimated with combined revenue of £22.2 billion. This typically covers firms with a small or micro presence, where they do not have to disclose revenue within their public Companies House annual accounts.
-
This suggests a combined revenue of £277.5 billion for all firms in scope. However, we recognise that not all of this revenue will relate to this provision of managed services. We therefore have estimated ‘MSP related revenue’ on a firm-by-firm basis, accounting for the estimated number of people working in IT related roles in the UK for these companies divided by the total estimated number of people working in the UK. This percentage is applied to each firm to estimate MSP related revenue.
-
This data suggests that approximately 19% of revenue comes from managed services. However, this is skewed by the volume of very large multinationals with very high revenues, of which managed services are a small proportion. A study by Datto (2020)[footnote 12] also suggests that (based on survey data) that for MSPs, the median proportion of income derived from managed services in EMEA markets is 31%-50%. As such, this validates the approach of proportioning revenue for these businesses.
-
Where further gaps exist (e.g. no revenue data available), employment has been sourced or estimated with web data. Revenue has been estimated using average ‘revenue per employee’ (estimated by size bracket) multiplied by ‘number of employees’ to provide an estimated revenue figure on a firm-by-firm basis.
-
This means that all 11,492 firms identified have an estimated total revenue, and estimated MSP related revenue figure. This is used to estimate combined sectoral revenue, employment and GVA – however, we note the challenges in estimating data at this level in absence of full accounts, survey data, or standardised definitions of scoping MSP activity. This does however, provide a useful baseline for understanding the size and scale of MSP provision across the UK market.
Please note that as the analysis was undertaken in late 2023. We use the most recent financial year reporting data where possible, which means that much of the revenue will have been achieved through work delivered and billed in 2022 (e.g. if a company has a financial year ending March 2023, those accounts will reflect billed work from April 2022 – March 2023).
5.1.1. Revenue by firm size
We estimate that just under three-quarters (£38.8 billion, 74%) of all UK MSP related revenue is earned by large firms (n = 459). This further demonstrates the earning power of these firms given that they reflect 4% of all market providers.
This includes some of the largest known pure-play providers of managed services such as Tata Consultancy Services, Capgemini, Computacenter, SCC, CGI, HCL Technologies, and Sopra Steria – as well as wider firms such as IBM, BT, Fujitsu, Accenture, Microsoft, Atos, PwC, and Oracle.
Figure 5.2 also highlights the significance of managed services as a revenue stream among diversified firms – whereby consultancies, telecoms providers, data centres, and infrastructure providers have also moved into providing managed IT services to their customers.
We estimate that 16% (£8.4 billion) of annual revenue is earned by medium-sized firms (n = 1,052). This includes some significant mid-sized firms such as 6point6, Waterstons, Wanstor, and Aspire Technology Solutions.
This means that large and medium firms collectively earn 92% of sectoral revenue. We estimate that MSP related revenue for large firms on average was £84.6 million in the most recent financial year, with a median value of £26.4 million. For medium firms, on average, we estimate this figure was £8 million, with a median value of £6.4 million.
Small firms (n = 3,182) generated an estimated £3.8 billion (7%) of all UK MSP related revenue, with an average of £1.2 million per firm (median £1.1 million). Micro firms (n = 6,623) generated an estimated £1.5 billion (3%) of revenue, with an average and median figure of c. £220,000 per firm.
This highlights the significant variance in revenue by type of firm, and highlights the potential impact of regulation by size of firm.
Figure 5.1 MSP related revenue by size
Source: Perspective Economics, n = £52.6 billion of MSP related revenue
Figure 5.2 also highlights the MSP related revenue by size and dedicated / diversified marker. We estimate that of the £52.6 billion in MSP related revenue, £17.5 billion (33%) is generated by dedicated firms, and the remaining £35.1 billion (67%) by diversified firms.
This is driven by a few factors, including:
-
There are only 124 large ‘dedicated’ MSPs generating £15.1 billion MSP related revenue (average of £122 million), compared to 335 ‘diversified’ MSPs in scope generating £23.8 billion (average of £71 million). This highlights that managed services are a core component of revenue generation for both a smaller number of dedicated providers, as well as hundreds of wider providers covering domains such as IT hardware, consultancy, and telecoms.
-
There are 110 medium ‘dedicated’ MSPs generating £1.3 billion (average of £11 million) in MSP related revenue and 942 ‘diversified’ MSPs generating £7.2 billion in MSP related revenue (average of £8 million). Whilst MSP related revenues per firm are similar, there are a much wider array of medium sized firms providing IT managed services among other products and services.
-
This is similar for small firms, with 578 ‘dedicated’ firms generating £345 million in revenue (average of £600,000), compared to 2,604 ‘diversified’ firms generating £3.5 billion (average of £1.3 million).
-
We identify 5,065 ‘dedicated’ micro MSPs with combined MSP related revenue of £860 million (average of £170,000), compared to 1,558 diversified firms with combined MSP related revenue of £626 million (average of £400,000). The majority of these dedicated MSPs will typically have one or two members of staff, and reflect a large volume of micro MSPs operating in the UK.
However, due to the experimental nature of this research (whereby each firm is classified into ‘dedicated’ or ‘diversified’ based on headcount and descriptions from web data), we do recommend these segmentations are treated with caution and indicative only.
Figure 5.2 MSP related revenue by size and dedicated/diversified marker
| Size | Dedicated | Diversified |
|---|---|---|
| Large | £15.1 billion | £23.8 billion |
| Medium | £1.3 billion | £7.2 billion |
| Small | £0.3 billion | £3.5 billion |
| Micro | £0.9 billion | £0.6 billion |
Source: Perspective Economics, n = £52.6 billion of MSP related revenue
5.2 Estimated GVA
Gross Value Added (GVA) is used as a measure of productivity (at a firm level, or above). It captures the sum of a firm’s Gross Profit, Employee Remuneration, Amortisation and Depreciation.
This is a measure of the performance of a firm or a sector, as evidenced through profitability and earnings. We estimate that within the most recent financial year, MSP related GVA (for the 11,492 firms) is approximately £29.1 billion. This data suggests a GVA-to-turnover ratio of 0.55:1 (i.e. for every £1 of revenue the sector generates, 55p of direct GVA[footnote 13] is generated).
Similar to revenue composition, we estimate that 75% of GVA is generated by large firms, followed by 15% for medium firms, 7% for small firms, and 3% for micro firms. Further, we estimate that 33% of GVA (£9.7 billion) is generated by dedicated firms, and £19.4 billion (67%) by diversified firms.
Figure 5.3 outlines the estimated MSP by size, and Figure 5.4 highlights the relationship between revenue and GVA among MSPs by size. This suggests slightly higher productivity within larger firms (0.57:1) than other size brackets, as expected within similar studies.
However, the GVA-to-turnover ratios for medium, small and micro firms are typically robust, as MSPs are focused on scalable service provision with standardised vendor relationships and agreed rates or fixed fees with clients. This means that remuneration and profitability are relatively strong across a range of providers.
Figure 5.3 MSP related gross value added (GVA) by size
| Large | £21.9 billion (75%) |
| Medium | £4.4 billion (15%) |
| Small | £2.0 billion (7%) |
| Micro | £0.8 billion (3%) |
Source: Perspective Economics, n = £29.1 billion in GVA
Figure 5.4 MSP related revenue and GVA by size
| Size | Estimated MSP related revenue | Estimated MSP related GVA |
|---|---|---|
| Large | £38.8 billion | £21.9 billion |
| Medium | £8.4 billion | £4.4 billion |
| Small | £3.8 billion | £2.0 billion |
| Micro | £1.5 billion | £0.8 billion |
Source: Perspective Economics, n = £52.6 billion in revenue, and £29.1 billion in GVA
5.3 Estimated employment
We estimate that there are 294,340 Full Time Equivalents (FTEs) working in an IT related role within the 11,492 Managed Service Providers identified. This figure only relates to those working either within a dedicated MSP, or those working in an IT role (with a front-facing element) within a diversified MSP provider. This figure also relates to UK employment only. This estimate is based on use of company accounts level data where available for dedicated firms, and the use of glass.ai web data – identifying how many individuals work in these companies in the UK in IT-related roles.
This is an experimental relative estimate, given the breadth of services in scope – however, we note that accounts data suggested over 1.05 million individuals are employed by these firms in total (across all roles) and web data suggested over 660,000 individuals are based within the UK. These are two different datasets, and have respective strengths and disadvantages for estimating company size. As such, we have applied proportional estimates to all firms based on the best data available for each firm to estimate the size of relevant ‘MSP’ activity, and proportional estimates are applied to UK employment figures where available. We estimate that:
-
Large companies drive the majority of MSP related employment, employing over 195,000 people in the UK (66% of the sector). The largest ten firms (by employment) employ approximately a third of these roles (65,000) – consisting of multinationals such as BT, Tata, Capgemini, IBM, Fujitsu, Accenture, Capita, Cognizant, and DXC.
-
Medium companies employ approximately 51,000 individuals in the UK. This is a significant figure – and is slightly higher than the entire AI sector employment estimate within the 2023 AI Sectoral Analysis. This highlights the importance of ‘middle-market’ MSPs to the wider UK economy.
-
Small firms are also significant employers with the 1,052 small firms employing almost 35,000 individuals. On average, small firms have 33 employees, with a median estimate of 10 employees. As such, regulation could have a much higher proportional impact upon the median firm, compared to average size.
-
There is limited data available for micro entities; however, we estimate that the 6,623 micro firms in scope employ approximately 13,667 individuals.This is equivalent to an average of two employees – indicating the prevalence of individuals and very small teams under limited company structures.
Figure 5.5 MSP related employment by size
| Large | 195,045 (66%) |
| Medium | 50,918 (17%) |
| Small | 34,710 (12%) |
| Micro | 13,667 (5%) |
Source: Perspective Economics, n = 294,340 FTE employees
Figure 5.6 sets out employment segmented by ‘Dedicated’ and ‘Diversified’ firms. This suggests that employment is most concentrated within diversified firms with 199,897 individuals (68%), compared to 94,443 individuals in dedicated firms (32%).
Figure 5.6 MSP related employment by size and dedicated/diversified marker
| Size | Dedicated | Diversified |
|---|---|---|
| Large | 75,433 (26%) | 119,612 (41%) |
| Medium | 8,093 (3%) | 42,825 (15%) |
| Small | 2,969 (1%) | 31,741 (11%) |
| Micro | 7,948 (3%) | 5,719 (2%) |
Source: Perspective Economics, n = 294,340 FTE employees
5.4 Baseline analysis and growth rates
The nature of this study means that we can explore revenue on an estimated firm-by-firm basis to help understand sectoral revenue and growth. However, as set out previously, this is a baseline study, whereby we estimate MSP related revenue in the UK only, and there are also limitations where we must estimate proportional revenue either for larger firms with very large revenue (which may be reported in UK accounts but not relate to UK activity) or for smaller firms that do not report annual revenue.
The research team therefore has identified a sample of 551 companies that have full accounts with Companies House, and are considered ‘dedicated’ MSP firms. Following this, we have identified 184 firms that have full accounts going back up to six years (typically covering 2017 – 2022). Please note these are typically larger firms, and may be subject to outliers (e.g. where large firms acquire other businesses, or move revenues towards the UK entity). However, this provides a historic view of how the MSP market in the UK has developed in absence of a full estimated baseline.
Using this data, we find the following combined revenue and annual growth rate. In the last six years, we find that there has been continual growth – and in the majority of years, this growth has been double-digit showing high demand for IT managed services. In 2020, growth was softer at 5.9% - however, this was during the COVID-19 pandemic, and many firms had to augment business models to adjust.
Over the last six years, we estimate that the Compound Annual Growth Rate (CAGR) for UK MSPs has achieved 12% per annum. This is same rate of growth as projected by Analysys Mason’s MSP Forecast 2018-2023[footnote 14].
Table 5.1 Estimated annual growth since 2017
| Year | Revenue | Growth rate | CAGR |
| 2017 | £37.1 billion | - | - |
| 2018 | £41.7 billion | 12.4% | 12% |
| 2019 | £47.2 billion | 13.2% | 12% |
| 2020 | £50 billion | 5.9% | 12% |
| 2021 | £57.3 billion | 14.6% | 12% |
| 2022 | £65.3 billion | 14.0% | 12% |
Source: PE estimates
5.5 Market trajectory
In the most recent financial year, we estimate that annual MSP related revenue within the sector was approximately £52.6 billion. Historic analysis of known account data suggests an estimated CAGR of 12% per annum over the last five years; however, this is an industry wide estimate - with variance in performance by different MSPs.
Whilst predicting the growth rate of the IT Managed Services Market is challenging, given the limitations within the data, and wider macroeconomic and demand factors – we set out some potential growth scenarios below, and potential drivers or inhibitors to growth.
Potential growth:
We set out three potential growth scenarios for the UK MSP market. We recognise that, despite significant growth over the last number of years, there are wider challenges for businesses and IT spend, which we set out in the next section. Further, this growth rate is nominal and does not account for inflation. As such, we set out three scenarios as below:
-
Low: 5% CAGR
-
Medium: 8% CAGR
-
High: 12%
We assume in the chart below that 12% CAGR for the next five years may be a high-growth scenario, given the increasing absolute levels of revenue, and potential for some natural slow-downs if certain providers reach a certain scale of delivery. However, applying a central rate of 8%, we estimate that the UK MSP sector could reach £77.3 billion in annual revenues by 2027 (and up to £92.7 billion should it maintain its 12% CAGR).
Figure 5.7 MSP growth scenarios (Revenue)
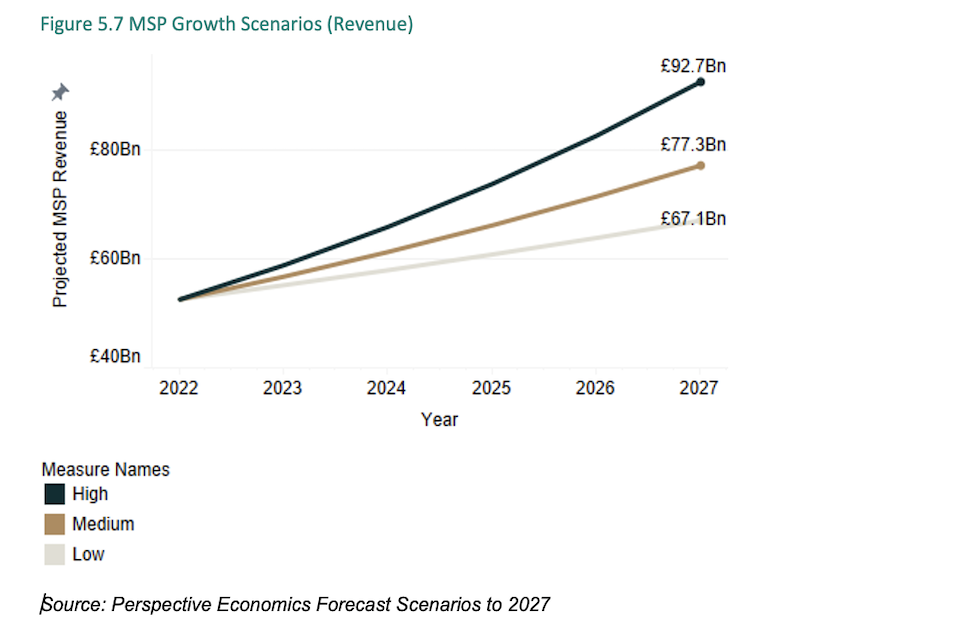
Source: Perspective Economics Forecast Scenarios to 2027
There are several drivers to consider that may impact the growth of the MSP market in the UK. We set out some of these below:
Growth drivers:
- Regulation: There are multiple ways that regulation can impact the demand for managed service provision. This may include where regulation affects the supplier base. Whilst there may be direct compliance costs, it can also benefit MSPs that adhere to regulatory climates can secure assured positions in the market, for example, through the issuing of standards.
Within the UK, this will also shape new markets – particularly where buyers require confidence of compliance (or ability to serve demand) with key regulations and/or standards such as GDPR, Data Protection Act (2018), the NIS Regulations, Cyber Essentials, or other emerging regulations regarding data security in areas such as telecoms, supply chains, or finance.
The MSP landscape is a competitive one in the UK, with 11,492 providers. There may be competition implications should large and medium MSPs come under the NIS regulations, with varying impacts. As such, the dynamic nature of the regulatory landscape will respond to wider challenges such as new technologies and emergent threats. Responsive and proactive regulation should support MSPs (where in scope) to ensure they are adaptive to the needs of their client base.
-
Digital transformation: The rise in demand for digital transformation aligns closely with the capabilities of several MSPs identified within this study. As set out in Figure 3.6, digital transformation services are a core part of many MSP offerings, and there is considerable demand for expertise in integrating and managing infrastructure that can be brought into place as a result of digital transformation projects. Further, due to the relationship that many MSPs have with preferred cloud partners, many UK MSPs can offer a range of scalable solutions to buyers, with ongoing support. As such, this is a key revenue stream for growth.
-
Increased use of new technologies, including AI, edge, and cloud computing: There is considerable change underway with how organisations build and maintain their IT infrastructure. This rapid technological innovation provides an opportunity for MSPs to provide new services, such as integrating AI solutions, and moving storage and compute functions to cloud infrastructure; however, this also brings challenges for organisations with respect to cost, scale, and optimisation. As such, there is a sustained role for MSPs to help organisations navigate complexity, and understand their IT systems, whilst providing strategic support and guidance.
-
Cyber security: MSPs play a significant role in securing UK organisations, due to their scale and reach. With over 11,000 MSPs in the UK, there are hundreds of thousands of organisations within the supply chain of these providers – and receive IT support, often including cyber security and backup provision. Many clients are increasingly required to demonstrate cyber security compliance to their end customers (e.g. ISO27001 or Cyber Essentials), and there is a considerable role for MSPs within this area. Further, there is an increasing role for Managed Security Service Providers (MSSPs), and within this study, we have identified over 3,000 providers clearly mentioning security provision within their website offer. We explore this in further detail in Section 6.3; including the scale of security provision drawing upon wider research and the DSIT Cyber Security Breaches Survey.
Challenges:
-
Market consolidation: Recent trends suggest a move towards consolidation within the MSP market, whereby either large entities acquire smaller providers with particular specialisms, or where small and medium providers merge to develop a shared offering. This may provide a challenge to smaller MSPs – whereby the wider ecosystem is shaped by relationships between larger MSPs and dominant cloud and software providers – with an acquisition-driven nature, or whether they choose to maintain existing independent structures. This may have implications for end-customers, particularly for micro and small businesses where costs may shape their interaction with MSPs.
-
Cost of compliance: As mentioned above, the increasing nature of regulatory governance in respect of IT provision and security standards may place compliance costs upon MSPs in scope. In addition, many providers may be expected by clients to adhere to certain standards as regulation embeds across the sector, regardless of size.
-
MSPs as a threat vector: MSPs play a critical role in the security of UK organisations. However, as trusted partners to hundreds of thousands of UK organisations, they commonly have access privileges to client infrastructure, and securing and providing user rights to compute and storage functions. As such, MSPs are a high-value target for cyber-attacks – both due to the potential for ransomware (cost to third-parties, reputational damage etc), and the data held, as well as access to third-parties[footnote 15]. Many large organisations are also becoming victim to third-party data breaches – where vendor breaches result in direct exfiltration of their own customer data. As such, supply chain security is a critical component of securing the economy and society.
-
Skills challenges: MSPs also face skills challenges, and must continuously upskill their [footnote 16]. This includes technical knowledge and ability to design and implement solutions in a secure and effective way. There is a tangible breadth in the range of roles that MSPs recruit for, including solutions architects, system administrators, network engineers, help desk technicians, account managers, cyber security analysts, incident response, and sales and marketing roles. However, as shown in Chapter 5, these MSPs employ over a quarter of a million people in the UK – and have a key role as a major sector for employment.
-
Economic factors: There are a number of wider economic challenges that may impact the MSP market. More directly, these relate to softening levels of investment and acquisition activity as of 2023, where higher interest rates may deter investment. Further, any potential downward pressure on the tech landscape, such as an economic downturn, or reduced investment more generally may result in cost-cutting exercises, as firms seek to reduce labour costs and improve efficiencies. Customers may also seek to reduce costs of licencing and serviced IT support where possible.
However, Managed Service Providers should be in a position of relative strength, as much of this revenue stems from provision of essential IT services, underpinned by areas such as storage, maintenance, backups and security – which can not be easily reduced, and typically are expansionary as data scaling grows. MSPs also typically offer scalable solutions and can adapt to client requirements whilst maintaining sufficient margins.
5.6 External investment
The role of external investment is a crucial one for many IT companies. As technologies evolve and the market shifts, this can often require capital to develop new products, increase marketing, and build teams.
This capital can come through several routes. For some innovative firms seeking to bring a product to market, often external investment from Venture Capital will be the best route – to sell equity in exchange for capital used to grow the firm’s reach and secure additional revenue and profitability. However, for Managed Service Providers, many companies are well-established and may use existing streams of retained profit (either directly or from a parent company), work with innovative partners to fuel growth, or use external finance such as loans.
This section explores:
-
The incidence of MSPs raising external investment from VCs or angel investors (using Beauhurst data)
-
The forms of financing used by MSPs such as loans (using review of charges against registered companies through Companies House)
This finds that, given the focus on service provision and relationships with existing vendors, external investment is much lower (as anticipated) in this sector than other technology sectors of focus such as cyber security, FinTech, or AI. However, wider statistics on revenue and GVA suggest there is sufficient resilience within providers to fund growth on a sustainable basis. There may be opportunities for further mergers and acquisition activity among existing MSPs (e.g. where MSPs agree to merge to boost scale, or where acquisition may bring economies of scale), which may be an area of sustained interest for private equity firms.
5.6.1 External investment (fundraisings)
This section draws upon the Beauhurst platform which tracks announced and unannounced investments in high-growth companies from across the UK. Our team has matched Company Registration Numbers and Company Names identified within this current analysis with the platform to identify 335 fundraisings associated with 129 dedicated MSPs. Please note we only match against dedicated MSPs to avoid overlap with other technology domains (e.g. where investment in AI or cyber security may skew the figures).
In other words, approximately only 2%[footnote 17] of dedicated MSPs identified within our analysis have received some form of external investment through fundraising in the last decade.
Figure 5.8 sets out the investment raised by dedicated MSPs since 2014. On average, there are approximately 30 fundraisings per annum for dedicated MSPs, with an average of £34 million raised per annum. The volume of investments has remained relatively constant over the last decade, with some significant investments including Claranet (£80 million in 2017), Stellium (£30 million in 2019), and FusionExperience (£29.4 million in 2020).
Figure 5.8 External fundraising by dedicated MSPs
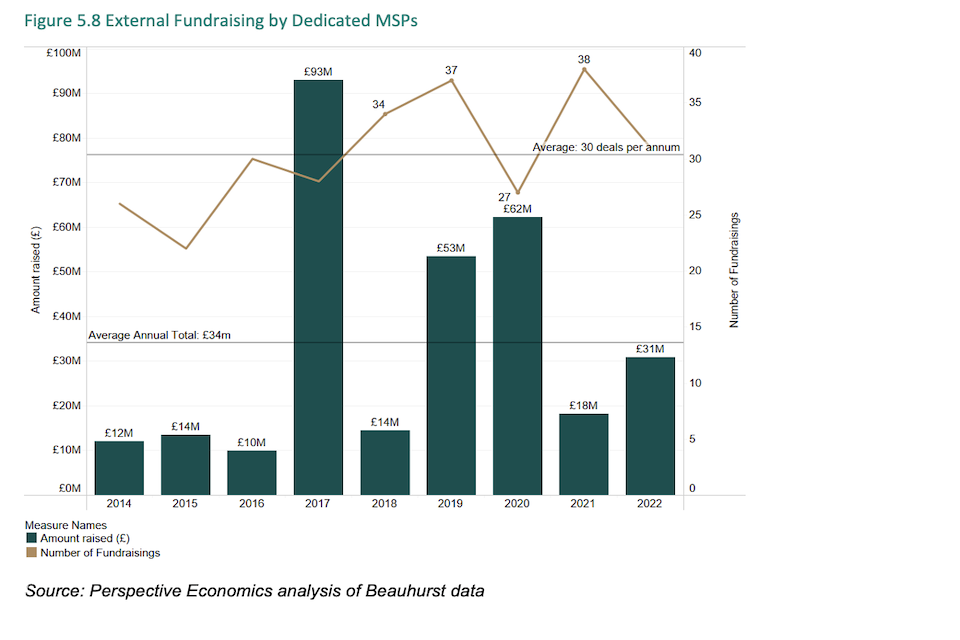
Source: Perspective Economics analysis of Beauhurst data
As there is limited external investment raised by MSPs, we subsequently focus upon an alternative measure, exploring the use of debt and loans by MSPs using charges data against the business structure as declared via Companies House.
5.6.2 Debt and charges
As several MSPs may not either be able or desire to secure equity fundraising (as above), they may use debt financing to raise capital for growth or expansion. It is possible to review Companies House data to examine companies with ‘charges’ against the registered entity.
A “charge” in the context of Companies House refers to a financial interest that a company grants over its assets to a creditor. This enables a company to secure a loan or credit against its assets. If the company defaults on these obligations, the creditor has the right to take the asset or assets covered by the charge as a form of repayment. This serves as a useful proxy to understand how MSPs are engaging with debt financing.
Of the 10,426 registered companies in scope, Companies House data suggests that 3,100 have had at least one charge since incorporation. These 3,100 companies have 9,525 charges against them, of which 5,606 are satisfied (paid), with the remainder being outstanding (currently or expected to pay down). The data suggests that there are currently 2,275 MSPs with 3,919 outstanding charges (as of August 2023). Of these, 565 are dedicated MSPs with 936 outstanding charges. This suggests that, currently, closer to one in ten dedicated MSPs are currently using some form of debt financing, and up to one in seven[footnote 18] have used debt financing at some stage.
Figure 5.9 highlights how the number of charges by MSPs (both dedicated and diversified) rose steadily over the last decade, with the highest number in 2020 and 2021. This may be partially due to the COVID-19 pandemic, as companies sought to secure external debt finance through commercial loans or business interruption loans.
Figure 5.9 Number of debt charges MSPs (since 2013)
| Year | Dedicated | Diversified | Total |
|---|---|---|---|
| 2013 | 104 | 257 | 361 |
| 2014 | 88 | 276 | 364 |
| 2015 | 96 | 295 | 391 |
| 2016 | 102 | 300 | 402 |
| 2017 | 115 | 344 | 459 |
| 2018 | 104 | 366 | 470 |
| 2019 | 109 | 391 | 500 |
| 2020 | 137 | 437 | 574 |
| 2021 | 130 | 428 | 558 |
| 2022 | 128 | 318 | 446 |
Source: Perspective Economics analysis of Companies House data (n = 4,897 charges (1,185 dedicated, 3,712 diversified))
Figure 5.10 sets out how many of the charges created for dedicated MSPs are either outstanding (to be paid off) or satisfied (have been fully paid or agreed) since they were created each year. Our analysis suggests that, for dedicated firms with a satisfied charge:
-
The average duration between when charges are created and when they are fully satisfied is approximately 7 years.
-
The median duration is 5 years.
-
This suggests MSPs are typically focused on medium-term lending provision to support growth.
Figure 5.10 Number of debt charges by dedicated MSPs – outstanding or satisfied
| Year | Satisfied | Outstanding | Total |
|---|---|---|---|
| 2013 | 80 | 23 | 103 |
| 2014 | 49 | 39 | 88 |
| 2015 | 61 | 35 | 96 |
| 2016 | 72 | 30 | 102 |
| 2017 | 80 | 34 | 114 |
| 2018 | 57 | 47 | 104 |
| 2019 | 46 | 61 | 107 |
| 2020 | 48 | 89 | 137 |
| 2021 | 32 | 97 | 129 |
| 2022 | 5 | 123 | 128 |
Source: Perspective Economics analysis of Companies House data
The charge data does not provide an indication of the amount of lending or debt secured against the business. As such, it is not possible to consider the extent of debt within MSPs, or debt appetite within the current lending climate. However, the data does provide some insight into the source of lending, using the ‘persons entitled’ within each charge marker. We find that:
-
Of the top ten lenders, six are high street banks, led by HSBC, Barclays, NatWest, Lloyds, Santander, and Virgin Money.
-
Other charges are led by direct lenders or alternative managers such as Global Loan Agency Services (GLAS), Ares Management.
-
There is also some limited use of invoice finance specialists, such as Bibby Financial Services and MarketInvoice.
This highlights that supporting MSPs with access to finance across commercial loans and mortgages (particularly to secure physical and local operations), access finance for merger or acquisition activity, or support smaller firms with invoice and cash flow management may be three areas for investment prioritisation.
5.7 Economic summary
The table below sets out the key findings regarding the estimated economic contribution of the UK’s MSP sector. We find evidence that:
-
The MSP sector in the UK comprises over 11,000 firms, with a combined estimated MSP related revenue of £52.6 billion, employment of 294,340, and GVA of £29.1 billion.
-
Large MSPs only account for 4% of providers; however, dominate the market with an estimated MSP-related revenue of £38.8 billion (74% of total). Large MSPs also employ the majority of the workforce, with 195,045 full-time equivalents (FTEs), which is about 66% of the total MSP-related employment.
-
Medium-sized MSPs receive an estimated £8.4 billion in revenue with just over 1,000 firms, employing around 50,918 FTEs.
-
There are just over 1,500 large and medium-sized MSPs (under UK registered size) potentially in scope of the NIS regulations, which collectively generate 90% of the sector’s revenue, and 83% of the employment.
-
The revenue per employee is highest in large firms, with an estimated revenue per employee of £199,074, compared to the industry average of £178,742.
-
Gross Value Added (GVA) per employee is also highest among large firms at £112,328, above the industry average of £98,775. This GVA per employee compares favourably with the wider estimated DSIT GVA per employee estimate for the wider Digital Sector of £79,400.[footnote 19]
Table 5.2 Economic summary
| Size | Number of Firms | Estimated MSP related revenue | Estimated MSP related GVA | Estimated MSP related employment (FTE) | Estimated Revenue Per Employee | Estimated GVA Per Employee |
| Large | 459 (4%) | £38.8 billion (74%) | £21.9 billion (75%) | 195,045 (66%) | £199,074 | £112,328 |
| Medium | 1,052 (9%) | £8.4 billion (16%) | £4.4 billion (15%) | 50,918 (17%) | £165,875 | £86,000 |
| Small | 3,182 (28%) | £3.8 billion (7%) | £2 billion (7%) | 34,710 (12%) | £110,896 | £57,576 |
| Micro | 6,623* (59%) | £1.5 billion (3%) | £0.8 billion (3%) | 13,667 (5%) | £108,835 | £57,576 |
| All | 11,316* | £52.6 billion | £29.1 billion | 294,340 | £178,742 | £98,775 |
6. The role of MSPs in the wider economy
Managed Service Providers (MSPs) are central to the wider economy. They play a critical role within wider supply chains, as well as support organisations to grow, scale and organise their IT infrastructure and provision. They are often a conduit between an organisation and its access to new hardware, software and solutions – for example, an MSP can integrate an organisation’s core infrastructure with a leading cloud platform, enabling that organisation to draw from hundreds of potential new solutions or packages to support growth.
They also play an important role with respect to cyber security, data storage, security, digital infrastructure – and how firms will start to interact with AI models and wider safety of users in the years ahead. This section explores the role of MSPs within the wider economy through four key areas:
-
The role of industry partnerships, and MSPs within supply chains
-
The impact of market concentration and competition
-
The importance of MSPs in cyber security outcomes
-
The role of public procurement and government as a buyer
6.1 Partnerships and supply chain activity
Partnerships are core to the MSP ecosystem; they provide MSPs with the capability and capacity to serve a wide range of clients, across an array of technical domains. This typically includes partnerships with:
-
Major cloud platforms: As set out within the Ofcom Cloud Services Market Study (2023)[footnote 20], the demand for cloud infrastructure in the UK is significant and was worth £4.5 billion to £5.0 billion in 2021. This report highlights that “There are two leading providers of cloud infrastructure services in the UK: Amazon Web Services (AWS) and Microsoft, who had a combined market share of 60% to 70% in 2021. Google is their closest competitor with a share of 5% to 10%.” This research also highlights mid-scale providers such as IBM and Oracle, and smaller providers such as OVHcloud and Scaleway. We typically find MSPs will have an existing relationship in place with at least one (or multiple) of the largest cloud providers. This may be to provide and sell cloud services as a partner, or it could also involve the MSP using that provider to build out their own cloud offering (e.g. supporting SaaS businesses). This may also link with software licencing for tools such as Office 365 (or Azure) or Google Workspace.
-
Software vendors: Many MSPs will partner with software vendors, where licences can be resold. This may include licences for core solutions such as operating systems, or office tools or security, as well as broader tools such as data analytics and business intelligence tools, or customer relationship tools (CRM) such as Salesforce.
-
Hardware providers: Many MSPs will have existing relationships with hardware providers, such as HP or Dell, to service quotes from customers for end-user devices, servers, firewalls, printers and other hardware. This also enables MSPs to install agreed ‘builds’ of operating systems (OS) for end customers, and also secure economies of scale. Increasingly, many businesses such as manufacturers also require ongoing support with IoT and OT implementation, up-time, and security.
-
Cyber security firms (including software, backups, incident response, pen testing, security awareness): The range of security threats to end customers means there is a wide array of solutions required. Many MSPs will agree partnerships with security third-parties (e.g. BitDefender) at a software level for anti-virus/firewalls, or with wider threat intelligence and monitoring firms (e.g. CrowdStrike) or Managed Detection and Response firms (e.g. Rapid7). A range of MSPs may also host their own Managed Security Service Provision (MSSP) function, including managed SOC and managed incident response to their customers. Other MSPs may also align closely with existing cloud platforms, whereby providers such as Microsoft will integrate security solutions with their cloud infrastructure (e.g. Microsoft 365 Defender).
-
Networking and telecommunications providers: There is also a notable overlap between MSPs and wider providers of network and telecommunications equipment and solutions. Many telecoms firms also provide managed services directly in this domain, for example,. Telefónica Group offers B2B services via its managed provider arm(Telefonica Tech), Virgin Media offers Managed LAN and WAN services to enterprise customers, and BT has a direct ‘BT Managed Services’[footnote 21] team that works with over 2,500 private and public sector organisations.
When scoping this study, the research team identified more than twenty of the largest cloud and IT providers globally that had a ‘Find a Partner’ link to Managed Service Providers which they worked with. This principle of partnership between vendors and MSPs works both ways – where MSPs can identify and support their customers use the most appropriate technology package, as well as vendors having assured third-party providers of their solutions which can support with implementation.
Figure 6.1 sets out the most commonly mentioned partners by MSPs within their websites. Please note this covers 2,778 MSPs with a partnership that the research team was able to parse. However, this echoes the findings from the Ofcom research regarding the significance of Microsoft and AWS, followed by Google Cloud. It also highlights how frequently Salesforce (and integration) is mentioned by providers, as well as a range of hardware and security providers.
It finds that over half (56%) of providers have a partnership (sell or resell) with Microsoft (Azure and O365), followed by 43% with Amazon Web Services.
Figure 6.1 MSP partnerships (web data)
| Microsoft Azure | 56% |
| Amazon Web Services | 43% |
| Salesforce | 19% |
| Google Cloud | 7% |
| Hewlett Packard Enterprise | 6% |
| Fortinet | 5% |
| Fujitsu | 4% |
| Dell Technologies | 3% |
| Verizon | 3% |
| IBM Cloud | 1% |
N = 2,778 MSPs with identified partnerships using web data (glass.ai)
6.2 Market concentration and competition considerations
This section explores current market concentration and competition factors. It does not provide a normative assessment on how concentrated the market is, or how the shape of the market or any potential regulation may impact competition. However, it provides an descriptive overview of the key metrics derived from this research. In addition to market concentration, several other factors presented throughout the report will be key when determining the impact on competition from bringing MSPs under the scope of the NIS Regulations. These include, but are not limited to, product offering, location, market growth rates, and revenue.
As set out within previous sections, 4% of MSPs are large but contribute to estimated MSP-related revenue of £38.8 billion (74% of total sector revenue). They also employ over 195,000 individuals (approx. 66% of all sector employment).
There are just over 1,500 large and medium-sized MSPs (under UK registered size) potentially in scope of the NIS regulations, which collectively generate 90% of the sector’s revenue, and 83% of the employment.
Further, of the >1,500 firms potentially in scope of the NIS regulations, we estimate that there is a substantial skew towards ‘very large’ entities. Whilst we estimate ‘MSP-related revenue’, we estimate that of the £52.6 billion in annual revenue generated by the sector in the most recent financial year:
-
The largest ten firms (across dedicated and diversified firms) generated an estimated £14.4 billion (over a quarter of all revenue, 27%). This includes firms such as IBM, BT, Capgemini, Computacenter, Cognizant, and Microsoft.
-
There are 31 firms generating in excess of £250 million per annum from managed service provision each year.
-
The largest fifty firms generated £26 billion (half of the sectoral revenue).
-
The largest one hundred firms generated £30.8 billion (59% of sectoral revenue).
We set out the banded estimated income ranges from managed service provision in Figure 6.2 below. These are estimated values; however, provide an indication of potential market concentration among larger providers.
This highlights:
-
Market Dominance by Leading Firms: The firms in the ‘Over £500 million’ revenue band, though reflecting only 0.1% of the total (14 firms), generate a significant 32% of the total revenue. This highlights the significant market power held by the top-tier firms, and this is seen throughout the higher bands – particularly among those earning in excess of £50 million per annum from managed services (c. 1% of all firms)
-
Large number of smaller providers: The firms in the ‘£100,000 to £250,000’ revenue band make up the largest group with 35.8% of all firms, but they contribute only 1% to the total revenue. This underscores the disparity in revenue generation among the firms. However, these smaller providers may be particularly important among SMEs and areas of lower density or lessened access to managed services (e.g. smaller towns or rural areas). We also note that due to limited revenue data, these are estimates only.
-
An important mid-market: The ‘£10 million to £50 million’ revenue band, comprises 4.1% of firms but contributes a substantial 18% to the total MSP related revenue. This indicates that mid-tier firms, while fewer in number than smaller firms, have a notable impact on the market, and may contain a number of UK – headquartered high-growth businesses that could be supported to scale further.
Figure 6.2 Estimated MSP revenue breakdown (concentration)
| Size | % of Firms | % of Revenue |
|---|---|---|
| Over £500 million | 0.12% | 31.50% |
| £250 million to £500 million | 0.15% | 11.13% |
| £100 million to £250 million | 0.34% | 11.04% |
| £50 million to £100 million | 0.65% | 9.65% |
| £10 million to £50 million | 4.09% | 18.41% |
| £5 million to £10 million | 3.93% | 6.02% |
| £2 million to £5 million | 6.79% | 4.34% |
| £1 million to £2 million | 10.65% | 3.26% |
| £500,000 to £1 million | 14.46% | 2.24% |
| £250,000 to £500,000 | 13.46% | 1.12% |
| £100,000 to £250,000 | 35.82% | 1.28% |
| £0 to £100,000 | 9.55% | 0.00% |
Source: Perspective Economics analysis of revenue data (see Section 5)
6.3 MSPs and cyber security
Managed Service Providers offer active support to organisations with their IT infrastructure, and this has a strong overlap with cyber security provision. There are a range of demand factors that have helped to shape the role of MSPs in providing support, including the need to implement user and access controls within ongoing IT management, as well as provide support with basic security hygiene (e.g. password resets, email security, anti-virus and anti-malware support, and provide wider security awareness and training).
This has a number of supply-side implications, including an increasing number of MSSPs (or MSPs providing some security services), increased relationships with cyber security vendors, and potentially supports acquisition activity by MSPs of smaller security practices.
Within this study, we find just under 3,000 MSPs that mention offering security products or services to customers via glass.ai web data. However, this may not reflect the true scale of provision (where web data is not available, or not sufficiently captured), or where MSPs may mention security provision, but may be offering basic solutions.
There are a number of considerations that draw upon this study, as well as wider research within DSIT’s Cyber Security Sectoral Analysis, and Cyber Security Breaches Survey.
The Cyber Security Sectoral Analysis (2023) focuses upon a more dedicated sub-set of providers that develop or sell cyber security products or services (c. 2,000 providers). Within qualitative research underpinning this study, many cyber security companies felt that more could be done to support SMEs recognise the difference between MSPs (providing IT infrastructure) and MSSPs (a third-party or independent assessment that controls are sufficient to protect from cyber security risk). Indeed, for many companies, it may be easier to expand a relationship with an existing MSP for security than onboard a new MSSP, or there may be challenges regarding cost. However, integrating support from MSSPs may help organisations to secure improved experience or accreditation in cyber security provision.
There are also wider challenges regarding the extent of cyber security provision; particularly ensuring support with proactive and reactive security (e.g. ensuring organisations are well equipped to deal with a potential breach). The National Cyber Security Centre also publishes guidance on using MSPs to administer cloud services[footnote 22], whereby there is a focus on the cloud security shared responsibility model. It also recognises the role of many MSPs in supporting organisations with cyber security, e.g. through the NCSC Cyber Advisor Scheme which assures organisations to provide general cyber security advice and support to a broad range of UK organisations.
The Cyber Security Breaches Survey also recognises that there is a balance for organisations between deciding to undertake IT security internally, outsource to an MSP, or use a third party security provider (including MSSP). The most recent study estimates that just under four in ten businesses (36%) and a quarter of charities (26%) have an external cyber security provider, and that outsourcing is highest among small and medium businesses, as opposed to micro and large businesses.
Interestingly, this study also provides some insight into the type of organisations using external cyber security providers, highlighting a potential gap among IT firms among others:
“Possibly because they are more likely to have cyber specialists internally, fewer than a quarter (22%) of information and communications businesses use external cyber security providers. By contrast, among finance and insurance businesses, the figure is six in ten (62%, vs. 36% on average).” (DSIT, Cyber Breaches Survey 2023)
Many of these security providers will include both MSPs and MSSPs – however, this provides useful insight into the scale of provision across these organisations. Using Business Population Estimates[footnote 23] (for firms with >1 employee) (2022), we estimate that just over 500,000 UK businesses may have some interaction with MSPs and security providers in the UK.
| Size | Estimated business population | Proportion that have an external cyber security provider | Estimate |
| Large (250+ FTEs) | 7,675 | 37% | 2,840 |
| Medium (50 – 249) | 35,940 | 58% | 20,845 |
| Small (10 – 49) | 217,240 | 50% | 108,620 |
| Micro (1-9) | 1,187,045 | 32% | 379,854 |
| All | 1,447,900 | 36% (rounded) | 512,159 |
Source: Perspective Economics estimates of the number of UK businesses with an external cyber security provider (using DSIT Cyber Breaches Survey and UK Business Population Estimates, 2023)
Managed Service Providers (MSPs) often work with a wide range of organisations, and can typically have hundreds of clients. Datto (2020) survey estimates that, on average, MSPs have a client base of 122 clients [footnote 24]. This will be skewed towards larger organisations; however, this aligns to our estimates. Assuming 512,159 businesses are using managed services provision, this suggests between 45[footnote 25] - 82[footnote 26] UK private sector clients per MSP. This will be further boosted by the demand among public organisations, charities, and non-UK firms.
6.4 The role of public procurement
Many MSPs will work across private and public sector organisations – and public procurement is a key element of recurring revenues for many providers, commonly working with central and local government, education, and healthcare to help provide IT services.
The research team works closely with a leading procurement data supplier called Tussell, which tracks millions of contract awards from public contracting sources.
We have been able to match (using Company Registration Numbers) 1,811 MSP suppliers to government (between January 2020 – July 2023). This suggests that at least one in six MSPs supply to government (including central and local government, NHS, education, and other public bodies); however, this figure is likely higher where MSPs are working through frameworks or direct awards (potentially up to a third of MSPs).
In addition, we have also identified where MSPs in the dataset have secured at least one public contract via public procurement e.g. supplying IT services to a public body. In total, 1,999 firms (approximately one in six) are named on a contract (via Tussell data, see Section 6.4). Of these, 797 are large or medium, meaning that just over 1,200 MSPs supplying to a public body are either small or micro. These firms may require support to ensure a level playing field – i.e. that they meet certain standards, but that proportionality applies.
We have subsequently searched for contracts awarded to these suppliers that meet the following criteria:
-
Common Procurement Vocabulary (CPV) Codes include mention of IT Services, IT Systems or Computing.
-
Keywords include at least one of the following: “msp”, “mssp”, “cloud migration”, “it managed” “managed it”, “service level agreement”, “cloud infrastructure”, “hosting”, “solutions”, “hybrid”, “it infrastructure”, “managed cloud”,” managed service”, “managed network”, “managed networks”, “cloud”, “service integration”, “SharePoint” or “SIAM”
This process has identified 14,048 awards to MSP suppliers by the public sector (including central and local government, NHS, education, and other public bodies) between January 2020 – December 2022 (and a further 4,266 awards from Jan – July 2023). We set out the full year performance below.
Figure 6.3 highlights that over the last three full years, the value of contracts awarded to Managed Service Providers by the public sector has grown from £3.2 billion in 2020 to £7.4 billion in 2022. In 2021 and 2022, there were over 5,000 contracts awarded to MSPs each year (over 100 each week).
The value and volume of contracting highlights the importance of the public sector as a buyer of managed services, and also demonstrates the potential impact of standards in shaping the market.
Figure 6.3 Value and volume of IT contracts awarded to MSPs in the UK

Source: PE analysis of Tussell data (14,048 awards, £17.5 billion awarded between 2020 – 22)
Figure 6.4 sets out the top 25 suppliers within the list of MSPs identified as part of this study, with respect to IT and managed contracts awarded to these suppliers. Please note that these figures may include frameworks or long term contracts, and are therefore indicative of the available data relating to awards, rather than the amount paid to suppliers.
However, this highlights that of the £22.9 billion in IT contracts awarded to MSPs between January 2020 to July 2023 (up-to-date), £16.6n (72%) of this has been secured by the top 10 suppliers – demonstrating the scale of some of the largest strategic vendors and suppliers to government. This includes firms such as Capgemini, Atos, Bytes, Softcat, Microsoft and IBM.
Figure 6.4 Top 25 suppliers to the UK public sector (MSP related)
| Capgemini | £2,281 million (10%) |
| Atos | £1,405 million (6%) |
| Bytes Software | £1,284 million (6%) |
| Softcat | £1,264 million (6%) |
| Microsoft | £1,189 million (5%) |
| IBM | £1,083 million (5%) |
| Phoenix Software | £876 million (4%) |
| Deloitte | £825 million (4%) |
| CGI | £678 million (3%) |
| BOXXE | £646 million (3%) |
Source: PE analysis of Tussell data, n = top 25 providers, over £16.6 billion out of £22.9 billion
Further, as Figure 6.5 highlights, of the £22.9 billion awarded to MSPs since 2020, only 17% (£3.9 billion) of the direct spend has been allocated to SMEs. This is slightly lower than wider public sector spend (of which an estimated 21% is with SMEs), and lower than the government target of 33%[footnote 27].
Figure 6.5 Proportion of Awards to SMEs
| Central government | £15,103 million (66%) |
| NHS | £3,131 million (14%) |
| Local government | £1,988 million (9%) |
| Policing | £1,133 million (5%) |
| Private limited | £546 million (2%) |
| Further and higher education | £484 million (2%) |
| Rail | £122 million (1%) |
| Devolved transport | £88 million (0%) |
| Housing association | £76 million (0%) |
| Charitable organisation | £66 million (0%) |
| Schools | £57 million (0%) |
| Other | £130 million (1%) |
Source: PE analysis of Tussell data (n = £22.9 billion)
Figure 6.6 also highlights the top buyers (by type) of managed services across the public sector since 2020. We estimate that a third of spending is driven by central government departments, and may also include support with wider cloud computing and digital transformation projects. The NHS has spent over £3 billion with MSPs since 2020, followed by local government (c. £2 billion).
Figure 6.6 Top buyers of MSP services (Sector)
| SME | 17% (£3.9 billion) |
| Large organisation | 83% (£19.0 billion) |
Source: PE analysis of Tussell data
7. Key findings and considerations
Key findings
We set out some of the key findings from this research below.
Number and scale of providers
-
The UK MSP market consists of an estimated 11,492 active providers.
-
We estimate that in 2022, the MSP sector generated annual combined revenue from managed services activity of £52.6 billion. This also supported £29.1 billion in direct Gross Value Added (GVA), and that the sector employs an estimated 294,340 FTEs. This demonstrates the sector’s significant economic contribution to the UK economy.
-
We estimate that of these providers, where known, 4% (460) are large, 9% (1,052) are medium, 28% are small (3,182) and 59% are micro (6,623).
-
The analysis highlights the breadth of scale of MSPs in the UK. For example:
-
Large MSPs account for just 4% of firms but generate 74% of total estimated revenue (£38.8 billion). Further, the largest ten MSPs alone contribute an estimated 27% of all sector revenue, highlighting a market with significant concentration among the largest providers.
-
There is a considerable proportion of medium-sized MSPs (9% of firms) that generate 16% of total estimated revenues (£8.4 billion). This indicates that mid-tier firms, while fewer in number than smaller firms, have a notable impact on the market.
-
There are over 3,100 small (28%) and over 6,600 micro MSPs (59%) serving markets across the UK, collectively generating £5.3 billion in estimated revenue (10% of total).
Business models and service offering
-
There is a relatively even split between ‘dedicated’ or ‘pure-play’ MSPs (53%) focused primarily on managed services, and diversified MSPs (47%) offering a wider range of IT products and services. This highlights the range of business models in use.
-
This research explores the key services and offerings provided by the market, and develops a market taxonomy to explore provision. We find that key services include cloud solutions, IT infrastructure management, IT service management, and managed security services.
-
We also explore partnerships, with the data suggesting that 56% of MSPs have partnerships with Microsoft, 43% with Amazon Web Services and 15% with Google Cloud. This shows the extensive partnerships between MSPs, vendors, and major cloud providers.
Role of public procurement
- Public procurement is an important source of revenue for MSPs. We estimate that the public sector awarded over £7 billion annually in IT contracts to MSPs (2022). This highlights the role of government as a major buyer of managed services.
Implications for number of MSPs in potential scope of the NIS Regulations
-
We estimate that between 1,500 – 1,700 large and medium MSPs could potentially be in scope of the plans to update the NIS regulations to include managed services.
-
We also estimate that these MSPs account for 90% of MSP sector revenue.
-
We also estimate that there are just over 9,800 small (3,182) and micro (6,623) which would not be in scope of NIS Regulations under current proposals, as they would be subject to the small and micro exemption.
Areas for further consideration
In addition to the key findings, this research also explores a number of themes relating to how the Managed Service Provider market operates in the UK. We set out some of the areas for consideration, or potential further research below.
- MSPs and cyber security provision: The research identifies approximately 3,000 MSPs which mention offering cyber security related solutions to their customers. To further consider how MSPs contribute to the cyber resilience of the UK, it may be useful to further map cyber security accreditation levels across providers. This could include exploring the take-up and roll-out of standards such as ISO27001 and Cyber Essentials, as well as mapping the complementarity and variance between cyber security as offered by MSPs and MSSPs in the UK.
This research also highlights the importance of MSPs as part of the UK’s overall supply chain security. Further research, potentially aligned to the DSIT Cyber Security Breaches Survey which explores the use of IT and cyber security outsourcing, regarding the use of MSPs and MSSPs, risk analysis through breaches or attempted breaches, customer spend, and any buyer or supplier feedback on the security landscape may be useful.
- Supporting the growth of the MSP sector: We find evidence of a diverse and growing sector. We also anticipate the MSP market is well placed for further growth, with an estimated CAGR of 12% to 2027. However, the scale of providers is varied, and includes a small number of very large multinationals driving the majority of revenue, followed by several hundred ‘mid-market’ providers, and thousands of small and micro providers.
This research explores a number of themes relating to supporting growth within the MSP sector (see Section 6). Areas to support growth could include:
-
Supporting technical and commercial skills: MSPs offer a broad range of technical solutions, and this means they have to continually refine their offering and partnerships to support customers. There may be potential to support MSPs to develop staff with specific skills programmes in areas such as cloud, AI and cyber security. There may also be potential to support MSPs with leadership and management skills to further unlock growth.
-
The MSP sector also contains several well-established IT firms that recruit talent on an ongoing basis. There may be opportunities to work with providers on developing skills initiatives at a regional and national level.
-
Access to finance: We find that external investment is much lower among MSPs than other sectors, given the focus on service provision. However, for firms seeking to expand, they may use facilities such as debt finance. It may be worthwhile exploring access to growth finance for high potential SME MSPs, including potential benefits and challenges, particularly where smaller MSPs are seeking to merge or acquire new practices to expand their capabilities.
-
Public procurement: We estimate that at least one in six providers have secured at least one public contract within the last three years; however, as set out, the volume awarded to SMEs is considerably lower than larger providers. Whilst increasing SME access is a key theme, it may be worth undertaking further review into the role of frameworks such as G-Cloud 13, the role of local procurement, the potential to integrate or subcontract SMEs into managed service supply chains, and the role of innovation competitions and partnerships.
-
Industry and cluster development: There may be potential to support cluster development and capacity building in geographic areas or sectors with potential for growth in demand for managed services. This could align to existing regional cluster initiatives (e.g. regional clusters that focus on the role of MSPs in cyber security), or involve a deeper review of outsourcing statistics to explore how MSPs are used by buyers across the country and sectors. Exploring capacity building in areas with lower MSP saturation may also be worthwhile to understand how barriers (e.g. cost or limited awareness) may be overcome within regional markets.
-
Monitoring growth and market dynamics: This study is a baseline to understand the size and scale of the Managed Services market currently. However, monitoring market revenue, employment and investment on an ongoing basis can support an understanding of how the market is developing, and support understanding the potential competitiveness impacts of bringing large and medium MSPs under NIS regulations
Annex A: Full methodology, scope, and data sources
For this research, we used an eight stage methodology. We set this out below in detail, including the scope and data sources used. As set out within the research document, this research is experimental, given the need to draw upon a wide range of data, including web data to identify potential providers, and understand the range of services provided.
Summary of methodology:
Stage 1: Research plan
The research team developed an initial Research Plan setting out the research requirements, methodological approach, initial definitions and data sources, and ways of working.
Stage 2: Initial data review
The research team recognised that Managed Service Providers (MSPs) are a challenging sector to define, and will overlap domains such as cyber security, cloud, telecoms, and IT outsourcing and services.
As such, in order to inform Stage 3 (Definition, Scoping and Taxonomy), the research team reviewed several sources including:
-
An initial review of over 100 known Managed Service Providers (to identify key descriptions, and web data);
-
Review of IT providers to the public sector (reviewing G-Cloud 13 and using the Tussell platform to identify almost 10,000 unique suppliers to government under CPV72000000 (IT services) over the last five years;
-
Review of wider business datasets including BvD FAME and Beauhurst;
-
Review of over 25 leading cloud and software providers which mention MSP partners and include a web-based ‘Find a Partner’ website.
The initial data review enabled the research team to develop an initial list of thousands of potential providers. This supported the team to:
-
i) identify indicative providers considered in-scope (and mark companies potentially out of scope) to help inform the identification of subsequent firms;
-
ii) undertake summarisation and classification of descriptions to identify relevant products and services
-
iii) develop agreed keywords and language in scope for use within web data; and
-
iv) inform an agreed initial definition and working taxonomy for firms to be included and weighted against.
Stage 3: Definition, scoping and taxonomy development
The Government response to the call for views on proposals to improve the UK’s cyber resilience provides two important considerations for defining the UK’s MSP market. Firstly, it provides ten illustrative examples of managed IT services e.g.
-
IT outsourcing services (ITO);
-
Private wide area network (WAN) managed services;
-
Private local area network (LAN) managed services;
-
Service integration and management (SIAM);
-
Application modernisation;
-
Application management;
-
Managed security operations centre (SOC);
-
Security monitoring (SIEM);
-
Incident response;
-
Threat and vulnerability management (TVM).
Secondly, it provides characteristics of interest with regard to scope. An updated characteristics table has been provided to the research team, which includes:
-
The managed service is provided by one business to another business (i.e a third party) and,
-
The managed service is related to the provision of IT services such as systems, infrastructure, networks and applications , and/or the security thereof and,
-
The managed service relies on the use of network and information systems, whether these are of the provider, their customers or a third party’s and,
-
The managed service provides regular and ongoing management support, active administration and/or monitoring of IT systems, IT infrastructure, applications and/or IT networks, and/or the security thereof.
This would also be likely to exclude (or place less emphasis upon):
-
managed services supplied by the public sector (e.g. local government managed services) are intended to be excluded, on the basis they are already covered by the government cyber security strategy.
-
‘in house’ managed services.
-
businesses not related to IT services, eg: business processing outsourcing (e.g. HR and payroll) and Telecoms networks and services
-
services such as software development or ad hoc consultancy (eg IT audits)
This market analysis seeks to identify businesses active within the UK that provide managed IT services to a third party, and meet the four characteristics set out above. Further, this analysis is primarily focused upon organisations that include all of the following attributes:
-
Have a clear presence within the UK market, typically through a UK registered business that reports to Companies House on an annual basis (or clear identification of an office in the UK)
-
Demonstrate an active provision of commercial activity (e.g. through the presence of an active website / social media presence)
-
Provide IT services to the market aligned to the taxonomy set out in Section 2.4
-
Have identifiable revenue or employment within the UK related to managed IT services
-
Appear to be active at the time of writing (i.e. have not, or are not in the process of dissolution)
-
Are not charities, universities, networks, and individual contractors (non-registered) – which are all excluded for analysis purposes
We set out these principles within the definition in Section 2. Using these principles, the research team developed a working definition for identifying Managed Service Providers, and an agreed scope for inclusion and exclusion.
The team subsequently reviewed web data and trading descriptions of the initial providers considered in scope in Stage 2. Using NLP techniques, the team identified and weighted 530 unique keywords or product or service terms from the initial data review.
The research team held workshops with senior policy leads and industry representatives from organisations including DSIT, ICO and NCSC in July 2023. This had the following objectives:
-
Identify a range of agreed ‘gold standard’ Managed Service Providers operating in the UK. These include example providers with known provision, whereby the research team could review the services provided to help build out the definitional scope.
-
Identify a range of potential web sources for identifying MSPs, including where large cloud providers have ‘MSP partnerships’ on their websites, and sources such as G-Cloud.
-
Develop a long-list of potential keywords to help identify MSPs trading in the UK
-
Agree how services might be grouped to develop a market taxonomy
The research team set out a range of proposed keywords, groupings, and taxonomy and sub-taxonomy areas for consideration. This process enables companies to be allocated against one or more areas of the taxonomy based upon the products or services mentioned within relevant web data.
This process resulted in the following taxonomy being developed regarding services most likely to be in scope. This aimed to identify as many relevant solutions as possible, to help improve the identification of potential MSPs trading within the UK by glass.ai.
| Taxonomy Category | Agree Definition (Short) |
| Application and Hosting | Offering platforms or environments to host, deploy, and manage storage or applications e.g. data hosting. |
| Cloud Computing | Providing (or enabling access to) scalable IT resources and solutions on demand via the cloud, including access to storage, compute, or solutions. |
| Communications | Management of communication tools and platforms, including VoIP, unified communications, and other collaborative tools. |
| Compliance and Risk Management | Services and solutions that ensure IT practices align with legal, regulatory, and risk-based requirements. |
| IT Consulting | Professional advisory services such as implementing IT strategies, solutions, and architectures. (For MSPs, this must have an ‘ongoing element’). |
| IT Outsourcing | IT organisations that are able to take responsibility for delegated IT functions or services by their customers. |
| IT Service Management | Oversight and management of end-to-end IT service delivery, including tech support, remote access and business support. |
| IT Infrastructure Management | Services focused on overseeing, managing, and ensuring the efficient operation of IT resources, including servers, networks, and storage. |
| Managed Security Services Providers (MSSPs) | Offering security services such as monitoring, detection, and incident response on behalf of third parties. |
Stage 4: glass.ai enhanced shortlist
glass.ai has developed AI technology that combines language understanding through semantic analysis with resource crawling at scale, based on millions of data sources (company websites, news sites, social media, and sector-specific sources), weighted, and authenticated by human review.
The glass.ai team identified and reviewed:
-
Over 1 million companies with a UK web presence where web data and descriptions mentioned some form of IT service provision linked to the taxonomy and keywords identified;
-
Deep-crawl of MSP partnerships mentioned by leading cloud platforms; and
-
Review of wider datasets shared by the research team (as set out previously)
This yielded a long-list of over 14,000 potential firms in scope. This was subject to automated and manual review by the wider research team to remove false positives and check for any notable omissions, which resulted in a final list of 11,492 firms in scope (of which given the use of web data, the research team was able to match 10,291 (89%) accurately to Companies House CRNs. The remaining firms may be either too small to accurately match, or may be active in the UK with an office or trading presence, but not be registered.
This resulted in a short-list which included the following fields:
-
company name (and other Companies House data),
-
website,
-
description (textual data extracted from the company website),
-
alignment to the taxonomy,
-
mentions of non-UK offices and other signifiers of supply chain activity
-
business location and postcode (for registered and active offices),
-
estimated number of employees,
-
turnover (where available)
-
wider scoring to weight firms (e.g. an MSP that is included in existing market lists, identified by glass.ai, and is a known supplier to government or industry would be expected to score highly for inclusion).
Stage 5: Data refinement and enrichment
The research team subsequently undertook data cleaning, and enrichment to provide additional markers for the DSIT team. This included:
-
Estimation of MSP related activity: weighted estimates for MSP-related employment, and revenue using web data and company accounts.
-
Estimated combined MSP related employment, revenue and Gross Value Added derived from web data and company accounts.
-
Additional sectoral markers: Identification of where firms also may be aligned to sectors such as cyber security, cloud, data centres, or telecommunications
-
Dedicated or diversified marker (based on extent of provision)
-
Investment raised by firms
-
Debt and charges data
This process yielded a final dataset for analysis as below.
Stage 6: Data modelling
The research team undertook modelling and markers for the following variables. This ensures segmentation within the MSP sector by key variables across size, scale, contribution, and product and service offering.
-
Number of companies
-
Number of employees and turnover, size, and maturity
-
Location of companies (registered, local offices, and international offices)
-
Gross value added (GVA) (PE modelling based on net profit, remuneration, depreciation and amortisation within accounts)
-
Exports and imports
-
Research and development spending / activity
-
Company incorporations / exits
-
Types of products and services provided, and sectors served
-
MSP partnerships and focus markets
-
Funding and investment deals, including value, volume, and forms/sources of investment
-
Supply chain analysis (e.g. partnerships, collaborations)
-
Procurement and award data to MSPs by public buyers (including CNI and essential services)
-
Growth signals and indications of market power (PE modelling)
Stage 7: Impact assessment
We also undertake exploration of the potential impacts of bringing MSPs under the scope of the NIS regulations within Chapter 6. This is informed by:
-
Use of markers for each provider to identify whether they are an MSP only, or offer some form of cloud provision
-
Revenue as a percentage of the sector’s total revenue (recognising the largest providers will drive the majority of the revenue).
-
In comparison, across the wider UK economy, there are 1,447,900 registered businesses that employ at least 1 employee. Of these, 7,675 are large (0.5%), 35,940 are medium (2.5%), 217,340 are small (15%), and the remainder (1,187,045) are micro (82%). Within SIC Division J (Information and Communication), there are 78,760 employers, of which 0.6% are large, 3% are medium, 14% are small, and 83% are micro. (Source: Business Population Estimates, 2022). This highlights that the MSP sector has a strong proportion of large and medium-sized businesses compared to the wider economy. ↩
-
All firms identified using glass.ai were also subject to human review and use of a text classification algorithm by the Perspective Economics analyst team for final inclusion in the MSP sectoral dataset. ↩
-
HM Government (2023) NIS Regulations. Available at: https://www.gov.uk/government/collections/nis-directive-and-nis-regulations-2018 ↩
-
Gartner (2023): Definition of Managed Service Providers. ↩
-
HM Government (2022) Response to the call for views on proposals to improve the UK’s cyber resilience ↩
-
We are able to match 10,291 of these providers to a Company Registration Number within UK Companies House. The other 1,201 relate to companies that have been identified with web data as actively providing or selling managed services to the UK market, but it has not been possible to identify a UK registration. ↩
-
Full size definitions: Large: Employees >=250 and Turnover > €50 million or Balance sheet total > €43 million // Medium: Employees >50 and < 250 And Turnover <= €50 million or Balance sheet total <= €43 million // Small: Employees >10 and < 50 And Turnover <= €10 million or Balance sheet total <= €43 million // Micro: Employees < 10 And Turnover <= €2 million or Balance sheet total <= €2 million ↩
-
11,316 have been allocated an estimated size. For 176 firms (<2%), there is insufficient data on revenue or employment to estimate size; however, these are likely to be small or micro. ↩
-
There are 228 Travel to Work Areas (TTWAs) in the UK – these areas are defined labour market areas, where most people live and work. ↩
-
The estimated number of businesses operating in each Travel to Work Areas (TTWA) (UK Business Counts – NOMIS 2022). ↩
-
A Location Quotient (LQ) is a statistical measure used to compare the concentration of a resource or activity, such as MSPs, in a region compared to a wider geography (in this case, the entire UK). An LQ of 1 means that the region has the same concentration of MSPs as the national average. An LQ greater than 1 means the region has a higher concentration of MSPs compared to the national average.To calculate the LQ, we divide the percentage of MSPs in the country in that area by the percentage of active businesses in the region (as a percentage of UK businesses). For example, if a region has 4% of the UK MSPs, but only has 2% of the UK’s active business population (based on ONS Business Count estimates), the LQ would be 2. ↩
-
Datto (2020) Global State of the MSP Report. Available at: https://www.datto.com/resource-downloads/Datto2020_State-of-the-MSP-Report.pdf ↩
-
This is a similar ratio to that within the DSIT Cyber Security Sectoral Analysis (0.6 in 2023, and 0.52 in 2022). ↩
-
https://www.analysysmason.com/globalassets/x_migrated-media/media/analysys_mason_msp_forecasts_worldwide_sample_may2019_ren033.pdf ↩
-
CyberSmart (2023) Why managed service providers (MSPs) are a target for cybercriminals: Available at: https://cybersmart.co.uk/blog/why-managed-service-providers-msps-are-a-target-for-cybercriminals/ ↩
-
Datto (2019) The challenge of growing MSP businesses. Available at: https://www.datto.com/resource-downloads/CPI-Datto-The-Challenge-of-Growing-MSP-Businesses-2019.pdf ↩
-
129 out of 6,053 ↩
-
806 dedicated MSPs out of 6,053 = 13% ↩
-
Digital GVA (£143 billion) / Employment (1,800,000) = £79,400: DCMS (2021) DCMS Sectors Economic Estimates: Monthly GVA. Available at: https://www.gov.uk/government/statistics/dcms-sectors-economic-estimates-monthly-gva-to-september-2022/using-annual-estimates-from-summed-monthly-gva-data , DCMS (2021) DCMS Sectors Economic Estimates: Workforce. Available at: https://www.gov.uk/government/statistics/dcms-sector-economic-estimates-workforce-2021/dcms-sectors-economic-estimates-workforce-january-to-december-2021 . ↩
-
Ofcom (2023) Cloud services market study: Interim report. Available at: https://www.ofcom.org.uk/__data/assets/pdf_file/0029/256457/cloud-services-market-study-interim-report.pdf ↩
-
BT (2023) Managed Services: https://business.bt.com/corporate/products/managed-services/ ↩
-
National Cyber Security Centre (NCSC) (2023) Using MSPs to administer your cloud services Available at: https://www.ncsc.gov.uk/blog-post/using-msps-to-administer-your-cloud-services ↩
-
HM Government (2022) Business population estimates for the UK and regions 2022: statistical release. Available at: https://www.gov.uk/government/statistics/business-population-estimates-2022/business-population-estimates-for-the-uk-and-regions-2022-statistical-release-html ↩
-
Datto (2020) Global State of the MSP report: Available at: https://www.datto.com/resource-downloads/Datto2020_State-of-the-MSP-Report.pdf ↩
-
Assuming direct division (512,159 businesses) among 11,492 MSPs. ↩
-
Assuming these are more aligned to the c. 6,300 businesses with MSP revenue in excess of £250,000 per annum. ↩
-
Tussell (2022) SME Procurement Tracker. Available at: https://www.tussell.com/hubfs/British%20Chambers%20of%20Commerce%20&%20Tussell%20%20-%20SME%20PROCUREMENT%20TRACKER%202022%20.pdf ↩