Measuring the economic value of museums and galleries digital offers: an exploratory use of contingent valuation techniques
Published 28 June 2023

© Crown copyright 2023
This publication is licensed under the terms of the Open Government Licence v3.0 except where otherwise stated. To view this licence, visit nationalarchives.gov.uk/doc/open-government-licence/version/3 or write to the Information Policy Team, The National Archives, Kew, London TW9 4DU, or email: psi@nationalarchives.gov.uk.
Where we have identified any third party copyright information you will need to obtain permission from the copyright holders concerned.
This publication is available at https://www.gov.uk/government/publications/measuring-the-value-of-the-digital-offer-of-galleries-and-museums/measuring-the-economic-value-of-museums-and-galleries-digital-offers-an-exploratory-use-of-contingent-valuation-techniques
Authors and acknowledgements:
Simetrica Jacobs and Creative Industries Policy Evidence Centre: Dr Madeleine Arber, Hasan Bakhshi, Hazel Cranmer, John Davies, Dr Daniel Fujiwara, Daria Incarnato, Augustin Lagarde, Dr Ricky Lawton and Peter O’Donovan
1. Executive summary
As part of its programme of research on how arts and cultural organisations can use economic valuation techniques to better demonstrate their social and cultural value to the wider public, Arts Council England (ACE) has recognised a need to explore their applicability to digital culture, such as the online content offered by cultural institutions on their websites. This timely research comes as the public’s behavioural engagement with culture has shifted in the face of the coronavirus (COVID-19) pandemic.[footnote 1] For this report, ‘digital offer’, or ‘digital content’, is defined as any online content offered by art galleries and museums specifically, which may include audio and visual imagery, games, videos, social media posts and more. Primary research was conducted to estimate the value the digital offer of art galleries and museums in England, using the same economic valuation techniques that the authors have applied for Arts Council England to the traditional ‘offline’ offer, or the in-person experience, of a variety of cultural institutions.[footnote 2]
The authors understand that the research in the economic valuation of digital offering is still in its infancy. The research undertaken in this report is therefore exploratory. In particular, it seeks to establish whether a contingent valuation methodology can be implemented, acknowledging that other approaches such as the price sensitivity meter[footnote 3] or time use[footnote 4] may also provide monetary estimates of the benefits to users derived from the digital offers of museums and art galleries in England. The research undertaken in this report uses methods that are consistent with HM Treasury Green Book (2022) guidance on Social Cost Benefit Analysis (SCBA). It explores the applicability of these methods to digital offers, and thereby adds to the growing body of evidence on the value of cultural institutions. It also contributes to the Culture and Heritage Capital (CHC) Programme launched by the Department for Digital, Culture, Media and Sport (DCMS) in January 2021 which aims to put public investment in culture and heritage on more rigorous footing.[footnote 5] ACE and DCMS aim to create publicly available statistics and guidance that will allow for improved articulation of the value of the culture and heritage sectors in decision-making. The valuation of benefits and costs plays an important role in deciding how the government should spend taxpayers’ money.
There is increasing recognition of the benefits of applying HM Treasury Green Book (2022) endorsed techniques from welfare economics to value the non-market as well as market benefits of culture and heritage.[footnote 6] The outputs of the CHC Programme will not only be applicable to publicly funded organisations but will also be useful resources for assessing the public benefit of private assets. Therefore, the CHC Programme should be of interest to any cultural or heritage institution that wants to measure the benefits it bestows on society. Alongside the research reports, ACE has published a series of guidance documents to help organisations in different sectors apply the value estimates.[footnote 7]
Millions of people each year access the digital offer of England’s art galleries and museums. Even more so than for their traditional in-person offering, the majority of these digital offers are free of charge. Partly for this reason, users of these ‘intangible’ services may struggle to estimate a clear monetary measure of their value in their minds. Even if the gallery or museum has a paid membership scheme, it is not at all clear the extent to which the members are willing to pay in any way reflects the benefits they may derive from the gallery or museum’s digital offer (Noehrer, Gilmore, Jay and Yehudi, 2021).
As such, estimates of the value to the public of the digital offering of arts and cultural organisations are necessarily more tentative than for estimates of their traditional offline offers. In this study, users were asked about their willingness to pay (WTP) having first interacted with online content from four galleries/museums based in England.
The survey was designed for each of the following four sites in question:
-
The Derby Museum and Art Gallery.
-
The Bristol Museum and Art Gallery.
-
The Foundling Museum.
-
The Great North Museum.
Fieldwork was conducted between 22 June to 3 September 2021 whereby respondents were asked to complete the survey questionnaire. Initial survey questions asked respondents about their attitudes to culture, their previous visits to museums within the past three years, and their experiences of engaging with culture online. After asking respondents their WTP, questions were then asked to determine the motivation behind their responses, whether the respondents felt that the COVID-19 pandemic had impacted on their access to and consumption of digital content and their WTP for it, and lastly to gather standard demographic information. A monthly subscription fee payment vehicle was chosen to elicit respondents’ WTP. The respondent sample was made up of repeat users (i.e., those who had used the website before) and first-time users (i.e., those who had not). As a result, non-use values were not able to be collected as all survey respondents had engaged with the digital offer when answering the questions. Each person surveyed gave an individual maximum WTP for the site in question, providing a range of WTP values across the sample, including for those people who indicated that they would not be prepared to pay anything at all (i.e., had a WTP value of £0). An average WTP value was calculated for each site.
The main research findings are as follows:
The WTP a monthly subscription fee for a household to continue accessing the digital offer and supporting in offering digital content ranged from £3.27 for the Derby Museum and Art Gallery to £4.93 for the Foundling Museum. This is slightly lower than what respondents were willing to pay to physically visit an art gallery (£5.40).[footnote 8]
The WTP for a household to access the site’s digital offer was positively associated with some socio-demographic factors and cultural engagement history. Specifically, household income was found to be positively and significantly associated with WTP a monthly subscription fee for their household’s access to the digital offer for users who had physically visited or digitally accessed the good prior to the study (Foundling Museum, Great North Museum and Pooled Museum models). The authors have found similar validity testing results with respect to the WTP for in-person experience for art galleries and local museums, whereby WTP is significantly and positively associated with household income and cultural engagement history.[footnote 9] In respect to in-person visits to local museums, the authors only found the higher income bracket to be significantly associated with an increase in WTP an entry fee.
| Derby Museum and Art Gallery | Bristol Museum and Art Gallery | Foundling Museum | Great North Museum |
|---|---|---|---|
| £3.27 | £4.37 | £4.93 | £3.92 |
The WTP estimates were statistically robust: the distribution of the 95% confidence intervals for the average WTP per site was not wide:
- Derby Museum and Art Gallery: £2.64 - £3.89
- Bristol Museum and Art Gallery: £3.35 - £5.39
- Foundling Museum: £3.68 - £6.17
- Great North Museum: £2.34 - £5.51
This finding is in line with the authors’ previous findings with respect to in-person visits to galleries and local museums. However, we must heavily caveat the estimates for reasons of survey design, the uncertainty in users’ minds about their valuations, and the heterogeneity of the digital offer across the four sites studied. We detail these caveats in the report.
Analysis of respondents’ answers suggests that users do not think that the digital offering of galleries and museums will replace the in-person experience any time soon. That is, their (current) digital offer is not a direct substitute for the physical offer. When providing their WTP for the digital offer, however, users also consider the added value created from these cultural institutions, such as community outreach programmes or educational work. This suggests there is a strong overlap between the ‘physical’ and digital offers of arts and cultural institutions in the minds of the public. As such, when individuals are asked to value the work of galleries and museums, they may struggle to separate the two.
Taken together, these results tentatively suggest that contingent valuation techniques may carry across to digital cultural contexts though qualitative work needs to be done to understand the bounds of what users are in fact valuing. An additional consideration is that the public’s expectations of what a typical digital offer should be is likely to be in flux as rapid technological progress creates new opportunities for online experiences. It cannot also be ruled out that the estimates are affected by the public’s experience of the lockdowns, which had preceded the survey data collection, and which had limited their traditional access to galleries, museums, and other venue-based forms of cultural engagement. Future research recommendations include cognitive testing of the WTP questions (and repeating the exercise over time) to probe their robustness.
2. Introduction
2.1 Background
Arts Council England (ACE) commissioned Simetrica-Jacobs and the Creative Industries Policy and Evidence Centre, led by Nesta to enhance its, and the wider arts and cultural sector’s, knowledge and use of economic techniques to measure the value of cultural activities and institutions. The results of this project contribute to the Culture and Heritage Capital (CHC) framework launched by DCMS in January 2021 which aims to create publicly available estimates and guidance that will allow for improved articulation of the value of the culture and heritage sectors in decision-making. The outputs of the CHC Programme will not only be applicable to the public sector but can also act as a useful tool to assess the public benefit of privately held assets.
There is increasing recognition of the benefits of applying HM Treasury Green Book (2022) endorsed techniques from welfare economics to value the non-market as well as market benefits of culture.[footnote 10] ACE have published evidence and guidance[footnote 11] to help organisations in the arts and museums sector which are consistent with the Green Book. The Green Book’s welfare approach aims to capture the Total Economic Value (TEV) of public policies and interventions. Despite being referred to as “Total Economic Value”, the aim of ACE’s programme is not to measure the benefits to the economy, such as the Gross Value Added (GVA) and employment, but rather to value the benefits of cultural and heritage attractions to society, for example in terms of welfare or wellbeing, education, and local pride. Valuing these benefits is challenging as they are personal to the people who receive them; however, public economics methods allow for their value for the public good to be estimated. Without estimates of this value, it is not possible to consider the benefits to people and society on the same monetary basis as costs, which is important for sound public decision-making.[footnote 12] Gathering this evidence is particularly important in cases where SCBA is required for cultural or heritage institutions, but where market values (e.g., entry fees) do not exist or where there is a strong case that the value of an institution is greater than the collective price people are willing to pay for individual access. Valuation approaches can also be used to make internal resource decisions within institutions (the British Library study being a commonly cited example in the cultural sector, see Pung et al.).
The Mendoza Review (2017) highlighted more broadly the importance of museums having and using consistent and statistically robust methods to measure economic and social impact.[footnote 13] It also indicated that local authorities have a role in helping museums to measure their impact and deliver the evidence of this impact. The DCMS Tailored Review (2017) concluded that ACE should be a sector leader in developing a rigorous methodology to assess the outcomes and impact of its funding portfolio (i.e., beyond just measuring inputs and outputs).[footnote 14] More recently, the DCMS have published their Culture and Heritage Capital Framework (2021) as noted earlier, setting out an ambition to produce supplementary guidance to the HM Treasury Green Book (2022) specifically for the Arts, Culture, and Heritage sector. It is also worth noting that materials being produced to support this Framework have been recommended by the Department for Levelling Up, Housing and Communities (DLUHC) as part of their application guidance for programmes like the Towns Fund and Levelling Up Fund.
While progress has been made to evidence the value of larger (regional and national) museums and art galleries,[footnote 15] theatres[footnote 16], and smaller museums[footnote 17], the value of the content published by arts and cultural institutions online is yet to be considered. For the purpose of this report, ‘digital offer’, or ‘digital content’, is taken to mean as any online content offered by galleries and museums, which may include audio and visual imagery, games, videos, social media posts and more.
There are many reasons why it may be important to consider the value of the online content of galleries and museums.[footnote 18] These include:
- this type of art and culture is widely, and in most cases, freely available for everyone to access, but costly to digitise, store and curate
- online content is not constrained by the physical space of the venue and so it has the potential for much greater access, at least by users who have an adequate internet connection
- digital content has the potential to enrich the public’s engagement with the gallery or museum’s collection through providing additional information and content, which may be enjoyed by users in their own time and location[footnote 19]
- digitisation helps to preserve cultural heritage for future generations
- it is a resource for researchers as it provides them with easier access to the museum or gallery’s collections in the same way it enhances access for the general public
- as the COVID-19 pandemic has shown, museums and galleries have pivoted their offering from physical to digital, in order to retain an offer to users even when physical access is constrained[footnote 20]
However, valuing this type of digital cultural offer is difficult for a number of reasons. Foremost, in the vast majority of cases, the digital content is built on physical artworks or artefacts which are the underlying source of the value, and users may struggle to conceive of this value separately from that of the online content. At the same time, invariably the type of online gallery and museum content considered in this report is available for free so the public may have no ‘anchor’ for their stated valuations. The latter is likely exacerbated by the high degree of heterogeneity of online content that is typically on offer – podcasts, virtual tours, and workshops, all relating to different collections – to name but a few. An implication is that estimates of the value of the digital content offered by galleries and museums might be expected to be noisier than is the case for their traditional physical offer. The exploratory nature of the analysis, therefore, as well as the heterogeneity of the digital offer means that the willingness-to-pay (WTP) estimates presented for the four study sites in this report should not be transferred to other galleries or museums.
2.2 Values for ‘non-market’ institutions
Millions of people visit art galleries and museums annually in England. People may value their visit more than any entrance fee they pay; indeed, entry is often free. Typically, not everything is on display in exhibitions, with sometimes the great majority of items being held in storage to preserve for future display, and in other cases artefacts being lent to other venues for exhibition. The digitisation of the items making up a gallery or museum’s collection and online publication of the images allows the public to engage with items that are not currently on display, and this is also typically free. Furthermore, in many cases education outreach and research work make up a substantive part of a gallery or museum’s offer to the public, the value of which may not be fully reflected in (any) entrance fees.
More generally, the benefits that arts and cultural institutions like galleries and museums provide to society tend not to be fully mediated by market mechanisms. They are termed non-market goods or services because they are often not tradeable and so are not reflected in market prices. Consequently, they often are not quantified in SCBA, meaning that they are not fully considered when appraising investment in comparison with more quantifiable economic benefits. An evaluation that focuses only on market prices therefore underestimates the full public value of a cultural institution. Valuing these benefits can be very challenging as they are personal to the people who receive them, however economic techniques from public economics are available to allow them, under some assumptions, to be estimated. This approach has been successfully used in other sectors, such as in the Natural Capital Approach developed by The Department for Environment, Food and Rural Affairs (DEFRA) which allows the value and sustainability of the environment to be included more completely in decision making.[footnote 21]
Government guidance in the UK Treasury’s Green Book (2022) and DCMS’s Culture and Heritage Capital Framework recommends that non-market goods like culture be valued in monetary terms, and often this requires the use of Stated Preference (SP) surveys.
2.3 Stated Preference (SP) valuation: Putting prices on non-market goods
SP surveys present relevant groups (e.g., visitors, users, residents, the public) with information about an asset. A WTP value is determined from how much respondents state they would be willing to pay to continue to enjoy the asset in a hypothetical scenario where access is no longer free of charge (or in the case of willingness to accept, WTA, stating how much they would be willing to accept by way of compensation were access to be restricted or lost).[footnote 22] This method is used by several public bodies, such as the Department for Transport, in policy-making decisions around the value of travel time[footnote 23] and impacts of construction projects on iconic heritage sites.[footnote 24]
This SP research technique is known as Contingent Valuation (CV), because it involves the design of surveys asking respondents directly to report their values contingent on there being a hypothetical market. Implementing the CV methodology is challenging but over a few decades of application, a range of best practice techniques have been developed to improve the robustness and welfare consistency of the values elicited.[footnote 25] These values are:
- a maximum willingness to pay (WTP) for a positive change — for example, what would be the maximum value that the respondent would be willing to pay to have extended opening hours for a gallery, or how much they would be willing to pay to attend an online workshop hosted by a museum.
- a minimum willingness to accept (WTA) in compensation for a negative change or to forego a beneficial outcome — for example, how much money the public would require to compensate them for the removal of online content from a museum website
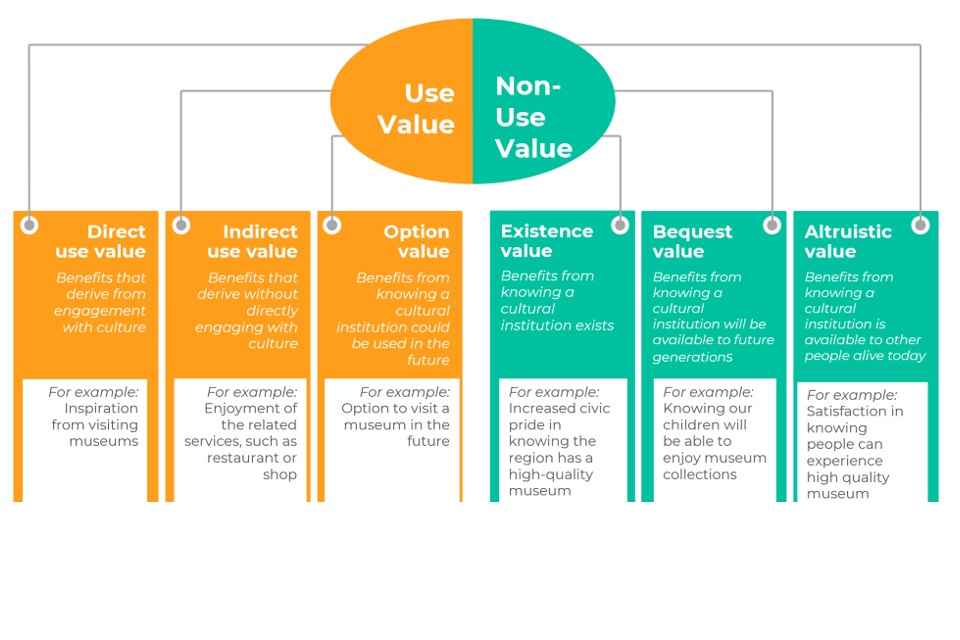
The advantage of the CV method is that it can estimate the values that visitors, or users, obtain from an institution or an institution’s online content (see Textbox 1), including:
- direct use value, regarding the individuals actual or planned use of the institution’s online content, and
- indirect use value, the benefits that derive without directly engaging with the digital offer
This is in addition to the benefits that individuals who do not use the institution’s services may in principle enjoy:
- non-use value, regarding the value held for the institution’s continued existence and provision of its services to others, and
- optional value, that both users and non-users may get from being able to use it in the future
As CV surveys rely on respondents to state their willingness to pay, one disadvantage is that respondents may ‘launder’ or omit their true preferences. This can be because they are answering in the way they believe they would want to answer (e.g., meta-preferences) or answering in a way that looks more socially desirable by ‘cleaning’ their answers and/or making them appear ‘more consistent’ in their eyes. The risk that respondents may launder their preferences in these ways can be partly mitigated in the design of the survey instrument through consistency checks and data cleaning.
A significant shortcoming of the CV method is that the WTP/WTA values elicited may not be incentive compatible. That is, because the payments/acceptances are hypothetical there is no reason why they would necessarily correspond with what survey respondents would actually pay/accept if the market did exist. There is also a question as to whether CV surveys are appropriate within sectors such as health or culture, as this method relies on an individual’s willingness to pay and generally does not account for an individual’s inability to pay due to financial constraints. This may then mean that cultural services that have disproportionate numbers of higher socioeconomic group users who can pay for them, may make a stronger case for funding than cultural services with disproportionate numbers of lower socioeconomic group users who cannot pay for them. In practice, the best practice techniques as mentioned above include truth-telling devices within the survey to try and minimise the bias arising from incentive incompatibility, and those devices are employed here.[footnote 26] A question exploring whether ability to pay because of financial constraints influences the WTP elicited is also included in the survey to better understand the groups that benefit from the cultural service.
Another feature of the CV method is that the WTP/WTA values elicited are dependent on how the good or service is defined within the survey. Those using WTP values for SCBA purposes should pay close attention to how the good or service is defined in the survey, what kind of payment it relates to (e.g., tax, entry fee, or donation), and the payment term (either an annual payment for a fixed period or a one-off payment for the life of the good or service). It is important to provide realistic valuation scenarios that reflect the nature of the good or service being valued (e.g., a subscription fee for a video streaming service). Compulsory payment vehicles (e.g., a state tax, an entry-fee, or a fee to access a service) may reduce the risk of free-riding (i.e., respondents not willing to pay because they do not believe they have to pay) that is problematic with CV surveys. Follow-up questions are best placed to investigate whether respondents found the payment vehicle and scenario to be realistic.
To account for these disadvantages, a minimum sample of 200 respondents is advised with advanced survey design, including presenting payment options (e.g., payment cards or dichotomous choice), with appropriate consistency checks and data cleaning to reduce any survey biases that may still be present.
Textbox 1: Overview of values
Use value refers to the WTP stated by those who have visited or otherwise engaged with the gallery or museum within a designated time-period. While these are expected to be primarily use values, it is acknowledged that visitors may also hold non-use values for the preservation and maintenance of collections. Use value within this study refers exclusively to the WTP values held by visitors (i.e., users) for accessing the digital offering, the online content, of the art gallery or museums.
Non-use value refers to the WTP stated by those who have not visited or engaged with the gallery or museum within a designated time-period. While these are expected to be primarily non-use values, it is acknowledged that non-visitors may hold elements of use value, such as the option value to access the art gallery or museum’s online content in the future.
Table 1.2 Total Economic Value
To estimate the value held for the digital offer, a CV survey was designed that asks respondents to report their willingness to pay (WTP) for selected cultural institutions’ online content. In this report, ‘physical site’ refers to only the physical site of the institution (the gallery or museum), whereas ‘digital offer’ is the online cultural content valued and offered. ‘Site’ in this report refers to the four institutions selected for the survey, and which refers to either their physical or digital offer.
3. Review of literature
Most art galleries and museums now have some form of online presence of their collection. For example, in Arts Council England and Nesta’s 2019 Digital Culture survey, as many as 70% of museums in England surveyed reported that they were currently publishing content on free platforms, 69% were engaging in digitising their collection and 20% were providing online interactive tours of real-world exhibitions.[footnote 27] The ‘digital offer’ considered in this report may include audio and visual media, games, social media posts, online research resources and digitised exhibits. The term ‘digitisation’, in contrast, refers to the process of ‘uploading’ exhibitions online for public display, as well as creating a private digital repository (which could include the object’s storage location, barcode, and relevant metadata) to support the institution’s internal processes.[footnote 28] Previous research suggests that this digital content appears not to compete with the physical offering of the museum in the eyes of the public; rather, it allows potential visitors the chance to connect with and experience the museum’s offer in different and potentially complementary ways.[footnote 29]
This literature review sets out to survey the different methodologies that have been previously applied in valuing the digital offer of arts and cultural organisations. However, we find surprisingly few such studies (Bakhshi and Throsby’s study of the online offer from Tate Liverpool’s Colour Chart exhibition and of the National Theatre’s NT Live broadcasts in 2009 is an early exception). This is likely in part a reflection of the challenges in applying techniques like contingent valuation to experiences that are novel to consumers. Compounding this is the fact that online content from galleries and museums is almost always free to access, making it inherently difficult to value and it is difficult in research valuation purposes for respondents to provide a value for something they widely access for free. In such cases, some analysts suggest alternative SP techniques to WTP such as Van Westendorp’s price sensitivity meter[footnote 30] might be preferable.
Yet, empirical evidence on the value of gallery and museum digital offers would be timely given the significant numbers of individuals that engaged with the collections of galleries and museums during the recent lockdowns when physical access to venues was prohibited. In a cohort study of adults in the first UK-wide lockdown in 2020 by the Creative Industries Policy and Evidence Centre and the Intellectual Property Office, as many as 13% - 17% of individuals reported to be looking at art, paintings, and photographs online on a weekly basis.[footnote 31]
The extent of the ‘pivot’ of cultural institutions towards engaging with the digital audience in lockdown was largely dependent on the organisational culture, acceptance, and preparedness of institutions.[footnote 32] While some institutions were already digitally ‘switched on’ so to speak, the largest shift in thinking was required of those institutions that were less prepared.[footnote 33] Museums and galleries became more data-driven with a greater emphasis placed on understanding these new digital audiences. One study[footnote 34] interviewed museum and gallery digital leads around the UK and reported a widely held belief that digital audiences were not demographically dissimilar to traditional in-person audiences. There was little suggestion that institutions’ digital offering had increased the diversity of audiences; families were identified as a particularly difficult audience to reach using digital platforms. These beliefs were shared by institutions - even those that had consciously tried using their digital presence to reach new audiences, including younger generations, which were thought to be a more difficult audience to sustain over the long term. This study also reported some trends seen in the digital offer that more successfully engaged the public. Blog posts, podcasts, some social media, and online shops were popular, with some institutions finding online donations as a reliable income stream, but downloadable resources were not popular according to the institutions interviewed. Some institutions intuitively experienced a reduction in web traffic on pages relating to visitor information and physical collection pages. A common theme identified was the challenges institutions face in providing a cultural offering online in a financially sustainable way when other such cultural content is freely and widely available.
In 2018, the UK-based economics consultancy, Oxford Economics, was commissioned by the Canadian Museums Association (CMA) to undertake a national study that looked at the value of galleries, libraries, archives, and museums (GLAMs)[footnote 35], part of which focused on the value of GLAMs’ online offerings. The value of online services was framed as a value for information, and the cost associated with this information was expressed in terms of time. The expectation being that if the online services did not exist, then online users would face higher (physical) access costs and, consequently, may be deterred. A demand curve for GLAMs content was created by asking respondents to estimate time spent on GLAMs’ websites and supplemented by responses to a national survey on digital engagement and also analytics shared by GLAM institutions. These estimates were subsequently combined with Canadian ‘values of time’ to produce a time cost of online usage per session. Utilising Canadian Heritage and CULC data on the number of online sessions and sensitivity to the cost of time online, the consumer surplus of GLAMs’ online services was estimated at $1.6 billion Canadian dollars per annum.
Outside the immediate area of focus on galleries and museums, valuation research has been undertaken elsewhere in the digital economy. Brynjolfsson and colleagues[footnote 36] estimate the value of social media platforms like Facebook and WhatsApp, through a series of discrete choice experiments. For this, respondents were given the option to keep access to the social media platform in question or give up the access for one month and receive a (randomly allocated) payment as compensation. To ensure respondents stuck to their commitments, their Facebook accounts were monitored remotely. These experimental design features aimed to make the stated valuations incentive compatible. In their sample of 2,885 participants who were 18 or older and lived in the United States (US), the average WTA value for one month of no Facebook access turned out to be US$42.17. A second study[footnote 37], conducted in the UK, estimated WTA values for a range of free online goods, such as online grocery shopping, online learning, WhatsApp, and Netflix. The survey was first undertaken in February 2020 (ahead of the UK lockdown) and then repeated in May 2020 (before any easing measures had begun). The research found that valuations for free online goods generally increased between February and May 2020, although there were declines in the valuations for some of the online goods, such as LinkedIn and personal emails. For example, WhatsApp elicited an annual WTA median average of £1,588 in February increasing by 11.8% to £1,774 in May. Conversely, Google maps elicited an annual WTA median average of £1,307 in February decreasing by 21.4% to £1,027 in May. A further study estimated WTA values for free social media platforms (Facebook, Instagram, Snapchat, Skype, WhatsApp, digital Maps, LinkedIn, and Twitter) in a sample of university students within the Netherlands. Respondents were again asked how much they would be willing to accept for giving up each of the social media platforms for one month. To ensure participants committed to the program, their passwords were changed and protected in a sealed envelope. Thereby, a broken seal revealed the respondent had accessed their social account. WhatsApp elicited the greatest WTA median average of €535.73 per month as respondents reported this was their main communication format with friends and family. The research has a number of important research design challenges, but it shows that although difficult, respondents are able to provide a monetary value for content even if they have always considered it to be free.
Consistent with this, in a gallery and museum context, previous research from Arts Council England surveying those who engaged with digital cultural content, although falling short of a full CV study, found that while 63% of respondents believed that online cultural content should be free, 32% agreed with the statement “I am willing to pay for online arts and culture if I get something extra (e.g., exclusive content or access offline)”[footnote 38] (ACE, 2010). When asked what these digital culture users would be willing to pay for various categories of digital content, WTP ranged from £3.04 for a phone app that provided location-based information regarding archives to £7.89 for viewing an online theatre performance.
As part of the British Film Institute’s (BFI) digitisation process, the Britain on Film (BoF) programme prepares, stores, and maintains film collections. The BoF programme also provides a national archival online collection of digitised British film and television, with the majority free-to-watch for the UK public. Lawton et al.[footnote 39] conducted a CV study to estimate the non-market value of a free-to-view digital service and the wider Unlocking Film Heritage archive programme. Respondents were asked their monthly WTP for a subscription fee to access the online content if they were users or a donation if they were from the wider UK public. Users were found to be willing to pay a median monthly subscription of £3.21 to access the BoF content with a median monthly donation of £2.26 for the BFI’s archival work. The wider public, who had not used the BoF, were willing to pay £4.68 on average as an annual donation to the BoF digital content and £3.44 for BFI’s archival work.
While both experiential and authenticity considerations suggest that the physical offer should be valued more greatly than the digital offer, it should be noted too that the digital offer may in fact be valued greater by some users. Digital offer may be valued highly due to its ‘on demand’ nature, lack of congestion effects, which are known to reduce the value of visits,[footnote 40] and content features which deepen the experience. While the research presented in this report does not attempt to estimate the degree of substitutability between the offline and online offer, survey questions are used to generate insights on the differences in value to different users.
4. Methodology
This section provides details of the contingent valuation of the digital offer from four art galleries/ museums located in England.
4.1 Site selection
Four digital offers were selected based on the size of the physical sites: the sites were each based in English towns or boroughs of at least 200,000 inhabitants which had an art gallery or museum with a digital offer that met the definition of digital offer outlined below. The number of annual visits and regional significance match broadly those of the sites studies in previous research undertaken by Simetrica-Jacobs and the Creative Industries Policy and Evidence Centre for consistency.[footnote 41]
For the purposes of this study, ‘digital offer’ is defined as the free-to-access online content offered by art galleries and museums, which includes:
- image albums and slideshows
- audio (including audio description, podcasts)
- games
- illustrated essays (webpages with text and images)
- maps
- social media posts
- timelines
- turn-the-page presentations
- videos
- virtual visits (360° explorations)
- visible storage (including online collections on display and out of display)
The following four sites and their digital offers were selected:
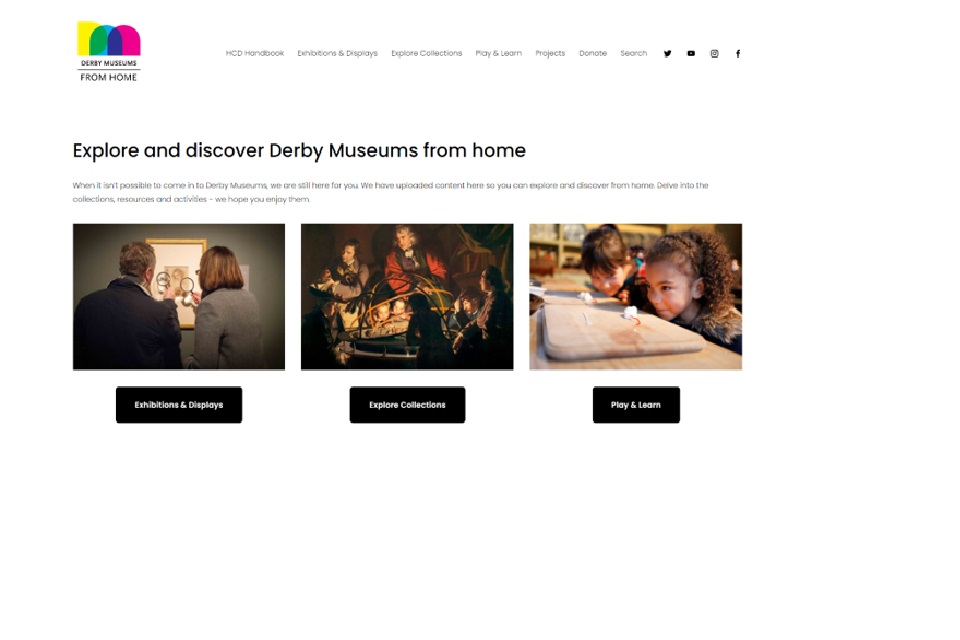
- The Derby Museum and Art Gallery in the East Midlands presented a ‘make and create’ drawing workshop directed at children and families.
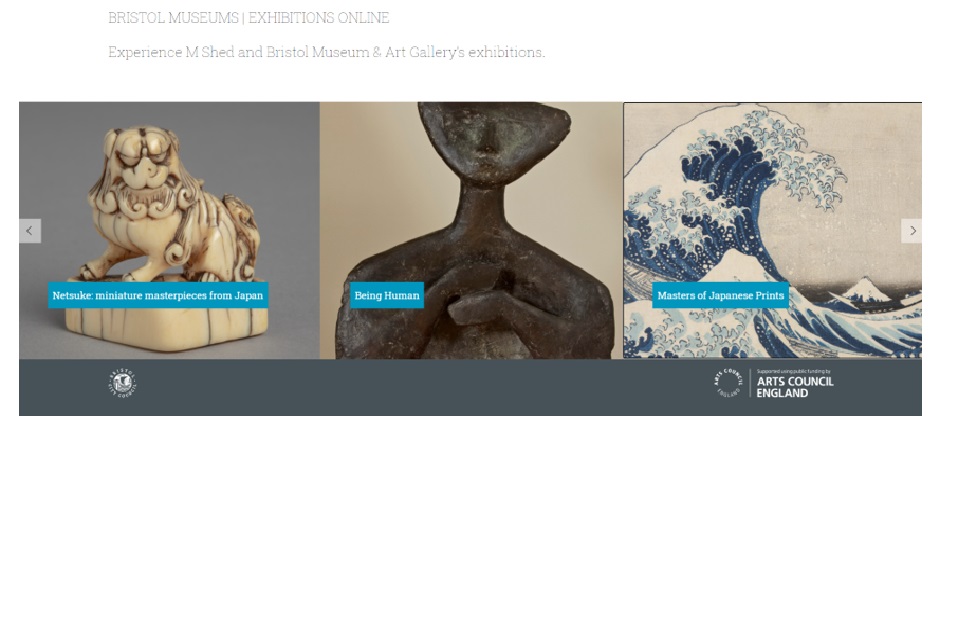
- The Bristol Museum and Art Gallery in the South-West of England presented 3D imagery and renditions of their Pliosaurus specimen, alongside audio and text.
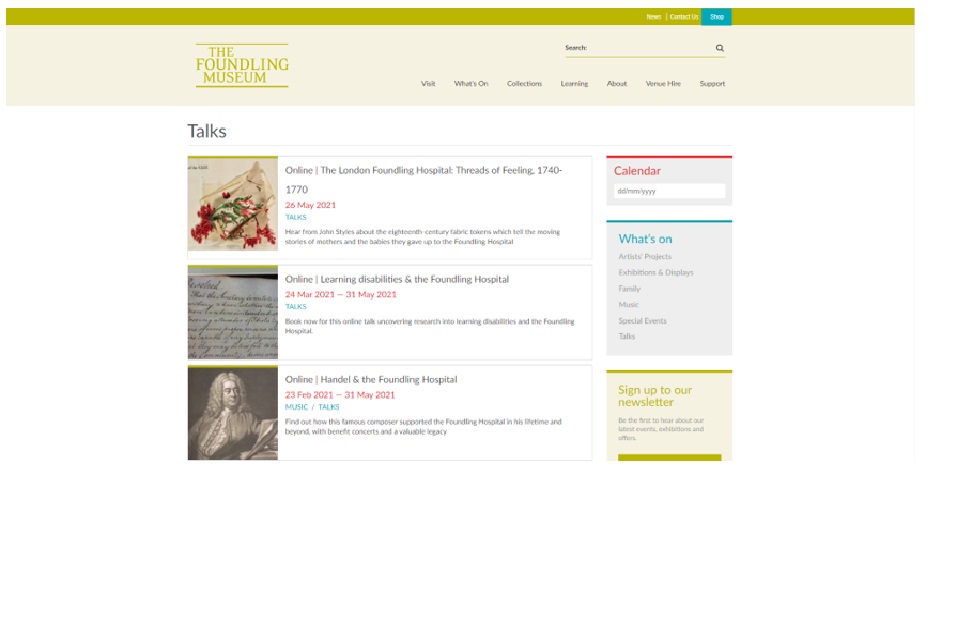
- The Foundling Museum in Greater London presented a series of talks delivered by video around the history and notable persons of the site.
- The Great North Museum in the North-East of England presented some of its collections online alongside some virtual tours.
4.2 Sampling approach
Survey respondents were sampled based on the region that they reported living in. Those respondents who identified that they were from one of the regions (East Midlands, South-West of England, Greater London, and North-East of England) that the four sites are located in (the Derby Museum and Art Gallery, the Bristol Museum and Art Gallery, the Foundling Museum, and the Great North Museum[footnote 42] were directed to the respective site’s questions (e.g., if a respondent was from the East Midlands they were allocated the Derby Museum). Those who identified they were not from one of the four regions were randomly allocated one of the four sites that they may or may not have physically visited. This sampling approach assumes that respondents are more likely to have visited the physical site located within their region and possibly engaged with the digital offer online or were at least familiar with the physical site. Follow-up survey questions determined whether respondents had indeed (physically and digitally) previously visited their allocated site. Only 36% had physically visited one of the four sites within the past three years. Of those who had previously visited the website and engaged with the digital offer, 10% reported that they had not visited the digital site within the past 12 months (see Section 4.2). Further, 78% of the total sample had said that they had not visited any art gallery or museum at all within the past 12 months. This result is to be expected given the restrictions around physical visits and reopening of UK museums and galleries during the COVID-19 pandemic. In this study, the focus is restricted to the use value of the digital offers; non-use values are not estimated. Attempting to estimate the latter would seem to be particularly challenging given that access to a website (‘use’ in this context) is so straightforward, assuming that users have a reliable internet connection and a device to access the digital offer.[footnote 43]
Specifically, this study focuses on repeat users (i.e., those who report to have visited the website before) and first-time users (i.e., those who claimed not to have visited the website before but who did so now as part of the study). It should be acknowledged for the latter group particularly that the WTP for the digital offer may be influenced by having interacted with the digital offer immediately beforehand. Any biases that may arise as a consequence of this were not able to be controlled for. The authors recommend that possible cognitive biases arising from this feature are explored in future research.[footnote 44]
Lastly, the sample was recruited to be representative of that of the general population (based on region, gender, and age from Census data). However, it should be acknowledged that users of digital content are likely to be different to users of the physical site and to that of the general population in terms of demographics. In other words, the sample may not be reflective of digital cultural content users. There is some evidence to this effect within the DCMS Participation Survey October 2021 to March 2022.[footnote 45] Respondents located in and around London were more likely to have ‘taken a virtual tour of a museum or gallery in England’ or have ‘engaged with text, image, audio, video, or animation, games, or podcast content from museums in England’ than respondents elsewhere in England.
4.3 Survey design
A third-party panel provider, Toluna,[footnote 46] was used to recruit the sample for the online survey. For this, Toluna advertises the online survey and potential survey respondents self-select into the survey. Survey respondents who complete the survey receive a monetary reimbursement for their efforts. This method may elicit survey biases:
Because survey respondents self-select into the survey, respondents may have a greater interest in culture, which may result in the WTP values being inflated due to a disproportionate number of culture consumers. Questions around respondents’ attitudes towards arts and culture and previous visits to physical and digital sites allow the sample to be compared to that of the national population (by benchmarking these answers against the DCMS’s Participation Survey for example).
As survey respondents are paid for their completion of the survey, some respondents may be inclined to complete the survey for monetary gains without providing accurate answers. Steps have been taken to exclude spam (those responses not believed to be human), speedsters (survey respondents who completed the survey in a short period of time), and those respondents who provided unreliable answers (their answers contradicted earlier answers). Further details are provided in the Appendix (Section 6.1.1).
An online survey instrument was designed on the survey platform Qualtrics to value the digital offers of each of the four sites in question (the Derby Museum and Art Gallery, the Bristol Museum and Art Gallery, the Foundling Museum, and the Great North Museum).
Reflecting both what published research is available and the payment models used by popular streaming platforms in the market (e.g., Spotify, Netflix) a subscription-based payment vehicle was used in the contingent valuation scenario. This is because digital paywalls are how most media and content organisations - be they news services or SVOD video platforms charge for “entry” as it were to access their content, sometimes with options to pay-per-use or pay for a set period (e.g., pay-per-month) (Ruβell, et al. 2020). Another reason for opting for subscription as the preferred payment vehicle for the present research is that a subscription paywall should in principle reduce free-riding within the survey. Specifically, a subscription-based payment vehicle is more incentive compatible than other options, such as a voluntary donation, whereby payment is optional, and individuals may hold that belief that they do not have to pay as others will instead.
Sites: The Derby Museum and Art Gallery, the Bristol Museum and Art Gallery, the Foundling Museum, and the Great North Museum
User WTP: to access the digital content from one of the four galleries/museums.
Good valued: Access to digital content of the gallery/museum.
Payment vehicle: Subscription fee (monthly on behalf of their household). A payment term, such as one year, was not specified. This is more in line with realistic subscription fees for popular streaming payment models on the market, whereby users review their fee to access content monthly but are free to cancel at any time. This means that while the payment vehicle is realistic, it is also weaker as the valuation scenario does not specify exactly how long respondents should consider this reoccurring monthly payment for. The WTP results should therefore only be considered for one month and should not be aggregated beyond this. Any findings are caveated with this in mind.
Use valuation scenario: Respondents were given information about one of the four sites they had physically visited (or were randomly assigned to one if they had not previously visited). This included information about when the gallery or museum first opened, its collections, awards won, and about the nature of its digital offer. Attention was drawn to the fact that the digital content provided by the gallery or museum was free. Photographs of both the interior and exterior of the gallery, alongside snapshots of the website content were presented. In order to value the good, respondents were asked to explore the digital offer of the site for at least five minutes. As an interaction bias check, the analysis tested to see whether longer interaction time with the digital offer (in minutes) increased the amount that respondents were willing to pay for the digital offer. In the event there was no consistent evidence of this source of interaction bias.
Contingent scenario: After approximately five minutes[footnote 47] of exploring the digital offer, respondents were reminded that the digital content was free-to-access online and told that most of the institution’s funding comes from a government grant. They were asked to imagine a scenario where the difficult national financial situation meant that many galleries and museums in England had suffered cuts in funding. As a result of which, the institution would have to start charging for the digital content they offered. The valuation explicitly outlined that any cuts in funding would not have any impact on the physical gallery or museum itself and that it would continue to remain open and running. Respondents were further told that the digital offer would be updated with new digital content and added to on a regular basis. The frequency of the digital offer updates was not specified further, as the digital offer and the updates to the digital offer vary widely over time (e.g., aligning with exhibition dates, monthly posts for new workshops, etc).
Follow-up scenario: As a follow-up valuation, respondents were asked how much they would be willing to pay for entry to the physical site itself on a future visit. This scenario was only presented to respondents who had indicated that they had previously visited the gallery or museum.
Initial survey questions determined which respondents were arts and culture consumers, respondents’ attitudes to culture, their previous gallery and museum visit history (the past three years), and their past experience of engaging with culture online. Questions following the valuation itself determined the motivation behind respondents’ WTP (or not), whether the COVID-19 pandemic had had any impact on their access and consumption of digital content and their WTP, and standard demographic information.
The four sites (see below) each provided free of charge an aspect of digital offer that met the definition in Section 3.1.
The Derby Museum and Art Gallery
The Derby Museum and Art Gallery offers a range of online content, including a range of workshops and activities that are suitable for children and families to complete at home, such as building your own board games, making pinhole cameras, and creating paper sculptures.
The Bristol Museum and Art Gallery
One of The Bristol Museum and Art Gallery’s digital exhibitions offers detailed insights into “Doris” the eight-metre long Pliosaurus, discovered in Wiltshire in 1994 and on permanent display at the site. The digital exhibition contains statistics and facts on Doris, including 3D fossil imagery and also provides visitors with background audio of deep ocean sounds whilst interacting with the digital content.
The Foundling Museum
The Foundling Museum’s online talks, including the “Dr Hunter’s Secret Delivery” talk, goes into the Foundling Museum archives and reveals stories, such as those of a noble lady whose twins were secretly taken to the Foundling Hospital.
The Great North Museum
The Great North Museum offers a range of virtual tours and online exhibitions, such as the artworks by Atomhawk, an art and design studio which has visualised the look of world-famous franchises such as Harry Potter, Star Wars, and Marvel.
Pilot survey: A pilot survey was conducted to establish an appropriate range of WTP values.[footnote 48] Pilot survey debrief questions confirmed that the survey was functioning correctly and debrief responses provided sufficient confidence to proceed into the field. The results from the pilot survey identified that no changes were required to the survey before sampling.
4.4 Data cleaning
In total, 1,726 respondents completed the survey. The survey included pre-screening questions at the start that filtered out respondents who were flagged by the Qualtrics online survey design platform as being spam[footnote 49] (n=4), being under 16 years of age (n=1) or having duplicate responses (n=1).
After cleaning, we excluded some responses from the final data set, as detailed in Section 6.1.2 and below:
- Those with unreliable responses.[footnote 50] (These responses were given a minor flag and individuals were removed from the final data set if they received multiple flags.[footnote 51] respondents received at least 1 minor flag and of these 23 respondents received a major flag. Note that these groups are not exclusive.)
- Those who said they chose a WTP amount because they did not believe they would really have to pay (n=12). Because the stated WTP for these individuals did not reflect their financial constraints, this is an indication that they did not answer the question in a realistic way.
- Those who completed the survey in an unrealistically fast time (n=495). Removal of so-called ‘speedsters’ is recommended practice in CV analysis. A threshold time of 10 minutes was set as the minimum period in which all the information provided in the survey could realistically be read and a compulsory five-minute session to explore the digital offering could be used to make informed preference decisions. The average survey completion time was long, at approximately 38.6 minutes, which provides some confidence that survey respondents explored the digital offer for at least five minutes and took time to consider their survey responses.[footnote 52] Excluding respondents such as these left 1,177 valid responses. While the exclusions reduced the survey sample, it was preferable to have a more robust set of responses that provide greater confidence that the WTP estimates were accurate reflections of the value respondents attached to their experience. It should be acknowledged, however, that the exclusion of these respondents could introduce some bias if they result in the systematic exclusion of certain type of respondent from the sample. To address this, ex post analysis (logistic regression) was performed and found no evidence of significant selection effects.
Table 3.1 Reasons for removal of response from final sample
| Reason for removal | ||
|---|---|---|
| First stage cleaning | Spam | 0.2% (4/1726) |
| Second stage cleaning | Follow-up: Would not pay in reality | 0.7% (12/1720) |
| Speedsters | 28.8% (495/1720) | |
| One major flag | 1.3% (23/1720) | |
| No valid WTP | 1.5% (25/1720) | |
| Final respondent sample | 68.4% (1177/1720) |
Note: The second stage cleaning process groups are not exclusive. One removed respondent could have been removed for various reasons and can fall into multiple categories.
Note that 140 respondents gave a WTP that was outside the scope of the valuation scenario but otherwise gave valid responses (i.e., ‘My willingness to pay is not just for visiting the [digital content], but also an expression of my support for all the work that [site] does’) were included in the final sample. While these respondents may have had willingness-to-pay valuations that were inflated compared with others, given that they valued more than just a digital visit, it was considered a valid reason for being willing to pay for the digital offer. The final WTP values are nonetheless caveated as they may be inflated due to the inclusion of these respondents. This potential distortion is quantified by presenting average WTP values with and without these individuals included (these results are presented in Figure 6.1 in Appendix 6.1.2).
4.5 Weighting
To ensure that the survey results were more representative of the population of digital visitors, calibration weights were applied to the data. To do this, website analytics were collected for visitors to each site and, where not readily available, their social media analytics were used instead.[footnote 53] Further details are provided in the Appendix (Section 6.2). While the use of social media analytics may not reflect the true population of website visitors, the authors suggest that those engaging with the museums’ social media offerings are also likely to engage with the website, so using weights derived from social media analytics are better than not weighting at all.
The survey data was weighted by employing iterative proportional fitting, more commonly known as raking. This methodology weights the data one variable at a time to give precedence to those under-represented in the survey. The weights used are the inverse of the selection probabilities, which are calculated as:
Where, refers to the share of the population meeting a certain weighting criterion (i.e., from a certain age group or gender) and is derived from website analytics, and refers to the share of the sample meeting that criterion and is derived from the survey. For example, if females represent only 50% of the survey respondents but made up 60% of the population of interest (i.e., a site’s website visitors), females will be given a weight of 1.2 (and non-females would be given a weight of 0.8). Similarly, if 35–54-year-olds represent 30% of the survey respondents but made up 20% of the population of interest, 35–54-year-olds would be given a weight of 0.67. That is, 20% divided by 30%. This process is then repeated iteratively for all variables that are being weighted over, in this case gender and age.
Raking is a popular method used by the Office of National Statistics and other public pollsters and is a recommended approach to weighting survey data (Valliant et al., 2018). Unlike post-stratification, which is another common approach to calibration using information on the cross-classification of the categories to be weighted on, raking has the advantage that it does not require information on the cross-classification but only the marginal population counts. In other words, it does not need the information from crossing several variables (e.g., gender split by age from a certain region). Rather, the data can be provided individually (i.e., gender split, age split, etc.). This allows for all the information available on the site demographics to be leveraged, even if it is sparse, and provides confidence that the estimation is as robust and efficient as possible.
4.6 Learnings and challenges
In the context of the digital offer of cultural institutions, market values (e.g., in the form of fees to access digital content) do not always exist. In this case, the digital offer valued is widely and freely available for all to access on the internet (including those who do not live in the United Kingdom) at any time of the day. Even where market values exist, they may not capture the full extent of value created. This is because, on one hand, for some fee-paying users the benefit may exceed the amount they pay, and on the other hand, some benefits may also accrue to those who do not digitally visit the museum (such as if it has option value or existence value, as outlined in Figure 1.2).
Stated preference (SP) studies in principle allow, through careful survey design, a means of eliciting WTP values from different groups (e.g., users and non-users). However, for this approach to work properly, the survey questionnaire needs to be tailored specifically to the features of the gallery or museum and the public it serves. As there is little precedent in the literature, this research should be read as an exploratory attempt to estimate the public’s value for the digital offer of art galleries and museums in England.
Valuing the digital offer specifically provides a set of distinctive valuation challenges:
- In practice, use values only are readily elicited: to be confident that survey respondents have engaged with the specific online content in question they are required to view the content immediately ahead of completing the questionnaire; see Figure 1.2 Any use value findings are therefore caveated by acknowledging that the WTP for the digital offer has likely been influenced by having only recently interacted with the content.
- The digital offer is highly heterogenous between and within sites. Due to the large variation in digital offerings available, all values obtained in this research are caveated and should not be transferred between sites. That is, these values should not be pooled or used in a benefit transfer. Reflecting this heterogeneity, the four sites studied in this report are vary greatly in their digital offer. For example, the Great North Museum presents a virtual tour of one of their exhibitions whereas the Derby Museum and Art Gallery which runs family-orientated ‘make and create’ online workshops.
- A monthly subscription fee (on behalf of their household) was the payment vehicle employed, however, to provide a realistic payment scenario no payment term (such as one year) was specified. To be conservative WTP results should therefore only be considered for one month and should not be aggregated beyond this.
- The final sample included those survey respondents who gave a WTP that was outside the scope of the survey (i.e., ‘My willingness to pay is not just for visiting the [digital content], but also an expression of my support for all the work that [site] does’). These respondents (n = 140) considered the value generated beyond the digital visit, nonetheless the authors believe this remains a valid WTP reason. But if that is wrong, the final WTP values may be slightly inflated due to the inclusion of these respondents.
- Lastly, the small sample sizes for some of the groups of respondents means further research is required before any strong conclusions can be drawn.
5. Results
The digital offer survey ran from 22 June to 3 September 2021. During this period, the COVID-19 vaccination programme was well underway with roughly 66% of adults in England having received their second dose by 19 July.[footnote 54] Restrictions on events had eased and cultural institutions had reopened for visits. Survey sampling was designed to elicit the views of users of the digital offer for each of the four museum sites.
5.1 Sociodemographic characteristics
Sociodemographic information was elicited from survey respondents, as is common practice in CV surveys (see Table 4.1). As noted earlier, a caveat to the research design is that all survey respondents were required to ‘use’ the digital offering and were deemed a cultural user, even though they may not typically visit and interact with arts and cultural organisations more generally (i.e., some respondents may have been what we call ‘first-time users’). Users of digital content may also be different to users of the physical site and to that of the general population in terms of demographics. Therefore, to derive more robust estimates of the value to users, the sample was weighted as below.
Table 4.1 shows a comparison between the unweighted responses and those implied by the weighted responses using sociodemographic breakdowns of web analytics data (and social media traffic in the case of the Great North Museum) using the procedure described in Section 3.5. It shows that there are some differences between the weighted and unweighted samples. The weighted sociodemographic data based on website analytics was notably a younger and more female group, with a higher percentage reported they had dependent children, were university educated and employed. For example, the unweighted responses for the Bristol Museum and Art Gallery are 57% females with an average age of 49 years old compared to the weighted responses (based on the web analytics) which are 60% females with a younger average age of 39 years old.
Table 4.1 User socio-demographic characteristics
| Derby Museum and Art Gallery | Bristol Museum and Art Gallery | Foundling Museum | Great North Museum | |
|---|---|---|---|---|
| Users | ||||
| Female: % (n/N) | 55.9% (181/324) | 57.1% (186/326) | 59.5% (188/316) | 51.7% (107/207) |
| Female: % (Weighted) | 56.7% | 60.0% | 64.4% | 60.0% |
| Age: mean (se) | 46.9 (0.90) | 49.3 (0.96) | 42.6 (0.94) | 54.1 (1.21) |
| Age: mean (Weighted) | 43.4 | 39.3 | 38.8 | 39.7 |
| Household annual income (£): mean (se) | £36,234 (1472.28) | £35,119 (1398.71) | £48,002 (1969.63) | £33,264 (1645.98) |
| Household annual income (£): mean (Weighted) | £37,181 | £36,267 | £49,169 | £37,333 |
| Has dependent children under 16 years: % (n/N) | 33.4% (109/326) | 27.2% (89/327) | 38.0% (120/316) | 19.9% (41/206) |
| Has dependent children under 16 years: % (Weighted) | 37.0% | 34.5% | 43.2% | 37.2% |
| Married/Civil Partner: % (n/N) | 46.7% (151/323) | 47.7% (155/325) | 45.2% (142/314) | 48.8% (100/205) |
| Married/Civil Partner: % (Weighted) | 44.7% | 40.0% | 44.4% | 37.6% |
| University education % (n/N) | 39.0% (126/323) | 41.6% (136/327) | 60.8% (191/314) | 44.1% (90/204) |
| University education % (Weighted) | 40.8% | 44.4% | 63.9% | 48.1% |
| In employment (full-time, part-time, self-employed): % (n/N) | 63.0% (204/324) | 58.0% (189/326) | 67.9% (214/315) | 55.3% (114/206) |
| In employment (full-time, part-time, self-employed): % (Weighted) | 65.4% | 65.5% | 71.5% | 72.3% |
Note: Smaller sample sizes feature throughout the tables in this report due to respondents opting out of questions (e.g., selecting the “Don’t know/Rather not say” option) or due to survey logic.
5.2 Attitudes to culture and heritage
Of the pooled user sample, 23% had visited a museum or art gallery in the past 12 months (see Table 4.2). Note that this research took place shortly after the reopening of museums and galleries following the COVID-19 lockdowns in England, accounting for the very low figure of recent visits (compared with the pre-COVID-19 figure of 67% as collected in the 2019 ACE survey of gallery visitors[footnote 55] and 51% as collected in the 2019/20 ONS Taking Part survey of museum or gallery visitors[footnote 56]. Similarly, the DCMS Participation Survey October to December 2021[footnote 57] found physical attendance at a museum in the previous 12 months to be 23% (during the period the DCMS Participation Survey reviewed, there were several prolonged periods of museum closures on account of COVID-19 regulations).
When asked what top five areas should be prioritised for public funding, 23% of pooled respondents listed arts and culture.[footnote 58] While this percentage accounts for less than a quarter of the sample, it is important to note that there were other areas of significant concern and political focus at the time the survey was conducted. For example, intuitively 79% listed public health as one of their top five areas for public funding. However, most respondents had been taken to art galleries and museums by their parents, guardians, or school before they turned 15 years old (82%) suggesting the respondents had had some long-term engagement with arts and cultural organisations.
-Table 4.2 User attitudes towards arts and culture
| Derby Museum and Art Gallery | Bristol Museum and Art Gallery | Foundling Museum | Great North Museum | Pooled | |
|---|---|---|---|---|---|
| User agreements | |||||
| Visited a museum or art gallery in the last 12 months (%) | 18.4% | 23.4% | 35.4% | 23.7% | 23.1% |
| Arts or culture amongst the top 5 priorities for public spending (%) | 23.4% | 21.4% | 24.6% | 27.9% | 23.1% |
| Introduced to art under 15 years old (%) | 79.1% | 83.9% | 86.0% | 81.0% | 82.2% |
| Member of a cultural, heritage, conservation, or environmental organisation (%) | 3.9% | 4.8% | 12.3% | 7.4% | 5.6% |
Most respondents agreed that preserving museums and art galleries for current and future generations was important (73%, see Table 4.3). Furthermore, most agreed that museum digital content should be free for all to access (68%). This suggests perhaps that the sample derives some non-use value from the digital offering of museums (though as noted earlier, this is not a possibility we analyse in this study). Only between 22% and 29% disagreed that ‘there are more important things than museums to spend my money on’, though as noted above these responses may have been influenced by the extraordinary priority attached to public health in the minds of most respondents at the time of fieldwork.
When asked whether they believed ‘digital content will replace in-person museum experience’, only 34% agreed, suggesting a clear distinction between the value of the physical and digital offer of museums and art galleries for most survey respondents. Following the contingent valuation scenario, respondents were asked if they were likely to continue to engage with digital cultural content in the future, to which 58% of all respondents agreed (Agree and Strongly Agree). Of these, 68% had not physically visited the museum or gallery in question in the previous 12 months. In the Audience Agency’s Digital Audience Survey (Summer 2021) of digital audiences for cultural institutions,[footnote 59] they found that 74% of digital visitors to organisations in their sample had never physically visited the organisation in person. These findings are suggestive that there may be a market for non-users of cultural institutions who are perhaps willing to engage with their digital offer, regardless of whether they have or have not yet visited in person.
Table 4.3 User agreements towards arts and culture
| Derby Museum and Art Gallery | Bristol Museum and Art Gallery | Foundling Museum | Great North Museum | Pooled | |
|---|---|---|---|---|---|
| User agreements | |||||
| Agree and Strongly Agree | |||||
| Preserving museums for the appreciation of current and future generations is important to me. (%) | 72.6% | 73.0% | 74.0% | 69.9% | 72.6% |
| Digital content will replace in person experience. (%) | 33.3% | 34.6% | 39.0% | 26.5% | 33.9% |
| Museum digital content should be free for all to access. (%) | 66.3% | 69.6% | 65.6% | 69.9% | 68.0% |
| Disagree and Strongly Disagree | |||||
| There are more important things for me to spend my money on than museums. (%) | 25.3% | 23.5% | 22.4% | 29.3% | 24.5% |
5.3 Visits
Previous visits
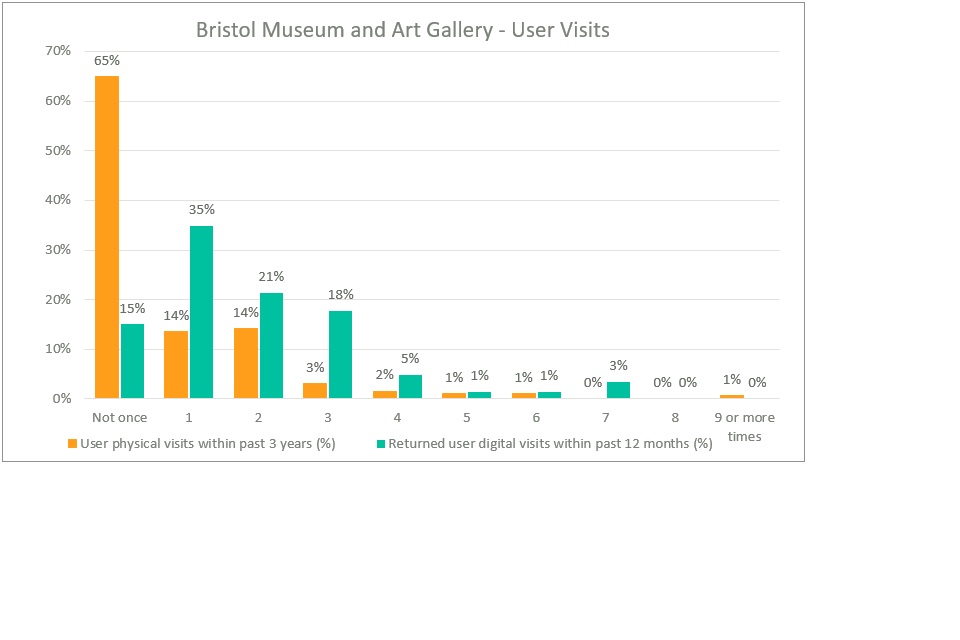
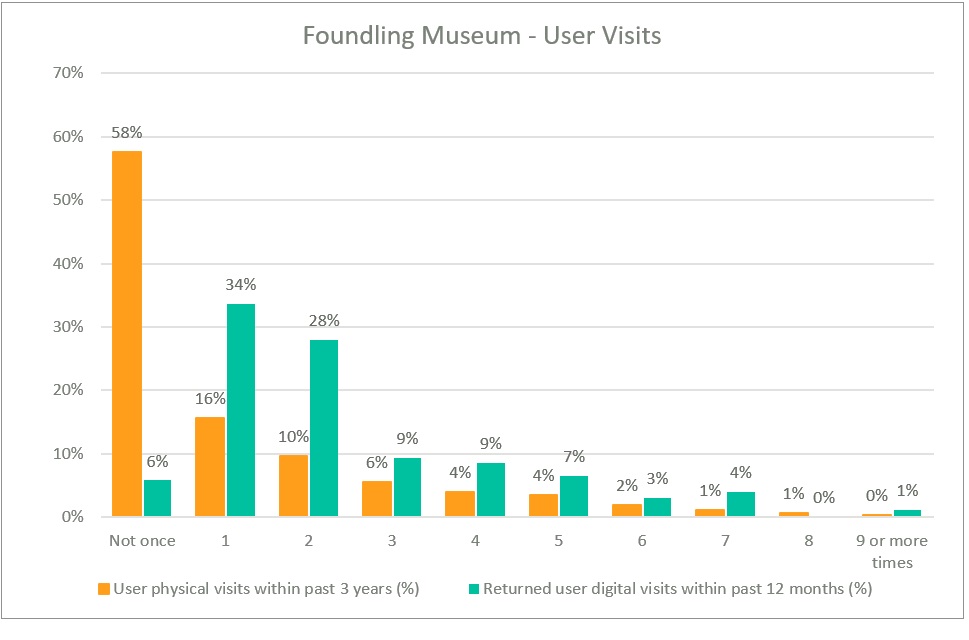
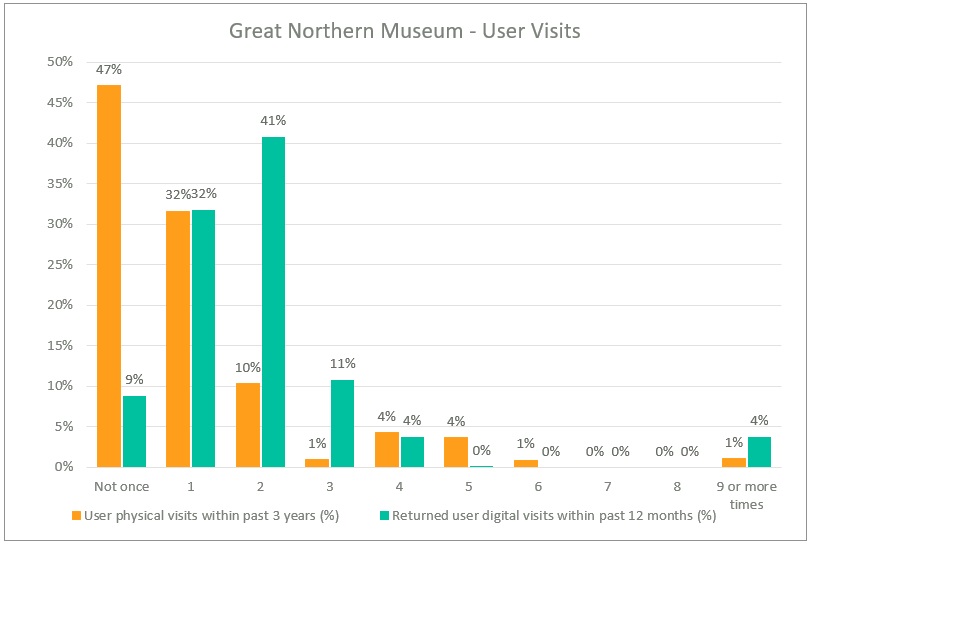
Figures 4.1 and 4.2 presents respondents’ self-reported physical and digital visits across the four galleries and museums. Respondents were first asked about their physical visits over the past three years. Three years was our preferred time period to use (compared with, say, one year), given that so many arts and cultural organisations had been closed for large periods in this time. Of the pooled sample, only 36% had visited the physical site in the past three years. 23% had browsed and accessed digital content from the institution in the past (Figure 4.1 for institution-by-institution figures).
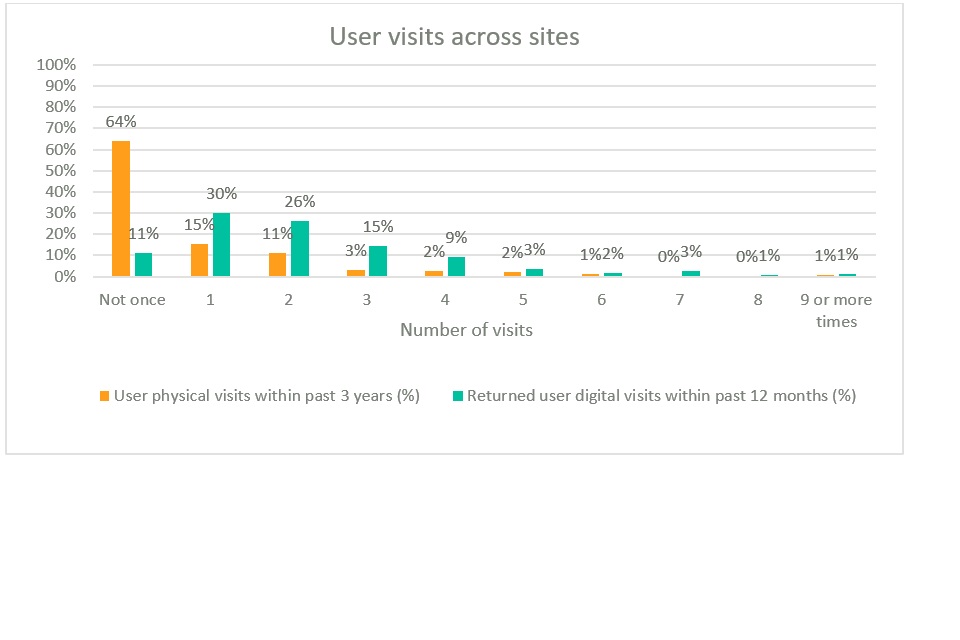
Figure 4.2 shows that 89% of respondents of those who had previously visited the website and engaged with the digital content, claimed to have had visited the institution’s website within the past 12 months on at least once occasion – a far greater than the equivalent number for even three years of physical museum visits. However, the comparison is not like with like, as a digital and physical ‘visit’ typically involve very different time commitments, with digital visits perhaps naturally resulting in more frequent but brief visits. Consistent with this, Visit Bristol[footnote 60] reports two hours as an approximate visit length to the Bristol Museum and Art Gallery, whereas website analytics suggest that digital visitors to the main website spend on average under 2 minutes on the site. This does not, however, allow for the possibility that some users download website content and engage with it offline.
Figure 4.1. Physical visitors (within the past three years) and digital visitors (no time period) across sites
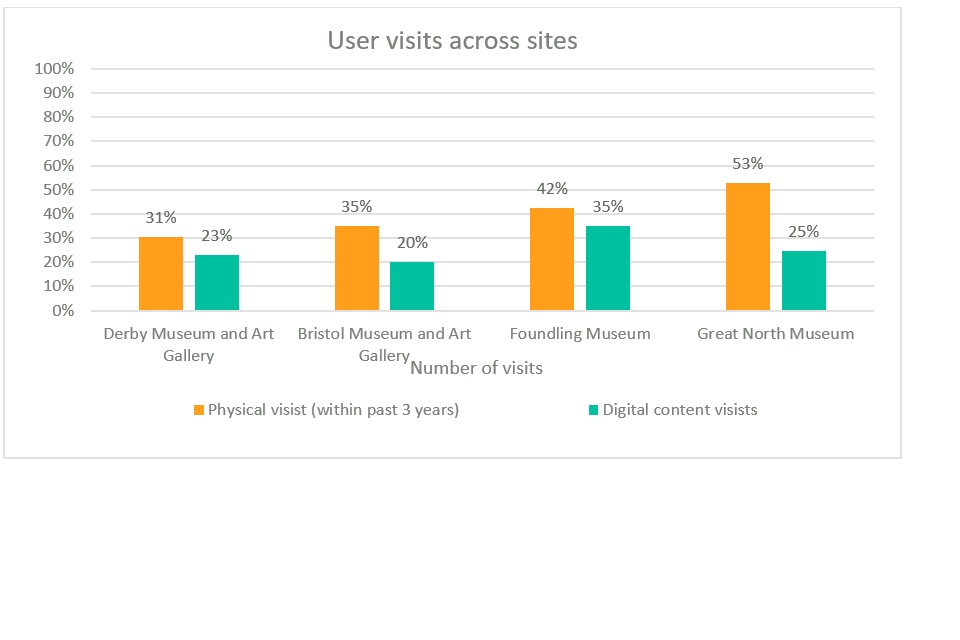
Figure 4.2 Frequency of physical visits (within the past 3 years) and digital visits (with respect to returned digital users) average across sites
Future visits
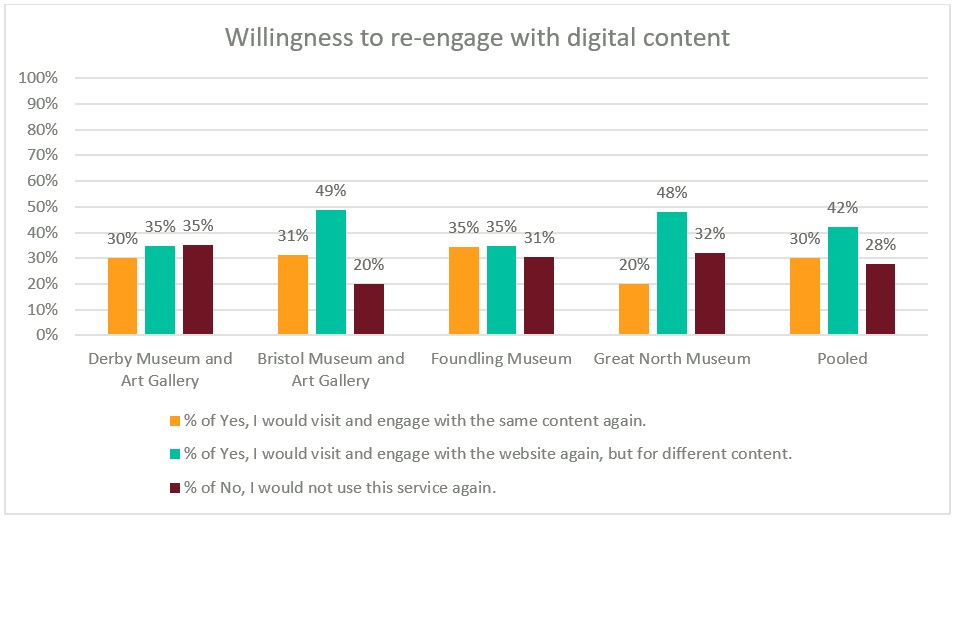
Following the contingent valuation scenario, survey respondents were asked if they were willing to revisit the digital site in the future. In total, 30% of users reported they would revisit the site and engage with the same content again, whereas 42% of users reported that they would revisit the site but would prefer to engage with different digital content (see Figure 4.3). The latter aligns with the popularity of digital subscription service market offerings, whereby new and different content is published to keep users returning to the service. Willingness to re-engage with either the same or new content was apparent across all four sites (ranging from 20% - 49%). Of the pooled sample, 28% were not willing to engage with the digital offer again regardless of whether new content was offered. This may conceivably have been due to a lack of interest in the digital offer topic (consistent also with the finding that the majority of users saying they were unwilling to pay for a physical visit to the gallery or museum said so because they were not interested in the digital content - see Table 4.16 in Section 4.5.4). It should be noted in this context that users did not select the digital offering they valued but were free to explore the website more widely.
Figure 4.3 Likelihood of digital Users re-engaging with the digital offer
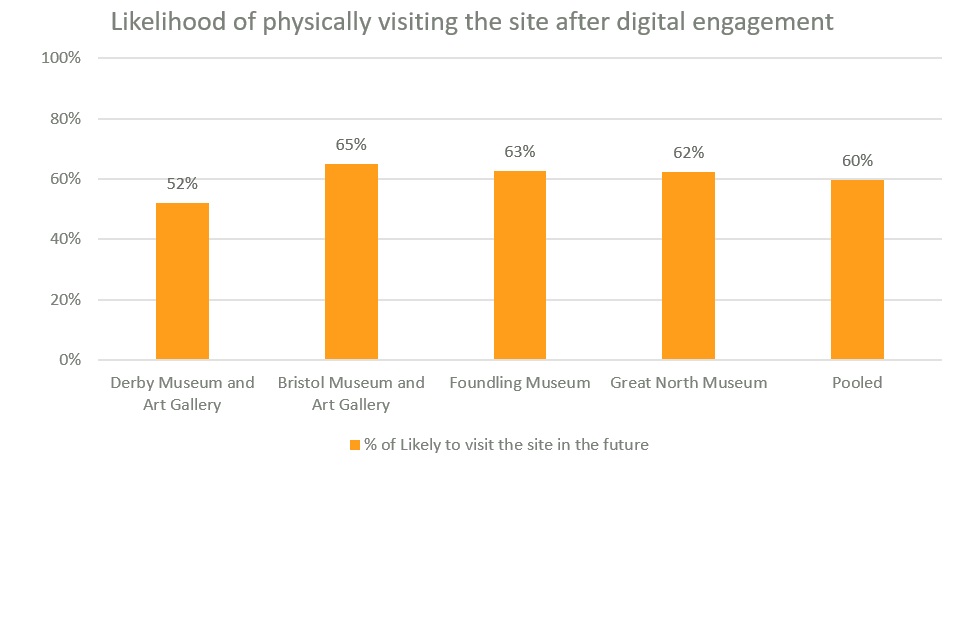
When asked whether they would be willing to physically visit the gallery or museum after engaging with and valuing the institution’s digital offer, 60% of users were willing to do so (ranging from 52% - 65% across institutions, see Figure 4.4). This is particularly notable given that 64% of the total sample had not previously visited the gallery or museum in question in the past three years and 23% of the total sample had not visited any art galleries or museums in the past 12 months. This is suggestive that the digital offering may perhaps act as a marketing opportunity for in-person visits to museums and art galleries.
Figure 4.4 Percentage of Users willing to physically visit the site in the future
5.4 WTP in theory
Using multivariate regression analysis, this research explored how individuals’ willingness-to-pay figures are associated with drivers of value, such as income and general attitudes towards arts and culture, in ways that accord with prior expectations and previous findings from the literature.[footnote 61] The following regression model was used:
WTPi = α + βXi + εi
where WTPi is the amount the individual i has stated they are willing to pay (mid-point), α is the deterministic factor and ε is the error term containing unobserved factors that determine willingness to pay. In Xi, the observed determinants of willingness to pay are controlled for, with β representing the corresponding regression coefficients.[footnote 62]
A series of multivariate regressions, reported in section 4.3.2, explore the following factors on respondent’s stated WTP:
- standard socio-demographic factors known in the literature[footnote 63] to influence WTP, including gender, age, household income, and the number of dependent children
- lifestyle and attitudinal factors, such as museum memberships, sentiments towards arts and culture (e.g., preserving museums for the appreciation of current and future generation is important), and respondent certainty about their stated WTP for the digital offer
- engagement with the good, such as the number of previous in-person visits to the gallery or museum and the number of previous visits to the digital site
- socio-economic factors, to assess the impact of broadening of audience across cultural backgrounds or ethnic groups and social classes (e.g., respondent’s school education (state funded or run), respondents’ parental educational qualifications (no degree), and respondents’ parental occupation while growing up (lower-level job class)
- COVID-19 impact factors, by exploring if the pandemic had not occurred, what impact would this have had on respondent’s WTP
WTP in principle
As best practice in CV surveys, a pre-selected group of values[footnote 64] were provided to survey respondent by payment cards, which elicited WTP values for the valuation scenario. Values elicited from payment cards are lower bounds of respondents’ actual WTP value for the good. Therefore, mid-points of the payment card value were chosen, and the next ascending payment card value was used to determine respondents’ actual WTP. From these mid-points, the mean WTP was calculated for the sample. The subscription fee was presented as a payment on behalf of their household as digital content is typically offered on a family subscription or household subscription. This payment vehicle of a subscription fee has been used in previous valuation research.[footnote 65] Zero as well as positive values were considered as WTP estimates as best practice in CV surveys. This ensures that the average values computed are representative of all users’ preferences. Specifically, survey respondents were presented with a series of payment values to select from if they were willing to pay in principle (i.e., ‘Yes’ or ‘Maybe’), or assigned a £0 bid if they were not willing to pay in principle.
When asked if they were prepared in principle to pay a monthly household subscription, 58% responded ‘Yes’ or ‘Maybe, and 42% were not willing to pay (see Table 4.4). This broad 50/50 split for those willing to pay and those not willing to pay is common in CV surveys. The preponderance of zero bids should not be surprising, given that so much digital content is widely and freely available on the internet. It is also a feature in the contingent valuation of the BFI’s Britain on Film’s online content mentioned earlier.[footnote 66]
Table 4.4 Monthly household subscription fee: WTP in principle
| Museum | Derby Museum and Art Gallery | Bristol Museum and Art Gallery | Foundling Museum | Great North Museum | Pooled |
|---|---|---|---|---|---|
| Yes | 18.1% | 16.7% | 19.8% | 19.2% | 17.8% |
| Maybe | 35.1% | 46.4% | 36.4% | 30.9% | 39.8% |
| No | 46.7% | 36.9% | 43.9% | 49.8% | 42.4% |
Validity testing
Validity testing, as per best-practice in CV studies (Bennett et al. 1998), includes:
- construct validity: whether the value estimates correlate in expected ways with known drivers of WTP (e.g., income, demographic factors, cultural engagement).
- content validity: whether the respondents’ answers are aligned with the key characteristics of the value that the survey is designed to elicit.
- external validity: whether the estimates align with what is known from other contingent valuations of other institutions.
Construct validity and external validity are discussed in Section 4.4.2, whereby the determinants of WTP for the digital offer for the four art galleries and museums are explored and compared with previous findings of CV of (physical) cultural goods.
Follow-up questions investigated how certain users were that they would be willing to pay for the digital offer and how consistent they believed their responses would be if they were asked the same questions in the following month. Overall, certainty was high across respondents with 56% of the sample certain they would be willing to pay their stated WTP for the digital offer. If they were asked again, 77% of users said they would provide the same answers in the following month (Table 4.5). These results provide some confidence that the users took the survey seriously and, to the best of their knowledge, provided considered responses.
Table 4.5 Users certain their responses would be consistent if asked the same survey the following month
| Museum | Derby Museum and Art Gallery | Bristol Museum and Art Gallery | Foundling Museum | Great North Museum | Pooled |
|---|---|---|---|---|---|
| Certain they would provide the same answers if asked again in one month | 79.2% | 76.0% | 72.3% | 76.6% | 76.8% |
Note that those respondents who were not certain they would have to pay (i.e., those who selected ‘I don’t believe that I would really have to pay’ as the reason behind their WTP value) were flagged for potential screen-out (see Section 6.1.2).
5.5 WTP for Digital Offer
Table 4.6 shows the WTP a monthly household subscription fee to access the digital offer of the four galleries and museums. This varied across the four sites, ranging from £3.27 for Derby Museum and Art Gallery to £4.93 for Foundling Museum. The median WTP in all cases was lower, reflecting the large number of £0 responses. The large proportion of zeros (44%) is comparable to previous CV studies in cultural economics, wherein 49% of new users and 36% of existing users were not willing to pay anything for access the BFI’s Britain on Film’s online content as a monthly subscription fee.[footnote 67] Overall, the reluctance of these individuals to pay for online content should perhaps not be surprising, given that so much digital content is widely and freely available on the internet. The proportion of zero bids for the digital offer tends to be higher than typically found for cultural institutions’ physical offers. For example, the Arts Council England Galleries and Theatres Benefit Transfer report, cited earlier, reported that 31% of respondents in that study were not willing to pay an individual entry fee to visit a regional art gallery in person.[footnote 68]
Table 4.6 WTP a monthly household subscription fee for Digital Offer
| Museum | Derby Museum and Art Gallery | Bristol Museum and Art Gallery | Foundling Museum | Great North Museum |
|---|---|---|---|---|
| Mean (std. err.) | £3.27* (£0.32) | £4.37 (£0.52) | £4.93 (£0.63) | £3.92 (£0.80) |
| Lower confidence interval (CI) (95%) | £2.64 - £3.89 | £3.35 - £5.39 | £3.68 - £6.17 | £2.34 - £5.51 |
| Median | £0.38 | £2.75 | £1.25 | £0.00 |
| Zeros | 49.0% | 38.0% | 46.0% | 51.0% |
| Payment card zeros | 2.7% | 1.1% | 2.1% | 1.2% |
| Sample size | 326 | 327 | 317 | 207 |
Selection biases in the four study sites cannot of course not be ruled out. For example, the Foundling Museum is in London, which, due to its central location, may conceivably elicit greater WTP values as other museums in the vicinity may be charging higher values for entry than museums outside of London. This is just one reason why the WTP estimates for the different institutions should not be compared. There are also great differences in the digital content on offer, as noted earlier. For example, the Great North Museum offered a virtual tour of one of their current exhibitions, whereas the Foundling Museum provided talks about the history and stories behind the museum’s artefacts. Survey respondents may be naturally inclined to pay more for some digital offers, and less for others but this possibility was not studied in this research. While the confidence intervals appear to be within reasonable scope, the offer being valued is likely to be susceptible to a myriad of biases that may not be immediately apparent.
Reasons behind WTP
Respondents were also asked why they were willing or not to pay the monthly subscription fee. The pooled responses are presented in Table 4.7 and Table 4.8. When respondents were asked to provide their motivations behind why they were willing to pay the monthly household subscription fee, the most frequently selected reason (26%) was that they were willing to pay ‘not just for visiting the (digital content of the site), but also an expression of my support for all the work that (the site) does’. This suggests that both the digital and the wider work (including physical offer) of the gallery or museum is being considered when users are asked if they are willing to pay a value for digital access. The implication is that at least 26% of respondents provided values that strictly speaking were out of scope of the study. The valuation scenario asked respondents to consider what they would be willing to pay to access the digital offer only. More generally, the intersection between the physical and digital offering of galleries and museums in the public’s eyes must be considered to avoid the risk of over-estimating the value of an institution’s (digital and physical) offering. The second most common selected reason (17%) was that respondents ‘enjoyed the (digital content)’. No respondent selected they didn’t believe they would really have to pay, which perhaps provides some comfort that respondents viewed the scenario as realistic. For those not willing to pay, 30% reasoned that they would prefer to visit in person than visit online and 22% selected that they could not ‘afford to pay to visit the (digital content)’.
Table 4.7 Reasons behind WTP for a subscription fee to access the digital offering (pooled sample)
| WTP Categories | % |
|---|---|
| I enjoyed the (digital content) | 17.3% |
| I like visiting/I enjoyed my visit to the (site), so I am happy to pay to support their (digital content) | 9.7% |
| I think (digital content) could be improved if the (site) had more funds | 7.7% |
| I may want to visit the (digital content) in the future | 10.8% |
| The (site) and (digital content) is an important site of cultural heritage that should be protected | 10.4% |
| I don’t believe that I would really have to pay | 0.0% |
| My willingness to pay is not just for visiting the (digital content), but also an expression of my support for all the work that (site) does | 25.7% |
| I want more digital content than what was offered, so I am happy to pay for more content | 5.0% |
| I think it is important for museums to offer digital content | 11.2% |
| Other | 2.2% |
| Don’t know | 0.0% |
Table 4.8 Reasons behind Not WTP for a subscription fee to access the digital offering (pooled sample)
| WTP Categories | % |
|---|---|
| There are more important things to think about than the (site)’s (digital content) | 6.1% |
| I cannot afford to pay to visit the (digital content) | 22.6% |
| I did not enjoy the (digital content) | 4.8% |
| I don’t plan to ever visit the (digital content) again | 7.1% |
| I am already contributing enough to museums through my taxes | 1.5% |
| I don’t mind making a donation, but I don’t want to pay a subscription fee | 18.1% |
| I need more information to answer this question | 1.6% |
| I don’t feel confident stating a value that I would be willing to pay in the current uncertain climate | 4.3% |
| I don’t want to support the (digital content) because I would prefer different digital content | 0.2% |
| I don’t believe that a subscription fee would be raised to pay for (site)’s (digital content) | 1.7% |
| I would prefer to visit in person than visit online | 30.4% |
| Other | 1.5% |
| Don’t know | 0.0% |
Determinants of WTP
Using multivariate regression analysis, the WTP figures were explored for theoretically consistent drivers of WTP values in ways that accord with prior expectations and previous findings from the literature, as discussed earlier.[footnote 69] Table 4.9 presents the results for the four institutions with respect to first-time users. Table 4.10 outlines the same factors associated with WTP for digital offer specifically if survey respondents were a returned digital user (i.e., they had visited the website before) or returned physical user (i.e., they had visited the physical site before). This is an important test of the validity of the results obtained.
Table 4.10 shows that the WTP a monthly subscription fee on behalf of their household to support and access the institutions’ digital offering for returned users was positively and significantly associated with employment across all four institutions.
It is noteworthy that income is not statistically significant both for first-time and returned users. This lack of significance of income contrasts with previous findings in the cultural economics literature.[footnote 70] Conceivably the lack of income sensitivity might be explained by the fact that digital offerings tend to have lower cost barriers to entry (e.g., are free to access and involve no travel cost, unlike with when visiting a physical site), especially considering that as an online survey all respondents without access to an internet (and whose consumption decisions may be more income elastic) by definition would have been excluded from our sample.
Other factors related to social class may also be more significant drivers of WTP than income. In particular, it turns out that a higher WTP is associated with the users’ school type, their parents’ education, and their parents’ job when they were growing up. Specifically, users who went to an independent of or fee-paying school, whose parents had at least one degree level qualification, and whose parents held Senior management or administrator roles were willing to pay more on average for the digital offer (see Table 4.17 - Table 4.19 later in this report). This is consistent with the findings of previous arts and heritage CV studies[footnote 71] and research on cultural participation more generally.[footnote 72] Although, note the sample sizes for some of these groups are small and any conclusions drawn should be viewed with this caveat in mind.
Table 4.10 shows that the number of physical visits to the institution in the past 3 years was not significantly associated with WTP for the digital offer, as might perhaps have been expected if physical visits enriched the value of the online experience for digital visitors. This perhaps should not be surprising, however, given the valuation was for the digital offering and not the physical offering. Digital users may in any case be demographically different to users who physically visit galleries and museums. It is also noteworthy that digital visits to the site was not significantly associated with the WTP either. It could be speculated that one reason for an absence of a positive effect is the high frequency of the digital offer updates on the website counteracting any positive impacts of repeated digital visits on the perceived benefits of visiting an institution’s collection in person.
Listing arts and culture in one of the top five areas for public spending was significantly negatively associated with WTP for the digital (see Table 4.10). This contrasts with other CV studies which tend to find a positive and significant relation between WTP and attitudes more generally towards culture.[footnote 73] Again, this may have possibly reflected a perception that gallery and museum digital offers, amongst those who deem them a priority for public spending, should be ‘free’, although agreement with the statement ‘Digital content should be free to access for all’ was not found to be a statistically significant determinant of WTP.
The effects of the COVID-19 pandemic may have also impacted this relationship, whereby health may have taken precedence over other areas of importance in public funding and digital offers may have been seen as only a temporary replacement for physical visits. As perhaps might be expected, being member of a museum or gallery was significantly and positively associated with WTP. Further, as may be expected, certainty that the respondent would really be content to pay this amount as a monthly subscription was significantly and positively associated with WTP.
Table 4.9 Factors associated with willingness-to-pay for subscription fee to access digital content: First-Time Users Multivariate regressions
| Derby Museum and Art Gallery | Bristol Museum and Art Gallery | Foundling Museum | Great North Museum | |
|---|---|---|---|---|
| Female | -0.374 | -0.169 | -0.761 | -0.674 |
| Log age, using age midpoint | -1.220 | -1.410* | -1.292 | -1.160 |
| Log of household income | -0.500 | -0.660 | -0.649 | -0.654 |
| Employed | 0.698 | 1.219* | 0.555 | 0.572 |
| Membership - Member of a museum or gallery | 1.427 | 4.256 | 1.513 | 2.287 |
| Public spending - Arts and culture | -0.771 | -1.111 | -0.829 | -1.075* |
| Agree that museums should be preserved for future generations | 0.662 | 0.459 | 0.579 | 0.601 |
| Use - Certainty | 0.012 | 0.028** | 0.014 | 0.013 |
| Taken to cultural or heritage sites when growing up (up to 15 years old) | -0.282 | 0.045 | -0.828 | -1.021* |
| Constant | 13.299** | 14.407** | 15.748** | 15.537** |
| Observations | 325 | 338 | 321 | 320 |
| Adjusted R-squared | 0.019 | 0.068 | 0.033 | 0.038 |
Notes: ***significance at <1%; **significance at <5%; *significance at <10%. Heteroskedasticity-robust standard errors.
Table 4.10 Factors associated with willingness-to-pay for subscription fee to access digital content: Digital & Physical Returned Users Multivariate regressions
| Derby Museum and Art Gallery | Bristol Museum and Art Gallery | Foundling Museum | Great North Museum | |
|---|---|---|---|---|
| Female | -1.032 | -1.339 | -1.155 | -1.032 |
| Log age, using age midpoint | -0.425 | -0.277 | -0.275 | -0.425 |
| Log of household income | 0.009 | 0.068 | 0.058 | 0.009 |
| Employed | 3.996** | 3.583** | 3.933** | 3.996** |
| Membership - Member of a museum or gallery | 7.338** | 5.702* | 7.123** | 7.338** |
| Public spending - Arts and culture | -4.151*** | -3.737*** | -4.127*** | -4.151*** |
| Agree that museums should be preserved for future generations | -0.914 | -1.856 | -0.813 | -0.914 |
| Use – Certainty | 0.052** | 0.062** | 0.056** | 0.052** |
| Taken to cultural or heritage sites when growing up (up to 15 years old) | -0.288 | -0.468 | -0.413 | -0.288 |
| Number of physical visits in past 3 years | -0.240 | -0.008 | -0.183 | -0.240 |
| Visited website | -0.084 | 0.164 | 0.103 | -0.084 |
| WTP to visit physical site again | -0.009 | 0.006 | -0.007 | -0.009 |
| Constant | 5.867 | 4.057 | 4.098 | 5.867 |
| Observations | 143 | 144 | 144 | 143 |
| Adjusted R-squared | 0.187 | 0.157 | 0.180 | 0.187 |
Notes: ***significance at <1%; **significance at <5%; *significance at <10%. Heteroskedasticity-robust standard errors.
The model fit (Adjusted R-squared) across all regressions was lower than previous research studies conducted on behalf of DCMS and Arts Council England,[1] however broadly in line with recent benefit transfer reports.[2] Contingent Valuation estimates for the digital offering are expected to be noisier than for estimates of physical visits, as such the lower explanatory power of the model (lower adjusted R-squared) is to be expected. This reinforces the point that the findings should be considered with caution.
WTP based on previous engagement
In this section, users’ WTP is considered in relation to their previous visit history. Specifically, we distinguish between:
- returned physical users – who had previously physically visited the gallery or museum.
- first-time physical users – who had previously not physically visited the gallery or museum (however could have potentially previously engaged with the digital offer).
- returned digital users – who had previously engaged with the digital offer.
- first-time digital users – who for the first time were engaging with the digital offer (however could have previously physically visited the gallery or museum).
These groups are not mutually exclusive.
Table 4.11 and Table 4.12 show that the average WTP for the digital offer for returned digital users exceeded that for returned physical users in all cases. That is, those who had previously engaged with the digital offer were willing to pay more for the digital offer compared with those who had only visited the site in person. However, the estimates varied across institution, ranging from £7.58 to £10.65 in the case of returned digital users and £5.54 to £9.30 for returned physical users.
Compared with returned users, first-time (digital and physical) users on average reported lower values. This seems intuitive, as this group had not previously engaged with the gallery or museum’s work either digitally or in person. On average, first-time physical users reported a WTP of £2.18 compared with £7.24 for returned physical users. First-time digital users reported a WTP of £2.85 compared with £9.39 for returned digital users. The sample size for first-time digital users is however small and therefore any findings are necessarily tentative.
Returned digital users were willing to pay £6.54 on average more than first-time digital users. It is possible that this difference is explained by differences in the socio-demographic make-up of the two groups, whereby returned digital users are on average younger, have higher household income, and more likely to have a degree and be employed. It is also possible that returned digital users better appreciate the experience the digital offer, which may show in their WTP (e.g., the fact that unlike the physical offer there is no possibility of ‘congestion’, the fact that the digital offer can be accessed at any time of convenience, and that there are no travel costs incurred). Interestingly, returned physical users were willing to pay £15.06 more than first-time physical users. This difference is perhaps implausibly large, nonetheless, it is consistent with the possibility that returned users hold a greater value for the good, after having engaged with the gallery or museum – whether that is digitally or in person.
Table 4.11 Returned Users: WTP a monthly household subscription fee for Digital Offer
| Museum | Derby Museum and Art Gallery | Bristol Museum and Art Gallery | Foundling Museum | Great North Museum |
|---|---|---|---|---|
| Returned Physical User | ||||
| Mean (std. err.) | £6.21* (£0.79) | £7.87 (£1.26) | £9.30 (£1.34) | £5.54 (£1.40) |
| Lower confidence interval (CI) (95%) | £4.64 - £7.78 | £5.37 - £10.37 | £6.65 - £11.96 | £2.75 - £8.32 |
| Median | £4.25 | £3.75 | £4.25 | £2.75 |
| Sample size | 89 | 89 | 122 | 82 |
| Returned Digital User | ||||
| Mean (std. err.) | £7.58* (£1.06) | £10.54 (£2.15) | £10.65 (£1.62) | £9.32 (£2.99) |
| Lower confidence interval (CI) (95%) | £5.45 - £9.70 | £6.20 - £14.89 | £7.43 - £13.86 | £3.22 - £15.42 |
| Median | £4.25 | £5.50 | £5.50 | £3.75 |
| Sample size | 55 | 43 | 92 | 32 |
Note: Asterisks refer to the significance of a t-test (*p<0.05, **p<0.01).
Table 4.12 First-time Users: WTP a monthly household subscription fee for Digital Offer
| Museum | Derby Museum and Art Gallery | Bristol Museum and Art Gallery | Foundling Museum | Great North Museum |
|---|---|---|---|---|
| First Time Physical User | ||||
| Mean (std. err.) | £1.97* (£0.24) | £2.48 (£0.32) | £1.71 (£0.30) | £2.11 (£0.60) |
| Lower confidence interval (CI) (95%) | £1.49 - £2.44 | £1.86 - £3.10 | £1.11 - £2.31 | £0.93 - £3.29 |
| Median | £0.00 | £0.63 | £0.00 | £0.00 |
| Sample size | 237 | 238 | 195 | 125 |
| First Time Digital User | ||||
| Mean (std. err.) | £5.21* (£3.29) | £1.04 (£0.68) | £1.59 (£1.02) | £6.83 (£3.85) |
| Lower confidence interval (CI) (95%) | £-2.84 - £13.25 | £-0.63 - £2.72 | £-1.04 - £4.23 | £-9.73 - £23.38 |
| Median | £2.25 | £0.00 | £0.00 | £11.25 |
| Sample size | 8 | 7 | 6 | 3 |
Note: Asterisks refer to the significance of a t-test (*p<0.05, **p<0.01).
Willingness to physically visit
Respondents were asked whether they were willing in future to visit the gallery or museum in-person after having interacted with its digital offer (see Table 4.13). Around 11% of first-time digital users and around 63% of first-time physical users were interested in doing so. Although these groups were not necessarily mutually exclusive, these results may be of interest to galleries and museums’ audience development strategies. For those who said they were interested in visiting the institution in the future, the survey then asked how much they would be willing to pay as a one-off individual entry fee to do so. The average WTP varied from £10.90 in the case of the Great North Museum to £21.60 for the Derby Museum and Art Gallery (see Table 4.14).
Respondents were then asked why they were willing, or not willing, to physically visit the site after exploring the digital content. Interest formed a key reason behind willingness to visit, with 33% conveying they were ‘interested in visiting museums generally’ and 26% were willing to visit because ‘the online experience has stimulated my interest in the topic’ (see Table 4.15). For those not willing to visit, 57% were not interested in the digital offer topic they were asked to explore as part of this survey and 43% said they would prefer to visit a different gallery or museum (see Table 4.16). Of course, we cannot establish if these respondents would have been willing to physically visit the gallery or museum if they had engaged with a different digital offer. Another proviso is that survey respondents were actually allowed to explore the website more widely, including in principle other available digital content, with no specified time-limit for digital exploration within the survey if they chose to (although in practice no respondent spent more than 165 minutes[footnote 76] in exploring the digital content before progressing with the survey). As the survey did not track respondents’ online behaviours, we cannot, as noted earlier, rule out the possibility that they may have engaged with the content offline (e.g., downloading material or watching content offline).
Table 4.13 Likelihood of physically visiting the site after engaging with Digital Offer
| Museum | Derby Museum and Art Gallery | Bristol Museum and Art Gallery | Foundling Museum | Great North Museum | Pooled |
|---|---|---|---|---|---|
| First-Time Digital User | 9.8% | 15.0% | 4.9% | 8.8% | 10.8% |
| First-Time Physical User | 68.7% | 63.2% | 56.6% | 45.3% | 62.6% |
| All users (returned and first-time) | 51.9% | 64.8% | 62.7% | 62.4% | 59.7% |
Table 4.14 WTP to physically visit site after engaging with digital offer
| Museum | Derby Museum and Art Gallery | Bristol Museum and Art Gallery | Foundling Museum | Great North Museum |
|---|---|---|---|---|
| Mean WTP | £21.60 | £11.80 | £16.40 | £10.90 |
Table 4.15 Reasons behind willing to physically visit the site after browsing the digital offering
| Willing to visit Physical Site Categories | % |
|---|---|
| I was interested in the topic. | 15.0% |
| I have enjoyed previous visits to the (site). | 18.2% |
| I have wanted to visit/revisit the (site) for some time. | 7.9% |
| I am interested in visiting museums generally. | 32.5% |
| The online experience has stimulated my interest in the topic. | 26.4% |
| Don’t know | 0.0% |
Table 4.16 Reasons behind not willing to physically visit the site after browsing the digital offering
| Not willing to visit Physical Site Categories | % |
|---|---|
| I was not interested in the topic. | 57.4% |
| I would prefer to physically visit other museums. | 42.6% |
| Don’t know | 0.0% |
5.6 Social mobility and arts broadening
Social mobility
The survey included Susan Oman’s social mobility questions to assess the impact of class and social inequality on WTP.[footnote 77] Questions included asking respondents about their past education (e.g., state-run or state-funded, or independent school), and what their parental qualifications and parental occupation were growing up. These were asked alongside standard demographic questions (current age, gender, dependents, marital status, education level, employment status, ethnicity, health status and household income).
Table 4.17 splits WTP for the digital offer by the type of school users went to. Intuitively, those who went to an independent or fee-paying school – bursary reported the highest average WTP (£6.44) compared with those who went to a state-run or state-funded school (£3.14).
Table 4.18 presents WTP by the type of education users’ parents received. Greater WTP was reported for those whose parents had at least one degree level qualification (£5.15) compared with those whose parents had no formal qualifications (£2.47).
Table 4.19 presents WTP by the respondents’ parents’ jobs when they were growing up. This has been identified by Oman as in principle an uncontentious question. Respondents were asked to only input values for the parent with the highest earnings and the highest educational achievements. A higher WTP for the digital offer was reported by those whose parents worked in senior manager and administrator roles (£7.41) and the lowest WTP reported by those whose parents were inactive growing up (£1.64).
These results are as expected and in line with the standard socio-demographic background known in the cultural economics literature to influence WTP, such as household income and education level: both of which would be shaped by respondents’ education background, and their parents’ education and primary job when growing up. In this context it is also interesting that as many as 82% of the sample reported that they had been taken to museums and art galleries when growing up (see Table 4.2). Being taken to cultural or heritage sites when growing up (up to 15 years old), was positively and significantly associated with WTP in the case of the Bristol Museum and Art Gallery and the Foundling Museum (see Table 4.20). This might suggest that while WTP is naturally lower for those social groups from lower socioeconomic backgrounds and education levels, engagement in arts and culture when they were younger may have been important in developing a constituency for culture and WTP for it when older.
Table 4.17 Users’ School Education (pooled sample)
| User School education | State-run or state-funded school - selective on academic, faith or other grounds | State-run or state-funded school - non-selective | Independent or fee-paying school – bursary | Independent or fee-paying school - no bursary | Attended school outside the UK | Other (please specify) | Total |
|---|---|---|---|---|---|---|---|
| Mean (std. errs.) | £3.15* (£0.37) | £3.69 (£0.37) | £6.44 (£1.67) | £5.15 (£1.05) | £5.79 (£1.67) | £2.78 (£1.35) | £3.92 (£0.28) |
| Lower confidence interval (CI) (95%) | £2.43 - £3.87 | £2.95 - £4.42 | £3.10 - £9.78 | £3.06 - £7.24 | £2.45 - £9.12 | £-0.41 - £5.96 | £3.36 - £4.47 |
| Median | £1.75 | £1.00 | £3.25 | £2.75 | £1.75 | £1.25 | £1.25 |
| Sample size | 312 | 610 | 56 | 73 | 73 | 8 | 1132 |
Note: Asterisks refer to the significance of a t-test (*p<0.05, **p<0.01).
Table 4.18 Users’ Parent Education (pooled sample)
| Parent education | At least one has a degree level qualification | Qualifications below degree level | No formal qualifications | Other (please specify) | Total |
|---|---|---|---|---|---|
| Mean (std. err.) | £5.15* (£0.65) | £3.92 (£0.38) | £2.47* (£0.39) | £1.17* (£0.58) | £4.05 (£0.30) |
| Lower confidence interval (CI) (95%) | £3.88 - £6.42 | £3.16 - £4.67 | £1.71 - £3.23 | £-1.33 - £3.68 | £3.47 - £4.63 |
| Median | £2.75 | £2.25 | £0.00 | £1.25 | £1.75 |
| Sample size | 355 | 463 | 269 | 3 | 1090 |
Note: Asterisks refer to the significance of a t-test (*p<0.05, **p<0.01).
Table 4.19 Users’ Parent Job (pooled sample)
| Parent Job | Mean (std err.) | Lower confidence interval (CI) (95%) | Median | Sample size |
|---|---|---|---|---|
| Senior managers and administrators | £7.41* (£1.24) | £4.96 - £9.86 | £3.25 | 157 |
| Modern professional occupations | £3.54 (£0.48) | £2.60 - £4.49 | £2.75 | 157 |
| Traditional professional occupations | £3.16 (£0.89) | £1.38 - £4.95 | £0.00 | 78 |
| Technical and craft occupations | £2.57* (£0.39) | £1.81 - £3.33 | £1.00 | 189 |
| Clerical and intermediate occupations | £3.35 (£0.50) | £2.36 - £4.34 | £2.25 | 142 |
| Semi-routine manual and service occupations | £4.75 (£1.04) | £2.68 - £6.82 | £2.75 | 125 |
| Routine manual and service occupations | £3.16 (£0.71) | £1.76 - £4.57 | £1.25 | 18 |
| Middle or junior managers | £3.45 (£0.70) | £2.07 - £4.84 | £0.00 | 88 |
| Retired | £2.12* (£0.95) | £0.12 - £4.11 | £1.25 | 18 |
| Short term unemployed | £1.69 (£1.32) | £-1.71 - £5.10 | £0.00 | 6 |
| Long term unemployed | £4.84 (£1.32) | £2.17 - £7.52 | £2.75 | 36 |
| Inactive | £1.64* (£0.91) | £-0.46 - £3.74 | £0.00 | 9 |
| Other | £3.94 (£1.83) | £0.16 - £7.71 | £1.25 | 25 |
| Total | £4.03 (£0.28) | £3.48 - £4.58 | £1.75 | 1138 |
Note: Asterisks refer to the significance of a t-test (*p<0.05, **p<0.01).
Table 4.20 Social Mobility factors associated with willingness-to-pay for subscription fee to access digital content: Multivariate regressions
| Derby Museum and Art Gallery | Bristol Museum and Art Gallery | Foundling Museum | Great North Museum | |
|---|---|---|---|---|
| Female | -0.080 | -0.377 | -1.412 | -4.291 |
| Log age, using age midpoint | -0.366 | -2.192** | -1.575 | -4.850** |
| Log of household income | 0.789 | -0.146 | 0.543 | 2.738 |
| Employed | 1.345** | 2.720*** | 0.156 | -2.163 |
| With dependent children | 2.068** | 1.622 | 5.514*** | 4.740* |
| Attended State run or funded school | -1.599* | -1.004 | -1.682 | 0.508 |
| Parent Qualification - No degree | -0.296 | -1.067 | -1.307 | 0.417 |
| Parent lower level job - unemployed/retired, manual/service occupations | 1.136 | 1.580 | -2.305* | -1.507 |
| Ethnic minority group - Asian / Asian British, Black / African / Caribbean / Black British, Mixed / Multiple ethnic groups or other | -0.926 | -0.984 | -1.251 | -4.627 |
| Taken to cultural or heritage sites when growing up (up to 15 years old) | 0.641 | 1.945** | 2.496*** | -1.614 |
| Constant | -4.276 | 11.209 | 3.968 | -3.035 |
| Observations | 271 | 274 | 261 | 173 |
| Adjusted R-squared | 0.077 | 0.060 | 0.096 | 0.102 |
Note: Asterisks refer to the significance of a t-test (*p<0.05, **p<0.01).
Cultural engagement by ethnic minorities and across ethnic groups
Table 4.21 presents the recent cultural engagement history of respondents split by different ethnic groups. Engagement, whether digital or physical, was reported as greatest by Mixed / Multiple ethnic groups (e.g., 6% had engaged with culture 10 or more times). The lowest experience rate of cultural content (whether digital or physical) over the past month was reported by Black / African / Caribbean / Black British (13% had experienced no cultural engagement over the past month).
The impact of COVID-19 is also likely to have influenced cultural engagement patterns, with the survey fieldwork having taken place between June and September 2021. The Asian / Asian British group were more likely to have been taken by parent(s), guardian(s), or school when growing up to cultural or heritage sites, whereas Mixed / Multiple ethnic groups were the least likely. While we cannot establish how representative these results are of the whole population, they suggest a rich direction of future research would be to probe more deeply differences between ethnic groups in digital and physical engagement with galleries and museums.
Table 4.21 Cultural engagement by different ethnic groups (pooled sample)
| User ethnicity | Asian / Asian British | Black / African / Caribbean / Black British | Mixed / Multiple ethnic groups | Whites British | White Other | Other ethnic group |
|---|---|---|---|---|---|---|
| Experienced / attended no cultural content / site in the past month | 0.5% | 12.7% | 1.8% | 3.2% | 1.7% | 0.0% |
| Experienced / attended 1 - 3 cultural content / site in the past month | 48.0% | 35.6% | 47.2% | 52.7% | 56.9% | 42.1% |
| Experienced / attended 4 - 6 cultural content / site in the past month | 40.8% | 29.6% | 44.3% | 39.3% | 37.3% | 44.1% |
| Experienced / attended 7 - 9 cultural content / site in the past month | 10.2% | 22.1% | 0.9% | 3.9% | 4.1% | 13.8% |
| Experienced / attended 10 or more cultural content / site in the past month | 0.5% | 0.0% | 5.8% | 1.0% | 0.0% | 0.0% |
| When growing up (up to 15 years old), were taken by parents or guardians or school to cultural or heritage sites | 92.4% | 80.6% | 75.0% | 81.5% | 81.4% | 83.3% |
COVID-19 impact on WTP
As part of the exploratory research conducted as part of this project, respondents were asked whether they believed the COVID-19 outbreak had affected their WTPs for the institutions whose work was being valued. Those respondents who identified their WTP had indeed been impacted were then asked to state a value for the digital offer for the gallery or museum in question in the scenario that the pandemic had never happened. The WTP for the digital offer, if COVID-19 had not happened is presented in Table 4.22.
In general, the values were higher for respondents who had previously stated a WTP (£9.80 on average) in comparison with respondents who had not previously stated a WTP (£3.90 on average). As expected, across all cases respondents reported a higher WTP than under the baseline case scenario (i.e., considering that COVID-19 had in fact happened). For example, the average WTP for the Foundling Museum’s digital offer increased from £4.93 to £11.50 per month. Although the effect of the COVID-19 pandemic was not the focus of the study, the findings support the intuition that the pandemic is likely to have substantially influenced the perceived value of galleries or museums’ digital offering.
We recommend repeating this research over time as it would be insightful to repeat this exercise for a period when there are no lockdown restrictions that constrain respondents’ access to the physical offering and choice.
Table 4.22 WTP a monthly household subscription fee for Digital Offer if COVID-19 had not happened
| Museum | Derby Museum and Art Gallery | Bristol Museum and Art Gallery | Foundling Museum | Great North Museum | Pooled |
|---|---|---|---|---|---|
| Mean of WTP (if WTP for use site) | £8.00 | £10.40 | £11.50 | £10.40 | £9.80 |
| Mean of WTP (if not WTP for use site) | £5.20 | £3.10 | £4.40 | £1.70 | £3.90 |
6. Conclusion
This research was conducted on behalf of Arts Council England (ACE) as part of a wider DCMS-sponsored research programme to develop a more standardised approach to estimating economic value in arts and cultural organisations, taking the broad benefits, to cultural non-users as well as users, into account. Non-market valuation through Contingent Valuation (CV) surveys, endorsed by HM Treasury’s Green Book, in principle allows for welfare values to be captured.
This research is the first, to the authors’ knowledge, attempt to capture the value held by the public for the digital offering of art galleries and museums in England, and as such the estimates reported should be read as strictly exploratory. Average WTP a monthly subscription fee for the digital offer of the four institutions studies ranged from £3.27 for the Derby Museum and Art Gallery to £4.93 for the Foundling Museum (see Table 5.1).
Table 5.1 Average WTP for digital offer
| Derby Museum and Art Gallery | Bristol Museum and Art Gallery | Foundling Museum | Great North Museum |
|---|---|---|---|
| £3.27 | £4.37 | £4.93 | £3.92 |
Some of the WTP determinants traditionally identified in the cultural economics literature were not found to be statistically significant. For example, income and spending attitudes towards culture were not found to be significantly positive determinants of WTP. While we cannot establish the representativeness of our survey samples, such findings may possibly highlight important distinctions in the eyes of the public between the digital offering, considered in this study, and physical offering explored in previous arts and heritage CV studies.
The results in this report are nonetheless strongly suggestive that the physical and digital offers of galleries and museums are closely related, but not identical experiences for visitors. That is, the findings reported add to the rapidly growing evidence base that the digital offerings of cultural institutions are not a perfect substitute for their physical offering.
However, the strong overlap between the physical and digital components of cultural institutions’ value proposition for individuals presents significant identification challenges in empirical attempts to value any single component in isolation. Simple attempts to do so risks over-estimation of the value of that institution’s physical or digital offering.
Amongst returned users, those who had previously engaged with the digital offer were willing to pay more for the digital offer compared with those who had visited the physical site’s offer. As expected, compared with returned users, first-time users reported lower WTP values. These findings provide potentially important insights for galleries and museums’ audience development strategies.
This study also provides tentative insights into how the impact of class and socio-ethnic background on engagement with cultural institutions varies across digital and traditional physical modes of engagement. The preliminary evidence suggests that, as with physical art and heritage offering, factors related to social class may be significant drivers of WTP for the digital offer.
In the survey, respondents were also asked whether they believed the COVID-19 outbreak had affected their stated WTPs. Those respondents who identified their WTP had been so impacted, reported a higher WTP than under the baseline scenario (i.e., considering COVID-19 had in fact been the reality). This finding suggests that the COVID-19 pandemic had had significant impacts on the perceived value of cultural engagement, and a timely reminder that all research estimating economic value for cultural institutions in this period must consider the implications of the pandemic on their results.
The focus of the research on valuing the digital offering of galleries and museums provided distinctive challenges for the research. Survey respondents were required to interact with the digital offering to elicit WTP values, meaning that the use values may have been artificially inflated. Consequently, the respondents were also all ‘users’, meaning that it was not possible to elicit possible non-use values for the digital offer. Furthermore, the inclusion in our sample of respondents who reasoned that ‘My willingness to pay is not just for visiting the [digital content], but also an expression of my support for all the work that [site] does’ is likely to have further inflated these values. It also further reinforces our qualification above about the potential overlap of a cultural institution’s digital and physical offerings in the eyes of the public.
While attempts were made to study a coherent set of digital offers in the study, there was still a great heterogeneity between the digital content and experiences on offer, making invalid any simple comparisons of the WTP estimates across institution. A monthly subscription fee was chosen as a realistic payment vehicle, but no payment term was specified, so as to align with the practice of popular subscription services that are familiar to the public. This means that the WTP results should only be considered for one month and not be aggregated beyond this. Although the survey responses were weighted using data from institutions’ websites and social media traffic in an attempt to make the estimates more representative, for the aforementioned reasons and more, the study is necessarily exploratory, and the findings should be interpreted with due caution and should not be transferred between sites in a benefit transfer. Despite these limitations, the authors hope the report is a stimulus to more research in an increasingly important area of work for art galleries and museums.
The research marks a first step in measuring the economic value held for the digital offer of galleries and museums in England. As such, further research is needed to understand the nature of the public’s valuation of remote or digital access to arts and culture, the precise relationship between digital and physical offerings and how these offerings are considered by the public when asked to provide economic valuations. Further research is also needed to probe how well-documented differences in traditional physical cultural engagement in galleries and museums by socio-ethnic background are echoed or not in digital modes of engagement.
7. Technical appendix
7.1 Valuation methods
As standard within Contingent Valuation (CV) surveys, bias correction methods were applied to reduce bias in survey responses, unreliable responses were flagged and dropped, and statistical tests were run to test the validity of the responses.
CV Bias correction measures
This section provides an overview of the approaches taken to correct for various types of bias in the survey responses.
Hypothetical bias occurs when the hypothetical nature of the CV survey leads to respondents overstating what they would pay in reality.[footnote 78] A range of approaches were made within the survey to address hypothetical bias. Counteractive (i.e. ex ante) treatments through so-called entreaties in the survey text are designed to reduce hypothetical bias and make the survey incentive compatible with standard welfare theory.[footnote 79] In the surveys, respondents were provided with cheap talk scripts[footnote 80] asking them to be realistic, reminding them of the household budgetary constraints, and the existence of other things that they may wish to spend their money on.[footnote 81] Respondents were also informed that ‘studies have shown that many people answering surveys such as this one, say they are willing to pay more than they would actually pay in reality’.[footnote 82]
The survey also included a consequentiality script in the form of a Likert scale asking respondents ‘How confident are you that the results of this survey will be used by policymakers?’. There is a range of field studies which suggest that perceived consequentiality matters in stated preferences and that observables can help explain how this perceived consequentiality varies across people.[footnote 83]
Ex post, hypothetical bias was addressed by exploring follow-up responses for inconsistencies and evidence of response acquiescence:
- Those who responded that they ‘did not believe they would really have to pay’ were excluded as this is an indicator that the valuation scenario was not answered in a realistic way.
- Those who completed the survey in an unrealistically fast time were excluded. Removal of so-called ‘speedsters’ is recommended practice in CV analysis.
Unreliable responses
To identify respondents whose responses might be unreliable, a series of follow-up questions were included after the payment-card question of each valuation scenario. These questions were designed to ask respondents why they indicated they would or would not be willing to pay. Respondents who put certain responses were flagged (i.e., received a minor flag if their response was unrelated to the respective question) to potentially exclude them from the analysis, although these were not removed from the final sample, which is in line with previous research of cultural sites in England based on small sample sizes such as those here.[footnote 84] Respondents were dropped if they had at least 1 major flag or at least 3 minor flags. This was because their answers were deemed to be unreliable, hence including them would have reduced the robustness of the data. Some examples of criteria designed to identify potentially unreliable answers include:
- Those respondents who selected ‘I don’t believe that I would really have to pay’ as the reason behind their WTP value, as these respondents likely gave a WTP figure without properly considering the impact this would have on their finances since they did not believe they would really have to pay (n = 12),
- Those responses which were not valid WTP values (i.e., overestimated WTP [>£200]): n = 25.
An ex post analysis (logistic regression) was performed and found no significant selection effects in demographics on WTP within the samples of exclusions. Across the dropped groups (speedsters, major flags) models, there was a lack of significance across demographic variables (gender, age, and household income). This provides confidence that the exclusion of these groups does not bias the WTP results reported in this report.
- The final sample included those who gave an out-of-scope WTP for the valuation scenario but otherwise gave valid responses (n = 140). As expected, average WTP a subscription fee for digital content was higher (£5.28 on average) for those who considered their WTP as ‘not just for visiting the [digital content], but also an expression of my support for all the work that [site] does’ compared to those who considered only their WTP in relation to the valuation scenario (£3.24 on average; see Figure 6.1). The inclusion of these out-of-scope respondents only slightly inflates the WTP value, which provides confidence that the inclusion of this group does not substantially impact the WTP results.
Table 6.1 WTP across those with WTP within the valuation scope and outside the valuation scope
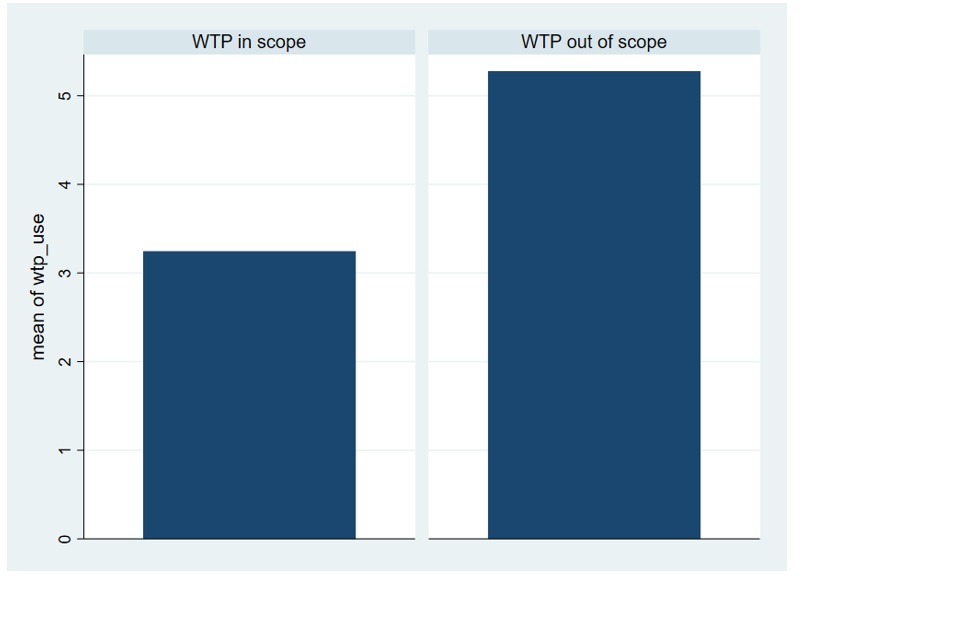
7.2 Web and social media analytics
To ensure that the survey results were more representative of the population of digital visitors (by age and gender), website analytics were collected for visitors to each site. Where web analytics were not broken down by age and gender, as was the case for the Great North Museum, social media (specifically, Facebook and Instagram) analytics were combined and used instead. Web and social media analytics were provided by each of the four institutions. These were used to weight responses by employing iterative proportional fitting, more commonly known as raking. This requires the totals of the variables being raked over (age and gender) to match. Where the totals did not match (as was the case for the Bristol Museum and Art Gallery)[footnote 85] these were proportionally adjusted so to match. All weighted results in this report have had this approach applied.
7.3 Detailed results
Detailed results, that were conducted in addition to the main valuation scenario (i.e., WTP for the monthly subscription fee for their household to access the digital offer), are presented in the following sections.
Income distribution
Figure 6.2 represents users’ average annual household income across the four sites. Noting the difference in household income between the Foundling Museum and the Great North Museum, these figures are largely in line with regional income differences. The Foundling Museum is located in greater London, the English region with the highest income.[footnote 86] Despite the Great North Museum being located in Newcastle and the lowest English region for income, the average users’ income was slightly higher than Derby Museum and Bristol Museum. The overall average of £38,141 is notably higher than the UK average of £31,285.[footnote 87] These differences in income ultimately should be expected to influence visitors’ WTP and the higher income may push WTP upwards. As weights were applied to the sample based on the website and social media analytics, the sample may not be representative of true digital users for these sites.
Table 6.2 Users’ average annual household income by site
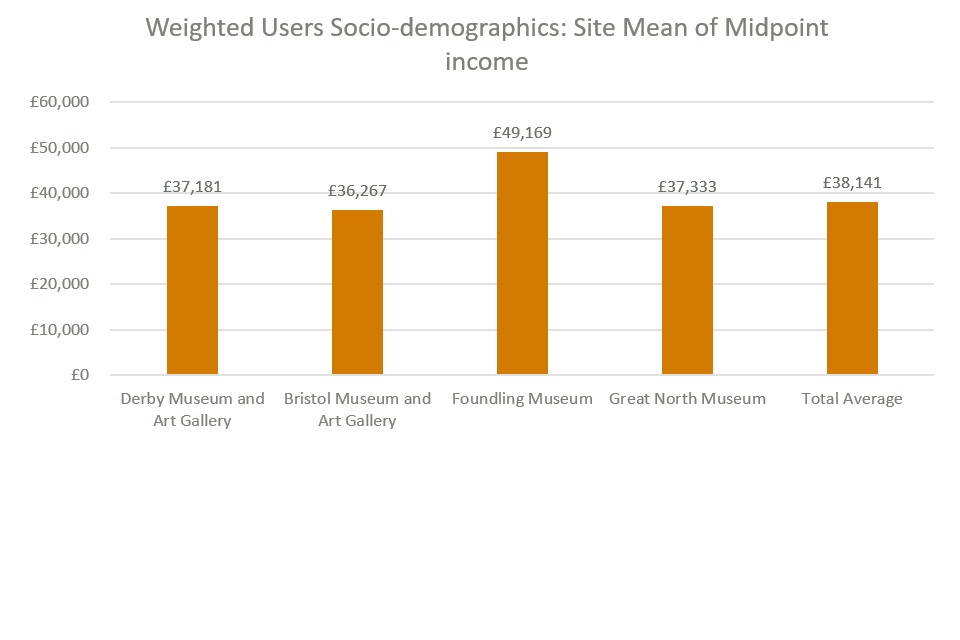
Cultural engagement
Cultural engagement questions were asked to determine users’ online cultural engagement prior to exploring and valuing the digital offering of the institution studied.[footnote 88] Figure 6.3-Figure 6.4 outline users’ in-person cultural engagement (e.g., watched a movie at the cinema) and online cultural engagement (e.g., streamed a movie). A small group of respondents (0.5%) had not engaged with any cultural content in-person over the past month (see Figure 6.3). This group of respondents may have included those shielding or reluctant to engage with arts and culture in-person at the time of the survey. All respondents identified that they had engaged with some online cultural offering previously (see Figure 6.4). Taking both Figures into account, this sample appears to have been more culturally engaged for some in-person cultural offerings (e.g., 87% reported going to the cinema to watch a movie) than online cultural offerings (e.g., 55% reported staying at home and streaming or downloading a movie). Although the study is exploratory, these results seem to suggest that the online cultural offering had not replaced in-person cultural offering.
Table 6.3 In-person cultural engagement (i.e., not on the internet)
In-person cultural engagement: Which of the following have you experienced in the past month in-person?
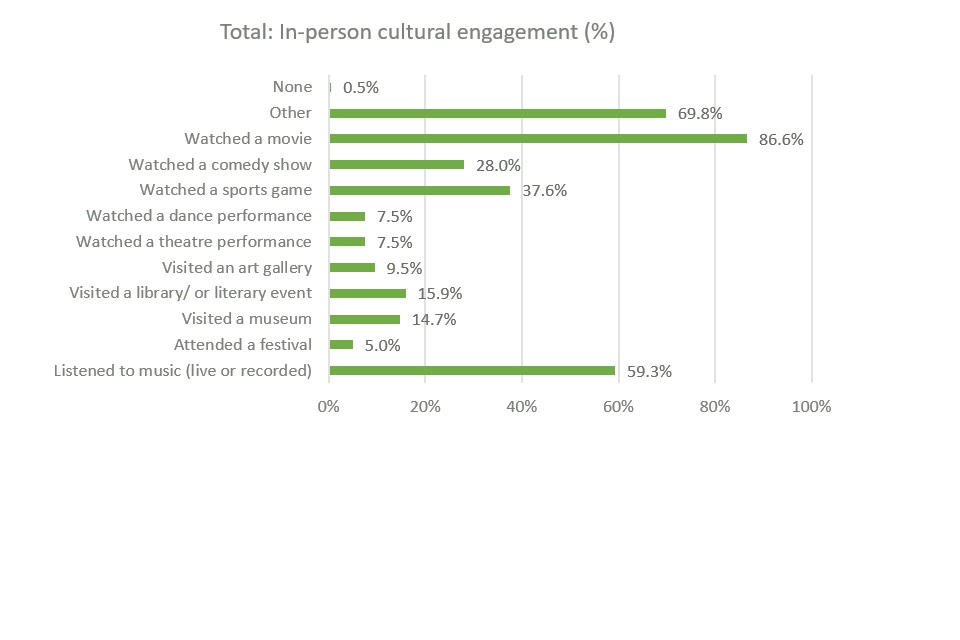
These values are comparable to the pre-COVID-19 cultural participation reported in the 2019/20 ONS Taking Part survey.[footnote 89] For example, 76% that engaged with the arts at least once in the last 12 months. However, fewer reported visits to museums (15%) and art galleries (10%) compared with the DCMS’s Taking Part sample (51% reportedly visited a museum or art gallery). This difference may be due to the timeframe, where this survey looked at cultural engagement over the past month rather than 12 months. The survey respondents reported a higher-than-expected engagement with other arts, such as 87% reported watching a movie within the past month. Noting the socio-demographic factors within the sample, these respondents were reportedly younger, richer, with a greater percentage of females. According to the Taking Part Survey, in 2019/20, men were less likely than women to report having engaged with the arts once or more in the past 12 months; 73% compared with 79%, respectively. Taking these points into consideration, this suggests that the sample collected for this survey was more culturally engaged, for culture experienced in-person. It should be noted that museums and galleries were open at the time of surveying (22nd June to 3rd September 2021) and had been since April 12th. Many cultural institutions required online reservations, which may have put off potential visitors due to health concerns or inability to secure tickets.
Table 6.4 Online cultural engagement
Online Cultural Engagement: Have you downloaded, streamed, or accessed any of the following through the internet since the Coronavirus lockdown in March 2020?
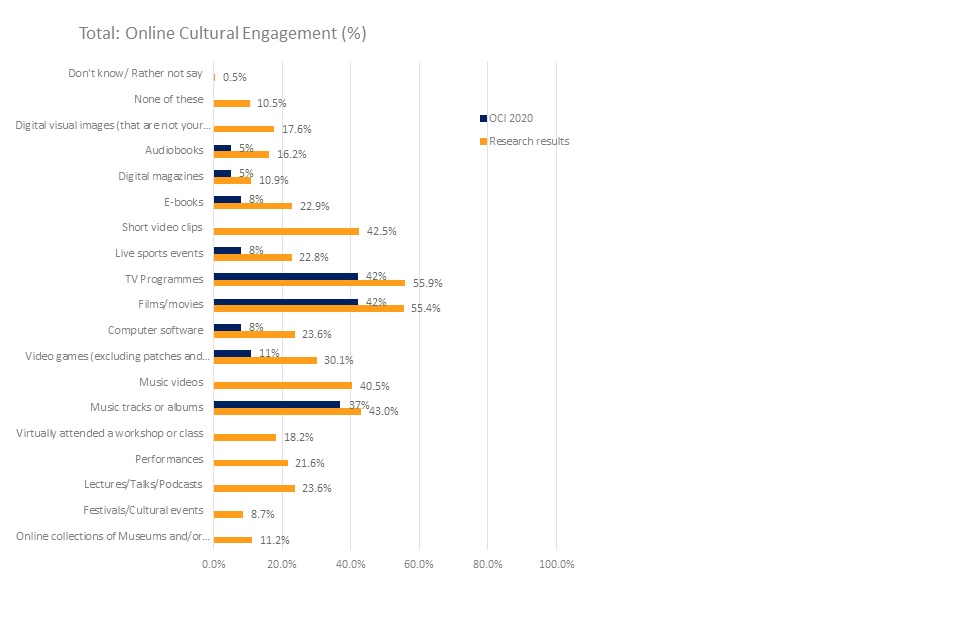
The figure incorporates results from the OCI 2020 online consumer behaviour report.[footnote 90] It should be noted these figures cannot be used as a direct comparison for pre- and post-COVID-19 consumer behaviours. The OCI report reported figures for both internet ‘downloads’ and internet ‘streams’ separately. In contrast, the current research asked respondents to consider both in their response. In addition, the OCI report studies usage in the previous three-month period to the time of sampling (in June 2020) while this report enquires about the time post March 2020. The OCI figures below relate to ‘streams’ as these figures were found to be higher and common on online platforms (e.g., videos are streamed on YouTube, rather than downloaded to the user’s computer before watching). Thereby, ‘streaming’ or accessing online content is similar to how the digital offer being valued in the current research was accessed (as virtual workshops were attended or streamed and not downloaded). Nonetheless, it is likely that this is an under-representation of the total online cultural engagement figures. The current research included more online engagement options, meaning that absent figures in blue for the OCI 2020 results are not ‘0%’ but were not asked in the original OCI research.
These values, noting the necessary differences, can be compared with the pre-COVID-19 figure of 24% viewing or downloading part or all of a film and 21% viewing or downloading part or all of a performance / exhibition, as collected in the 2019/20 DCMS Taking Part survey.[footnote 91] Lockdowns resulting from COVID-19 saw a sudden increase in online streaming according to Ofcom[footnote 92] with viewing figures on streaming services up 71% on 2019. At the time of the survey (22 June to 3 September 2021) museums and galleries were open (and had been since April 12th) although many required online reservations for months after opening and most legal limits on social gathering did not end in England until 19 July.[footnote 93] Conclusions about whether the sample changed their online cultural engagement since the COVID-19 lockdowns cannot be made based on these results alone. However, the results appear to suggest that their online cultural engagement was comparable to pre-COVID-19 behaviours in the 2019/20 Taking Part survey.
WTP values
Table 6.5 below includes zero WTP bids. The graph shows significant clustering towards the lower end of the scale with most of the bids falling below £20. There were few very small clustering or bids falling around the £40, £50, and £70 amounts. While there were small clusters around these larger numbers (i.e., £40), note that this entry fee payment was on behalf of the users’ household.[footnote 94]
Table 6.5 Histograms and kernel density estimates: Willingness-to-pay for an entry fee on behalf of their household
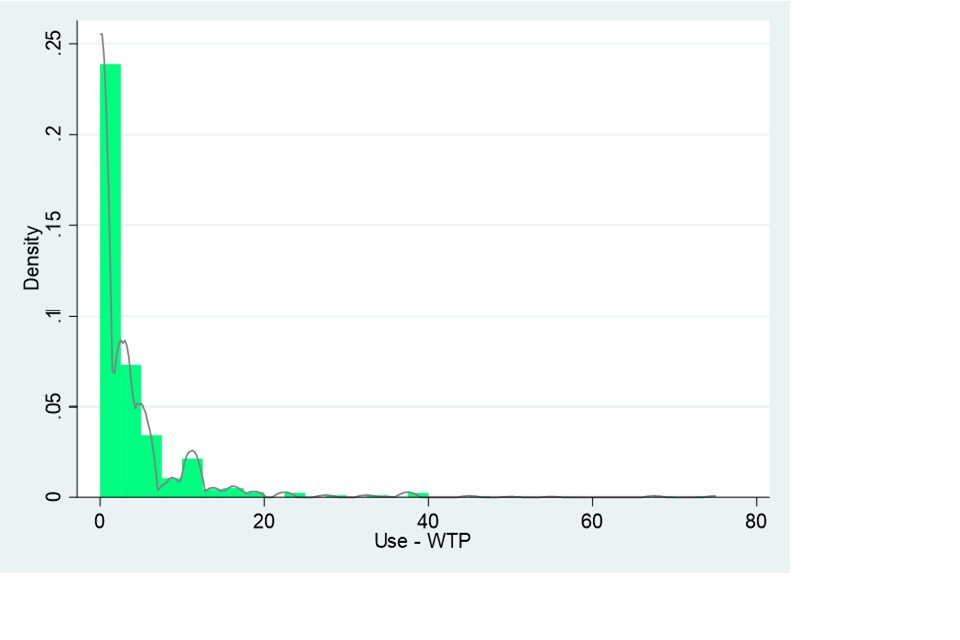
Note: Values include zero WTP bids.
No consistent trend was found between time spent exploring the digital offering and WTP (note that survey respondents had to spend at least five minutes exploring the digital offer before providing their WTP value). In Table 6.6, the graph shows clustering towards the lower end of the scale, between £0 to £20 and between 5 to 50 minutes of digital exploration.
Table 6.6 WTP values by time spent exploring the digital offer
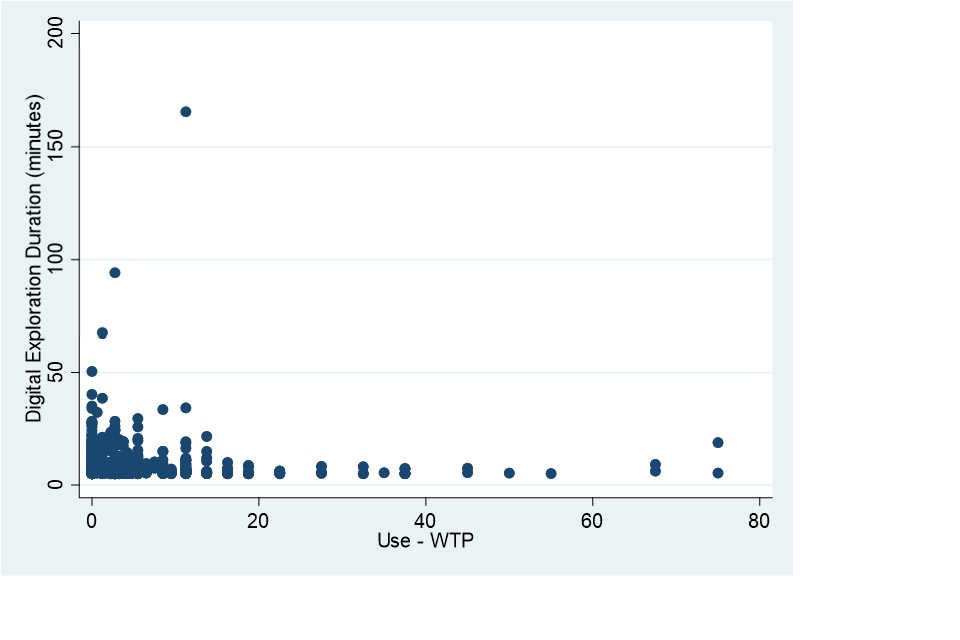
Note: Respondents had to spend at least five minutes exploring the digital offering before they could progress with the survey.
8. Literature cited
Arrow, Kenneth, and Robert Solow. 1993. Report of the NOAA Panel on Contingent Valuation. National Oceanic and Atmospheric Administration Washington, DC. http://www.cbe.csueastbay.edu/~alima/courses/4306/articles/NOAA%20on%20contingent%20valuation%201993.pdf.
Arts Council England. 2010. ‘Digital Audiences: Engagement with Arts and Culture Online’. Last Accessed December 10:2013.
Bakhshi, H., Daniel Fujiwara, R. N. Lawton, Susana Mourato, and Paul Dolan. 2015. ‘Measuring Economic Value in Cultural Institutions’. Cultural Value Project. London, UK: Arts and Humanities Research Council. https://ahrc.ukri.org/documents/project-reports-and-reviews/measuringeconomicvalue/.
Bakhshi, Hasan. 2020. ‘Ten Reflections on the Consumption of Digital Culture in Lockdown’. 7 August 2020. https://pec.ac.uk/blog/ten-reflections-on-the-consumption-of-digital-culture-in-lockdown.
Bakhshi, Hasan, and David Throsby. 2012. ‘New Technologies in Cultural Institutions: Theory, Evidence and Policy Implications’. International Journal of Cultural Policy 18 (2). Taylor & Francis:205–22.
Bateman, I., R. T. Carson, B. Day, M. Hanemann, N. Hanley, T. Hett, M. Jones-Lee, et al. 2002. Economic Valuation with Stated Preference Techniques: A Manual. Cheltenham, UK: Edward Elgar.
Brook, Orian, Dave O’Brien, and Mark Taylor. 2020. ‘Culture Is Bad for You’. In Culture Is Bad for You. Manchester University Press.
Brynjolfsson, Erik, Avinash Collis, W. Erwin Diewert, Felix Eggers, and Kevin J Fox. 2019. ‘GDP-B: Accounting for the Value of New and Free Goods in the Digital Economy’. Working Paper 25695. National Bureau of Economic Research. https://doi.org/10.3386/w25695.
Carlsson, Fredrik, Mitesh Kataria, Alan Krupnick, Elina Lampi, Åsa Löfgren, Ping Qin, and Thomas Sterner. 2013. ‘The Truth, the Whole Truth, and Nothing but the Truth—A Multiple Country Test of an Oath Script’. Journal of Economic Behavior & Organization 89 (May):105–21. https://doi.org/10.1016/j.jebo.2013.02.003.
Champ, Patricia A., and Richard C. Bishop. 2001. ‘Donation Payment Mechanisms and Contingent Valuation: An Empirical Study of Hypothetical Bias’. Environmental and Resource Economics 19 (4):383–402.
Champ, Patricia A., Rebecca Moore, and Richard C. Bishop. 2009. ‘A Comparison of Approaches to Mitigate Hypothetical Bias’. Agricultural and Resource Economics Review 38 (2):160–80.
Coyle, Diane, and David Nguyen. 2020. ‘Valuing Goods Online and Offline: The Impact of Covid-19’. CEPR Covid Economics, no. 33.
Crossick, G, and P Kaszynska. 2016. ‘Understanding the Value of Arts & Culture. The AHRC Cultural Value Project’. London, UK: AHRC.
Cummings, Ronald G., and Laura O. Taylor. 1999. ‘Unbiased Value Estimates for Environmental Goods: A Cheap Talk Design for the Contingent Valuation Method’. The American Economic Review 89 (3):649–65.
DCMS. 2017. ‘Tailored Review of Arts Council England’. DCMS London.
Fujiwara, Daniel, Ulrike Hotopp, K. Keohane, A. Lagarde, Ricky Lawton, C. Maxwell, Susana Mourato, and V. Clayton. 2017. ‘Valuing Heritage Impacts: A303 Amesbury to Berwick Down’. London: Department for Transport and Highways England.
Fujiwara, Daniel, Ricky Lawton, Susana Mourato, Hasan Bakhshi, Ulrike Hotopp, Kieran Keohane, Augustin Lagarde, and Cem Maxwell. 2021. ‘BFI Britain on Film British Film Institute (BFI) A Case Study on the Public Value of Online Public Access to Film Heritage’.
H.M. Treasury. 2019. ‘The Green Book: Central Government Guidance on Appraisal and Evaluation’. Journal of Mega Infrastructure & Sustainable Development 1 (1). Routledge:101–3. https://doi.org/10.1080/24724718.2019.1607713.
Hobbs, J. 2016. ‘Engagement and Willingness to Pay for Short Form Animation Content Online’. The International Journal of Design Management and Professional Practice 10 (2):19–40.
Kidd, Jenny, Eva Nieto McAvoy, and Ania Ostrowska. 2021. ‘Implications of the COVID-19 Digital “pivot” in Museums and Galleries: Lessons from Practitioners’. Nesta, Discussion Paper 2021/11, , November.
Landry, Craig E., and John A. List. 2007. ‘Using Ex Ante Approaches to Obtain Credible Signals for Value in Contingent Markets: Evidence from the Field’. American Journal of Agricultural Economics 89 (2):420–29. https://doi.org/10.1111/j.1467-8276.2007.01017.x.
Lawton, Ricky, Daniel Fujiwara, Madeleine Arber, Dora Radosevic, Augustin Lagarde, Peter O’Donovan, John Davies, and Hasan Bakhshi. n.d. ‘Arts Council England: Regional Galleries and Theatres Benefit Transfer Report’.
Lawton, Ricky N., Susana Mourato, Daniel Fujiwara, and Hasan Bakhshi. 2020. ‘Comparing the Effect of Oath Commitments and Cheap Talk Entreaties in Contingent Valuation Surveys: A Randomised Field Experiment’. Journal of Environmental Economics and Policy 9 (3). Routledge:338–54. https://doi.org/10.1080/21606544.2019.1689174.
Lukas, Noehrer, Abigail Gilmore, Caroline Jay, and Yehudi Yo. 2021. ‘The Impact of COVID-19 on Digital Data Practices in Museums and Art Galleries in the UK and the US’. Humanities & Social Sciences Communications 8 (1). Palgrave Macmillan.
Maddison, David, and Terry Foster. 2003. ‘Valuing Congestion Costs in the British Museum’. Oxford Economic Papers 55 (1). Oxford University Press:173–90.
Mahieu, Pierre-Alexandre, Pere Riera, and Marek Giergiczny. 2012. ‘The Influence of Cheap Talk on Willingness-to-Pay Ranges: Some Empirical Evidence from a Contingent Valuation Study’. Journal of Environmental Planning and Management 55 (6):753–63. https://doi.org/10.1080/09640568.2011.626524.
Mendoza, Neil. 2017. ‘The Mendoza Review: An Independent Review of Museums in England’. London: Department for Digital, Culture, Media and Sport.
Navarrete, Trilce. 2018. ‘On the Economics of Physical and Digital Collections in Museums’. Uncommon Culture.
Navarrete, Trilce. 2020. ‘Digitization in Museums’, 204–13. https://doi.org/10.4337/9781788970747.00038.
Nesta. 2018. ‘Evaluating Immersive User Experience and Audience Impact; A Report Produced by Nesta and I2 Media Research for Digital Catapult’, June. https://www.immerseuk.org/wp-content/uploads/2018/07/Evaluating_Immersive_User_Experience_and_Audience_Impact.pdf.
Noehrer, Lukas, Abigail Gilmore, Caroline Jay, and Yo Yehudi. 2021. ‘The Impact of COVID-19 on Digital Data Practices in Museums and Art Galleries in the UK and the US’. Humanities and Social Sciences Communications 8 (1):236. https://doi.org/10.1057/s41599-021-00921-8.
Oman, S. 2019. ‘Improving Data Practices to Monitor Inequality and Introduce Social Mobility Measures - a Working Paper for the Cultural Sector’, July.
Oxford Economics. 2019. ‘Value Study of GLAMs in Canada: Report for the Ottawa Declaration Working Group’.
Poe, Gregory L., and Christian A. Vossler. 2011. ‘Consequentiality and Contingent Values: An Emerging Paradigm’. The International Handbook on Non-Market Environmental Valuation, 122–41.
Pung, Caroline, Ann Clarke, and Laurie Patten. 2004. ‘Measuring the Economic Impact of the British Library’. New Review of Academic Librarianship 10 (1):79–102. https://doi.org/10.1080/13614530412331296826.
Rußell, Robert, Benedikt Berger, Lucas Stich, Thomas Hess, and Martin Spann. 2020. ‘Monetizing Online Content: Digital Paywall Design and Configuration’. Business & Information Systems Engineering. Springer, 1–8.
Sagger, Harman, Jack Philips, and Mohammed Haque. 2021. ‘Valuing Culture and Heritage Capital: A Framework Towards Informing Decision Making’. Cultural Trends, October. Routledge, 1–3. https://doi.org/10.1080/09548963.2021.1985936.
The Audience Agency. n.d. ‘Digital Audience Survey - Findings’. Digital Audience Survey (blog). Accessed 1 February 2022. https://www.theaudienceagency.org/evidence/digital-audience-survey-findings#Summer_2021.
The audience agency. n.d. ‘The Audience Agency’. Digital Audience Survey - Findings (blog). https://www.theaudienceagency.org/evidence/digital-audience-survey-findings#Summer_2021.
Throsby, David, and Hasan Bakhshi. 2010. ‘Culture of Innovation: An Economic Analysis of Innovation in Arts and Cultural Organisations’. London: NESTA.
Throsby, David, Anita Zednik, and Jorge E. Araña. 2021. ‘Public Preferences for Heritage Conservation Strategies: A Choice Modelling Approach’. Journal of Cultural Economics 45 (3):333–58. https://doi.org/10.1007/s10824-021-09406-7.
Valliant, Richard, Jill A Dever, and Frauke Kreuter. 2013. Practical Tools for Designing and Weighting Survey Samples. Vol. 1. Springer.
Vossler, Christian A., and J. Scott Holladay. 2018. ‘Alternative Value Elicitation Formats in Contingent Valuation: Mechanism Design and Convergent Validity’. Journal of Public Economics 165 (September):133–45. https://doi.org/10.1016/j.jpubeco.2018.07.004.
-
See, for example; Bakhshi, H., (2020), ‘Ten Reflections on the Consumption of Digital Culture During Lockdown’. Creative Industries Policy and Evidence Centre. Accessed 11/11/2021; The Audience Agency (2021), ‘Latest findings from The Audience Agency’s Digital Audience Survey show how audiences have responded to arts, culture and heritage organisations moving so much of their offering online during the COVID-19 lock-down period.’, ↩
-
See the Arts Council England Culture and Heritage Capital Portal for research papers and guidance on how to apply these economic values within business cases ↩
-
See, for example Van Westendorps’ price sensitivity meter: Lessiter, et al. (2018). ↩
-
See, for example: Oxford Economics, (2019), ‘Value Study of GLAMs in Canada: Report for the Ottawa Declaration Working Group’. ↩
-
Sagger, H., Philips, J., Haque, M., (2021), ‘Valuing culture and heritage capital: a framework towards informing decision making’, DCMS ↩
-
Crossick and Kaszynska 2016 ↩
-
See the Arts Council England Culture and Heritage Capital Portal for research papers and guidance on how to apply these economic values within business cases: ↩
-
Arts Council England: Regional Galleries and Theatres Benefit Transfer Report. ↩
-
Arts Council England: Regional Galleries and Theatres Benefit Transfer Report and Arts Council England Local Museums Benefit Transfer Report (2022) ↩
-
Crossick and Kaszynska 2016 ↩
-
Arts Council England Local Museums Benefit Transfer Report (2022) ↩
-
Bakhshi, Freeman and Hitchen, 2010, Measuring Intrinsic Value: How to stop worrying and love economics, Mission, Models, Money ↩
-
Mendoza, N. (2017), ‘The Mendoza Review: an independent review of museums in England’, DCMS. ↩
-
DCMS (2017), ‘Tailored Review of Arts Council England’. ↩
-
Fujiwara et al. 2018; Lawton et al. 2021 ↩
-
R. N. Lawton et al. 2021 ↩
-
Lawton et al. (2022). Arts Council England: Benefit Transfer Report. ↩
-
Navarrete (2018), ‘On the Economics of Physical and Digital Collections in Museums’, in Uncommon Culture Vol. 7, no.1/2 (2018) 57-73 ↩
-
Bakhshi and Throsby (2012). ↩
-
Lukas et al. 2021; Kidd et al. 2021 ↩
-
The HM Treasury Green Book (2022) places market and revealed preference methods above stated preference in terms of robustness. However, note that in many cases stated preference is the only method available to capture many of the non-market benefits that cultural institutions provide, and the only method which can capture hypothetical future changes in service provision and capture both use and non-use value. ↩
-
Values of travel time savings and reliability: final reports ↩
-
https://simetrica-jacobs.com/wp-content/uploads/2020/11/Highways-England-Stonehenge.pdf ↩
-
Arrow et al. 1993; Bakhshi et al. 2015; Bateman et al. 2002 ↩
-
Lawton, R. N., Mourato, S., Fujiwara, D., & Bakhshi, H. (2020). Comparing the effect of oath commitments and cheap talk entreaties in contingent valuation surveys: a randomised field experiment. Journal of Environmental Economics and Policy, 9(3), 338-354. ↩
-
Navarrete, T. (2020). Digitization in museums. In Teaching Cultural Economics. Edward Elgar Publishing. ↩
-
Bakhshi and Throsby, (2010). ‘Culture of Innovation: An economic analysis of innovation in arts and cultural organisations’, NESTA, Accessed 11/11/2021 ↩
-
Lessiter, et al. (2018). Accessed 02/02/22 ↩
-
Lukas et al. 2021 ↩
-
Kidd et al. 2021 ↩
-
Kidd et al. 2021 ↩
-
Oxford Economics (2019, December). ‘Value Study of GLAMs in Canada: Report for the Ottawa Declaration Working Group’. Accessed 02/02/22 ↩
-
Brynjolfsson et al. 2019 ↩
-
Coyle and Nguyen, (2020), ‘Valuing goods online and offline: the impact of Covid-19’ Accessed 15/07/2022 ↩
-
The survey asked respondents how much they agreed or disagreed with the following statement ‘I am willing to pay for online arts and culture if I get something extra e.g.,.: exclusive content or access offline’. 32% agreed and 25% disagreed with the statement. ↩
-
Ricky N. Lawton et al. 2021 ↩
-
Maddison & Foster (2003) ↩
-
Arts Council England (2021). Regional Art Galleries and Theatres Report. ↩
-
Note that the sample for the North-East region (valuing the Great North Museum, Gateshead), recruited fewer respondents. This may have been due to the digital offering for this site, which may have not been accessible on older internet browsers. ↩
-
Digital accessibility should be considered as not just that reliable internet connection and a device is required; some digital offers require certain plug-ins that must be up-to-date in order to load the digital offer; meaning that some internet browsers do not have the capability required for users to access the digital offer. ↩
-
Throsby, Zednik, and Araña (2021) provide an example of how this can be achieved in a Discrete Choice design. ↩
-
Respondents were only allowed to continue the survey after five minutes of digital exploration of the site’s digital offer. An average of 8 minutes (8.01 minutes) was spent exploring the site (minimum of 5.01 minutes and maximum time spent was 165.33 minutes). ↩
-
A pilot survey was conducted on 22nd and 23rd June 2021 using a quota-based sample of 49 online panel respondents that resided in England. The results of the pilot survey confirmed that the survey was functioning correctly. Responses to the debrief questions provide sufficient confidence to proceed into the field with the main survey. ↩
-
For the purposes of this research, spam is defined as any response not thought to be human. That is, ‘automated’ responses. ↩
-
This includes respondents for whom some survey responses were contradictory to their earlier responses and, respondents whose responses that were unrelated to the respective question, WTP values that were given without considering their finances, and invalid WTP responses that were out of scope. ↩
-
Specifically, respondents were dropped if they had more than 1 major flag (e.g., classified as a speedster) or more than 3 minor flags (e.g., an unrealistic WTP value, gave unreliable responses, and gave responses that were unrelated to the specific question). ↩
-
In comparison, a typical CV survey takes around 15-20 minutes to complete. ↩
-
Website analytics for one of the four sites (Great North Museum) was not disaggregated by age or gender. Weights were therefore unable to be created from the site’s website data. Because of this, it was weighted using combined data from their Instagram followers and Facebook likes, both of which were disaggregated by age and gender. It should be noted that this method may have resulted in some groups being overpopulated (e.g., young females who make up large proportions of museum social media analytics). ↩
-
The rollout of the COVID-19 vaccination programme in England. National Audit Office (2022) ↩
-
Lawton et al. 2021. This research was collecting using the same panel provider and CV method during 2019. Survey respondents were recruited from four areas in England (North West, North East, and the Yorkshire and Humber regions) and were nationally representative in terms of age and gender. ↩
-
The DCMS Taking Part survey is a UK-wide survey that samples a panel that is representative of the UK population. This wave was collected in 2019 -early 2020. which covers a range of topics (e.g., work, retirement, home and family life). Headline measures of engagement taken from the DCMS Taking Part Survey for the year April 2019 to March 2020 ↩
-
Participation Survey October to December 2021: Key Findings ↩
-
This is similar to the percentage reported in previous literature; 26% of the regional Theatres sample and 21% of the regional art galleries sample listed Arts and Culture as one of their top five areas for public funding. This research was collected in the same manner as this report, except the nationally representative samples (i.e., age, gender) were collected from the regions the sites were located in. Notably, the North West, North East, Yorkshire and Humber regions for the art galleries, and the West Midlands, North East, North West, and South West regions for the Theatres sample. ↩
-
A national survey, run by the Audience Agency deployed by arts and cultural institutions via their website, social media, or online communications. ↩
-
Noonan 2003 ↩
-
Bateman et al. 2002 ↩
-
Bateman et al. provide guidelines on common variables to be included in modern applications of CV. ↩
-
This group of payment values was tested in the Pilot survey. ↩
-
For example, paying a monthly subscription fee to access the Britain on Film content. Britain on Film impact study ↩
-
British Film Institute (2021). Britain on Film impact study. ↩
-
Arts Council England: Regional Galleries and Theatres Benefit Transfer Report. ↩
-
Bateman, I., R. T. Carson, B. Day, M. Hanemann, N. Hanley, T. Hett, M. Jones-Lee, et al. 2002. Economic Valuation with Stated Preference Techniques: A Manual. Cheltenham, UK: Edward Elgar. ↩
-
Income was positively and significantly associated for WTP an entry-fee to visit regional art galleries and WTP a donation for an expansion of the art gallery. Arts Council England: Regional Galleries and Theatres Benefit Transfer Report. ↩
-
For example, users with parents who held Middle management or Modern role growing up were willing to pay £5.30 or £5.15 for an entry into one of their Local Museums. See the Arts Council England: Arts Council England: Local Museums Benefit Transfer Report (2022) ↩
-
Brook, O’Brien and Taylor, Culture is Bad for You, 2020, Manchester University Press ↩
-
For example, the Local Museums Report (2022) noted the positive and significant association between public funding for arts and culture as one of the top five priorities and WTP for entry or to support local museums for both users and non-users. ↩
-
All respondents spent less than 100 minutes exploring the digital content before progressing with the survey, except for the one respondent who spent 165 minutes exploring the digital content. ↩
-
Oman, S. (2019), ‘Improving Data Practices to Monitor Inequality and Introduce Social Mobility Measures - a Working Paper for the Cultural Sector’. ↩
-
Cummings and Taylor 1999; Landry and List 2007; Mahieu et al. 2012 ↩
-
Carlsson et al. 2013; Cummings and Taylor 1999 ↩
-
Cheap talk script is a survey technique designed to reduce hypothetical bias in WTP estimates by reminding respondents of their budget constraints and availability of alternative goods, in order to make WTP values incentive compatible with standard welfare theory. ↩
-
Cummings and Taylor 1999 ↩
-
Champ and Bishop 2001, 2001; Cummings and Taylor 1999 ↩
-
Vossler and colleagues find some that controlling for consequentiality increases construct validity, with income, distance from the site and being a member of an environmental group only being significant drivers of WTP for consequential respondents, so that the regressions can be improved. Needham and Hanley hypothesise that people with a higher degree of familiarity with the good will perceive the survey to be more consequential as they may already be aware of the good/service being valued and as such believe that the results will be shared with policymakers as part of the planning process. ↩
-
Bakhshi et al. 2015; Fujiwara et al. 2018; R. Lawton et al. 2018 ↩
-
The Bristol Museum and Art Gallery totals for gender were higher than for age. As such the difference between the gender and age totals was subtracted from gender, half from the male category and half from the female category. (Given the difference was an odd number, one more was subtracted from the female category in order to make the gender and age totals match). ↩
-
These three questions on cultural engagement were pulled from the Online Copyright Infringement (OCI) Report ↩
-
Value taken from the DCMS’s Taking Part Survey for the year April 2019 to March 2020. It must be noted that the DCMS’s Taking Part survey is looking at a 12-month period whereas the Digital Offer survey enquired about the last month. Further, the Taking Part survey is asking about engagement with the arts rather than cultural engagement which could be interpreted differently. ↩
-
Values taken from the DCMS’s Taking Part Survey for the year April 2019 to March 2020. It must be noted that the DCMS’s Taking Part survey is looking at a 12 month period whereas the Digital Offer survey enquired about the period since March 2020. Further, the Taking Part survey is asking about specific reasons for visiting the website which are not an exact match with the Digital Offer survey. ↩
-
Timeline of UK government coronavirus lockdowns and measures, March 2020 to December 2021 ↩
-
The average household size of respondents was 2.6 persons, but 2.29% of the total sample reported a household of 5 or more people. ↩