Heat mortality monitoring report: 2021
Updated 3 April 2025

© Crown copyright 2025
This publication is licensed under the terms of the Open Government Licence v3.0 except where otherwise stated. To view this licence, visit nationalarchives.gov.uk/doc/open-government-licence/version/3 or write to the Information Policy Team, The National Archives, Kew, London TW9 4DU, or email: psi@nationalarchives.gov.uk.
Where we have identified any third party copyright information you will need to obtain permission from the copyright holders concerned.
This publication is available at https://www.gov.uk/government/publications/heat-mortality-monitoring-reports/heat-mortality-monitoring-report-2021
The summer of 2021 as a whole was fairly unremarkable in terms of temperature in England. The temperatures in August, especially, were around or below the long-term average for England.
A full overview of summer 2021 is available from the Met Office.
During the 2021 Heat-Health alerting period (which runs from 1 June to 15 September) there were 2 periods that met the UK Health Security Agency (UKHSA) definition for analysis purposes – outlined below:
- day(s) on which a Level 3 Heat Health Alert (HHA) is issued (read more on the alerting criteria here) and/or
- day(s) when the mean Central England Temperature (CET) is greater than 20°C
In addition, the preceding and subsequent days to those identified using the definitions above were included as part of the heat period in the analyses.
Episode 1 (E1)
Lasted 8 days (16 July to 23 July), during which time the West Midlands, East Midlands, Yorkshire and Humber, East of England, South East and South West of England regions were at HHA Level 3.
Episode 2 (E2)
Lasted 4 days (6 September to 9 September) and affected all regions of England – but no alert was issued for this second period, as alerting criteria were not met. However, conditions were hot or warm with the increasing temperatures widespread with CET reaching 20°C. Hence, this period has been included in this seasonal analysis.
Excess all-cause mortality: summer 2021
The usual methodology used to estimate heatwave mortality in England was not appropriate in 2021 due to the effect of the COVID-19 pandemic and as such, a similar approach was used to estimate excess all-cause mortality, which was used in 2020.
Excess all-cause mortality was calculated by comparing the average number of all-cause deaths (corrected for delays in registration) on the episode days with the average from the combination of the 14 non-episode days preceding and subsequent to the study period, having subtracted the estimated number of deaths attributed to coronavirus (COVID-19) on those days.
The number of COVID-19 deaths was taken from deaths reported either by the Office for National Statistics (ONS) as COVID-19 on the death certificate or a death for any reason within 60 days of a COVID-19 positive PCR test. The all-cause deaths data was obtained from the General Regiser Office, with the location of death according to the region of the office where registration occurred and by the day of death.
Across the 2 episodes, the total cumulative all-cause excess mortality was estimated to be 1,634 (95% CI 1,125 to 2,143), with 1,470 (95% CI 1,004 to 1,936) excess deaths observed in the 65+ years group (see Table 1). Statistically significant excesses were observed in the following regions of England: London, South East, South West, East Midlands and West Midlands (see Table 2).
Heat and COVID-19
All-cause excess mortality during heat episodes in summer 2021 was the fourth-highest observed since the introduction of the Heatwave Plan for England. Whilst the 2 heat episodes which occurred in 2021 were relatively mild in comparison to previous heatwave seasons, the impact of the heat observed was still higher than the observed excess mortality pre-pandemic.
However, caution should be used when interpreting heatwave all-cause excess mortality estimates during the second episode for a number of reasons. Firstly, both COVID-19 and non-COVID-19 mortality rates were beginning to increase before the exposure to heat occurred. Secondly, daily mortality rates remained elevated following a return to less warm temperatures. In addition, the excess mortality during August 2021 was around 2 standard deviations above the baseline, even considering that the temperatures during this were around or below the long-term average for England. And finally, the additional drivers apart from heat of the increase in mortality observed over this period in general needs to be explored in more detail to fully separate the potential causes, namely:
- a possible link between COVID-19 and exposure to heat, even at relatively mild elevated levels of heat exposure
- seeing impacts on health and wellbeing (as registered by excess deaths) at much lower levels of exposure to heat events than previously considered harmful either by absolute temperatures or from length of exposure
- other possible mortality causes not yet studied in this analysis, such as non-COVID-19 infectious diseases
2021 was the second year in which the concurrent risks of heat and COVID-19 may have overlapped to amplify the observed impacts. Furthermore, the second period included in this analysis did not reach Heat-Health Alerting criteria, yet heat-related mortality was observed. Due to the limitations of the current approach, we are currently developing a new methodology to estimate both the acute impacts as a result of heatwaves and the impacts observed during less extreme hot weather periods in England, such as September 2021, to provide a more holistic estimate of the effects of high ambient temperatures on excess mortality.
Figure 1. All-cause excess mortality in the 65+ years group during Heat-Health alerting period 2021 (16 to 23 July; 6 to 9 September) in England.
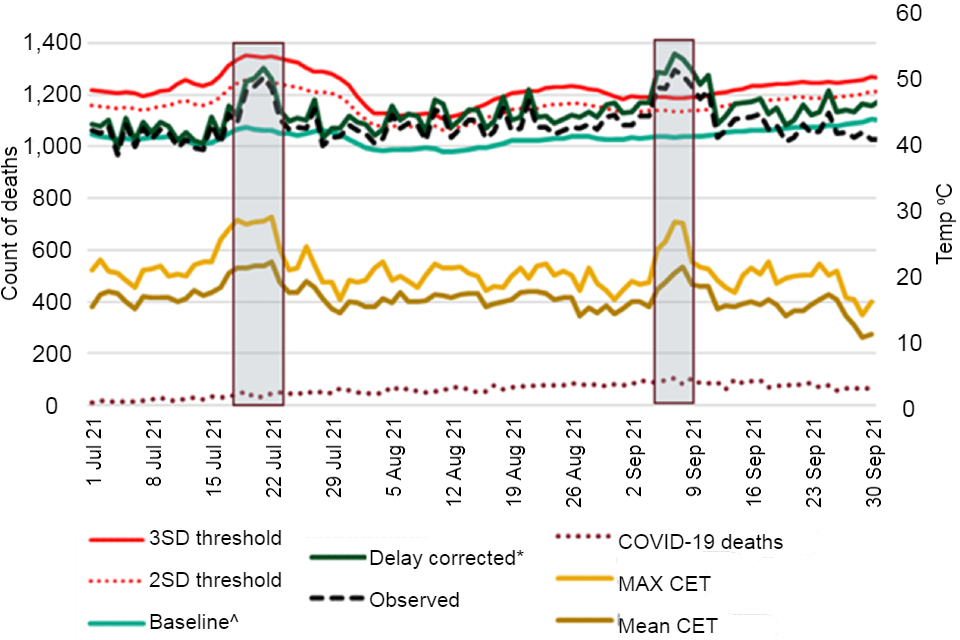
Shaded areas on the figure highlight periods which meet UKHSA heatwave criteria for estimating heatwave excess mortality and were analysed by age and region. From top to bottom these are:
- 3 and 2 standard deviation (SD) thresholds (solid and dashed red lines)
- daily corrected mortality count (dark green solid line)
*corrected for delay to registration from death - observed mortality counts (black dashed line)
- baseline mortality count (light green solid line)
^based on same day in previous 5 years +/-1 week with a linear trend projected - maximum Central England Temperature (CET) (solid light gold line)
- average CET (solid dark gold line)
- COVID-deaths (purple dashed line)
Summer 2021 total all-cause excess mortality by age
Table 1. Estimated all-cause excess mortality by age group for 2 individual heatwave periods and total cumulative excess mortality across all heatwave periods with statistically significant values in bold and 95% confidence intervals in brackets
| Heatwave period | 16 to 23 July | 6 to 9 September | Total |
|---|---|---|---|
| All | 915 (628 to 1,201) | 719 (512 to 927) | 1,634 (1,140 to 2,128) |
| 0 to 24 | 15 (-13 to 42) | 10 (-10 to 30) | 25 (-23 to 72) |
| 25 to 44 | 26 (-21 to 73) | 20 (-13 to 53) | 46 (-34 to 126) |
| 45 to 64 | 26 (-74 to 127) | 69 (-4 to 142) | 95 (-78 to 269) |
| 65 to 74 | 102 (-14 to 217) | 69 (-16 to 153) | 171 (-30 to 370) |
| 75 to 84 | 339 (185 to 493) | 186 (75 to 298) | 525 (260 to 791) |
| 85+ | 408 (231 to 586) | 365 (236 to 495) | 773 (467 to 1,081) |
| 0 to 64 | 66 (-48 to 181) | 99 (16 to 182) | 165 (-32 to 363) |
| 65+ | 850 (587 to 1,112) | 620 (430 to 811) | 1,470 (1,017 to 1,923) |
Summer 2021 total all-cause excess mortality by region
Table 2. Estimated all-cause excess mortality by region for 2 individual heatwave periods and total cumulative excess mortality across all heatwave periods with statistically significant values in bold and 95% confidence intervals in brackets
| Heatwave period |
16 to 23 July | 6 to 9 September | Total |
|---|---|---|---|
| East of England | 27 (-53 to 107) | 49 (-9 to 108) | 76 (-62 to 215) |
| East Midlands | 110 (30 to 191) | 123 (63 to 183) | 233 (93 to 374) |
| London | 82 (-7 to 172) | 76 (10 to 143) | 158 (3 to 315) |
| North East | 26 (-41 to 93) | -6 (-52 to 40) | 20 (-93 to 133) |
| North West | 80 (-25 to 186) | 75 (-3 to 154) | 155 (-28 to 340) |
| South East | 118 (-5 to 242) | 114 (24 to 203) | 232 (19 to 445) |
| South West | 168 (67 to 270) | 124 (50 to 198) | 292 (117 to 468) |
| West Midlands | 219 (117 to 321) | 93 (22 to 164) | 312 (139 to 485) |
| Yorkshire and Humber | 76 (-16 to 168) | 46 (-20 to 112) | 122 (-36 to 280) |
| England | 915 (628 to 1,201) | 719 (512 to 927) | 1,634 (1,140 to 2,128) |