Wider Determinants of Health: statistical commentary, May 2022 update
Published 4 May 2022
Applies to England

© Crown copyright 2022
This publication is licensed under the terms of the Open Government Licence v3.0 except where otherwise stated. To view this licence, visit nationalarchives.gov.uk/doc/open-government-licence/version/3 or write to the Information Policy Team, The National Archives, Kew, London TW9 4DU, or email: psi@nationalarchives.gov.uk.
Where we have identified any third party copyright information you will need to obtain permission from the copyright holders concerned.
This publication is available at https://www.gov.uk/government/statistics/wider-determinants-of-health-may-2022-update/wider-determinants-of-health-statistical-commentary-may-2022-update
1. New in this update
There are 3 new indicators:
- air pollution: fine particulate matter (new method – concentrations of total PM2.5)
- food insecurity – percentage of households experiencing food insecurity (regional data)
- Average Attainment 8 Score among children eligible for free school meals
We have added new data to the following indicators:
- proportion of individuals not reaching the Minimum Income Standard
- percentage of people who successfully obtained a dental appointment
- percentage of people who said they had a good experience when making a GP appointment
- job density – ratio of jobs in an area relative to resident population
- proportion of people age 19 to 24 not in education, employment or training (NEET)
- rate of long-term claimants of jobseeker’s allowance (JSA)
- affordability of home ownership – house price to earnings ratio
- rate of children aged 10 to 17 entering the youth justice system
Several indicators in other Fingertips profiles have been updated with new data also included in this Wider Determinants release. These are covered in the relevant statistical commentary – for example, for the Public Health Outcomes Framework (PHOF) or Child and Maternal Health Profile.
2. Summary of new and updated indicators
The Wider Determinants of Health profile presents indicators primarily at the local authority level in addition to regional and England values. This summary presents key results from the update and provides some contextual information to help interpret the latest data. The coronavirus (COVID-19) pandemic has had wide-ranging effects, and this is reflected in some of the commentary below.
2.1 Air pollution: fine particulate matter (new method – concentrations of total PM2.5)
This is a new indicator which replaces a previous indicator on air pollution. The method used to estimate the values is based on recommendations made by the Committee on the Medical Effects of Air Pollutants (COMEAP). Concentrations of total PM2.5, referred to as fine particulate matter, are now used as the basis for this indicator. Modelled concentrations of the anthropogenic component of PM2.5 (that is human-made only) are no longer used because of the uncertainty associated with the assignment to anthropogenic and non-anthropogenic sources, and because non-anthropogenic sources make only a small contribution to total concentrations.
A time series with this new definition is available back to 2018. Please note that caution is needed when interpreting trends in PM2.5 concentrations, for more details see the Definition for this indicator in the profile.
The related PHOF indicator: fraction of mortality attributable to air pollution, has also been updated to use total PM2.5 rather than just the anthropogenic component.
2.2 Food insecurity – percentage of households experiencing food insecurity
This is a new indicator providing data on food insecurity in England. Food security can be defined as having access at all times to enough food that is both sufficiently varied and culturally appropriate to sustain an active and healthy life (Food Standards Agency). The indicator is available at regional level, based on annual data from the Family Resources Survey which asks sampled households directly about their experience of food insecurity in the past 30 days. For the financial year 2020 to 2021, the percentage of households experiencing food insecurity in England was 7.0%. There are significant regional differences: the North East had the highest percentage of households experiencing food insecurity and the South East and South West the lowest. There has been no significant change in England or the regions between financial year 2019 to 2020 and financial year 2020 to 2021.
Note there was a shift in mode of interview from face-to-face to telephone due to the pandemic, resulting in a reduction of interviews achieved in financial year 2020 to 2021. The statistics underwent extensive quality assurance however some caution is still recommended when interpreting some of the changes since financial year 2019 to 2020.
For further information see the Family Resources Survey: financial year 2020 to 2021 and Food Standards Agency: The Food and You Survey (PDF, 289KB).
2.3 Average Attainment 8 Score among children eligible for free school meals
This is a new indicator that replaces the indicator: GCSEs achieved 5A* to C including English and Maths with free school meal status. In the financial year 2020 to 2021, the England Average Attainment 8 Score among children eligible for Free School Meals (FSM) was 39.1. This is lower than the Average Attainment 8 Score of 50.9 for all children in England, but higher than the score of 21.4 for children in care. The way grades were awarded during this period changed due to the COVID-19 pandemic so data cannot be compared with previous years.
2.4 Proportion of individuals not reaching the Minimum Income Standard
The Minimum Income Standard (MIS) is defined by the Joseph Rowntree Foundation as not having enough income to afford a ‘minimum socially acceptable standard of living’, based on what members of the public think is enough money to live on. Data in this update relates to the 3-year period starting from year 2017 to 2018 to year 2019 to 2020, before the COVID-19 pandemic. The proportion of individuals in households in England not reaching the MIS has continued to decrease (an improving trend) and the England value for the 3-year period starting from year 2017 to 2018 to year 2019 to 2020 is 29.0%. London has the highest proportion of individuals not meeting the MIS at 34.4%, followed by the North East at 33.8%.
For more information see the Joseph Rowntree Foundation’s work on Minimum Income Standards.
2.5 Percentage of people who successfully obtained a dental appointment
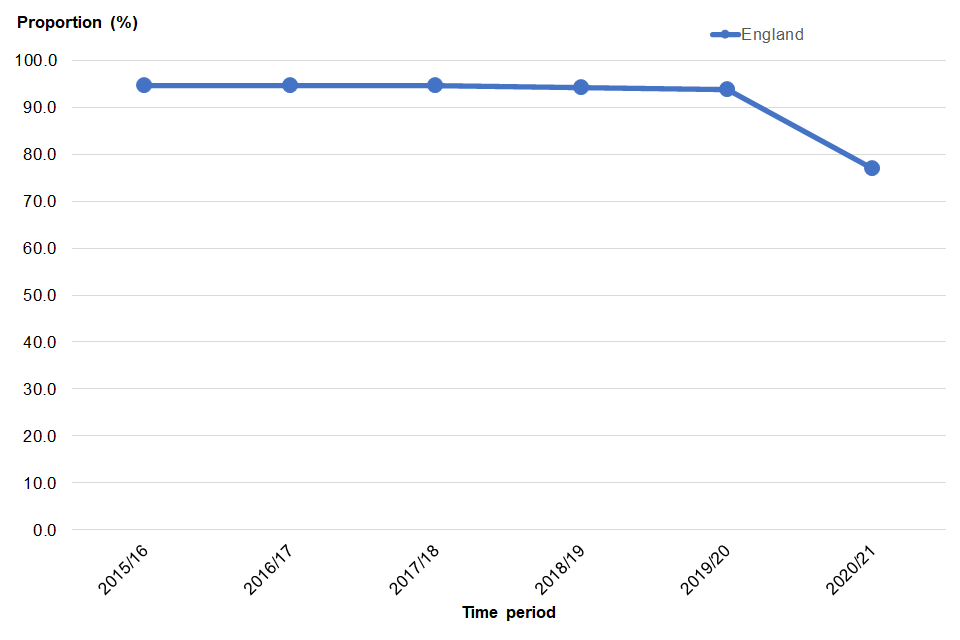
This indicator measures the percentage of people who successfully obtained an NHS dental appointment out of those who tried in the last 2 years, based on data from the GP Patient Survey (GPPS). In financial year 2020 to 2021, during the COVID-19 pandemic period, the England value was 77%, a significant decrease since financial year 2019 to 2020 (from 93.7% to 77.0%, a decrease of 16.7 percentage points). Prior to financial year 2020 to 2021, the percentage of those successfully obtaining an NHS dental appointment remained stable, with almost 95% of people being successful in each year.
Figure 1: percentage of people who successfully obtained a dental appointment, financial year 2015 to 2016 to financial year 2020 to 2021, England
For more information, see the NHS Outcomes Framework England, March 2022 Annual Publication (PDF, 407KB). Note that GPPS data is weighted for survey design and non-response.
2.6 Percentage of people who said they had a good experience when making a GP appointment
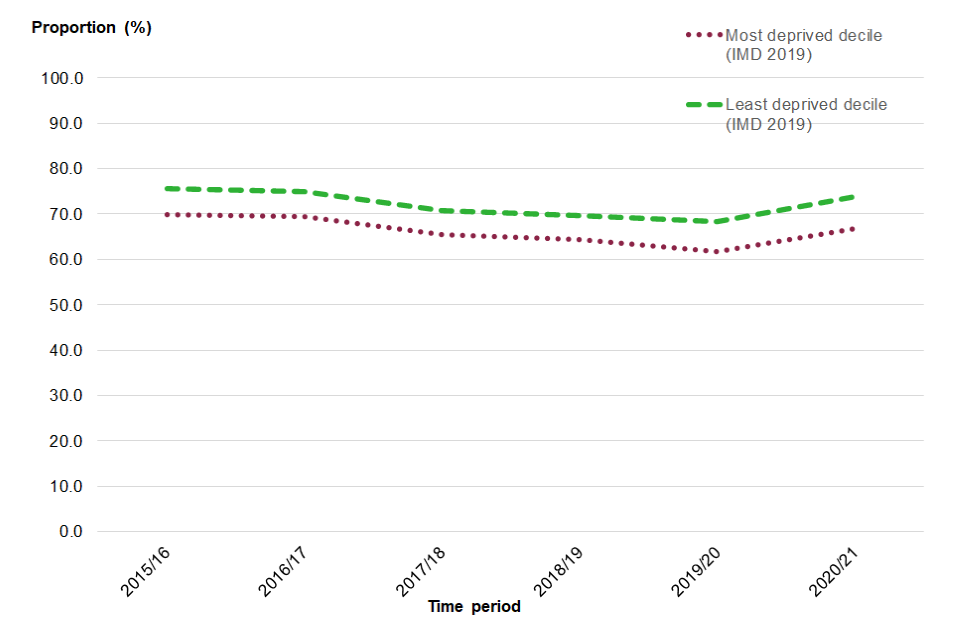
This indicator aims to capture the experience of patients of accessing GP services, based on data from the GP Patient Survey (GPPS). It is measured as the percentage of people who report their experience of making a GP appointment as ‘fairly good’ or ‘very good’. In financial year 2020 to 2021, the England value was 70.7%, an increase from 65.5% in financial year 2019 to 2020. Deprivation decile group 10 (least deprived) reported the best experience of making a GP appointment, with 73.9% of people reporting a fairly good or very good experience. Deprivation decile group 1 (most deprived) had the lowest proportion of people reporting a fairly good or very good experience of making a GP appointment at 66.8%.
Figure 2: percentage of people who said they had a good experience when making a GP appointment, financial year 2015 to 2016 to financial year 2020 to 2021, most and least deprived deciles, England
For more information, see the NHS Outcomes Framework England, March 2022 Annual Publication (PDF, 407KB). Note that GPPS data is weighted for survey design and non-response.
2.7 Job density – ratio of jobs in an area relative to resident population
Job density is a ratio of the number of jobs in an area divided by the resident population aged 16 to 64 in that area. A job density of 1.0 means one job for every resident aged 16 to 64. In 2020, the ratio for England was 0.85 which means slightly less than one job for every working age resident. The job density ratio for England in 2020 has fallen slightly since the previous year.
2.8 Proportion of people aged 19 to 24 not in education, employment or training (NEET)
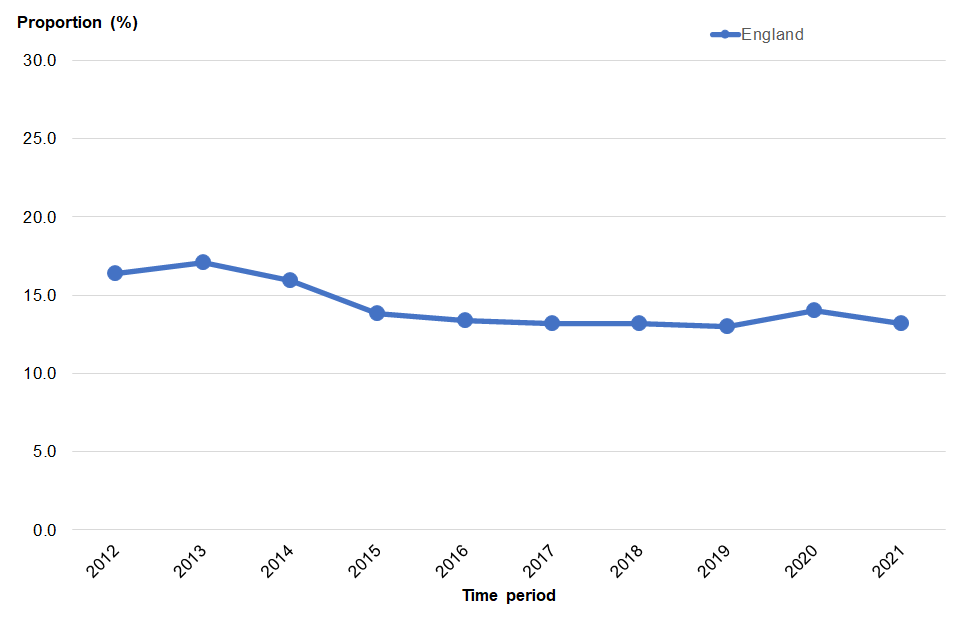
In 2021, the proportion of 19 to 24 year olds in England not in education, employment or training (NEET) decreased from 14.0% to 13.2%. There has generally been a decreasing trend in this indicator since 2012.
Figure 3: proportion of people 19 to 24 NEET, 2012 to 2021, England
2.9 Rate of long-term claimants of Jobseeker’s Allowance
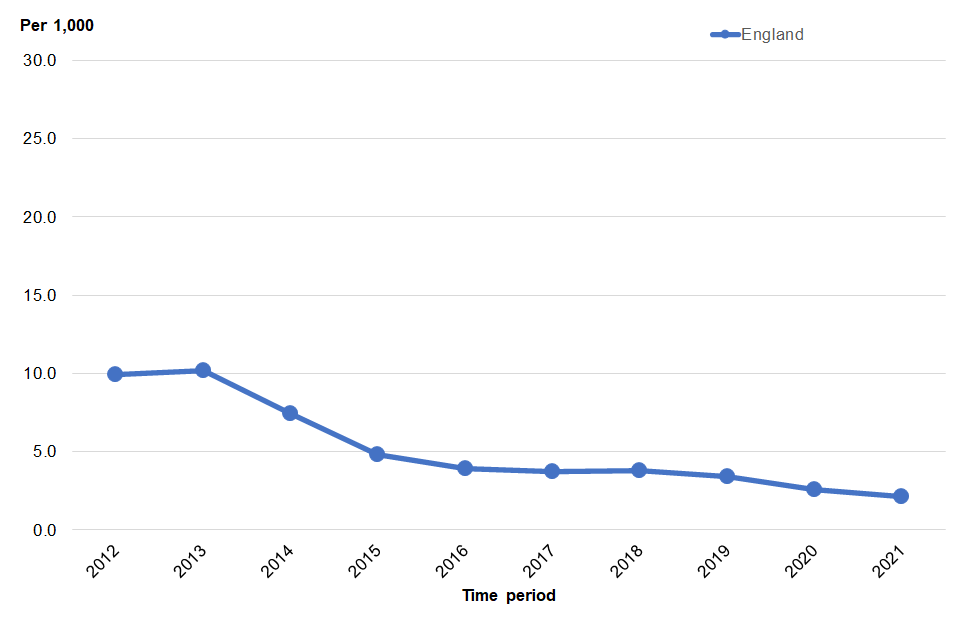
The crude rate of long-term claimants of Jobseeker’s Allowance (JSA) in England, defined as claiming JSA for at least 12 months, decreased again in 2021 to 2.1 per 1,000 resident population (16 to 64 year olds), significantly lower than the previous year of 2.6. This is partly because Universal Credit has been replacing some elements of JSA since April 2013. For example, people who have never been employed can now no longer claim JSA. The rate of long-term claimants of JSA is higher in the North, West Midlands and London.
Figure 4: long-term claimants of JSA, rate per 1,000 residents, 2012 to 2021, England
For more information, see DWP Benefits Statistics: February 2022.
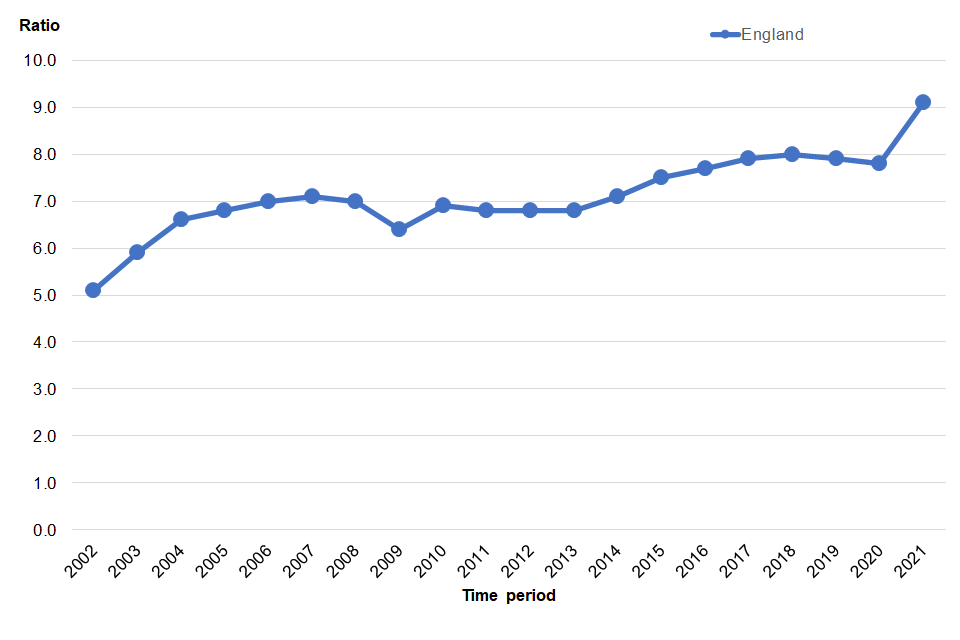
2.10 Affordability of home ownership – house price to earnings ratio
In England in 2021, full-time employees could expect to spend 9.1 times their workplace-based annual earnings on purchasing a home. This is a big increase since 2020, when this ratio was 7.8 times.
Figure 5: affordability of home ownership (house price to earnings ratio), 2020 to 2021, England
For more information, see Housing affordability in England and Wales - Office for National Statistics.
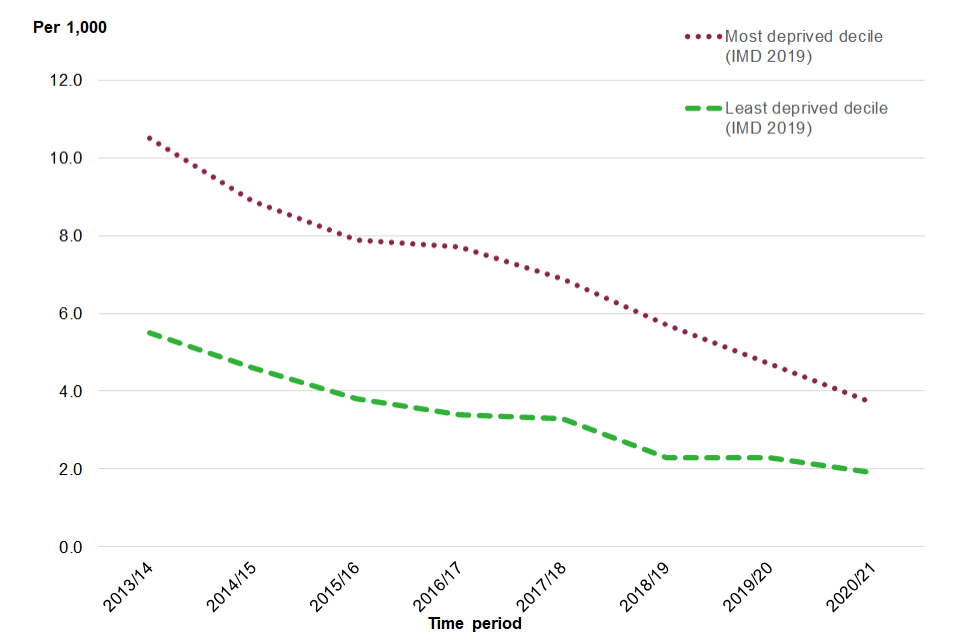
2.11 Rate of children aged 10 to 17 entering the youth justice system
The rate of children aged 10 to 17 years entering the youth justice system was 2.8 per 1,000 children in financial year 2020 to 2021, significantly lower than financial year 2019 to 2020 (3.5 per 1,000 children) and continuing a long-term downward trend. The gap between the rate of children entering the youth justice system in the most deprived decile of areas compared with the least deprived is narrowing. It is possible that the pandemic has had some effect on the system during periods of restrictions, such as court closures, pauses to jury trials and remote hearings. Furthermore, changes to people’s behaviour, including reduced social contact may have had an effect on the number of proven offences.
Figure 6: rate of children aged 10 to 17 entering the youth justice system, financial year 2013 to 2014 to financial year 2020 to 2021, most and least deprived decile of areas
For more information, see Youth Justice Statistics 2020 to 2021
3. Background
This tool brings together available indicators at England and local authority level on the wider determinants of health, with links to further resources. The Wider Determinants of Health tool is designed to:
- draw attention to the broad range of individual, social and environmental factors which influence our health
- provide the public health system with intelligence on the wider determinants of health to help improve population health and reduce health inequalities
The indicators that have been brought together for this tool are a combination of wider determinants, health behaviours and health outcomes.
For queries relating to this publication, contact profilefeedback@phe.gov.uk.