Police use of force statistics, England and Wales: April 2020 to March 2021
Published 16 December 2021
Applies to England and Wales

© Crown copyright 2021
This publication is licensed under the terms of the Open Government Licence v3.0 except where otherwise stated. To view this licence, visit nationalarchives.gov.uk/doc/open-government-licence/version/3 or write to the Information Policy Team, The National Archives, Kew, London TW9 4DU, or email: psi@nationalarchives.gov.uk.
Where we have identified any third party copyright information you will need to obtain permission from the copyright holders concerned.
This publication is available at https://www.gov.uk/government/statistics/police-use-of-force-statistics-england-and-wales-april-2020-to-march-2021/police-use-of-force-statistics-england-and-wales-april-2020-to-march-2021
Frequency of release: Annual
Forthcoming releases: Home Office statistics release calendar
Home Office responsible statistician: Jenny Bradley
Press enquiries: pressoffice@homeoffice.gov.uk
Telephone: 0300 123 3535
Public enquiries: PublicOrderStatistics@homeoffice.gov.uk
This release contains statistics on police use of force for the period April 2020 to March 2021.
1. Summary
In the year ending 31 March 2021, there were 562,280 recorded incidents in which a police officer used force.
Restraint tactics (e.g. handcuffing) were the most common type of force used (447,496 incidents, 80%).
The most common reason an officer used force was to protect themselves (391,202 incidents, 70%).
The most common impact factor was the person being under the influence of alcohol (186,810 incidents, 33%).
The most common outcome was the person being arrested (425,941 incidents, 76%).
Most common characteristics of people involved in the 562,280 incidents:
-
70% of people were perceived as White (393,544) by the officer
-
82% of people were perceived as male (460,410) by the officer
-
54% of people were perceived as between 18 and 34 years of age (301,361) by the officer
-
81% of people were not perceived to have a physical or mental health condition (457,808)
2. Introduction
From 1 April 2017, the Home Office required all police forces in the UK to record data on police use of force. The purpose of this is to provide the public with more information on the different types of force used by the police and the context in which it occurs.
The statistics on police use of force within this publication cover incidents in England and Wales between 1 April 2020 and 31 March 2021. Data were collected from the 43 Home Office funded police forces in England and Wales.
A range of restrictions relating to the COVID-19 pandemic began on 12 March 2020, and the first UK lockdown measures were announced on 23 March 2020. It is likely that these restrictions will have impacted on the types of incidents attended by police during the year ending March 2021, and the types of force used during these incidents. It is not possible to determine the extent of the impact of the pandemic on the use of force from the data provided by police forces.
A use of force incident is defined as a situation in which a police officer uses any of the following force tactics:
-
restraint tactics: handcuffing (compliant or non-compliant), limb and or body restraints, ground restraint
-
unarmed skills: distraction strikes with hands and feet; and pressure point and joint locks
-
use of other equipment: baton (including where it was drawn but not used), irritant spray (including where it was drawn but not used), spit and bite guard, shield (e.g. person struck or pushed with a shield)
-
less lethal weapons: Conducted Energy Device (CED, e.g. TASER®), including where it was used without being discharged, Attenuating Energy Projectile (AEP), including where it was drawn but not used
-
firearms: this refers to the use of conventional firearms, including whether the firearm was aimed or fired
-
other: use of dogs (including where a dog was deployed but did not come into contact with (i.e. bite) the person), other improvised tactics
See the user guide for more details on tactics, including a tactics glossary.
One ‘use of force incident’ refers to one officer’s use of force involving one person, albeit multiple types of force may have been used in one incident.
As well as the tactics used, officers must also record:
- the person’s details (age, gender, ethnicity and physical or mental health condition, as perceived by the reporting officer)
- the reason(s) for using force and other impact factors
- outcome(s)
- location(s)
- injuries to the person involved in the incident and officers
The police use of force statistics do not include incidents where force was used in designated public order events. See the user guide for more information.
Limitations of these statistics
These statistics provide a national picture of police use of force in England and Wales. Whilst the coverage is considered to be good, it is likely that the number of incidents recorded by police forces will continue to increase year-on-year as recording methods and practices continue to improve. Not all police forces were able to record data for every field required, and two forces (Warwickshire and West Mercia) submitted data to the Home Office in a format which meant that some tactic data could not be linked to the incident details.
Police officers must record the details of any incident where they deployed force tactics through a ‘use of force report’. Where an incident involved more than one person or officer, each officer who used force must complete one use of force report, per person, detailing their own use of force. As such, a singular event or individual may feature in multiple use of force reports.
In these statistics, one ‘use of force incident’ refers to one officer’s use of force involving one person. As such, the ‘number of incidents’ reported is not equal to the number of unique incidents or people involved in incidents. For example, if one person is restrained by two officers, two use of force reports should be completed. Furthermore, an officer may use multiple tactics in one incident. In these situations, multiple tactics are recorded in one incident.
It is important to recognise that a report could include multiple tactics, reasons for using force, impact factors, locations, and outcomes, although it should only relate to one officer and one person. It is not possible to determine from such reports, for example, the location in which each tactic was used (where multiple tactics and locations are reported), or which tactic (or combination thereof) caused someone’s injuries. Although this limits the interpretations that can be made from the data, the information is collected in this way to ensure the reporting process isn’t excessively bureaucratic or burdensome (e.g. through the completion of multiple or lengthy use of force reports) for police forces.
Statisticians in the Home Office have and will continue to work with police forces and the National Police Chiefs’ Council (NPCC) to improve the quality and completeness of these statistics.
2.1 Changes to the use of force statistical publication
The police use of force statistics, year ending March 2021 are classified as official statistics. This is the fourth annual publication of these statistics and the first year that the experimental statistics label has been removed from the publication. This indicates that the development stage of the statistics has ended, and that:
- feedback demonstrates that the statistics are useful and credible
- the statistical methods involved in analysing the data are now well established
- the quality and coverage limitations are known and the impact of these are understood
More information on the official statistics label is available in the user guide to police use of force statistics, England and Wales.
The year ending March 2021 police use of force publication includes incident level data for all police forces in an open data format. Each row of data represents one officer’s use of force involving one person. More information is available in the open data file.
Rates of police use of force and CED use have been calculated with ONS mid-2019 population estimates in addition to 2011 Census population estimates. Whilst the mid-2019 estimates are a more recent estimate of the population, they were not produced to the same level of quality as the census estimates.
New analysis that considers the interrelation of personal characteristics and incident details is included within this publication to provide context to key statistics.
3. Use of force incidents: overview
Police officers who deploy any force tactic(s) must report the details of their own use of force. In this publication, a use of force incident refers to one officer’s use of force involving one person. A singular event or individual may therefore feature in multiple use of force incidents.
3.1 Total number of incidents
There were 562,280 recorded incidents where a police officer reported the use of force on an individual in England and Wales in the year ending March 2021. In the previous year, experimental statistics showed there were 491,984 recorded incidents. The change in the number of incidents is likely due to the improved recording of use of force incidents over the four-year period of their publication, and should not be interpreted as an increase in use of force over this time.
The number of incidents reported by each police force ranged from 1,541 in Staffordshire to 172,451 in the Metropolitan Police force area. Figures by police force are influenced by the size of the police force area and its population, and a range of other socioeconomic factors.
3.2 Tactics used in incidents
There were 809,459 use of force tactics reported in 562,280 incidents. Use of force incidents can include multiple tactics and involve multiple officers, each reporting their use of force. Each officer may only use one or two different tactics themselves during an incident, but this does not mean it was the only tactic that the person experienced.
Figure 1: Number of times tactics were used in use of force incidents, England and Wales, year ending March 2021
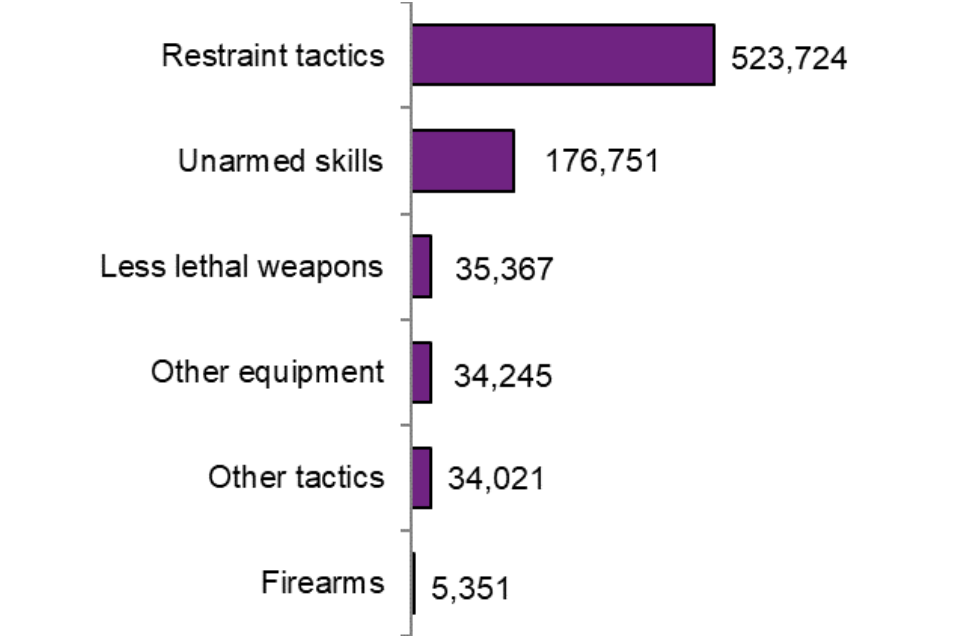
Source: Home Office, Police use of force statistics, England and Wales, April 2020 to March 2021, Table 1.
Notes: The number of tactics does not sum to the total number of incidents as multiple tactics can be used in an incident.
Less lethal weapons relates to the use of Conducted Energy Device (CED, e.g. TASER®), including where it was used without being discharged and Attenuating Energy Projectile (AEP), including where it was drawn but not used.
Other tactics include the use of dogs and other or improvised tactics such as vehicles or horses.
Figures relating to firearms refer to the use of conventional firearms, including where the firearm was aimed or fired.
For ease of viewing, some of the tactics have been grouped – see the data tables for groupings.
Restraint was the most common tactic type. The majority involved handcuffing which accounted for 50% of all use of force tactics. Unarmed skills were the second most common tactic type, reported 176,751 times (22% of tactics). This includes distraction strikes with hands and feet; and pressure point and joint locks.
Firearms tactics were used by the police 5,351 times (1% of tactics). This includes where the firearm was aimed or fired. More information is published in Police use of firearms, April 2020 to March 2021.
Data quality
The number of incidents does not tell us how many individual people experienced police use of force, but rather how many times force was recorded by police officers. In a situation where three police officers restrained one individual on the ground, and one of those officers then handcuffed the individual, there would be three separate use of force reports submitted (one by each officer). These would be counted in this release as three ‘incidents’. All three reports would include the details of the incident (location, for example) and the person’s details (as perceived by the reporting officer). The report would also include the tactics the reporting officers used (i.e. two reports would list ground restraint only, and one report would list both ground restraint and handcuffing).
The personal characteristics of the person involved in the incident are reported as perceived by the reporting officer. Owing to the nature of incidents where police officers use force, the person’s details are often not known or recorded at the time of the incident. Officers reporting their use of force may not have been involved in questioning the person and asking for their self-reported characteristics, and so are unable to record these in relation to their use of force. Data based on officer perceptions are considered a useful way of understanding the characteristics that the officer perceives the person they used force on to have.
4. Use of force by age, gender, ethnicity and health condition of individuals
4.1 Key results
Of the 562,280 incidents in the year ending March 2021:
- in 301,361 (54%) incidents, individuals were perceived to be 18 to 34 years old
- in 460,410 (82%) incidents, individuals were perceived as male
- in 393,544 (70%) incidents, individuals were perceived as being White
- in 457,808 (81%) incidents, individuals were not perceived to have a physical or mental health condition
4.2 Age (as perceived by officer)
Over half (54%) of the recorded use of force incidents involved people perceived as being between 18 to 34 years old (301,361 incidents). There were 54,283 incidents involving people who were perceived to be under 18 (10%) and, of those, 427 were under 11 (0.1% of all incidents). The majority of tactics used on those under 11 were restraint tactics or unarmed skills (81%). In addition, there were 6 incidents that involved CEDs (1 incident where the CED was discharged, and 5 where the CED was not discharged).
Figure 2: Proportion of tactics used by type of tactic and perceived age, England and Wales, year ending March 2021

Source: Home Office, Police use of force statistics, England and Wales, April 2020 to March 2021, Table 2.
Notes: For ease of viewing, some of the tactics have been grouped – see the data tables for groupings.
Figure 2 shows the tactics used in incidents involving each age group. The most commonly used group of tactics involving those aged 11 and over was restraint tactics. The use of these tactics was lower, proportionally, in the youngest and eldest age groups (‘under 11’ and ‘65 and over’). The greater proportion of unarmed skills and other or improvised tactics used in incidents involving these age groups may be accounted for by officers escorting people rather than handcuffing them, as per guidance issued to police forces on personal safety.
Table 1: Proportion of each tactic experienced by perceived age, England and Wales, year ending March 2021
| Proportion of tactic experienced by group | Under 11 | 11 to 17 | 18 to 34 | 35 to 49 | 50 to 64 | 65 and over | Age not reported | Total | Times tactic group used |
|---|---|---|---|---|---|---|---|---|---|
| Restraint | 0% | 10% | 54% | 26% | 7% | 0.6% | 2% | 100% | 523,724 |
| Unarmed skills | 0.1% | 10% | 53% | 26% | 7% | 0.8% | 3% | 100% | 176,751 |
| Other equipment | 0.0% | 6% | 56% | 26% | 6% | 0.4% | 5% | 100% | 34,245 |
| Less lethal weapons | 0.0% | 7% | 56% | 25% | 7% | 0.7% | 3% | 100% | 35,367 |
| Firearms | 0.07% | 5% | 60% | 20% | 6% | 1.0% | 7% | 100% | 5,351 |
| Other | 0.2% | 9% | 50% | 24% | 7% | 1% | 9% | 100% | 34,021 |
| % of incidents involving group | 0.1% | 10% | 54% | 26% | 7% | 0.7% | 3% | 100% |
Source: Home Office, Police use of force statistics, England and Wales, April 2020 to March 2021, Table 2.
Table 1 shows that people perceived as 11 to 17 years old accounted for 10% of incidents, but experienced proportionally fewer less-lethal weapons and firearms (7% and 5% respectively).
People perceived as being aged between 18 and 34 years old accounted for 54% of incidents, and they experienced a higher proportion of police use of less lethal weapons and firearms (56% and 60% respectively). See data table 2 for further information.
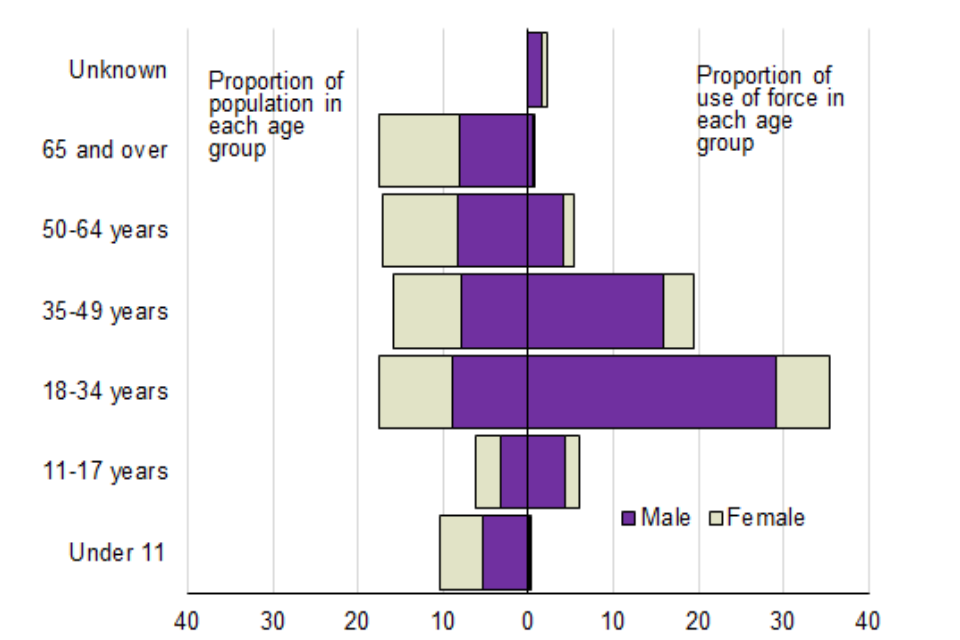
Figure 3 shows that people perceived as aged 18-34 years were over-represented in use of force incidents compared with the overall population according to ONS mid-2019 population estimates. 54% of those involved in use of force incidents were perceived as aged 18-34 compared with 22% in the overall population, with a rate of 23 incidents per 1,000 population. Males had the highest rate of use of force at 16 incidents per 1,000 population, and a rate of 38 incidents per 1,000 population for males aged 18-34 years.
Figure 3: Population and use of force by perceived age, England and Wales, year ending March 2021

Source: Home Office, Police use of force statistics, England and Wales, April 2020 to March 2021, Table 2 and ONS, mid-2019 population estimates.
4.3 Gender (as perceived by officer)
This report refers to the perceived gender rather than the sex of the person. ‘Sex’ can be considered to refer to whether someone is male or female based on their physiology, with ‘gender’ referring to a social construct or sense of self that takes a wider range of forms.
The data collection gives four options for the perceived gender of the person: female, male, other and not reported. ‘Other’ may comprise people who are perceived to be non-binary or transgender.
Of the 562,280 recorded use of force incidents, 82% involved males (460,410 incidents) as perceived by the police officer. Males comprise 49% of the population of England and Wales according to mid-2019 ONS population estimates.
Figure 4: Proportion of tactics used by type and perceived gender, England and Wales, year ending March 2021

Source: Home Office, Police use of force statistics, England and Wales, April 2020 to March 2021, Table 3.
Notes: For ease of viewing, some of the tactics have been grouped – see the data tables for groupings.
As shown in Figure 4, incidents involving females (as perceived by the officer) were more likely to include unarmed skills, and less likely to include the use of other equipment (e.g. batons), than any other reported gender. The greater proportion of unarmed skills and ‘other’ tactics used may be accounted for by officers escorting people rather than handcuffing them, as per guidance issued to police forces on personal safety.
Table 2: Proportion of tactic experienced by type and perceived gender, England and Wales, year ending March 2021
| Proportion of tactic experienced by group | Male | Female | Other | Gender not reported | Total | Times tactic group used |
|---|---|---|---|---|---|---|
| Restraint | 82% | 16% | 0.2% | 1% | 100% | 523,724 |
| Unarmed skills | 77% | 21% | 0.3% | 2% | 100% | 176,751 |
| Other equipment | 86% | 11% | 0.5% | 2% | 100% | 34,245 |
| Less lethal weapons | 91% | 8% | 0.3% | 2% | 100% | 35,367 |
| Firearms | 90% | 8% | 0.3% | 1% | 100% | 5,351 |
| Other | 74% | 24% | 0.4% | 2% | 100% | 34,021 |
| % of incidents involving group | 82% | 17% | 0.3% | 1% | 100% |
Source: Home Office, Police use of force statistics, England and Wales, April 2020 to March 2021, Table 3.
Notes: Where percentages have been rounded, they may not sum to the total.
Those perceived as male accounted for 82% of incidents but experienced a higher proportion of police use of less lethal weapons and firearms (91% and 90% respectively). See data table 3 for further information.
4.4 Ethnicity (as perceived by officer)
Around 70% (393,544) reported use of force incidents involved people who were perceived as being from a White ethnic group; 16% (88,988) were perceived as being from a Black ethnic group and 8% (43,632) were perceived as being from an Asian ethnic group. The remainder were perceived as being from a Mixed ethnic group (2%; 12,875) or Other ethnic group (3%; 15,020). No ethnicity information was recorded in 8,221 (1%) of incidents.
Figure 5: Proportion of tactics used by type and perceived ethnicity, England and Wales, year ending March 2021
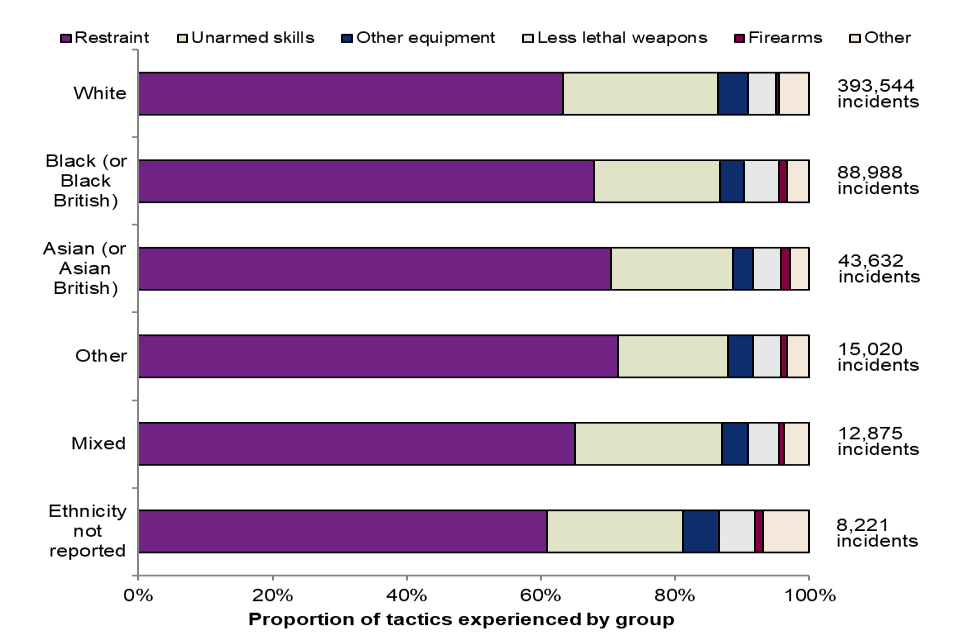
Source: Home Office, Police use of force statistics, England and Wales, April 2020 to March 2021, Table 4.
Notes: For ease of viewing, some of the tactics have been grouped – see the data tables for groupings.
Details on ethnicity groupings are available on GOV.UK.
Table 3: Proportion of tactic experienced by type and perceivd ethnicity, England and Wales, year ending March 2021
| Proportion of tactic experienced by group | White | Black (or Black British) | Asian (or Asian British) | Mixed | Other | Not reported | Total |
|---|---|---|---|---|---|---|---|
| Restraint | 70% | 16% | 8% | 2% | 3% | 1 | 100% |
| Unarmed skills | 76% | 13% | 6% | 2% | 2% | 1% | 100% |
| Other equipment | 76% | 13% | 5% | 2% | 2% | 2% | 100% |
| Less lethal weapons | 69% | 18% | 7% | 2% | 2% | 2% | 100% |
| Firearms | 55% | 24% | 13% | 2% | 3% | 2% | 100% |
| Other | 77% | 12% | 5% | 2% | 2% | 2% | 100% |
| % of incidents involving group | 70% | 16% | 8% | 2% | 3% | 1% | 100% |
Source: Home Office, Police use of force statistics, England and Wales, April 2020 to March 2021, Table 4.
Notes: Details on ethnicity groupings are available on GOV.UK.
People perceived as being from a Black ethnic group (16% of incidents) were involved in proportionally more incidents involving the use of less lethal weapons and firearms (18% and 24% respectively), while people perceived as being from a White ethnic group (70% of incidents) were involved in proportionally less (69% and 55% respectively). People perceived as being from an Asian ethnic group (8% of incidents) were involved in proportionally more incidents involving the use of firearms (13%). See data table 4 for further information.
People perceived as being from a Black, Asian, or Other minority ethnic group had a higher rate of use of force incidents, at 17 incidents per 1,000 population (mid-2019 estimates) compared with those perceived as White (8 incidents per 1,000 population).
4.5 Age, gender and ethnicity (as perceived by officer)
People perceived as male and aged 18-34 years were over-represented in use of force incidents compared with the overall population (mid-2019 ONS population estimates) and this varied by perceived ethnic group (Figures 6 and 7). Those perceived as White, male and aged 18-34 accounted for 29% of all use of force incidents, compared with 9% of the overall population, and a rate of 31 use of force incidents per 1,000 population. Those perceived as being from a Black, Asian, Mixed, or Other minority ethnic group, male and aged 18-34 accounted for 15% of all use of force incidents, compared with 2% of the overall population, and a rate of 64 use of force incidents per 1,000 population.
Figure 6: Proportion of use of force incidents involving people perceived as White, by perceived age and gender, compared with the population, England and Wales, year ending March 2021
Source: Home Office, Police use of force statistics, England and Wales, April 2020 to March 2021 and ONS, mid-2019 population estimates.
Figure 7: Proportion of use of force incidents involving people perceived as Black, Asian or another minority ethnic group, by perceived age and gender, compared with the population, England and Wales, year ending March 2021
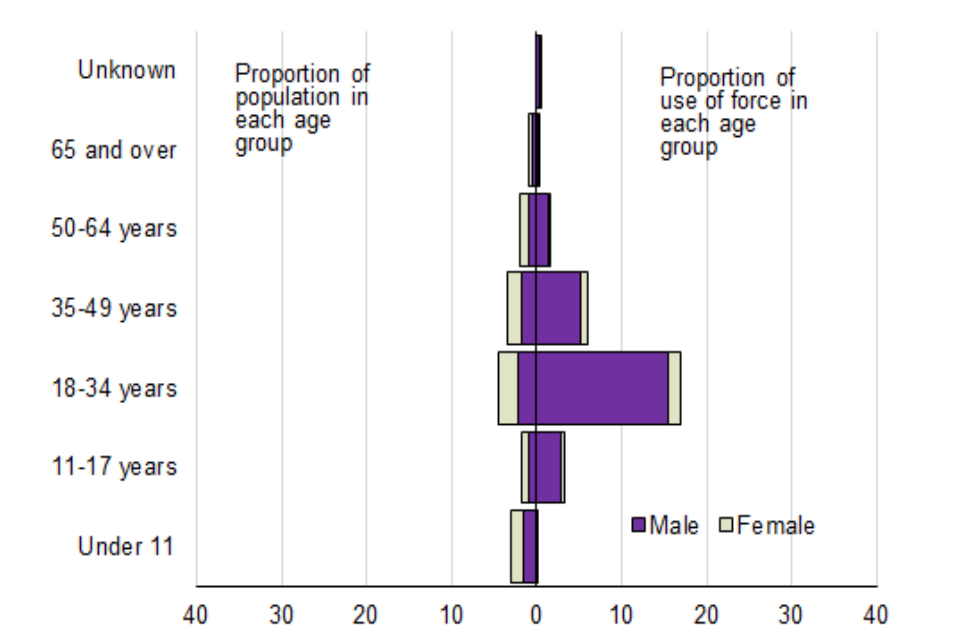
Source: Home Office, Police use of force statistics, England and Wales, April 2020 to March 2021 and ONS, mid-2019 population estimates.
4.6 Ethnicity (as perceived by officer) rates
The Metropolitan Police is the largest police force in England and Wales and therefore had the largest number of use of force incidents (172,451; 31%). The Metropolitan Police also has a proportionately larger number of people perceived as Black, Asian or another minority ethnic group resident within its police force area (40%) compared with the rest of England and Wales (10%) according to the 2011 census (43% and 11% respectively using mid-2019 ONS population estimates). The combination of the two means that data from the Metropolitan Police force area can skew national level figures. Rates are therefore calculated for the Metropolitan Police separately from other forces in England and Wales.
Use of force tactics, ranging from handcuffing and ground restraint, to the use of batons, CEDs and firearms, involved people perceived as being from a Black ethnic group at a rate 4.6 times higher than people perceived as being from a White ethnic group in police force areas in England and Wales (excluding the Metropolitan Police). The rate was 2.5 times higher for people perceived as being from an Other ethnic group, and similar to the White group for those perceived as being from a Mixed (1.2) or Asian (0.9) ethnic group.
These rates reduced to 4.1 times higher for those perceived as being from a Black ethnic group when comparing with more recent (mid-2019) ONS population estimates, and remained similar for those perceived as being from Other, Mixed and Asian ethnic groups.
In the Metropolitan police force area, use of force tactics involved people perceived as being from a Black ethnic group at a rate 4.0 times higher than those perceived as being from a White ethnic group. The rate was 2.2 times higher for people perceived as being from another ethnic group and similar to the White group for those perceived as being from an Asian or Mixed ethnic group. These rates reduced to 3.6 for those perceived as Black, 2.0 for those perceived as Other, 0.9 for those perceived as Asian and 0.7 for those perceived as Mixed when using mid-2019 ONS population estimates.
Table 4: Rate of use of force (all tactics) by perceived ethnicity, England and Wales, year ending March 2021
| White | Black (or Black British) | Asian (or Asian British) | Mixed | Other | |
|---|---|---|---|---|---|
| England and Wales | 1.00 | 5.38 | 1.11 | 1.25 | 2.85 |
| England and Wales exc. Metropolitan Police | 1.00 | 4.57 | 0.91 | 1.22 | 2.45 |
| Metropolitan Police | 1.00 | 3.99 | 1.01 | 0.93 | 2.20 |
Source: Home Office, Police use of force statistics, England and Wales, April 2020 to March 2021 and 2011 Census.
Notes: Rates for Black, Asian, Mixed and Other ethnic groups are show in relation to the White ethnic group, e.g. use of force incidents involved those perceived as Black 4.57 times more often than those perceived as White in England and Wales (excluding the Metropolitan Police).
Details on ethnicity groupings are available from GOV.UK.
The rate of use of force can be calculated for different ethnic groups by taking the number of times tactics were used on each ethnicity group, and dividing by the number of people resident in England and Wales by ethnic group (as estimated by the 2011 census or mid-2019 ONS population estimates). Whilst this calculation provides insight into the relative use of force for different ethnic groups, it has the following limitations and should be interpreted with caution for the following reasons:
-
multiple incidents of use of force may be recorded on the same individual, meaning that the personal characteristics of that individual are over-represented in the use of force dataset
-
data are not available on the ethnicity of all people that the police come into contact with and therefore the calculation does not consider any disproportionality in this group, which is affected by much wider socioeconomic factors, and assumes the distribution is the same as the resident population of England and Wales
-
the population data is based on the 2011 census, and so is used on the understanding that since this time population distributions will have changed; comparisons with the mid-2019 ONS population estimates (projected from the 2011 census data) are included to help address this limitation
-
using aggregate numbers fails to take account of the variation in the size and geographical distribution of different ethnicity groups
-
police force areas vary in their ethnicity composition; an average national figure presumes that all use of force tactics and ethnicity groups are spread evenly across forces, whereas these can differ considerably between forces within a police force area there can be significant variation in terms of the distribution of different ethnicity groups, which may be masked by force level averages
4.7 Health condition (as perceived by officer)
The majority (81%) of reported use of force incidents involved people who were not perceived to have a physical or mental health condition (457,808 incidents).
Figure 8: Proportion of tactics by type and perceived physical or mental health condition, England and Wales, year ending March 2021

Source: Home Office, Police use of force statistics, England and Wales, April 2020 to March 2021, Table 5.
Notes: For ease of viewing, some of the tactics have been grouped, see the data tables for groupings.
People perceived as having a mental health condition accounted for 15% of incidents and those with physical health conditions, or both mental and physical health conditions, accounted for fewer than 1% of incidents.
Figure 8 shows that restraint tactics were used in fewer incidents (14%) where the person was perceived as having a mental health condition. This may be partly accounted for by guidance issued to police forces on personal safety, which states peoples’ characteristics such as mental and physical health conditions should be considered in the decision to use handcuffs. In situations where handcuffing or other restraints would aggravate the person’s condition, unarmed skills (which proportionately were used in a higher number of incidents where the person was perceived as having a mental health condition (21%)), may have been employed by the officer instead. People perceived as having a mental health condition were involved in proportionally more incidents involving the use of less lethal weapons (17%) but fewer involving the use of firearms (7%).
Table 5: Proportion of tactic experienced by type and perceived physical and mental health condition, England and Wales, year ending March 2021
| Proportion of tactic experienced by group | None | Mental | Physical | Mental and physical | Not reported | Total |
|---|---|---|---|---|---|---|
| Restraint | 82% | 14% | 0.7% | 0.5% | 3% | 100% |
| Unarmed skills | 78% | 21% | 0.7% | 0.7% | 1% | 100% |
| Other equipment | 80% | 18% | 0.7% | 0.5% | 1% | 100% |
| Less lethal weapons | 81% | 17% | 0.5% | 0.6% | 1% | 100% |
| Firearms | 89% | 7% | 0.9% | 0.3% | 3% | 100% |
| Other | 78% | 19% | 0.8% | 0.8% | 1% | 100% |
| % of incidents involving group | 81% | 15% | 0.7% | 0.5% | 3% | 100% |
Source: Home Office, Police use of force statistics, England and Wales, April 2020 to March 2021, Table 5.
The proportion of incidents involving someone perceived to have a mental health condition varied by perceived ethnic group (16% of those perceived as White were also perceived to have a mental health condition, 13% of those perceived as Black, 12% of those perceived as Asian, 14% of those perceived as Mixed and 11% of those perceived as being from another ethnic group).
Data quality
All person details are recorded as perceived by the reporting officer. For more information on data quality see the user guide.
5. Use of force by reason, impact factors and outcomes
5.1 Key results
The most commonly reported reasons for using force were for the reporting officers’ own protection (391,202 incidents, 70%), protection of other officers (338,732 incidents, 60%) and to assist in making an arrest (286,695 incidents, 51%).
The most commonly reported impact factors were alcohol (186,810 incidents, 33%), drugs (179,256 incidents, 32%) and the size, gender or build of the person involved (173,676 incidents, 31%).
The most common outcome was that the person was arrested (425,941 incidents, 76%).
This section summarises tactic use by reasons, impacting factors, and outcomes. See data tables 6, 7 and 8 for further information.
5.2 Reasons for using force
Officers have the option to record multiple reasons for their use of force within an incident. Across all reported incidents, the most commonly reported reasons for using force were for protection or to assist in making an arrest. Using force as a means of protection most commonly involved the officer protecting themselves or other officers, but also included officers protecting the public or the person involved.
Figure 9: Top 5 reasons for using force, England and Wales, year ending March 2021

Source: Home Office, Police use of force statistics, England and Wales, April 2020 to March 2021, Table 6.
Notes: Figure shows the five most common reasons only. Multiple reasons can apply in an incident.
In incidents involving police use of firearms, including where a firearm was aimed or fired, the most common reasons also included preventing an offence. Home Office statistics on Police use of firearms, April 2020 to March 2021 show that over this period there were 4 incidents in which firearms were discharged (fired) in England and Wales.
5.3 Impact factors
As well as the reason for using force, data on other factors that impacted on or affected the incident are collected. These are called ‘impact factors’ and can include the possession of a weapon, alcohol, drugs, mental health, prior knowledge, the size, gender or build of the person, acute behavioral disturbance (ABD), a crowd or other. The most common impact factors recorded were alcohol, drugs and the size, gender or build of the person involved.
Where firearms or less lethal weapons were used (CEDs and AEPs), the most common impact factor recorded was the person being in possession of a weapon (83% of firearms incidents and 57% of CED incidents).
5.4 Outcomes
Figure 10: Number of incidents, by outcome, England and Wales, year ending March 2021
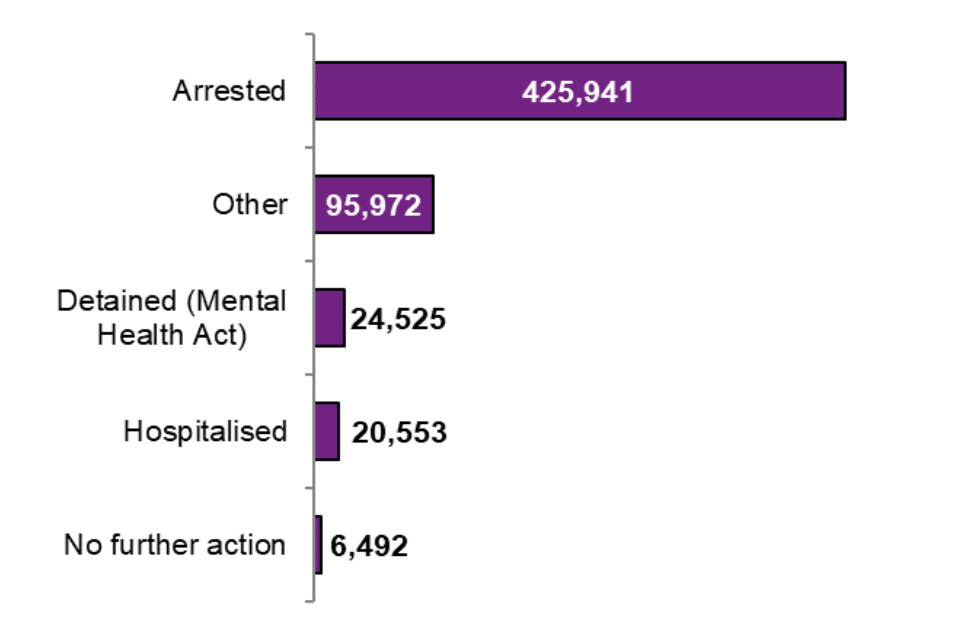
Source: Home Office, Police use of force statistics, England and Wales, April 2020 to March 2021, Table 8.
Notes: Multiple outcomes can apply in an incident.
The most common outcome across all incidents was the person being arrested (76%) which was the most frequently reported outcome when looking across all individual tactics.
‘Other’ was the second most common outcome (17%) and could include the person being cautioned, or de-arrested following further information, for example. See the user guide for further details.
There were 31 fatalities reported as the outcome to an incident involving police use of force. Officers may have recorded this outcome when it did not occur as a result of their use of force.
More information on deaths as a result of the person being injured during the use of force incident can be found in section 8.2.
Data quality
Incidents can involve multiple tactics, multiple reasons for using force, multiple impact factors and multiple outcomes, and, as such, it is not possible to assume causality. For example, in an incident where restraint tactics were used and the outcome ‘hospitalisation’ was recorded, it does not mean that hospitalisation was caused by the use of restraint tactics. Other tactics may have been recorded in that incident which caused or contributed to the outcome. This also applies to reasons for using force and impact factors.
6. CED (conducted energy device) use
Officers must record when a CED (i.e. a TASER®) is used in an incident, even when it is not fired. CED use is recorded against seven categories: drawn, aimed, arced, red-dot, drive-stun, fired and angle drive-stun. Drawn, aimed, arced and red-dot are non-discharge uses as no electricity is discharged into the person. Drive-stun, fired and angle drive-stun are discharge uses. For definitions of these uses, see the user guide.
In keeping with previous recording on CED use, these statistics present the ‘highest’ use of CED from each incident. For example, if a CED is drawn, aimed, red-dotted and fired, this use will appear under ‘fired’ only.
6.1 Incidents involving CEDs
CEDs were used in 34,429 incidents, although where the use type was stated, the CED was not discharged in 90% (29,287) of these incidents.
Total CED use increased by 7% (+2,371) from the previous year. Excluding Lancashire police force, who were unable to provide the type of use for all of their 622 CED uses due to changes in their recording system, there was an 8% (+2,203) increase in non-discharge uses and a 2% (+59) increase in CED discharges. Not stated uses decreased by 6% (-70).
The type of use with the largest increase in the latest year (excluding Lancashire police force) was the use of red-dot, which increased by 6% (+1,070).
6.2 Police use of CED prior to year ending March 2021
The statistics on police use of CEDs that were previously collected and published by the Home Office on a calendar year basis up to 2016 (inclusive) are available on GOV.UK. The way in which police use of CEDs is counted and measured has remained consistent over this time; however, the way officers report their use has changed. Therefore, figures from the year ending March 2018 are not directly comparable with figures for previous years. The proportion of CED incidents where the type of use was not stated has been higher since the reporting change; at 4% in the year ending 2020 and 5% in the year ending 2021.
Figure 11: Number of times CEDs were used, England and Wales, year ending December 2010 to year ending March 2021

Source: Home Office, Police use of force statistics, England and Wales, April 2020 to March 2021, Table 13; Police use of TASER® X26 conducted energy devices statistics, England and Wales, collection.
Notes: CEDs were first trialled in UK police forces in 2003, after which the use of CEDs by all specially trained officers was authorised by the then Home Secretary in 2008. The CED roll out to all 43 Home Office police forces finished in 2013.
Increases in CED use since the year ending March 2018 may reflect:
-
the increase in recent years of the number of CED-trained officers and CEDs available in police forces (which is based on forces’ strategic assessments of threat and risk)
-
officers dealing with more incidents with the potential for conflict
-
an increase in the recording of CED due to improved and simpler methods of recording
6.3 Police use of CED by perceived ethnicity
In total, 68% of CED incidents involved people perceived as being from a White ethnic group, 18% were perceived as being from a Black ethnic group and 7% were perceived as being from an Asian ethnic group.
Table 6 shows use of CED by the perceived ethnicity of the person involved. Once drawn, CEDs were discharged in 10% of CED incidents involving people perceived to be from a White, Black or Other ethnic group and in 8% of incidents involving people perceived as being from an Asian or Mixed ethnic group.
Table 6: CED use, by type of use and perceived ethnicity, England and Wales, year ending March 2021
| CED use type | White | Black (or Black British) | Asian (or Asian British) | Mixed | Other | Not reported | Total |
|---|---|---|---|---|---|---|---|
| Times CED used | 23,569 (68%) |
6,361 (18%) |
2,290 (7%) |
836 (2%) |
810 (2%) |
563 (2%) |
34,429 (100%) |
| Non-discharge | 19,238 (82%) |
5,548 (87%) |
2,028 (89%) |
734 (88%) |
701 (87%) |
464 (82%) |
28,713 (83%) |
| Discharge | 2,258 (10%) |
654 (10%) |
180 (8%) |
71 (8%) |
85 (10%) |
36 (6%) |
3,284 (10%) |
| Not stated | 2,073 (9%) |
159 (2%) |
82 (4%) |
31 (4%) |
24 (3%) |
63 (11%) |
2,432 (7%) |
Source: Home Office, Police use of force statistics, England and Wales, April 2020 to March 2021, Table 4.
Notes: All percentages in this table are rounded according to the rounding conventions in the user guide.
Drawn, aimed, arced, and red-dot are non-discharge uses as no electricity is discharged into the person. Drive-stun, fired, and angle drive-stun are discharge uses.
Where percentages have been rounded, they may not sum to the total.
Not stated includes CED uses that were missing full incident details and 622 uses by Lancashire police force who were unable to report use type for all their uses.
6.4 Police use of CED rates by perceived ethnicity
The rate of CED use can be calculated for different ethnic groups by taking the number of times it was used on each ethnic group, and dividing by the number of people within each ethnic group for a given population. Whilst this calculation provides insight into the relative use of CED for different ethnic groups, it has the same limitations as the relative use of force for different ethnic groups as outlined in section 4.6 of this release, and figures should be interpreted with the same level of caution.
CED use, which incorporates both discharge and non-discharge incidents, involved someone perceived as being from a Black ethnic group at a rate 6.3 times higher than someone perceived as being from a White ethnic group in police force areas in England and Wales (excluding the Metropolitan police), and at a rate 5.1 times higher in the Metropolitan police force area, when compared with 2011 census data. Comparing with mid-2019 ONS population estimates, these rates reduced to 5.7 for England and Wales (excluding the Metropolitan police) and to 4.6 for the Metropolitan police. CED discharge incidents (where the CED is fired or used to deliver a drive-stun or angled drive-stun) involved someone perceived as being from a Black ethnic group at a rate 6.6 times higher than someone perceived as being from a White ethnic group in police force areas in England and Wales (excluding the Metropolitan police), and at a rate 5.1 times higher in the Metropolitan police force area, when compared with 2011 census data. Comparing with mid-2019 ONS population estimates, these rates were 6.0 and 4.6 respectively.
The Metropolitan Police is the largest police force in England and Wales and therefore had the largest number of CED uses (9,509 uses; 28% of England and Wales total). It also has a proportionately larger number of people from a Black, Asian or Other minority ethnic group within its police force area compared with the rest of England and Wales according to the 2011 Census (40% compared with 10%) and mid-2019 ONS population estimates (43% compared with 11%). The combination of the two means that data from the Metropolitan police force area can skew national level figures. Table 7 shows the rate of CED uses for the Metropolitan Police separately from England and Wales.
Table 7: Rate of CED use, by type of use and perceived ethnicity, England and Wales, year ending March 2021
| White | Black (or Black British) | Asian (or Asian British) | Mixed | Other | |
|---|---|---|---|---|---|
| All CED use | |||||
| England and Wales | 1.00 | 6.98 | 1.11 | 1.40 | 2.94 |
| England and Wales exc. Metropolitan Police | 1.00 | 6.29 | 1.02 | 1.46 | 2.81 |
| Metropolitan Police | 1.00 | 5.07 | 0.91 | 0.95 | 2.12 |
| CED discharges | |||||
| England and Wales | 1.00 | 7.49 | 0.91 | 1.24 | 3.22 |
| England and Wales exc. Metropolitan Police | 1.00 | 6.59 | 0.78 | 1.32 | 2.53 |
| Metropolitan Police | 1.00 | 5.13 | 0.75 | 0.77 | 2.48 |
| CED non-discharges | |||||
| England and Wales | 1.00 | 7.46 | 1.21 | 1.50 | 3.12 |
| England and Wales exc. Metropolitan Police | 1.00 | 6.51 | 1.09 | 1.56 | 2.98 |
| Metropolitan Police | 1.00 | 5.07 | 0.93 | 0.97 | 2.08 |
Source: Home Office, Police use of force statistics, England and Wales, April 2020 to March 2021, Table 13 and 2011 Census.
Notes: Rates are shown relative to the White ethnic group. Rates for Black, Asian, Mixed and Other ethnic groups are show in comparison with the White ethnic group, e.g. CED use involved those perceived as Black 6.29 times more often than those perceived as White in England and Wales (excluding the Metropolitan Police).
Details on ethnicity groupings are available on GOV.UK.
6.5 CED use by impact factor and personal characteristics
Possession of a weapon was the most commonly reported impact factor in CED incidents (57%).
Figure 12 shows that the age breakdown of those involved in CED incidents, and, of those, where possession of a weapon was an impact factor. 57% of all CED incidents involved people perceived as aged 18-34 years, and possession of a weapon was an impact factor of in 55% of these incidents.
Figure 12: Percentage of incidents involving CED use and an impact factor of possession of a weapon, by perceived age group, year ending March 2021
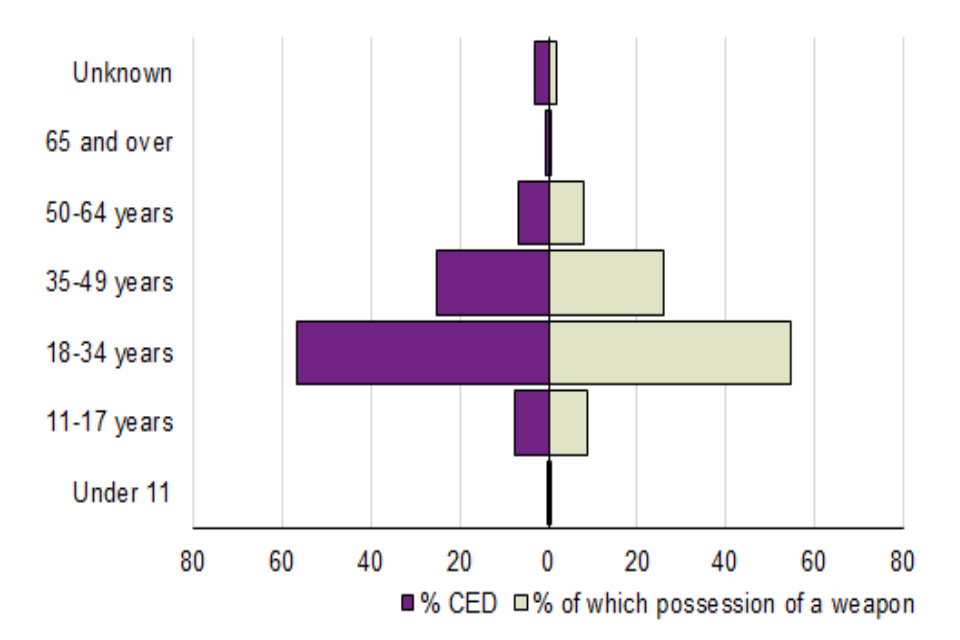
Source: Home Office, Police use of force statistics, England and Wales, April 2020 to March 2021, open data table
Of all use of force incidents involving people perceived as White, possession of a weapon was recorded as an impact factor in 13% of incidents. This was 25% for those perceived as Black, 20% for those perceived as Mixed and 18% for those perceived as Asian or another ethnicity.
For all incidents involving CED use, possession of a weapon was more likely to be an impact factor for those perceived to be Black and aged 18 to 34 years (62%) than those perceived to be White and aged 18 to 34 years (53%).
For all incidents where possession of a weapon was an impact factor, a CED was more likely to be used in incidents involving those perceived to be White (25%), compared with those perceived as Mixed (21%), Other (19%), Black or Asian (both 18%).
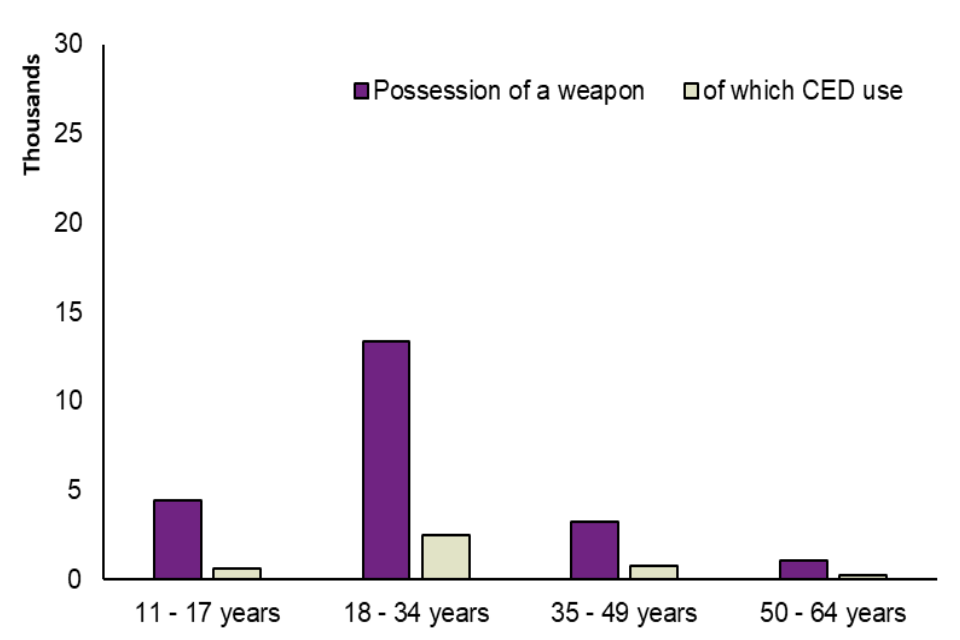
Figure 13. Use of force incidents involving those perceived as White with possession of a weapon as an impact factor and CED use, by selected perceived age groups, England and Wales, year ending March 2021

Source: Home Office, Police use of force statistics, England and Wales, April 2020 to March 2021, open data table
Figure 14. Use of force incidents involving those perceived as Black with possession of a weapon as an impact factor and CED use by selected perceived age groups, England and Wales, year ending March 2021
Source: Home Office, Police use of force statistics, England and Wales, April 2020 to March 2021, open data table
6.6 CED use by mental health and ethnicity
Officers record whether they perceive the person involved to have a mental health condition. Often it is not possible for the officer using force to report whether the person has a self-reported mental health condition as use of force reports are usually recorded independently of other police recording systems.
People perceived as having a mental health condition (15% of all use of force incidents) were involved in proportionally more incidents involving the use of CED (18%) and incidents where the CED was discharged (24%).
In incidents involving someone with a perceived mental health condition, CED use was similar across ethnicities: 8% for people perceived as Black or Mixed ethnicity and 7% for those perceived as White, Asian, or Other ethnicity.
CED data quality
The method of recording police use of CEDs changed in 2017-18, making this collection year the fourth in the series. Wider incident details such as the reasons for using force, impact factors, and outcomes were missing from 36 CED incidents. Despite the change in collection methods, the total figure for CED use is considered to be an accurate reflection of CED use by the 43 police forces in England and Wales in the year ending March 2021.
7. Incident location
7.1 Key results
In the year ending March 2021:
-
over half (55%) of recorded incidents included a public location (311,360 incidents)
-
the most common recorded incident location was a street or highway, which was recorded in 46% of incidents (258,826 incidents)
Figure 15: Number of times location type was reported, England and Wales, year ending March 2021
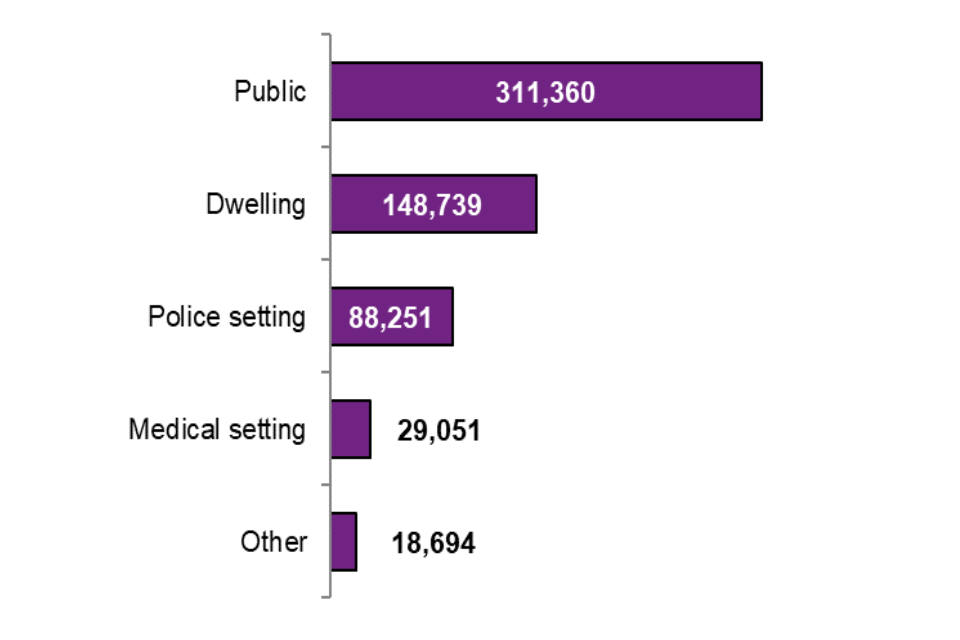
Source: Home Office, Police use of force statistics, England and Wales, April 2020 to March 2021, Table 9.
Notes: For ease of viewing, tactics and locations have been grouped; see the data tables for groupings.
Restraint tactics were the most commonly used tactics across all location types, followed by unarmed skills. A street or highway (i.e. a public setting) was the most commonly reported location for the use of less lethal weapons (46%) and firearms (57%).
Data quality
A use of force incident may involve multiple locations (e.g. an incident could begin in a dwelling but finish on the street outside if the person attempted to escape). However, police forces’ recording systems may not allow for multiple locations to be recorded for one incident, so the primary location may be given instead.
8. Injuries
Officers record details of their own injuries from the use of force incident and those sustained by the person involved, where these injuries were as a result of the use of force.
Data quality
Some data on injuries and fatalities were inconsistent. For example, some officers reported ‘no injury’ sustained due to their use of force, but then also included details of a ‘minor’ injury. This could be because officers recorded injuries (to themselves or to the person involved) even when these did not occur as a result of the use of force incident. The same may be true for the reporting of hospitalisations and fatalities.
Injury level is recorded in the following categories:
Minor
An injury which may require some simple first aid but does not meet the definition of severe.
Severe
A fracture, deep cut, deep laceration or an injury causing damage to an internal organ or the impairment of any bodily function. In addition, an injury which may, after initial assessment at hospital, require formal admission to hospital.
Death
Death of the person involved in the incident where there is a suspected causal link between police contact and the death.
8.1 Officer injuries
Of the 562,280 use of force incidents recorded, 22,421 (4%) involved the officer sustaining an injury during the use of force incident, either through an intentional or unintentional assault. Of the 22,421:
-
94% (21,157) reported minor injuries
-
2% (374) reported severe injuries
-
4% (890) had no injury level recorded
A full breakdown is provided in data table 10.
8.2 Person injuries
Of the 562,280 incidents recorded, 5% (29,000) reported that the person involved was injured as a result of police use of force. Of the 29,000:
-
93% (26,874) reported minor injuries
-
2% (566) reported severe injuries
-
5% (1,552) had no injury level recorded
Of the 29,000 incidents where the person was reported as injured as a result of the use of force, 2,788 (10%) included hospitalisation as an outcome.
In total, there were 20,553 incidents with an outcome of ‘hospitalisation’. Of these, there were 16,210 incidents where the officer reported that the person did not sustain an injury as a result of the officer’s use of force. Of the remaining hospitalisations, officers reported 1,555 as unknown if the person was injured as a result of force used.
Officers should only report a hospitalisation outcome where this was caused by their use of force, so it is likely that these include hospitalisations for other reasons, for example the person may have sustained an injury through another cause, or may have required medical attention for substances used before the incident, or for any other pre-existing medical condition.
In 5% (25,535) of incidents, the officer recorded that they did not know if the person sustained an injury due to their use of force or it was not reported. Data are provided in data table 11.
There were 8 reports of a death of an individual resulting from an injury relating to police use of force in the year ending March 2021. See data table 11 for further information.
There are several limitations associated with the quality of the data on injuries and deaths recorded within the police use of force data. See the user guide for more information.
Under the Police Reform Act 2002, police forces in England and Wales have a statutory duty to refer all incidents involving a death or serious injury to the Independent Office for Police Conduct (IOPC) for consideration. The IOPC will determine whether it is necessary to investigate and who should carry out the investigation. Some matters are investigated by police forces and some are investigated by the IOPC. The IOPC National Statistics report on deaths during or following police contact provides more comprehensive information.
9. Future developments, feedback and enquiries
Future developments
Planned developments to the police use of force statistics include:
- introducing a time series
To date, year-on-year comparisons have not been routinely published in this statistical series due to the evolving nature of this dataset and improvements in recording of use of force incidents. Year ending March 2022 data will be published alongside year ending March 2021 data and some comparisons of key figures will be included in the publication. It is expected that any changes to the volume of incidents will be in part a reflection of a continuation of improved recording, so trends will be interpreted with caution.
- consideration of using an alternative denominator to calculate rates of use of force and CED use
In recognition of the limitations of using the traditional resident-based population of England and Wales as the denominator in calculating relative rates of use of force and CED use, the use of alternative populations that better reflect the population that police come in to contact with to calculate relative rates will be considered. This methodology would build on research on a Risk Adjusted Disparity Index and experimental statistics exploring an alternative approach to calculating stop and search rates in the Metropolitan Police Force Area. Whilst police use of force incidents differ in their nature from stop and search incidents, adopting a methodology that uses an alternative population would add useful context to the rate statistics.
Statistical or public enquiries
We are always looking to improve the accessibility of our documents. If you find any problems, or have any feedback, relating to accessibility, or general questions regarding this publication, please email us PublicOrderStatistics@homeoffice.gov.uk.
Media enquiries via Home Office news desk
Journalists with enquiries can call the Home Office news desk on 0300 123 3535. The desk operates from 7am to 8pm, Monday to Friday.