Income Dynamics: Income movements and the persistence of low income, 2010 to 2022
Published 21 March 2024

© Crown copyright 2024
This publication is licensed under the terms of the Open Government Licence v3.0 except where otherwise stated. To view this licence, visit nationalarchives.gov.uk/doc/open-government-licence/version/3 or write to the Information Policy Team, The National Archives, Kew, London TW9 4DU, or email: psi@nationalarchives.gov.uk.
Where we have identified any third party copyright information you will need to obtain permission from the copyright holders concerned.
This publication is available at https://www.gov.uk/government/statistics/income-dynamics-2010-to-2022/income-dynamics-income-movements-and-the-persistence-of-low-income-2010-to-2022
1. Main stories
The main stories are:
- from 2018 and 2019 to 2021 and 2022, 9% of all individuals were in persistent low income before housing costs (BHC), and 12% after housing costs (AHC). These rates were the same in the previous four-wave period
- before housing costs, pensioners (11%) and children (10%) were more likely to be in persistent low income than working-age adults (7%)
- after housing costs, children had higher rates of persistent low income AHC (17%) than working-age adults (11%) and pensioners (10%)
- individuals at the top and bottom of the income distribution in 2015 and 2016 were those most likely to be at the top and bottom of the distribution in 2021 and 2022
- similar numbers of individuals moved into and out of low income over the most recent two-wave period. Pensioners were less likely to enter into and exit from low income than children and working-age adults
- changes in earnings and benefit income, and in the amount of paid work in a household, were closely linked to low income entries and exits.
2. What you need to know
This is the eighth annual Income Dynamics (ID) publication. It provides information on rates of persistent low income for children, working-age adults, and pensioners in the UK. Individuals are in persistent low income if they are in relative low income for at least three out of four consecutive annual interviews. ID meets DWP’s statutory obligation to publish a measure of persistent low income for children, as set out under Section 4 of the Welfare Reform and Work Act 2016.
ID also includes analysis of movements across the income distribution, including low income entry and exit rates, and statistics on how various socio-economic factors are linked to low income entry and exit.
Income measures
ID uses a disposable household income measure, adjusted for household size and composition, to calculate a proxy measure of income available to each individual in the sample. The statistical adjustments made to ID income measures are in line with international best practice, and allow us to make comparisons over time and across household compositions on a consistent basis. They do mean however, that that the measures may not always be directly relatable to the amounts understood by individuals on a day-to-day basis.
An individual is said to be in relative low income if their household equivalised income is below 60% of median income. ID statistics are routinely reported both before and after housing costs.
Survey data
ID estimates are based on Understanding Society (USoc), a longitudinal survey run by the University of Essex, which follows sampled individuals over time. It has a two-year survey period (“wave”) based upon calendar years, with individuals interviewed once a year. The most recent wave is Wave 13, covering the calendar years 2021 and 2022.
The Wave 13 longitudinal sample included over 25,000 individuals. For the purposes of the longitudinal analysis presented here, individuals are classified according to characteristics reported at the first wave of any analytical period. For example, where analysis covers the period from 2018 and 2019 to 2021 and 2022, working-age adults are adults who were below State Pension age and over 16, not in further education and not classed as a dependent child, when they were interviewed for the 2018 and 2019 wave. Similarly, other breakdowns such as employment status or tenure also reflect individual status at the start of any longitudinal period.
Use of survey data means that the statistics in this report are estimates, and as such are subject to a degree of uncertainty. Care should therefore be taken in interpreting apparent change over time or differences between sub-groups, which may reflect sampling error rather than real differences. This holds particularly true over the short term, for groups with smaller sample sizes, and where percentage point differences are small.
Percentages are rounded to the nearest percentage point independently. Where categories are summed for descriptive purposes, rounding is implemented after summing.
Revisions to the data
This ID publication contains longitudinal statistics covering the period from 2010 to 2022 (data from Waves 2 to 13 of USoc). Each annual USoc data release provides data for all previously released waves of the survey, and will contain revisions. Revisions are made to improve data quality. For this reason, it is always best to refer to the most recent ID publication. Note also that statistics derived for a certain time period in this ID publication may therefore be different to those derived for the same time period in a previous ID publication. Please refer to the USoc user guide and specific information published on revisions for more information.
Changes for ID 2010 to 2022
This publication contains no new developments.
The coronavirus (COVID-19) pandemic
Given the longitudinal nature of this analysis, the coronavirus pandemic and associated policies continue to be relevant to ID statistics. The pandemic affected USoc fieldwork and data collection in Wave 13, which ran from January 2021 to December 2022, while policy changes affected household employment and income.
Three of the four most recent waves, upon which persistent low income statistics are based, were affected by the pandemic in some way, as were both of the waves considered for low income entry and exit analysis. An assessment of the implications for ID statistics can be found in Section 11.
Data tables
Data tables have been published alongside this release. Relevant table references are provided within the text. Please also refer to the ID Tables Guide for details of the statistics included in the various ID tables files.
Further information
For further information on the way in which ID statistics are produced, please refer to Section 12 below, the ID Quick Guide, and the Background information and methodology report which are published alongside this report.
3. An overview of persistent low income
From 2018 and 2019 to 2021 and 2022, the rate of persistent low income for all individuals was 9% before housing costs (BHC) and 12% after housing costs (AHC). These rates have changed very little over time and were unchanged on the previous four-wave period.
Persistent low income is considered separately for three main population groups: children, working-age adults, and pensioners. Over time, the rate for children (AHC) has been consistently higher than all other rates. The rate for working age adults (BHC) has been consistently lower than all other rates. There were only slight changes in these statistics compared to the previous four-wave period.
Figure 1. Persistent low income for children, working-age adults, and pensioners: the most recent four-wave period compared to the previous four-wave period (BHC and AHC)

Source: Table 1, Persistent low income trends.
The lowest rate of persistent low income was for working-age adults BHC, at 7%. Working-age adults have had the lowest rate of BHC persistent low income over time. Although their rate of persistent low income BHC was 8% in the previous four-wave period, it was 7% in all earlier periods. BHC rates for children and pensioners have been similar over time and were 10% and 11% respectively in the most recent four-wave period. While the BHC rate for children was the same as it was in the previous four-wave period, the BHC rate for pensioners had increased from 10%.
The highest rate of persistent low income was for children AHC (17%). This had fallen from 18% in the previous four-wave period. The persistent low income rate for children AHC has always been higher than the AHC rate for working-age adults and pensioners, although there is some indication that it may be on a gradual downward trend, as it has fallen from 19% in the four-wave period 2015 and 2016 to 2018 and 2019. The AHC rate for working-age adults was 11%, and for pensioners it was 10%. Both these rates were unchanged on the previous four-wave period and have varied very little over time.
Rates of persistent low income varied across the countries and regions of the UK
Rates of persistent low income for all individuals were slightly higher in England and Wales than in Scotland and Northern Ireland. This was true both BHC and AHC.
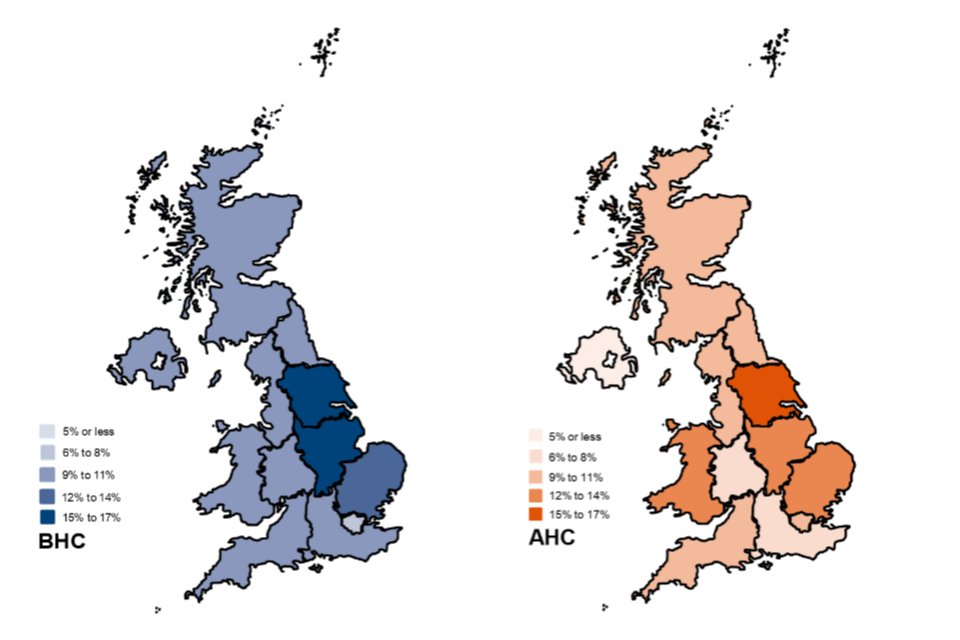
Figure 2. Persistent low income across the UK (BHC and AHC)
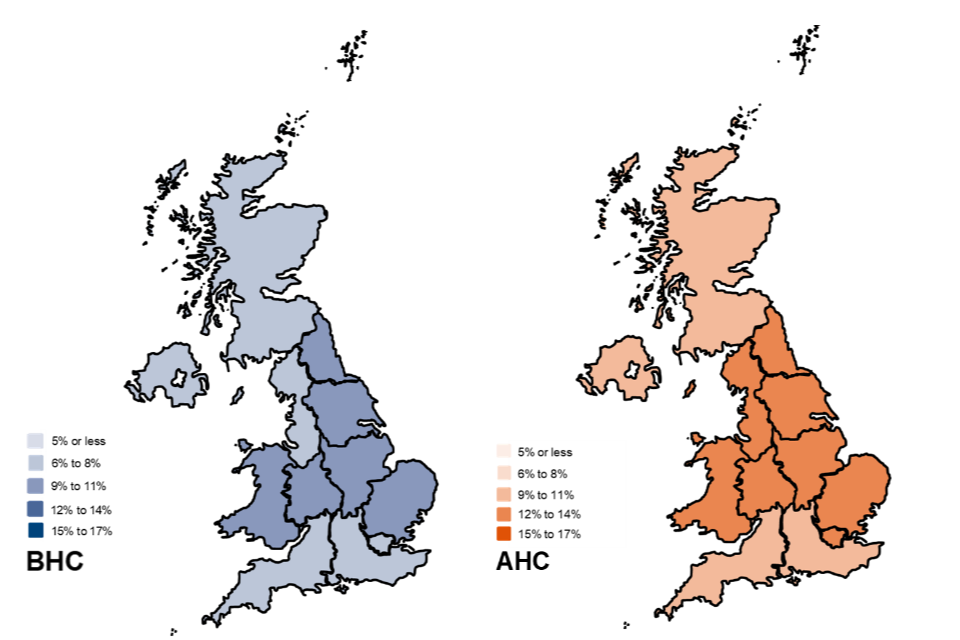
Source: Tables 2.2p and 2.8p, Individuals in persistent low income
The rate of persistent low income BHC varied slightly across the four countries of the United Kingdom: it was 8% in Scotland and Northern Ireland, and 9% in England and Wales.
Across the English regions, Yorkshire and the Humber and the East Midlands (both 11%), followed by the North East and West Midlands (both 10%) had the highest rates of persistent low income BHC. The South West and London had the lowest rates, both at 7%. This pattern reflected the longer-term trend of higher rates of persistent low income BHC in the north of England and the midlands, and lower rates in the south and east of England.
When looking at persistent low income AHC by country, England and Wales (both 12%) had higher rates than Northern Ireland and Scotland (both at 10%).
The highest rates of persistent low income AHC within England were in London and in Yorkshire and the Humber (both 14%). While London has, over time, typically had the highest rate of AHC persistent low income, reflecting the cost of housing in the capital, this rate has fallen since the four-wave period 2016 and 2017 to 2019 and 2020, when it stood at 17%. It is unclear if this relatively low rate will be sustained. The East Midlands and the West Midlands also had relatively high rates of persistent low income AHC (13%), while the lowest AHC rate was in the South West, at 9%.
Families headed by couples had lower rates of persistent low income than those headed by single adults
Families headed by a couple, whether with or without children, had lower rates of persistent low income, both BHC and AHC. Single adults with children were much more likely than all other groups to be in persistent low income AHC.
Figure 3. Persistent low income by family type (BHC and AHC)

Source: Tables 2.1p and 2.7p, Individuals in persistent low income
Couples without children had the lowest rate of persistent low income BHC (4%), while couples with children and pensioner couples had slightly higher rates (8% and 7% respectively). Single female pensioners had the highest rates of persistent low income BHC (18%), followed by single adults with children (16%) and single male pensioners (15%). Single adults with children and single female pensioners have consistently had the highest rates of persistent low income BHC.
Pensioner couples and couples without children were least likely to be in persistent low income AHC (6% and 5%, respectively). The AHC income distribution resulted in greater rates of persistent low income for families with children compared to BHC rates: 12% for couples with children, and 30% for single adults with children. The difference in the rate of persistent low income between single female pensioners and single male pensioners persisted when housing costs were considered, with AHC rates of 17% and 14% respectively.
Individuals with a white head of household were less likely to be in persistent low income than individuals from other ethnic groups
The rate of persistent low income BHC and AHC was lowest among individuals with a White head of household. Individuals with an Asian/ Asian British head of household were most likely to be in persistent low income BHC. The rate of persistent low income AHC was similar for those with a Black/ African/ Caribbean/ Black British head of household and those with an Asian/ Asian British head of household.
Figure 4. Persistent low income by ethnicity of head of household (BHC and AHC)
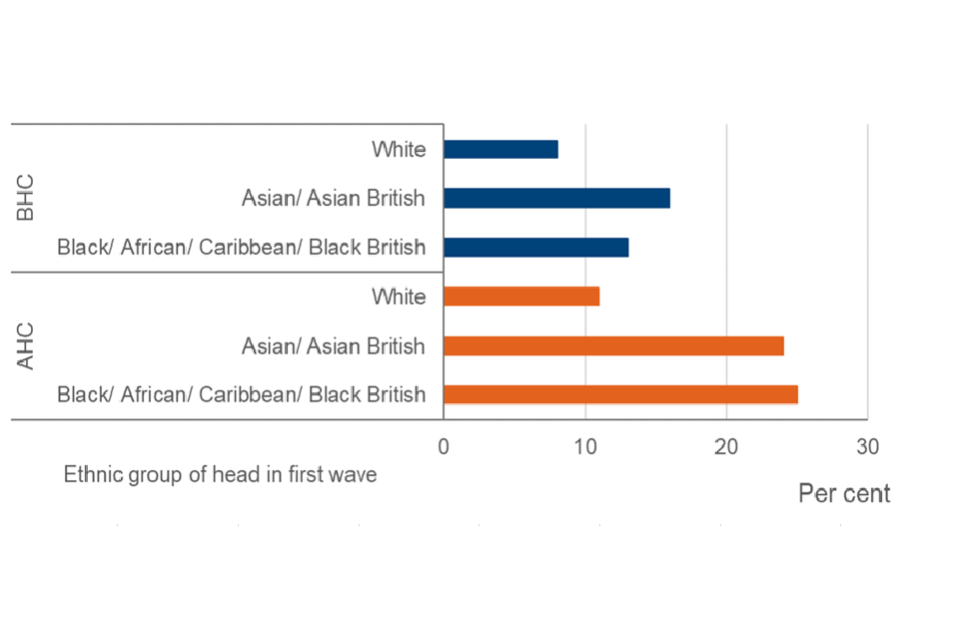
Source: Tables 2.1p and 2.7p, Individuals in persistent low income
Please note: the four-wave sample sizes of individuals with a head of household of Mixed ethnicity or from an Other ethnic group are relatively small. This means that statistics based on these sub-groups can fluctuate. They are included in the tables file, but not discussed here.
The rate of persistent low income for individuals with a White head of household was 8% BHC, while it was 13% for those with a Black/ African/ Caribbean/ Black British head of household, and 16% for those with an Asian/ Asian British head of household.
The rate of persistent low income AHC for individuals with a Black/ African/ Caribbean/ Black British head of household was 25%, considerably higher than their BHC rate, indicating that housing costs are more significant in terms of their effect on income for these individuals. The persistent low income rate AHC for individuals with an Asian/ Asian British head of household was 24%, and for households with a White head of household it was 11%.
Since the first four-wave period of our analysis (2010 and 2011 to 2013 and 2014), those with a White head of household have had much lower rates of persistent low income (both BHC and AHC) than those with a head of household who was either Black/ African/ Caribbean/ Black British, or Asian/ Asian British.
See Tables 2.1p and 2.7p in the Individuals in persistent low income file for more information.
Individuals living in the social rented sector were most likely to be in persistent low income, both BHC and AHC
Rates of persistent low income were highest for those living in the social rented sector and lowest for those in homes which were being bought with a mortgage. This was true both before and after housing costs.
Figure 5. Persistent low income by tenure (BHC and AHC)

Source: Tables 2.2p and 2.8p, Individuals in persistent low income
Among tenure types, the highest rate of persistent low income BHC was in the social rented sector (15%). This was followed by the private rented sector (11%), where the rate was slightly higher than that of individuals who owned their home outright (10%). Those living in households which were buying their homes with a mortgage were much less likely to be in persistent low income (4%).
After housing costs were considered, individuals who were renting were much more likely to be in persistent low income (AHC rates were 24% and 29% in the private and social rented sector respectively). These relatively high rates meant that renters were over-represented among those in persistent low income: while they were 31% of the sample population, they accounted for 48% of those in persistent low income BHC, and 69% of those in persistent low income AHC.
Individuals in homes that were being bought with a mortgage were only slightly more likely to be in persistent low income AHC than they were BHC, at 5%. Those living in homes which were owned outright were the only group who were less likely to be in persistent low income AHC (6%) than they were BHC, reflecting the lower housing costs associated with this tenure.
See Tables 2.2p, 2.8p, 2.2c, 2.8c and 2.14c in the Individuals in persistent low income file for more information.
4. Children in persistent low income
Housing costs have a notable effect on rates of persistent low income for children: while 10% of children were in persistent low income BHC, this rose to 17% of children AHC.
Persistent low income rates varied among children across countries and regions of the UK
Rates of persistent low income among children differed across the countries and regions of the UK. The effect of housing costs on rates of persistent low income for children meant that for all areas, AHC rates were greater than BHC rates.
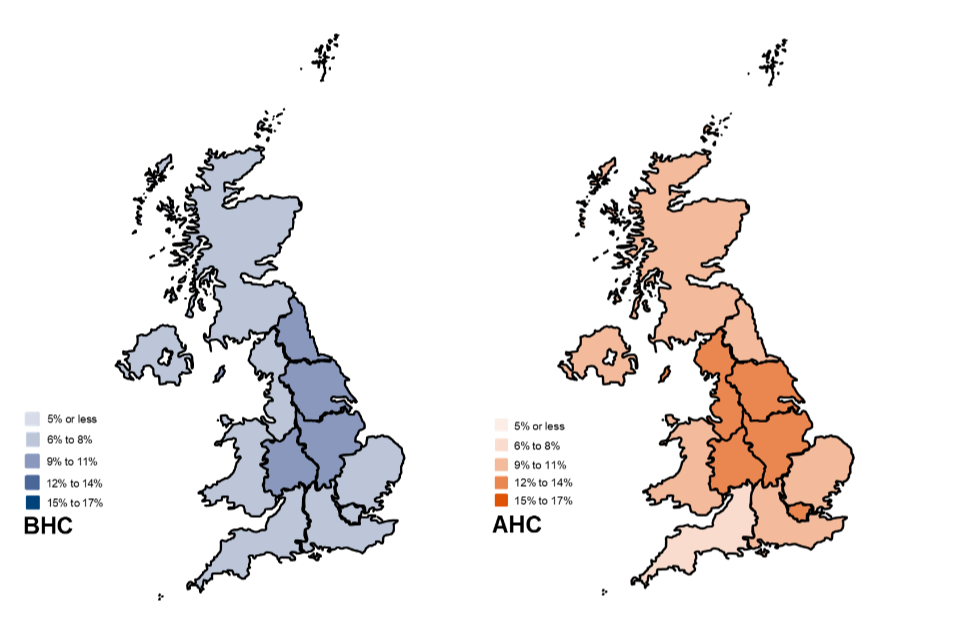
Figure 6. Persistent low income among children, by country and region (BHC and AHC)

Source: Tables 3.2p and 3.8p, Children in persistent low income
Across the countries of the UK, children in Wales were most likely to be in persistent low income BHC (14%), followed by children in England (10%), Scotland (8%) and Northern Ireland (7%). AHC rates were higher than BHC rates for all four countries. Wales and England had higher rates of persistent low income AHC for children (18% and 17% respectively), while rates in Scotland and Northern Ireland were lower, at 14% and 13% respectively. The trend in rates of persistent low income for children across countries of the UK is unclear and shows some instability, both BHC and AHC. While persistent low income levels are affected by various factors, including rates of entry and exit from low income within each four-wave period, declining sample sizes are likely to be contributing to this variability.
Within England, the South West and North West (both 8%) had the lowest rates of persistent low income BHC for children, while the highest rates were seen in the East Midlands (14%), and the North East and East (both 12%). Yorkshire and the Humber had an unusually low rate of BHC persistent low income compared to previous four-wave periods, at 9%. The reason for this is unclear. Housing costs have a notable effect on rates of persistent low income for children, and for all regions, rates of persistent low income AHC were higher than their BHC rates. The difference was most marked in London, where the AHC rate of persistent low income was highest, at 21%, although this rate has fallen by several percentage points over the past two four-wave periods. Three other regions had relatively high rates of persistent low income AHC: the East (19%), and Yorkshire and the Humber and the West Midlands (both 18%). Children in the South West were least likely to be in persistent low income AHC (14%). This region has had relatively low AHC rates for children over time.
As with the countries of the UK, the trend in rates of persistent low income has also been unclear across the English regions, and some of the variation across more recent four-wave periods may be linked to decreasing sample sizes.
Children in workless families were more likely to be in persistent low income
Rates of persistent low income among children were strongly linked to family work status, with those in workless families experiencing the highest risk. Children in families with some work fared better than children in workless families, but worse than those in families where all adults were in work.
Figure 7. Persistent low income among children, by family work status (BHC and AHC)

Source: Tables 3.1p and 3.7p, Children in persistent low income
Children who lived in workless families were much more likely to be in persistent low income both BHC (33%) and AHC (50%) than those in families where all adults were in work (4% BHC and 8% AHC).
Children who lived in families where at least one adult was in work but not all were less likely to be in persistent low income than those in workless families, but more likely than those where all adults were in work, with rates of 20% BHC and 32% AHC. Since the four-wave period starting in 2010 and 2011, the likelihood of being in persistent low income for these children has steadily increased, from 14% to 20% BHC, and from 23% to 32% AHC.
Over the same period, the rate of persistent low income for children in families where all adults were in work increased slightly, from 2% to 4% BHC, and from 6% to 8% AHC. The rate among workless families in the most recent four-wave period was slightly lower than it was in the four-wave period commencing 2010 and 2011, when rates were 35% BHC and 55% AHC.
Children in social rented accommodation were more likely to be in persistent low income than those in other tenures
Children living in social rented accommodation were most likely to be in persistent low income both before and after housing costs. Housing costs had the largest impact on rates of persistent low income for children living in the private rented sector. This is likely to reflect both the income levels and housing costs of these households relative to those in other tenures.
Figure 8. Persistent low income among children, by tenure (BHC and AHC)

Source: Tables 3.2p and 3.8p, Children in persistent low income
Children living in social rented homes were more likely to be in persistent low income BHC than children in other tenures: 20% of children living in the social rented sector were in persistent low income, compared to 13% of children living both in privately rented homes and in owner-occupied homes. Children living in homes bought with a mortgage were least likely to be in persistent low income BHC (4%).
After housing costs were considered, many more children living in the social rented sector were in persistent low income (36%). While rates of persistent low income BHC were the same for children in privately rented and owner-occupied homes, the percentage of children in persistent low income in privately rented homes was 30% AHC, much higher than it was for children in owner-occupied homes (11% AHC). Housing costs only slightly increased the rate of persistent low income among children in homes being bought with a mortgage (6% AHC).
Children in lone parent families were more likely to be in persistent low income than children in families headed by a couple
Children living in lone parent families were more likely to be in persistent low income than those living in families headed by a couple, and the difference between these two groups was greater AHC than BHC.
Figure 9. Persistent low income among children, by family status (BHC and AHC)
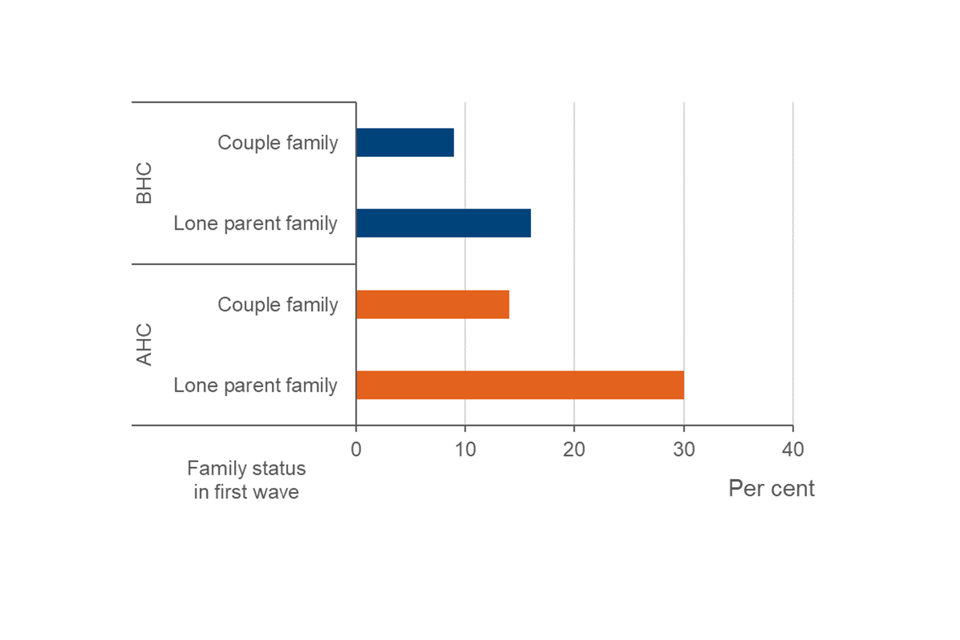
Source: Tables 3.1p and 3.7p, Children in persistent low income
Children living in a family headed by a couple were much less likely to be in persistent low income than those living in a lone parent family. This was true both BHC, where 9% of children living in a couple family were in persistent low income compared to 16% of children in lone parent families, and AHC, where the difference between the two groups was greater: rates of persistent low income were 14% and 30% respectively.
Children in families with three or more children were more likely to be in persistent low income than those in families with fewer children
Rates of persistent low income were similar for children in families with one or two children. In contrast, children from larger families of three or more children faced higher rates.
Figure 10. Persistent low income among children, by family size (BHC and AHC)

Source: Tables 3.1p and 3.7p, Children in persistent low income
Children in families with one or two children had similar rates of persistent low income, both BHC (8% and 7% respectively), and AHC (14% and 12% respectively). Children in families with three or more children were much more likely to be living in persistent low income (17% BHC and 28% AHC).
5. Working-age adults in persistent low income
Between the period 2018 and 2019 to 2021 and 2022, the rate of persistent low income for working-age adults was 7% BHC and 11% AHC. These rates have been stable over time.
Rates of persistent low income among working-age adults across countries and regions of the UK
Rates of persistent low income for working-age adults, both before and after housing costs, were similar across the UK countries. Within England, BHC rates were higher in the West and East Midlands, Yorkshire and the Humber, and the North East, while London, the East and the South West had lower rates. Working-age adults in all countries and regions were more likely to be in persistent low income after housing costs.
Figure 11. Persistent low income among working-age adults, by region and country (BHC and AHC)
Source: Tables 4.2p and 4.8p, Working-age adults in persistent low income
The rate of persistent low income BHC for working-age adults was similar for the four countries of the UK: 8% in England and in Wales, and 7% in Scotland and Northern Ireland. Within the English regions, working-age adults in the West Midlands (10%), East Midlands, Yorkshire and the Humber and the North East (all 9%) were most likely to be in persistent low income BHC. Lower rates of persistent low income BHC were seen in London, the East, and the South West (all three at 6%).
Across the four countries of the UK, rates of AHC persistent low income for working-age adults were slightly lower in Scotland at 9%, and were 11% for England, Wales and Northern Ireland. Working-age adults in all countries and regions were more likely to be in persistent low income AHC than BHC. Within England, the regional pattern of persistent low income AHC for working-age adults was similar to the BHC pattern, with the exception of London. Here taking housing costs into account resulted in the second highest rate of persistent low income (13%), after the West Midlands (14%). The lowest rates of persistent low income for working-age adults were in the South West (8%) and South East (9%).
Working-age adults in workless families were more likely to be in persistent low income than those in families where someone was in work
Levels of persistent low income among working-age adults reflected family employment status, with those living in families where all adults were in work facing the lowest risk, and those in workless families facing the highest risk.
Figure 12. Persistent low income among working-age adults, by employment status of family (BHC and AHC)

Source: Tables 4.1p and 4.7p, Working-age adults in persistent low income
The majority (70%) of working-age adults in the sample were living in families where all adults were in work (Table 4.13c). Rates of persistent low income for these adults were low, at 4% BHC and 6% AHC. In contrast, working-age adults in workless families had much higher rates of persistent low income: 20% BHC and 26% AHC. Persistent low income rates for working-age adults in families where at least one adult was in work but not all lay between these two groups, at 11% BHC and 16% AHC.
Rates of persistent low income BHC among working-age adults in families where all adults were in work or at least one adult was in work have gradually increased since the four-wave period commencing 2010 and 2011. AHC rates for these two groups have changed less. At the same time, there has been a decrease in the percentage of working-age adults in workless families who were in persistent low income, both BHC and AHC.
Working-age adults who rented their homes had higher rates of persistent low income, particularly AHC
Working-age adults living in the social rented sector faced the highest persistent low income rates, while those buying with a mortgage had the lowest rates. Taking housing costs into account resulted in a large increase in persistent low income among private and social renters.
Figure 13. Persistent low income among working-age adults, by tenure (BHC and AHC)

Source: Tables 4.2p and 4.8p, Working-age adults in persistent low income
Working-age adults living in the social rented sector had the highest rate of persistent low income BHC (15%). Rates for private renters and working-age adults who owned their homes outright were similar: 9% and 8% respectively. In contrast, 3% of those buying their homes with a mortgage were in persistent low income.
Taking housing costs into account resulted in large increases in the rate of persistent low income for both social and private sector renters: 26% of working-age adults in the social rented sector were in persistent low income AHC, as were 20% of those in the private rented sector. Rates of persistent low income for working-age adults who owned their homes outright or who were buying with a mortgage only slightly changed after housing costs were considered, and were 6% and 4% respectively.
Although 32% of working-age adults in our sample population lived in the private or social rented sector, they were over-represented among working-age adults in persistent low income, accounting for 53% of this group BHC, and 70% AHC (Tables 4.2c, 4.8c and 4.14c).
Working-age adults with lower levels of educational qualifications were more likely to be in persistent low income, BHC and AHC
Rates of persistent low income were highest for working-age adults with no qualifications and lowest for those with a degree or above. While this pattern has persisted since the first four-wave period starting 2010 and 2011, levels of education among working-age adults have been increasing.
Figure 14. Persistent low income among working-age adults, by education (BHC and AHC)

Source: Tables 4.2p and 4.8p, Working-age adults in persistent low income
Among working-age adults, the likelihood of being in persistent low income increased as level of educational qualification decreased. Working-age adults with no qualifications had the highest rates: 23% BHC and 33% AHC, although it is worth noting that those with no qualifications only accounted for 4% of working-age adults in our sample population (Table 4.14c). Working-age adults with at least a degree-level qualification were least likely to be in persistent low income: 3% BHC and 5% AHC. This group accounted for 33% of working-age adults in the sample population.
Except for those with no qualifications, rates of persistent low income among educational qualification bands have changed little since the four-wave period commencing 2010 and 2011. While the rate of persistent low income for those with no qualifications rose across this period, at the same time, educational levels among working-age adults increased. Within the sample upon which this analysis is based, the percentage of working-age adults with no qualifications fell from 8% to 4%, while the percentage of working-age adults with at least an A-level qualification increased from 61% in the four-wave period starting in 2010 and 2011 to 69% most recently. See Tables 4.2p, 4.8p, and 4.14c.
6. Pensioners in persistent low income
Between the period 2018 and 2019 to 2021 and 2022, the rate of persistent low income for pensioners was 11% BHC and 10% AHC. These rates have been stable over time.
Rates of persistent low income for pensioners across countries and regions of the UK
Across the four countries of the UK, there was more variation in AHC rates of persistent low income among pensioners than in BHC rates. Within England, the highest rates of persistent low income were for pensioners living in Yorkshire and the Humber and the East Midlands (both BHC and AHC).
Figure 15. Persistent low income among pensioners, by region and country (BHC and AHC)
Source: Tables 5.2p and 5.8p, Pensioners in persistent low income
Rates of persistent low income BHC for pensioners, were similar across the four countries of the UK: 11% in England, Scotland and Northern Ireland, and 9% in Wales. Rates of persistent low income AHC were more varied, from the highest rate in Wales (12%), followed by England (10%) and Scotland (9%), and the lowest rate in Northern Ireland (5%). The rate of AHC persistent low income for pensioners in Northern Ireland has been low relative to other UK countries since the four-wave period starting 2012 and 2013.
Persistent low income rates across the English regions varied considerably more for pensioners than they did for children and working-age adults, both BHC and AHC. Within England, pensioners in Yorkshire and the Humber had the highest rate of persistent low income BHC (17%), followed by pensioners in the East Midlands (15%) and East (12%). BHC rates were lowest in London (6%), the South East and the North West (both 9%).
Pensioners in Yorkshire and the Humber and in the East Midlands also had the highest rates of persistent low income AHC (15% and 14% in turn). The lowest AHC rates were seen in the West Midlands (6%) and the South East (7%).
Rates of persistent low income among pensioners varied more by tenure AHC than BHC
Pensioners living in private tenancies faced the highest persistent low income rates BHC, while those buying their homes with a mortgage had the lowest rate. Taking housing costs into account had a large effect on rates of persistent low income for pensioners who were private and social renters.
Figure 16. Persistent low income among pensioners, by tenure (BHC and AHC)

Source: Tables 5.2p and 5.8p, Pensioners in persistent low income
Pensioners who were buying their homes with a mortgage had the lowest rates of persistent low income BHC of all tenures (7%). Pensioners who owned their homes outright or who were living in the social rented sector were more likely to be in persistent low income BHC (both 11%), while those in the private rented sector had the highest risk (18%). While the rate of BHC persistent low income for pensioners in most tenures has been relatively stable over time it has, overall, increased for those pensioners living in the private rented sector, from 9% in the four-wave period commencing 2010 and 2011. It should be noted, however, that the sample size of this group is relatively small, and this may account for some recent instability in the rates for this group (Table 5.14p).
Taking housing costs into account resulted in much higher rates of persistent low income for pensioners who were renting their homes, particularly those in the private rented sector, 37% of whom were in persistent low income. Of those pensioners living in the social rented sector, 28% were in persistent low income, while pensioners buying their homes with a mortgage or who owned their homes outright had much lower AHC rates (4% and 5% respectively). As with the BHC statistics, the rate of persistent low income AHC for pensioners in the private sector has increased considerably over time, while the rate in other sectors has changed much less. Again, the relatively small sample size of this group may be linked to some of the change observed in this statistic.
This high rate of persistent low income AHC for pensioners who were renting meant that while only 19% of pensioners in our sample population lived in a rented home, they accounted for 59% of all pensioners who were in persistent low income AHC (Tables 5.8c and 5.14c).
7. Long-standing illness or disability and persistent low income
The way in which information on long-standing illness or disability was gathered by USoc changed between Waves 7 and 9. This is explained in the Background information and methodology report. The most important point to note is that for the four-wave period described here, while the presence (or not) of a limiting health problem or disability is only reported on for those individuals who said they had a long-standing illness or disability, any such limiting health problem or disability was not necessarily linked to that long-standing condition
Just over half of pensioners (55%) in our sample had a long-standing illness or disability, compared to a third (33%) of working-age adults. Pensioners who reported a long-standing illness or disability were also more likely to have a limiting health problem or disability: 37% compared to 21% of working-age adults (Tables 5.13c and 4.13c).
Rates of persistent low income for pensioners varied little according to reported health and disability
Rates of persistent low income were the same for pensioners regardless of whether they had a long-standing illness or disability or not or, for those who did have a long-standing illness or disability, whether they had a limiting or non-limiting health problem or disability: BHC rates were all 11%, and AHC rates were all 10%.
Figure 17: Persistent low income among pensioners, by health and disability (BHC and AHC)
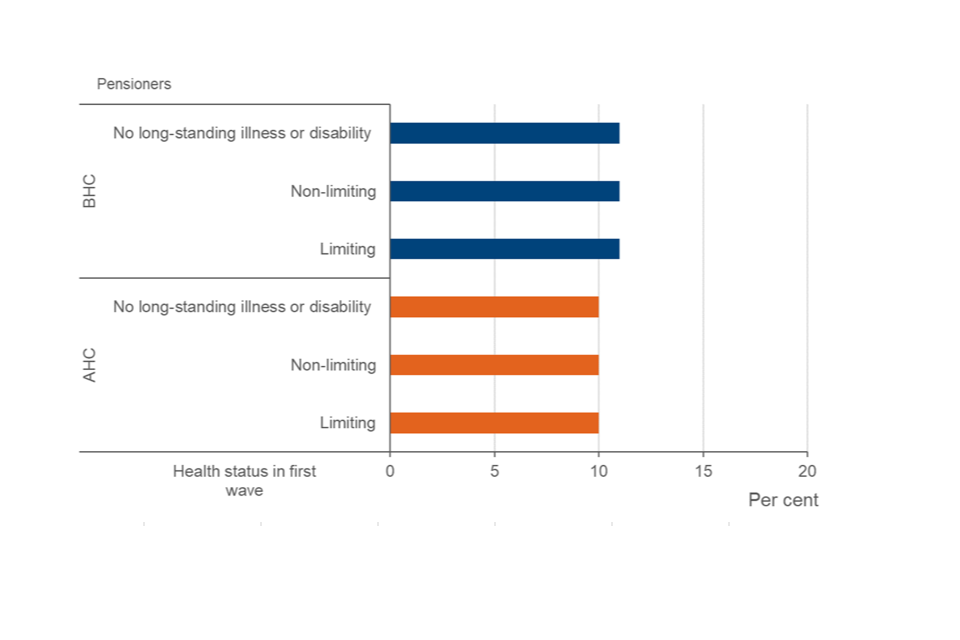
Source: Tables 5.1p and 5.7p, Pensioners in persistent low income
In contrast, rates of persistent low income varied among working-age adults according to reported health and disability
Working-age adults were more likely to be in persistent low income BHC if they had a limiting health problem or disability in addition to a long-standing illness or disability (12%), compared to if they reported a non-limiting health problem or disability in addition to a long-standing illness or disability, or no long-standing illness or disability (both 7%).
Figure 18: Persistent low income among working-age adults, by health and disability (BHC and AHC)

Source: Tables 4.1p and 4.7p, Working-age adults in persistent low income
Housing costs increased the likelihood of persistent low income for all working-age adults, but this was most pronounced for those who reported a limiting health problem or disability in addition to a long-standing illness or disability, whose risk increased to 17%. The likelihood of being in persistent low income for working-age adults with no long-standing illness or disability, or with a non-limiting health problem or disability, was 10%.
See Tables 4.1p, 4.7p, and 4.13c in the Working-age adults in persistent low income file and 5.1p, 5.7p and 5.13c in the Pensioners in persistent low income file for more information.
8. Movement between income quintiles
The data used in Income Dynamics is longitudinal, meaning that it follows individuals over time. This enables us to analyse income mobility, which we do here using income quintiles. Income quintiles divide the population, when ranked by household income, into five equally sized groups. Quintile 1 (Q1) represents the fifth of the population with the lowest household incomes. Quintile 5 (Q5) represents the fifth of the population with the highest household incomes.
The starting point for this analysis is 2015 and 2016. This allows individuals from USoc’s Immigrant and Ethnic Minority Boost (IEMB) sample to be included. For further information on the IEMB, please refer to the Background information and methodology report accompanying this publication.
Firstly, we compare where individuals were in the income distribution in 2021 and 2022 (the latest wave), to where they were in the income distribution in 2015 and 2016 (the first wave), both before and after housing costs. This does not look at where individuals were in the income distribution in the intervening years.
Individuals in the top income quintile in 2015 and 2016 were those most likely to be in the same quintile in 2021 and 2022, both BHC and AHC
Figure 19. Quintile movements from 2015 and 2016 to 2021 and 2022 (BHC)

Source: Table 6.3bhc, Movement between quintiles
Figure 20. Quintile movements from 2015 and 2016 to 2021 and 2022 (AHC)

Source: Table 6.3ahc, Movement between quintiles
Individuals in the highest income (5th) quintile in the first wave (2015 and 2016) were those most likely to be in the same income quintile in the latest wave (2021 and 2022): just over half of them (53% BHC and 54% AHC) were also in the top income quintile in the latest wave.
For individuals with the lowest incomes (1st quintile) in the first wave, 44% (BHC) and 42% (AHC) were in the same quintile in the latest wave.
A smaller percentage – around a third – of those in the 2nd to 4th quintiles in the first wave were also in the same income quintile in the latest wave, both BHC and AHC.
Individuals in the top income quintile in 2015 and 2016 were more likely than those in other income quintiles to spend time in the same quintile
Individuals who were in the top quintile in 2015 and 2016 were most likely to spend time in the same quintile in the following waves, followed by those in the bottom quintile.
Figure 21. Percentage of individuals who spent all or most of the time in the same income quintile, all waves from 2015 and 2016 to 2021 and 2022 (BHC and AHC)

Source: Tables 7.1 and 7.2, Quintile movements over time
A closer look at income mobility over the period from 2015 and 2016 to 2021 to 2022 shows that many individuals experienced movement to other income quintiles. Those in the top quintile in 2015 and 2016 however, were most likely to spend all or most intervening years in the same quintile (57% BHC and 58% AHC), followed by those in the bottom quintile (44% both BHC and AHC).
Those in the third income quintile in 2015 and 2016 were least likely to spend all or most years in that same quintile (22% both BHC and AHC), with individuals in Quintiles 2 and 4 being somewhat more likely to stay in the same income quintile as 2015 and 2016: between 27% and 30% did so, both BHC and AHC.
For more information on income mobility, please see the Movements between Quintiles file and the Quintile movements over time file.
9. Low income entries and exits
This section presents analysis on rates of entry into and exit from low income across consecutive waves. The first part of the section looks at rates of low income entry and exit for all individuals, children, working-age adults and pensioners, measured across the most recent two waves. It then discusses low income entry and exit rates by various characteristics. As with analysis of persistent low income, individuals are categorized according to their characteristics in the first wave of each longitudinal analytical period.
Analysis of entries and exits only includes ‘clear’ transitions. For an entry or exit to count, household incomes must cross the 60 per cent of median income threshold and be at least 10 per cent higher or lower than the threshold in the following wave. As individuals live in households and we assume that all members of the household benefit equally from the household’s income, they will be affected by changes at the household level.
The number of individuals who entered into and exited from low income across the period 2020 and 2021 to 2021 and 2022 were similar, both BHC and AHC. Rates of low income entry are lower than rates of low income exit, because they are based upon different sized populations, with the number not in low income in 2020 and 2021 and therefore eligible for a low income entry being much larger than the number who were in low income in 2020 and 2021, and therefore eligible for a low income exit.
Pensioners were less likely to enter low income than children and working-age adults
Over the period from 2020 and 2021 to 2021 and 2022, the rate of entry into low income for all individuals was 8% BHC and 9% AHC.
Pensioners had lower rates of entry into low income than children and working-age adults, BHC and AHC.
Figure 22: Rates of entry into low income from 2020 and 2021 to 2021 and 2022 (BHC and AHC)

Source: Table 8.1 and 8.9, Low income entry and exit rates
Over the period 2020 and 2021 to 2021 and 2022, pensioners had the lowest rates of entry into low income (6% both BHC and AHC). Children had the highest rates of entry (9% BHC and 11% AHC), followed by working-age adults (8% BHC and 10% AHC).
Rates of entry into low income have been increasing gradually over time, both BHC and AHC. The low income entry rate for all individuals increased from 6% BHC in the first reporting period (2010 and 2011 to 2011 and 2012), to 8% in the most recent two waves, while the AHC rate increased from 7% to 9%. This increase has been mainly among working-age adults and children.
Pensioners were less likely to exit from low income than children and working-age adults
As noted above, rates of exit from low income are higher than rates of entry even though roughly equivalent numbers of individuals enter and exit low income across each two-wave period.
Over the most recent two waves, 38% of all individuals who were in BHC low income in the first wave, exited from it, as did 36% of all individuals who were in AHC low income in the first wave.
Both before and after housing costs, pensioners had the lowest rates of exiting low income. Working-age adults had higher rates of exit than children did, both BHC and AHC.
Figure 23: Rates of exit from low income from 2020 and 2021 to 2021 and 2022 (BHC and AHC)

Source: Table 8.1 and 8.9, Low income entry and exit rates
Pensioners had the lowest rates of exit from low income over the most recent two-wave period (29% BHC and 30% AHC). Pensioners are likely to have more stable income and housing costs than working-age adults and children, and this is reflected in lower exit rates for this group. Working-age adults had higher rates of exit from low income than children did: 41% BHC and 39% AHC, compared to 39% BHC and 34% AHC for children.
Rates of exit from low income fell for all three groups compared to the previous two-wave period (2019 and 2020 to 2020 and 2021), both BHC and AHC. In part this is likely to reflect a change in income measurement, with the inclusion of income from Student and/or Tuition Fee Loans for the first time in 2020 and 2021. This change was associated with a higher number of low income exits over the previous two-wave period. More information on this can be found in the Background information and methodology note.
Low income exit rates have, overall, shown a less clear trend than entry rates. While the BHC rate of exit for all individuals was 38% in the most recent two waves, it was also 38% in the first three two-wave periods commencing in 2010 and 2011. The AHC rate of exit for all individuals was 36% in the most recent period, and while it was similar (35%) in the first two-wave period commencing 2010 and 2011, it has fluctuated slightly over time since then.
See Tables 8.1 and 8.9 in the Low income entry and exit rates file for headline rates of low income entry and exit.
Rates of low income entry and exit associated with other characteristics
ID also produces entry and exit statistics for other sub-groups using rates averaged over three two-wave periods: the following findings are for the period from 2018 and 2019 to 2021 and 2022. As is the case elsewhere, individuals are classified according to their status in the first of each of the two-wave periods.
Ethnicity
Entry into low income, by ethnicity
Individuals with a head of household who was White or of Mixed/ multiple ethnic groups were least likely to enter low income, both BHC (7% and 6% respectively), and AHC (8% and 10% respectively). Rates of entry into low income were higher for individuals with Asian/ Asian British heads of household (13% BHC and 15% AHC), and for individuals with Black/ African/ Caribbean/ Black British heads of household (10% BHC and 16% AHC). Individuals with a head of household from the Other ethnic group category had the highest rate of entry into low income BHC (14%), but an AHC rate of 11%.
Rates of low income entry for those with a White or Asian/Asian British head of household have been on a gradual upward trend over time, both BHC and AHC, and both groups were slightly more likely to enter low income than they were in the previous period, both BHC and AHC. The rate of low income entry for individuals with a Black/ African/ Caribbean/ Black British head of household has been stable over time BHC, while the AHC rate has varied. BHC and AHC rates of low income entry increased slightly for these individuals compared to the previous period.
Exits from low income, by ethnicity
Sample sizes are relatively small when considering the rate of low income exit for individuals with a head of household of Mixed/ multiple ethnicity or from the Other ethnic group. These rates are included in ID tables but not considered here.
The rate of low income exit BHC for individuals with a Black/ African/ Caribbean/ Black British head of household was 48% over the most recent period, a higher rate than for those in households headed by a White or by an Asian/ Asian British person (40% and 38% respectively). Individuals in households with a Black/ African/ Caribbean/ Black British head of household or with a White head of household were most likely to exit from low income AHC (37% and 36% respectively). The low income exit rate for those with an Asian/Asian British head of household was lower, at 33%.
Rates of low income exit have increased for individuals in these three groups (White, Asian/ Asian British, and Black/ African/ Caribbean/ Black British) over the past few measurement periods, both BHC and AHC. There was a particularly noticeable increase in the rate of low income exit for individuals with a Black/ African/ Caribbean/ Black British head of household in the most recent period. The reasons for this are not clear.
See Tables 8.5 and 8.13 in the Low income entry and exit rates file for rates of entry and exit for working-age adults by ethnicity.
Tenure
Entry into low income, by tenure
Rates of low income entry BHC for social and private renters were 13% and 10% respectively, while the likelihood of those buying with a mortgage entering low income was 5%, and for owner-occupiers it was 6%. While rates of entry into low income AHC were little different to BHC rates for those buying their home with a mortgage (6%) and owner-occupiers (5%), social renters and private renters had higher rates of entry into low income AHC, at 18% and 17% respectively.
These differences in rates of low income entry between tenants and homeowners have persisted over time.
Exits from low income, by tenure
Individuals buying their homes with a mortgage were most likely to exit from low income BHC (49%), followed by those renting their homes privately (45%). Owner-occupiers were least likely to exit from low income BHC (34%), which is likely to reflect the demographics associated with this tenure type i.e. older adults or pensioners. The rate of exit from low income for social renters was 38% BHC.
The picture was slightly different when considering exits from low income AHC, with social and private sector renters being least likely to exit from low income (both 31%), while owner-occupiers were more likely to exit from low income (41%) and those buying with a mortgage were most likely to (48%).
These variations in BHC and AHC exit rates by tenure have persisted over time.
See Tables 8.3 and 8.11 in the Low income entry and exit rates file for rates of entry and exit for working-age adults by tenure.
Qualifications (working-age adults only)
Entry and exit rates by educational qualification are considered for working-age adults only.
Entries into low income were highest for those with no qualifications
There was a clear pattern across low income entry rates, both BHC and AHC, which has been consistent over time: those with fewest qualifications were at greatest risk of entering low income, and this risk decreased as educational level increased. Low income entry rates BHC ranged from 5% for those with at least a degree, to 15% for those with no qualifications. AHC rates ranged from 6% for those with a degree or above, to 16% for individuals who had no educational qualifications.
The rate of low income entry has gradually increased for all individuals over time, both BHC and AHC, and this trend was observed for individuals at all educational levels.
Individuals with higher qualifications were most likely to exit from low income, both BHC and AHC
The likelihood of exiting from low income increased with the level of educational qualification, so that individuals with no qualifications had a 28% BHC exit rate over the most recent period, compared to a rate of 53% for those with a degree. AHC low income exit rates for these two groups were 26% and 48% respectively.
While low income exit rates AHC have increased gradually over time across most categories of qualification, the pattern was less clear for low income exits BHC.
See Tables 8.6 and 8.14 in the Low income entry and exit rates file for rates of entry and exit for working-age adults with other levels of qualification.
Family type
Low income entry, by family type
Pensioner couples and couples without children were least likely to enter low income, both BHC (4% and 5% respectively), and AHC (4% and 6% respectively). Rates of entry into low income were highest for single adults with children, both BHC (14%) and AHC (18%).
Single men and women had similar rates of low income entry BHC, whether they were of working-age or pensioners: rates ranged from 7% for single male pensioners to 9% for single women of working-age without children.
AHC rates of entry into low income reflected the typically lower housing costs of pensioners, and were 7% for both single male and single female pensioners. Rates of entry AHC were higher for working-age single adults, at 11% for single women without children, and 10% for single men without children.
Similar differences in rates of low income entry across different family types have been evident over time. Other than pensioner couples and single female pensioners, rates for most groups have been on an upward trend. While rates of low income entry for single male pensioners have typically been lower than for single female pensioners, it appears that the gap has been reducing both BHC and AHC.
Low income exit, by family type
Before housing costs, couples without children were most likely to exit from low income (49%). Couples with children had slightly lower BHC exit rates, at 44%, and this rate was considerably higher than the exit rate for single adults with children (35%). Single pensioners were least likely to exit from low income BHC, which partly reflects stable income levels: rates were 26% and 27% for single male and female pensioners respectively.
When looking at rates of low income exit AHC, couples without children again had the highest exit rate (48%), followed by single women and men of working age, couples with children, and pensioner couples, who all had exit rates between 37% and 39%. Single adults with children were less likely to exit from low income (27%), a rate comparable to that of single pensioners (24% for single male pensioners, and 28% for single female pensioners).
These broad differences in low income exit rates across family type have persisted over time. While individuals in most family types have experienced a relatively stable trend in low income exit rates, it is noticeable that single male pensioners have seen this rate fall over time, to its lowest point in the most recent wave, both BHC and AHC. At the same time, the rate of low income exit has risen most notably for single females without children, particularly the BHC rate.
See Tables 8.2 and 8.10 in the Low income entry and exit rates file for rates of entry and exit for working-age adults by family type.
These are just some of the sub-groups covered in the entry and exit tables. For more breakdowns see Tables 8.1 to 8.16 in the Low income entry and exit rates file.
10. Events associated with entries into and exits from low income
The associations between various household events and movements into and out of low income are explored in this section. We consider the role of changes in income components and household employment, as well as changes in household demographic composition. We also include changes in housing costs and tenure, but only in terms of their relationship with AHC low income entries and exits. For this reason and to manage the length of this section, only AHC findings over the most recent two waves are presented here. BHC tables, and data from previous waves are also available: Events associated with low income entries and exits.
For each event, we present three statistics. These are explained using the following example:
| Prevalence (%) | Entry rate (%) | Share of entries (%) | |
|---|---|---|---|
| Fall in earnings | 13 | 26 | 38 |
Source: Table 9.1n, Events associated with low income entries and exits
Prevalence – this tells us how common an event is among the population at risk of either entering or exiting low income. When considering the relationship between a fall in earnings and low income entry, the prevalence statistic tells us that 13% of those who were not in low income in 2020 and 2021 experienced a fall in earnings between then and 2021 and 2022.
Entry or exit rate if experienced event - in the above example, 26% of those who were not in low income in 2020 and 2021 and who experienced a decrease in earnings, entered low income in 2021 and 2022.
Share of entries – this tells us what percentage of all those who entered or exited low income experienced each event. In the above example, 38% of all those who entered low income across the two most recent waves, experienced a fall in earnings.
In defining the events in this analysis, attempts have been made to limit the effects of other important factors which might have a bearing on the event. For example, when looking at a change in earnings, there must be no change in the number of workers in the household. Please note that not all such factors can be controlled for.
Events associated with entering low income: from 2020 and 2021 to 2021 and 2022, AHC: selected findings [footnote 1]
| Prevalence (%) | Entry rate (%) | Share of entries (%)[footnote 2] | |
|---|---|---|---|
| Fall in earnings [footnote 3] | 13 | 26 | 38 |
| Fall in benefit income [footnote 3] | 18 | 16 | 33 |
| Fall in the number of workers in household – same household size | 10 | 13 | 14 |
| Fall in the number of full-time workers in household – same household size | 12 | 20 | 26 |
| Change from full-time to part-time work for at least one household member - same household size | 6 | 23 | 16 |
| Change from working to workless household - same household size | 3 | 16 | 6 |
| Change in household type | 15 | 13 | 22 |
| Becoming a lone parent | 1 | 58 | 3 |
| Change from living as a couple to single person status [footnote 4] | 1 | 10 | 1 |
| Increase in number of children | 3 | 15 | 5 |
| Change in tenure | 5 | 20 | 11 |
| Rise in housing costs [footnote 3] | 9 | 9 | 9 |
A fall in earnings was closely linked to low income entry AHC. While it was experienced by 13% of individuals not in low income in the first wave (2020 and 2021), 26% of them entered low income in the second wave (2021 and 2022). When considering all people who had entered low income across this period, a considerable number of them (38%) had experienced a fall in earnings.
While a fall in benefit income was experienced by a higher percentage (18%) of those not in low income in the first wave, the risk of them entering low income AHC was lower (16%) than for those who had a fall in earnings. They also represented a slightly smaller percentage (33%) of all those who entered low income over this period.
This indicates that a decrease in earnings poses more of a risk to those not in low income in the first wave than a decrease in benefits. Over time (since 2010 and 2011 to 2011 and 2012), while the prevalence of a fall in earnings among this group has increased slightly (from 11% to 13%), the associated risk of entering low income has increased from 18% to 26%. Individuals who have experienced a fall in household earnings have also represented a rising share of all of those who enter low income across this period, from 28% to 38%. In contrast, the prevalence of a decrease in benefit income has fallen slightly, from 21% to 18%. While this has been associated with an increasing risk of entering low income AHC (rising from 12% to 16% most recently), the percentage of all individuals who enter low income who have experienced a fall in benefit income has shown no clear trend.
Findings linked to four different work-related events are presented here. They indicate that a move away from full-time work is more closely linked to low income entry than loss of work in itself. While 12% of individuals lived in households that experienced a fall in the number of full-time workers (household size remained the same), 20% of them entered low income AHC, and 26% of all low income entries experienced this event. Where at least one household member moved from full-time to part-time work, the risk of entering low income was 23%, although this event was less common (experienced by 6% of all those not in low income in the first wave).
Both these events have become more prevalent and associated with a greater risk of entering low income since the first two waves of this analysis. In the two-wave period commencing 2010 and 2011, 9% of individuals who were not in low income in the first wave lived in a household where there was a fall in the number of full-time workers. This was associated with a 13% chance of entering low income, and represented a 16% share of all low income entries. Likewise, a move from full-time to part-time work was experienced by 3% of all those not in low income in 2010 and 2011, and was associated with a 9% risk of entering low income. This event was experienced by just 4% of all low income entrants, compared to 16% in the most recent two-wave period.
Becoming a workless household was uncommon (3%) among those who were not in low income in 2020 and 2021. It was associated with a 16% risk of entering low income, and was experienced by 6% of all those who entered low income AHC in 2021 and 2022. Over time, the prevalence of this event has remained low, and it has been associated with a decreasing risk of entering low income: falling from 23% in the first two-wave period (2010 and 2011 to 2011 and 2012), to 16% most recently. It has also represented a falling share in the number of low income entries overall, from 10% to 6%.
Changing demographics of the household can also be associated with entering low income. A change in household type includes various scenarios such as changes to the number of working-age adults, pensioners, or children, and is provided here for context. It shows that 15% of all individuals not in low income in the first wave, experienced a household change. Such a change was experienced by over a fifth (22%) of all those who entered low income.
Some specific demographic events are also included here, highlighting the risk associated with becoming a lone parent, for example, 58% of whom entered AHC low income over the most recent two-wave period, although this was not a prevalent occurrence (1%).
Finally, we include findings on tenure change and an increase in housing costs. A change in tenure, experienced by 5% of those not in low income in the first wave, was associated with a 20% risk of entering low income in the second wave, although the precise nature of that change is not identified via this analysis. Of all entrants into AHC low income over the most recent two-wave period, 11% experienced a tenure change, and 9% an increase in housing costs.
Events associated with exiting low income from 2020 and 2021 to 2021 and 2022, AHC: selected findings [footnote 5]
| Prevalence (%) | Exit rate (%)[footnote 6] | Share of exits (%)[footnote 7] | |
|---|---|---|---|
| Rise in household earnings [footnote 8] | 18 | 61 | 30 |
| Rise in benefit income [footnote 8] | 28 | 54 | 42 |
| Rise in investment income [footnote 8] | 12 | 55 | 18 |
| Rise in occupational pension income [footnote 8] | 6 | 58 | 10 |
| Rise in ‘other’ income [footnote 8] | 8 | 60 | 14 |
| Increase in no. of workers in household - same household size | 13 | 45 | 16 |
| Increase in no. of full-time workers in household - same household size | 10 | 62 | 18 |
| Change from part-time to full-time work for at least one household member - same household size | 5 | 56 | 9 |
| Change from workless to working household - same household size | 5 | 50 | 7 |
| Change in household type | 14 | 43 | 17 |
| Change in tenure | 8 | 33 | 7 |
| Decrease in housing costs [footnote 8] | 6 | 30 | 5 |
An increase in household earnings was closely associated with exiting low income AHC: it was experienced by just under a fifth (18%) of individuals who were in low income in the first of the most recent two-wave period, and of them, 61% exited from low income in the second wave. Almost a third (30%) of all individuals who exited from low income over this period were living in households that experienced an increase in earnings. The prevalence, risk and share statistics on the association between increases in earnings and AHC low income exits are about the same as they were in the first two-wave period commencing 2010 and 2011 (17%, 61% and 29% respectively), although there has been some fluctuation in them across this period, and no discernible trend.
An increase in benefit income was also closely associated with exiting from low income AHC, with this event affecting 28% of those in low income at the start of the most recent two-wave period. Of those individuals, over half (54%) exited from low income, and the event was experienced by 42% of all low income exits over the two-wave period. Over time, the prevalence, risk and share statistics associated with an increase in benefit income have varied, but in no clear direction.
Increases in occupational pension income and in investment income were also associated with exiting low income, but to a lesser extent. An increase in ‘other’ income sources is also reported on here: 14% of all low income exits experienced an increase in this income source, which was associated with a 60% likelihood of exiting low income. Prevalence and share statistics for this event saw a noticeable increase across the previous two-wave period, as income from Student and/or Tuition Fee loans was newly included in this income category (please refer to the Background information and methodology note for further information on this change). Both statistics fell in the most recent two-wave period, but not back to levels seen immediately before the measurement change.
Increases in the amount of full-time work within a household were the work-related events most closely linked to the likelihood of exiting low income: 62% of individuals living in a household which saw an increase in the number of full-time workers, exited from low income, as did 56% where there was a change from part-time to full-time work. While 10% of individuals in low income lived in a household which saw an increase in the number of full-time workers, it was experienced by 18% of all those who exited from low income. A change from part-time to full-time work was less common (5%) and was experienced by 9% of all those who exited low income.
There has been no clear trend in the relationship between increased full-time work and the low income exit AHC statistics that we consider. Events statistics based upon low income exits are slightly more variable than low income entry statistics in part because they are based upon a much smaller base (i.e. those in low income in the first wave of any two-wave period).
The most prevalent work-related event was an increase in the number of workers, which occurred in the households of 13% of those who were in low income in the first wave. While it was associated with a lower likelihood of exit for those individuals (45%) compared to other work-based events, it was experienced by 16% of all low income exits. Prevalence statistics for this event have been relatively stable over time, while the associated likelihood of exiting low income has varied, as has the share of all low income exits associated with it.
Just 5% of individuals who were in low income AHC in the first wave of the most recent two-wave period, lived in a household that changed from a workless one to one in which someone was in work, and this was associated with a relatively high likelihood of exiting low income (50%). This type of change was experienced by 7% of all those who exited from low income across the most recent two-wave period. Over time there has been a slight decrease in both the prevalence and share statistics associated with this event, while the likelihood of exiting low income for those who experience this event, has varied.
Neither a change in tenure or a decrease in housing costs were particularly common among those in low income at the start of the most recent two-wave period (8% and 6% respectively). Such changes were associated with a 33% and 30% likelihood of exiting from low income respectively.
11. Policy context
The coronavirus (COVID-19) pandemic and the policies implemented in response to it affected fieldwork and incomes over parts of Wave 11 (2019 and 2020), Wave 12 (2020 and 2021), and Wave 13 (2021 and 2022). Earlier reports - ID 2010 to 2020 and ID 2010 to 2021 discuss the implications of the pandemic within the context of their respective findings. This section summarises points most relevant to this publication.
Wave 13 fieldwork was conducted mainly from January 2021 to December 2022. Government restrictions in response to the pandemic were implemented during 2020, and continued to affect work and social mixing to a varying degree across different areas and for different individuals throughout 2021 and, to a lesser extent, early 2022.
The first year of Wave 13 fieldwork used the web-first approach to data collection which USoc introduced in March 2020, after face-to-face interviewing was suspended for waves 11 and 12. With the lifting of pandemic-related restrictions on social mixing, the second year of Wave 13 fieldwork saw the reintroduction of face-to-face interviewing in April 2022.
Adaptations made to the USoc questionnaire for waves 11 and 12 were continued into Wave 13. These enabled the survey to gather information on income-based support available to employees via the Coronavirus Job Retention Scheme (CJRS or ‘furlough’), and to the self-employed via the Self-Employment Income Support Scheme (SEISS). For more detailed information on how USoc adapted to the pandemic, please refer to Understanding Society Main Study changes due to the COVID-19 pandemic (Wave 13 release).
In terms of the measurement of persistent low income, this means that data gathered during three of the most recent four waves was affected in some way by the pandemic either directly, or indirectly via policy measures affecting employment, income and fieldwork. We have not, however, observed any unusual changes to headline persistent low income measures, which have remained very similar to those for the previous four-wave period (Table 1, Persistent low income trends. In considering this, it is worth remembering how persistent low income is measured. Firstly, it is based on a relative measure of low income, and as such some change to the income distribution is what typically brings about change. Secondly, it is affected by the extent of movement into and out of relative low income. Greater rates of movement will tend to exert a downward influence on the rate of persistent low income, since the measure requires an individual to remain in low income for three out of four waves.
In terms of the measurement of low income entries and exits, and analysis of the events associated with them, ID sets out minimum requirements that must be met before an income or income component change is counted. The purpose of these thresholds is to stabilise the statistics by ensuring they only reflect meaningful change. It is likely that these requirements mean that low income entry and exit rates may not fully relate to people’s experiences in terms of income changes over this period.
For example, income loss due to furlough is not likely to have been fully captured by the event which considers a change in earnings, since this analysis requires at least a 20% fall in earnings to qualify as a real change (workers on furlough received at least 80% of their pre-pandemic income). For the same reason, any return to pre-pandemic earnings following the cessation of the ‘furlough’ scheme in September 2021, may not have met the 20% threshold required for an income increase to be counted.
Similarly, it is possible that payment uplifts received by Universal Credit and Working Tax Credit recipients between April 2020 to October 2021 did not meet the threshold required for them to be counted as increases (and subsequent decreases) in benefit income (again, only changes of at least 20% would be counted).
Some benefits recipients also received lump sum payments over the period 2021 and 2022, in order to help them meet the rising cost of living. Lump sum payments are routinely adjusted in benefits income calculations carried out by USoc according to the period they were intended to cover, and so may also not have met required thresholds.
Please refer to the Background information and methodology note as well as USoc documentation for further information.
Low income statistics
While ID provides estimates of individuals in persistent low income over a four-year period, estimates of numbers in low income in a single year are available in the annual Households Below Average Income (HBAI) publication. Persistent low income rates are lower than the single year rates published by HBAI because fewer people remain in low income for three years out of four than experience low income in any single year.
Official Statistics
Income Dynamics statistics are Official Statistics.
Our statistical practice is regulated by the Office for Statistics Regulation (OSR).
OSR sets the standards of trustworthiness, quality, and value in the Code of Practice for Statistics that all producers of official statistics should adhere to.
You are welcome to contact us directly with any comments about how we meet these standards. Alternatively, you can contact OSR by emailing regulation@statistics.gov.uk or via the OSR website.
12. More information
ID uses data from Understanding Society to derive a measure of disposable household income. A household income measure implicitly assumes that all members of the household benefit equally from the combined income of the household, and so all members of a household will appear at the same position in the income distribution. Adjustments are made to account for the size and composition of households to make figures comparable – see section on equivalisation, below.
Key information on the definitions and measures used in ID is provided here. Please also refer to the Background information and methodology note for more detail.
Definitions
Understanding Society
Understanding Society, led by the University of Essex, is a longitudinal survey of individuals in the United Kingdom which has been running since 2009. The Wave 13 sample (2021 and 2022) included over 25,000 individuals available for longitudinal analysis. Those not in private households at the start of the survey in 2009 are not included.
Income
This includes income from several sources:
- Labour income – usual pay and self-employment earnings. Includes income from second jobs. For Waves 11, 12 and 13, this includes any income received from the government Coronavirus Job Retention Scheme. Self-employment income is reported for either the previous financial year or, if not, for the most recent 12 months. Income received by self-employed individuals from the Self-Employment Income Support Scheme (SEISS) during the years 2020 and 2021 is understood to have been reported via existing questions on income from self-employment.
- Miscellaneous income – educational grants, payments from family members and any other regular payments
- Private benefit income – includes trade union/friendly society payments, maintenance or alimony and sickness or accident insurance. Since Wave 12, this category has included income from Student Loans or Tuition Fee Loans.
- Investment income – private pensions/annuities, rents received, income from savings and investments.
- Pension income – occupational pensions income.
- State support – tax credits and all state benefits including State Pension and Universal Credit. Also includes any lump sum payments adjusted for the time period they covered.
Before Housing Costs (BHC) Income
Income which is net of income tax payments, National Insurance contributions, and council tax.
After Housing Costs (AHC) Income
Income which is derived by subtracting housing costs (mortgage interest and rent payments) from BHC income.
Equivalisation
An adjustment is made to household income to make the amount available to each individual comparable according to the size and composition of the household they belong to. For example, the process of equivalisation adjusts the income of a single person upwards, so their income can be compared directly to that of a couple. Equivalisation is explained below this section.
Relative Low Income
This is defined for this publication as an individual in a household with an equivalised household income of less than 60% of median income. An individual is in persistent low income if they are in low income for at least three of the last four survey periods.
Households and families
ID presents information on an individual’s household income by various household and family characteristics. There are important differences between households and families. Please see below this section.
Inflation
This concerns how goods and services increase in price (generally) over time. ID uses an adjustment based on the Consumer Prices Index (CPI), also used in HBAI, to compensate for the effects of inflation over time.
Sampling Error
Results from surveys are estimates and not precise figures – in general terms the smaller the sample size, the larger the uncertainty. We are unable to calculate sampling uncertainties for these statistics, but please note that small changes are unlikely to be statistically significant.
Non-sampling Error
Survey data represents the best data from respondents to the survey. If people give inaccurate responses or certain groups of people are less likely to respond, this can introduce bias and error. This non-sampling error can be minimised through effective and accurate sample and questionnaire design and extensive quality assurance of the data. However, it is not possible to eliminate it completely, nor can it be quantified.
Equivalisation explained
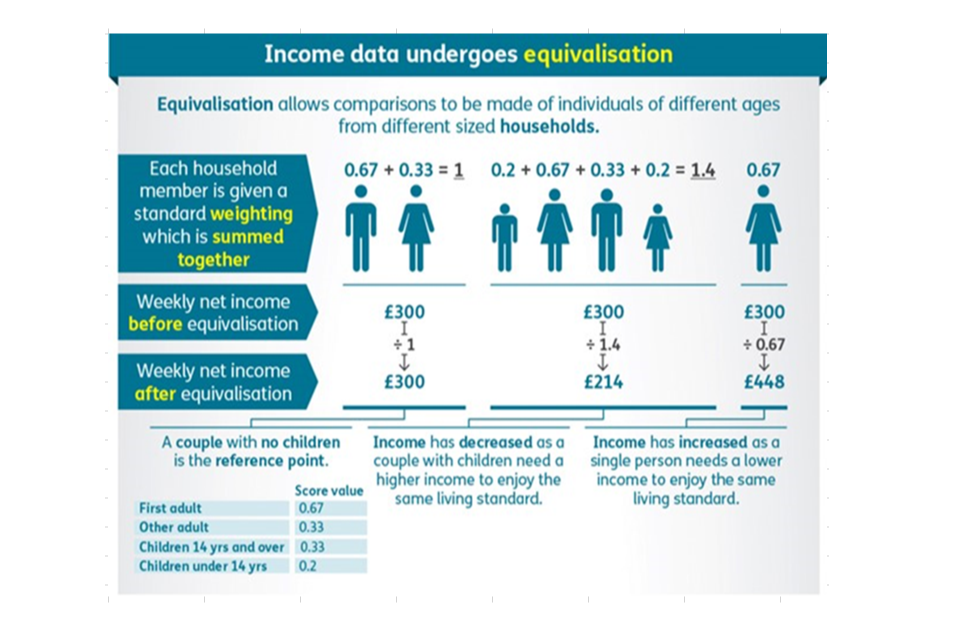
Equivalisation allows comparisons of income levels to be made between individuals of different ages from different sized households.
Each household member is given a weighting which is summed together to provide a household weighting factor. Household weekly net income is divided by that factor to give equivalised income. A couple with no children is the reference point.
Weights are: first adult 0.67; other adult or child 14 years and over 0.33; child under 14 years 0.2.
Households and families
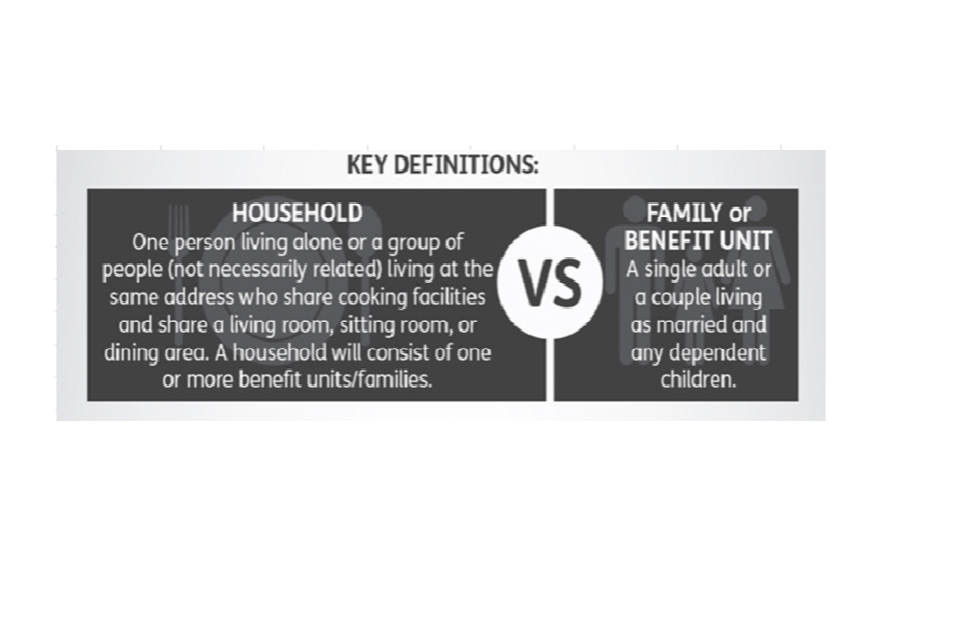
A household is one person living alone or a group of people (not necessarily related) who either share living accommodation OR who share one meal a day and who have the same address as their only or main residence. A household can comprise one or more families. A family is either a single adult or a couple living as married, together with any dependent children.
Related information and statistics
Reference tables and the ID Background information and methodology report, which provides further detail on how we estimate ID measures, are available for our most recent release, together with the ID Quick Guide and ID Tables Guide.
Analysis of Income Dynamics data from previous years can be found on our collections page.
Estimates of numbers in low income in a single year are available from HBAI statistics. The following ONS publications provide information about alternative sources of data on earnings and income:
- A guide to sources of data on income and earnings
- An interactive tool which enables users to quickly locate information about key statistics on income and earnings
- Explaining income and earnings: important questions answered
Please refer to the ID Background information and methodology note for more information on related statistics.
Contact information and feedback
DWP would like to hear your views on our statistical publications. If you use any of our statistics publications, we would be interested in hearing what you use them for and how well they meet your requirements.
Press enquiries should be directed to the DWP Press Office at newsdesk@dwp.gov.uk. Telephone: 0115 965 8781.
Enquiries about these statistics should be directed by email to the ID team inbox.
Lead Analyst: Helen Smith
ISBN: 978-1-78659-633-8
-
Not all events are included here. Please refer to Tables 9.1n to 9.18n in Events associated with low income entries and exits for further information on events associated with low income entry. ↩
-
The share of exits column does not sum to 100% as individuals can experience more than one event. ↩
-
For a change in monthly income or housing costs to be considered an event, it must have risen or fallen by at least 20% and a minimum of £10. Certain demographic changes are controlled for when examining income events: changes in household earnings are only included if the number of workers stays the same. For all other income events, the number of people in the household must not change. ↩ ↩2 ↩3
-
These households do not have children in either wave. ↩
-
Not all events are included here. Please refer to Tables 9.1x to 9.18x in Events associated with low income entries and exits tables for findings on events associated with low income exit. ↩
-
Because those in low income are a smaller group than those who are not, and are generally closer to the low income threshold, they have a greater chance of exiting low income if they experience an income-boosting event than those not in low income have of entering low income if they experience a loss of income event. This explains why exit rates tend to be higher than entry rates. ↩
-
The share of exits column does not sum to 100% as individuals can experience more than one event. ↩
-
For a change in monthly income or housing costs to be considered an event, it must have risen or fallen by at least 20% and a minimum of £10. Certain demographic changes are controlled for when examining income events: changes in household earnings are only included if the number of workers stays the same. For all other income events, the number of people in the household must not change. ↩ ↩2 ↩3 ↩4 ↩5 ↩6