HM Prison and Probation Service annual staff equalities report: 2022 to 2023
Published 23 November 2023
Applies to England and Wales

© Crown copyright 2023
This publication is licensed under the terms of the Open Government Licence v3.0 except where otherwise stated. To view this licence, visit nationalarchives.gov.uk/doc/open-government-licence/version/3 or write to the Information Policy Team, The National Archives, Kew, London TW9 4DU, or email: psi@nationalarchives.gov.uk.
Where we have identified any third party copyright information you will need to obtain permission from the copyright holders concerned.
This publication is available at https://www.gov.uk/government/statistics/hm-prison-probation-service-staff-equalities-report-2022-2023/hm-prison-and-probation-service-annual-staff-equalities-report-2022-to-2023
Main Points
| 66,031 (headcount) staff in post as at 31 March 2023 | This was an increase of 6.5% compared to 31 March 2022. Females represented 54.9% of staff (an increase of 1.2 percentage points since last year), and 12.6% of staff who declared their ethnicity were from ethnic minority backgrounds (an increase of 0.7 percentage points since last year). |
| 11,662 (headcount) new recruits to HMPPS in 2022/23 | This was 3,504 (43.0%) more than in 2021/22. Females accounted for 58.3% of joiners and just under half of joiners (48.9%) were aged under 30 years old. |
| 3,627 staff (6.1%) were receiving temporary cover allowances (TCA) | This was a decrease of 0.3 percentage points compared to 31 March 2022. TCA rates were slightly higher for females (6.2%) compared to males (5.9%). |
| 5.7% of permanent staff were promoted, an equivalent of 3,594 promotions | An increase from the rate of 4.9% (2,933 promotions) in 2021/22. The promotion rate for female staff was higher in 2022/23 at 6.1% (2,071) than for males at 5.3% (1,523). |
| 923 staff raised grievances, representing 1.5 per 100 staff | These resulted in 1,082 cases of which 528 (48.8%) were upheld/partially upheld. The number of grievance cases raised during the year increased compared to 2021/22 (from 1.2 per 100 staff), but the percentage of cases being upheld/partially upheld decreased by 2.6 percentage points (from 51.4%). |
| Overall rate of conduct & discipline cases was 1.1 per 100 staff | A decrease from 1.2 per 100 staff for 2021/22. In 2022/23, the rate was almost three times higher for male staff (at 1.7 per 100 male staff) compared to female staff (at 0.6 per 100 female staff) and was highest amongst band 3-5 prison officers at 2.0 per 100 staff. |
| HMPPS staff lost an average of 12.6 working days due to sickness | A decrease from 13.8 days for 2021/22. For 2022/23, the average was higher for male than female staff (12.9 and 12.4 days respectively) and was higher for ethnic minority (excluding white minorities) staff (15.0 days) compared to white staff (12.1 days). |
This publication considers staffing profiles and processes of the directly employed HMPPS workforce from an equality perspective. Technical details and explanatory notes can be found in the accompanying Guide and Glossary to the annual HMPPS Staff Equalities Report.
Please send any feedback you may have related to the content of this publication to: robert.hartley@justice.gov.uk
Statistician’s comment
As at 31 March 2023, there were 66,031 (headcount) staff in post and the size of the workforce has increased by 6.5% compared to March last year. Female representation rates were again higher than males (54.9% and 45.1%, respectively) which is likely to be due to the growth in the staffing number of Probation Service staff, who are predominantly female.
In 2022/23, a revised performance management policy was introduced which aligns with the rest of the Ministry of Justice. As part of this, the recognition and reward system was also updated to encourage smaller and more regular in-year awards. It covers both cash bonuses and voucher awards. Historical bonus data can be found in previous versions of this publication, but this year will be the start of a new data series for recognition and reward (R&R). Of staff employed by HMPPS in 2022/23, 40.1% received a recognition and reward award during the year and the average value for each member of staff who received an award was £170.
The overall rate of conduct & discipline cases was 1.1 per 100 staff, a decrease from 1.2 per 100 staff for 2021/22. In 2022/23, the rate was almost three times higher for male staff (at 1.7 per 100 male staff) compared to female staff (at 0.6 per 100 female staff) and was highest amongst band 3-5 prison officers at 2.0 per 100 staff. Similarly, HMPPS staff were investigated at a rate of 2.8 per 100 staff which was a decrease from 2.9 per 100 staff in 2021/22. Males were more than twice as likely to face investigations than females (4.2 and 1.6 per 100 staff, respectively).
Sickness rates have started to decrease to stand at an average of 12.6 workings days lost in 2022/23, a decrease from 13.8 days in 2021/22. Frontline prison staff had the highest sickness rates with band 3-5 prison officers losing an average of 14.6 days to sickness and OSG staff losing an average of 13.7 working days.
Leaving rates fell during the COVID-19 pandemic to 8.3% in 2020/21, possibly due to increased uncertainty in the employment market. Following post-COVID increases, leaving rates have seen a slight decrease in the last year to 12.5% from 12.6% in 2021/22.
Points to note
Her Majesty’s Prison and Probation Service
On 1 April 2017, Her Majesty’s Prison and Probation Service (HMPPS) replaced the National Offender Management Service (NOMS), an agency of the Ministry of Justice. HMPPS is focussed on supporting operational delivery and the effective running of prison and probation services across the public and private sectors. HMPPS works with several partners to carry out the sentences given by the courts, either in custody or the community. This report considers profiles and processes of the HMPPS workforce from an equalities’ perspective.
HMPPS delivers services directly through public sector prisons, the youth custody service, and the Probation Service. The statistics in this publication relate to staff working within HMPPS with a contract of employment with HMPPS, who are all civil servants. Staffing in private sector establishments, Community Rehabilitation Companies (CRCs) and other contractors are excluded.
During June 2021, more than 7,000 staff from private CRCs came together with 3,500 probation officers already in the public sector in the new Probation Service.
The equality objectives of HMPPS are stated, along with progress and achievements, in the HMPPS Annual Report and Accounts 2021/22. The 2022/23 report is due to be published shortly.
www.gov.uk/government/publications/hmpps-annual-report-and-accounts-2021-22
There are many interactions between characteristics of staff that influence outcomes on staff processes. These include interactions between protected characteristics, such as between age and ethnicity, as well as other factors such as grade level. It is not possible within a report of this size to explore these interactions. Important considerations, such as differences in grade levels and how they may affect different groups of staff are highlighted, but no detailed analysis is included that removes the interactions and allows the unique contribution of protected characteristics to be isolated.
Values of 2 or fewer or other values which would allow values of 2 or fewer to be derived by subtraction are suppressed. Please see our technical guide for further information on suppression.
Workforce statistics for HMPPS (and NOMS prior to 1 April 2017) are also published through the HMPPS Quarterly Workforce Bulletin:
www.gov.uk/government/collections/national-offender-management-service-workforce-statistics
This report covers staff processes with reference to protected characteristics as set out below.
Staff Process
-
Total Staff in Post
-
Joiners
-
Temporary Cover
-
Promotions
-
Recognition and reward bonuses
-
Grievances
-
Investigations
-
Conduct and Discipline Cases
-
Sickness Absence
-
Leavers
Protected Characteristic
-
Gender
-
Age
-
Ethnicity
-
Disability
-
Sexual Orientation
-
Religion / Belief
An accompanying report relating to Offender Equalities statistics for 2022/23 will also be published on 30 November 2023 and available at:
https://www.gov.uk/government/collections/hmpps-annual-offender-equalities-report
Protected characteristics information is recorded for HMPPS staff on gender, age, ethnicity, disability, sexual orientation, religion/belief, and work pattern. Caution should be exercised in attempting to make comparisons between the composition of the HMPPS workforce and the wider population of England and Wales based on protected characteristics. There is substantial regional variation of these distributions in the general population, and HMPPS staff are not distributed across England and Wales in the same proportions as the general population, this may render such comparisons invalid.
Data on the ethnicity, disability, sexual orientation, and religion/belief were collected from self-declared, non-compulsory fields on the Single Operating Platform (SOP) from January 2017 onwards. With lower declaration rates, the risk of bias increases, and the accuracy of a representation rate based on known declarations falls rapidly. Consequently, when a declaration rate falls below 60%, no representation rate is provided.
Ethnicity, disability, religion, and sexual orientation are all self-declared, optional fields. Since the introduction of SOP in January 2017, there was a large drop in the declaration rates of new joiners to HMPPS. It is likely that the extremely low declaration rates are due to issues with the user-friendliness of SOP when it was first introduced. Over the past couple of years there has been a substantial increase in declarations, meaning that some of these characteristics have reached the threshold to allow for meaningful analysis of new recruits by these protected characteristics. The Ministry of Justice is looking at ways to address these issues and improve these declaration rates further.
1. Total Staff in Post
There were 66,031 staff in post as at 31st March 2023, 6.5% more than at the same date in 2022.
Females accounted for 54.9% of staff (an increase of 1.2 percentage points since last year) and 12.6% of staff who declared their ethnicity were from ethnic minority backgrounds; which was an increase of 0.7 percentage points since last year. The age band with the largest proportion of staff was 30–39-year-olds (24.5%).
The headcount of HMPPS staff in post increased from 62,015 as at 31 March 2022 to 66,031 as at 31 March 2023. This consisted of 30,139 staff in operational grades, 21,634 in the Probation Service grades, and 14,236 in non-operational grades.
Figure 1 shows a breakdown of grades by gender, and figures 2 and 3 show the make-up of the workforce across the available protected characteristics. Representation rates are only illustrated where information is recorded for over 60% of staff. Additional details on staff in post can also be found in tables 1a and 1b.
Gender
Females accounted for 54.9% (36,219) of all HMPPS staff as at 31 March 2023, an increase of 1.2 percentage points on their representation for the previous year when it was 53.6% (33,242 females). This is consistent with a longer trend showing a steady increase in the percentage of females since March 2019.
Figure 1: HMPPS staff by grade and gender, as at 31 March 2023
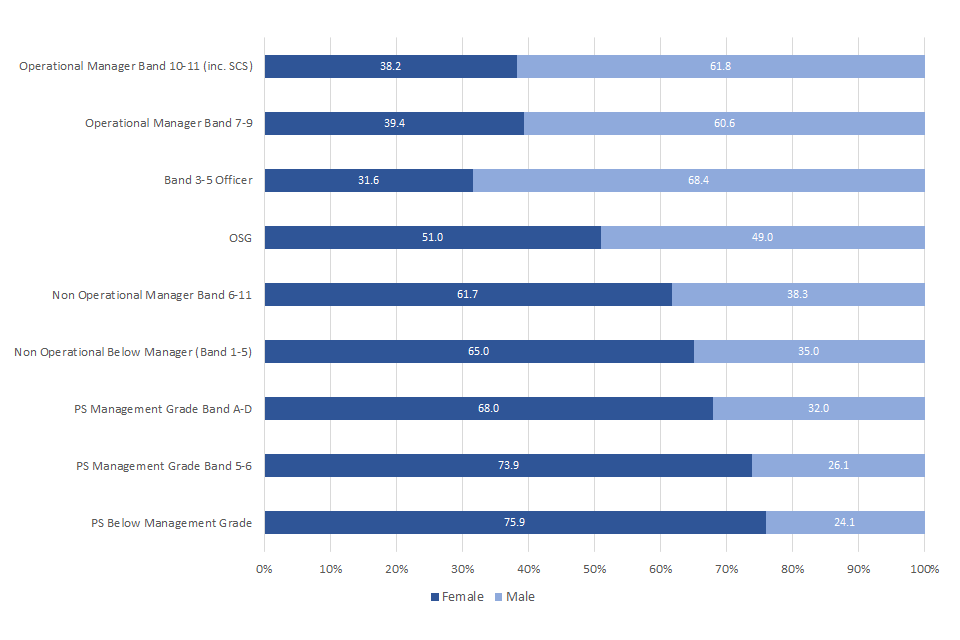
Across operational grades, there was a higher proportion of males compared to females. Senior leaders in public prisons and HMPPS HQ (Senior Civil Servants and operational managers including governors) were made up of 38.2% (83) of females. Furthermore, females accounted for 39.4% (364) of operational manager bands 7-9, 31.6% (7,344) of prison officer bands 3-5. Operational Support Grades (OSGs) were the only operational grade group who had a higher proportion of females in post at 51.0%.
In contrast, there were more female than male staff in non-operational grades (in prisons, HMPPS HQ and Area Services); 61.7% in non-operational manager grades (an increase of 1.9 percentage points from 59.8% in March 2022), and 65.0% in non-operational grades below management level were female.
The Probation Service[footnote 1] had higher female representation than the other parts of HMPPS. Females predominated in the Probation Service at all levels, comprising of 68.0% (238) of staff in senior Probation Service roles (bands A-D), 73.9% (1,699) in bands 5-6, and 75.9% (14,419) in Probation Service grades below management level (which includes probation officers at band 4).
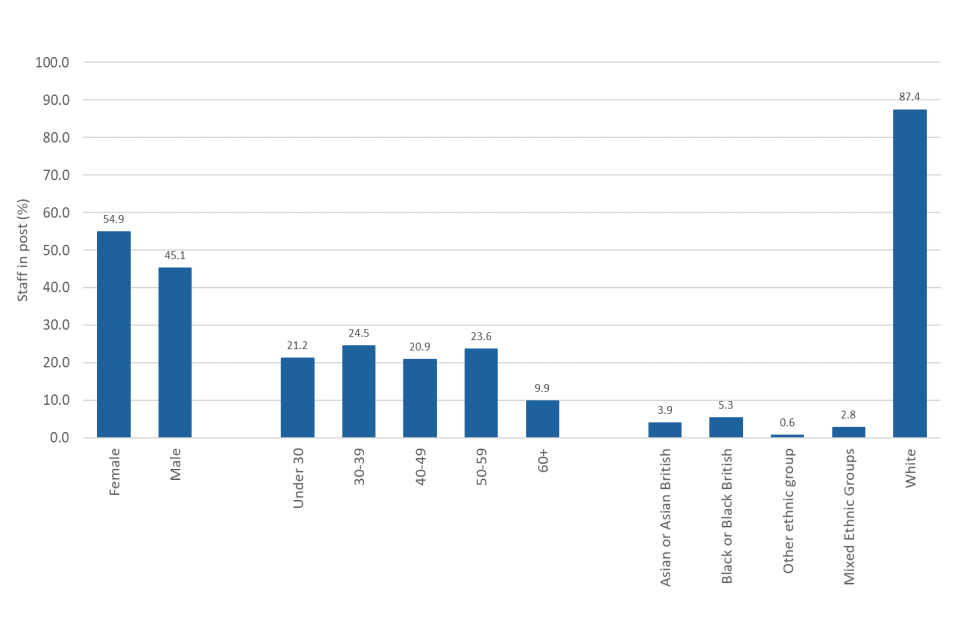
Figure 2: HMPPS staff by gender, age, and ethnicity, as at 31 March 2023
Age
As at 31 March 2023, the age band with the largest proportion of staff was those aged 30-39, comprising of 24.5% (16,156) of all staff, driven largely by frontline staff in prisons and probation, see below. The proportion of those aged 40 or over as at 31 March 2023 stood at 54.4% (35,902), a decrease of 1.8 percentage points since the previous year, whilst those aged under 30 represented 21.2% (13,973) of the HMPPS workforce, compared to 19.8% last year. The overall age distribution of HMPPS staff has remained fairly consistent since March 2019.
Across all grades, the age bands with the highest proportion of staff were either the 40-49 or 50-59 age band, except for band 3-5 officers where a higher proportion of staff were aged between 30-39 (29.4% of staff aged 30-39), and for Probation Service below management grades where a higher proportion of staff were aged under 30 (23.5%). Moreover, just over a quarter (26.9%) of the band 3-5 officers in post as at 31 March 2023 were aged below 30, and 23.6% of OSGS in post were aged under 30.
Ethnicity
As at 31 March 2023, 84.0% of staff had declared their ethnicity. Of these, 12.6% (7,008) were from an ethnic minority background. There were some differences between the groups within the ethnic minority group, with 5.3% of staff being from a black background compared to 0.6% of staff who declared as coming from an other ethnic group. By grade, the lowest ethnic minority representation was for operational managers bands 7-9 at 6.2% (55), an increase of 0.5 percentage points compared to the previous year (5.7%). By comparison the grade with the highest ethnic minority representation was those in Probation Service below management grades, at 17.6%, an increase of 0.3 percentage points compared to the previous year (17.3%)
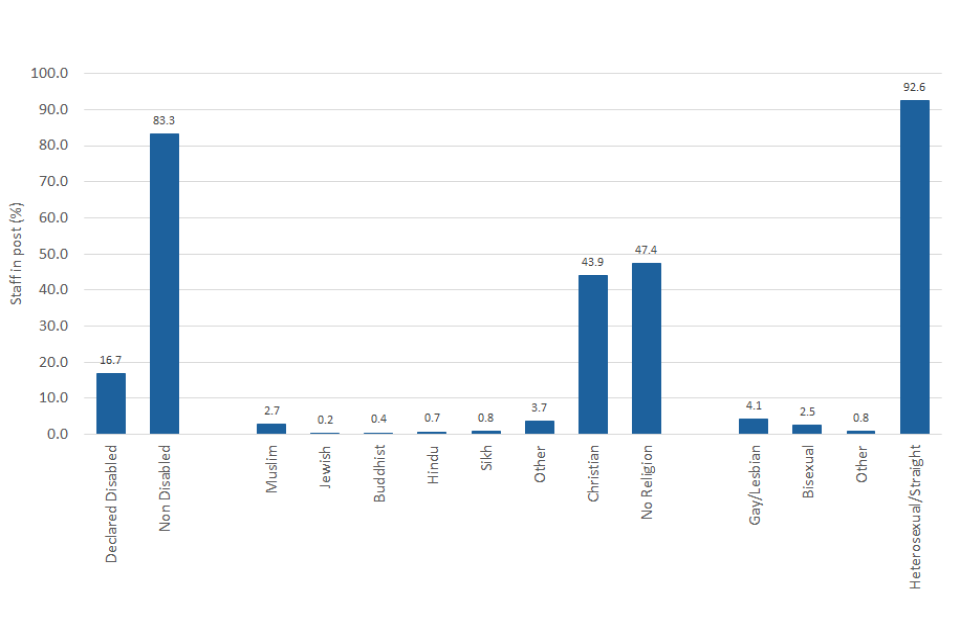
Figure 3: HMPPS staff by disability status, religion, and sexual orientation, as at 31 March 2023
Disability
Overall, 77.8% of staff had declared their disability status. Of those who had declared their disability status, there were 16.7% of staff who declared themselves as disabled compared to 83.3% who declared themselves as non-disabled. The lowest disability representation rate was for band 3-5 officers at 10.6% (1,838), and the highest representation rate was for Probation Service below management grade at 23.4% (3,547).
Religion
Overall, 75.7% of staff had declared their religious belief. Of those who had declared their religious belief, 43.9% were Christian, 47.4% had no religion and 8.7% were non-Christian. There were some differences between the groups within the non-Christian Religion category, with most non-Christian staff being Muslim or Other at 2.7% and 3.7% respectively, compared to 0.2% of staff who declared as Jewish.
Sexual Orientation
Overall, 76.5% of staff had declared their sexual orientation. Of those who had declared their sexual orientation as at 31 March 2023, 92.6% were heterosexual/straight compared to 7.4% of staff declaring themselves as LGBO (Lesbian, Gay, Bisexual and Other). The LGBO representation has increased by 0.5 percentage points since 31 March 2022. The grades with the highest level of LGBO representation were OSG and prisons officer grades, at 8.8%, and 8.3% respectively, an increase of 0.7 percentage points and 0.2 percentage points compared to the previous year
2. Joiners
There were 11,662 (headcount) new recruits to HMPPS in 2022/23; 3,504 more than in 2021/22 and a 43.0% increase.
Females accounted for 58.3% of joiners and just under half of joiners (48.9%) were aged under 30 years old.
The number of staff appointed to HMPPS increased from 8,158 in 2021/22 to 11,662 in 2023/23, a 43.0% increase. The largest group of recruits were band 3 to 5 officers, with 4,314 appointed in the 12 months to 31 March 2023, closely followed by Probation Service below management grades which includes Probation Service Officers, with 4,040 appointed in 2022/23. Figure 4 shows a breakdown of joiners across the available protected characteristics; additional details can also be found in the tables 2a and 2b.
Figure 4: HMPPS new joiners by protected characteristic, 1 April 2022 to 31 March 2023
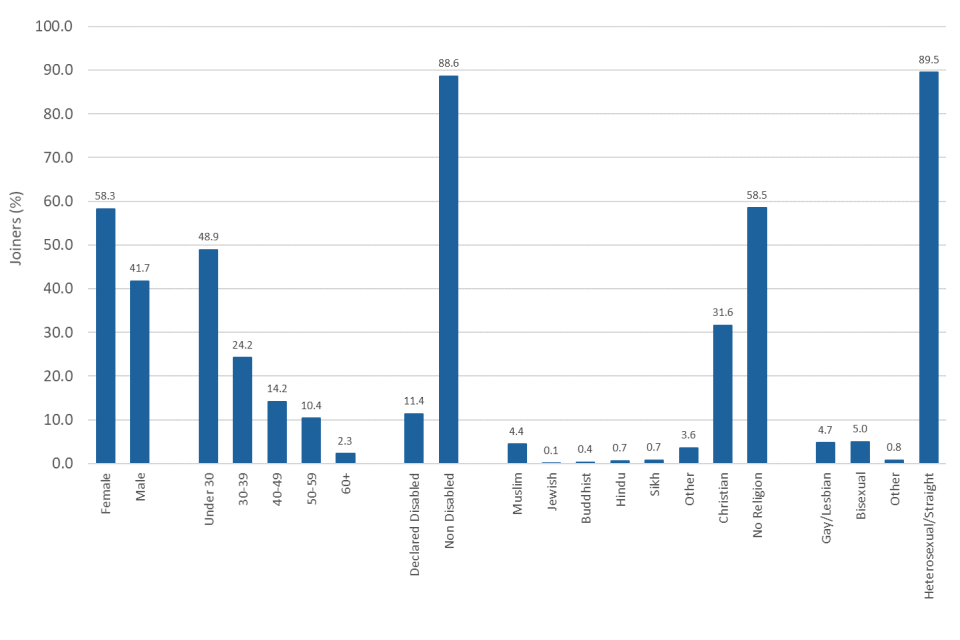
Note: Ethnicity breakdowns are not shown due to low declaration rates.
Overall, 41.7% of those who joined HMPPS were male and 58.3% were female. This varied by grade with most of the grades having new recruits who were largely female, such as Probation Service below management level (75.1%) and Probation Service management level (75.0%) grades. However, band 3-5 officer recruits had a higher proportion of males (61.2%).
Just under half of new joiners (48.9%, equivalent to 5,706 individuals) in 2022/23 were aged under 30 whilst 26.9% (3,132) were aged 40 or older. Across grades, below management grades had a higher proportion of staff who joined aged under 30. Specifically, 53.2% (2,296) of band 3-5 officers joiners, 43.4% (838) of OSG joiners, 42.1% (487) of non-operational below manager joiners, and 50.8% (2,052) of Probation Service below management joiners were aged under 30. In operational, non-operational and Probation Service management roles, a high proportion of staff who joined were aged between 40-49 years old (41.7%, 34.8% and 34.1% respectively).
Declaration rates are high enough for disability status, religious belief, and sexual orientation to allow meaningful analysis by these protected characteristics, however the declaration rate for ethnicity is still too low.
Of the 64.6% of joiners that declared their disability status in 2022/23, 11.4% were self-declared as being disabled compared to 88.6% of non-disabled staff. The disability representation rate has increased by 2.2 percentage points since 2021/22. Where numbers were large enough to disclose, the lowest disability representation was for band 3-5 prison officers at 5.9% and the highest representation rate was for non-operational managers at 16.5%.
There was a higher proportion of joiners who declared themselves as having no religion (58.5%) compared to those belonging to a religious group (41.5%, of which 31.6% were Christian and 9.9% were non-Christian). Compared to 2021/22, the representation rate has increased by 1.4 percentage points for non-Christian religions and increased by 2.0 percentage points for Christian religions.
In 2022/23, 65.5% of joiners had declared their sexual orientation. Of those, a higher proportion of recruits were heterosexual/straight at 89.5% compared to 10.5% who were Lesbian, Gay, Bisexual and Other (LGBO). Of the LGBO categories, bisexual staff made up the largest proportions of joiners at 5.0% compared to gay/lesbian and ‘other’ (4.7% and 0.8% respectively). The LGBO representation rate has increased by 0.3 percentage points since 2021/22.
3. Temporary Cover
As at 31 March 2023, 3,627 staff (6.1%) were receiving temporary cover allowances (TCA).
TCA rates were higher for females, those aged 30-39 years old, mixed ethnicity staff, non-disabled staff, and non-religious staff.
Temporary cover payments are a system that enables staff to work temporarily in a more senior role and receive an additional payment while this work is undertaken. Although temporary cover payments tend to be received for a considerable duration while an individual covers a role at a higher grade on a temporary basis, these figures are based on snapshots at a moment of time at the end of a financial year. As such, they may not accurately represent the rates of those receiving cover payments during the financial year.
As at 31 March 2023, 3,627 staff were receiving temporary cover allowances for filling posts of a higher grade on a temporary basis. This represents 6.1% of staff, a slight decrease from 6.4% of staff as at 31 March 2022. Across grades, operational managers had the highest TCA rates at 12.9% of staff and Probation Service managers had the lowest rate at 2.1%. The rate of temporary cover allowances is illustrated in figure 5, with additional details in tables 3a and 3b.
Figure 5: Temporary cover allowances (TCA) per 100 staff, as at 31 March 2023
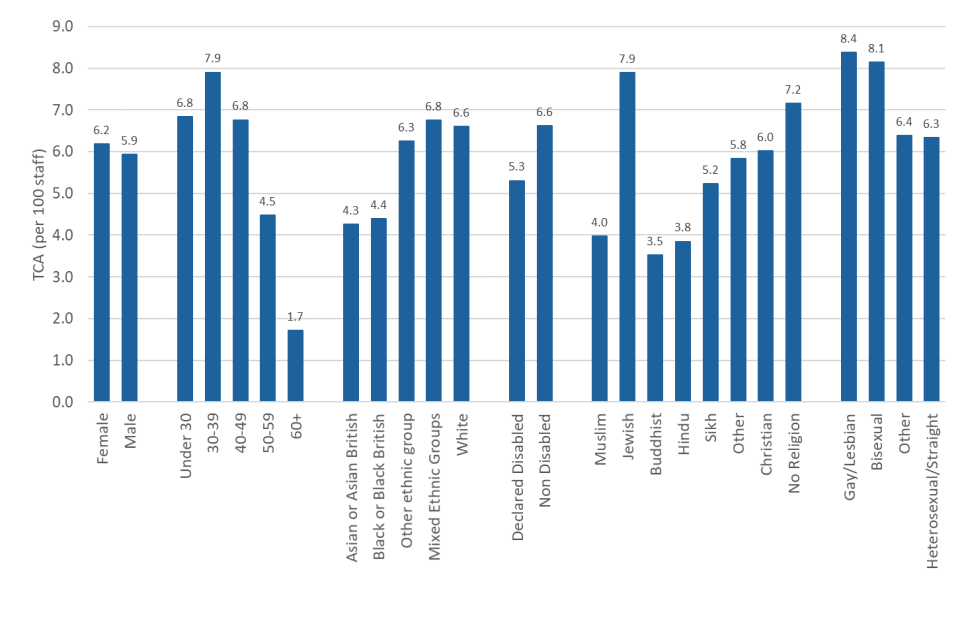
As at 31 March 2023, 6.2% of females were on temporary cover compared to 5.9% of males. The TCA rates were lower for female operational managerial staff (11.5% compared to 13.8% for males) and female non-operational managerial staff (5.9% compared to 8.1% for males), but higher for females in junior roles, such as band 3-5 prison officers (7.0% compared to 6.7% for males) and non-operational below management grades (5.0% compared to 3.5% for males). The TCA rates among female staff in Probation Service grades were higher than that for male staff across all bands.
Temporary cover payments were most prevalent amongst those aged 30 to 39 (7.9%) compared to 6.8% of both under 30s and staff aged 40 to 49, 4.5% of staff aged 50 to 59 years old, and 1.7% of staff aged 60 or over.
As at 31 March 2023, 5.0% of ethnic minority staff were receiving temporary cover payments compared to 6.6% of white staff. Last year, 6.3% of ethnic minority staff and 6.9% of white staff were on temporary cover. Within the ethnic minority category, staff who declared as mixed ethnic groups had the highest rate of receiving TCAs at 6.8% and staff who declared themselves as Asian/Asian British had the lowest rates at 4.3%. To note, numbers within the ethnic minority subset groups were low so some caution is advised when viewing rates.
The proportion of staff receiving temporary cover allowances was lower amongst disabled staff compared to non-disabled (5.3% and 6.6% respectively as at 31 March 2023).
As at 31 March 2023, 5.0% of staff with non-Christian religions were receiving temporary cover payments, compared to 6.0% of Christian staff and 7.2% of staff with no religion. Within the non-Christian religion subset groups, staff who declared as Jewish had the highest rate of receiving TCAs at 7.9%. This figure should be treated with caution due to the small number of Jewish staff in post as 31 March 2023 (114).
The proportion of staff receiving temporary cover allowances was higher amongst staff who declared themselves as LGBO (Lesbian, Gay, Bisexual, or Other) at 8.1% compared to 6.3% of heterosexual staff. This is consistent across the time series shown in the tables.
4. Promotions
In 2022/23, 5.7% of permanent staff were promoted, an equivalent of 3,594 promotions.
The rate of promotions was higher for: females, those aged 30-39 years old, white, non-disabled, Jewish staff and staff who identified as bisexual.
Promotions relate to staff moving to a more senior grade through an internal process. Operational Support Grade staff who convert to become prison officers are known as ‘conversions’ and not defined as promotions and so this specific grade change does not appear in this report. Promotions are reported in terms of the grade of the staff prior to promotion rather than the grade they were promoted into. Similarly, rates are calculated in relation to the number of staff in the lower grade.
In 2022/23, 5.7% of staff were promoted (the equivalent of 3,594 promotions within the year), an increase from the rate of 4.9% (2,933 promotions) in 2021/22.
The rate of promotions, which represents the number of individuals promoted per 100 staff, in 2022/23 across all protected characteristics is illustrated in figure 6. Additional details on promotions can also be found in tables 4a and 4b.
Figure 6: Promotions per 100 staff, 1 April 2022 to 31 March 2023
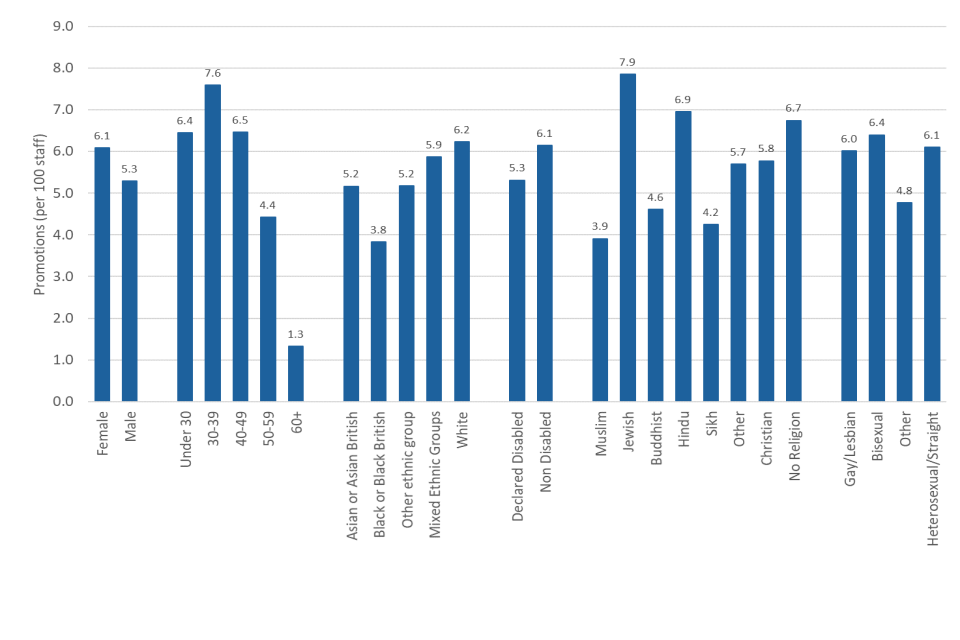
The promotion rate for female staff was higher in 2022/23 at 6.1% (2,071) than for males at 5.3% (1,523). Over the past 4 years, promotion rates have been consistently higher among female staff compared to male staff. This trend was also seen across band 3-5 prison officer, OSG, all non-operational grades, and Probation Service below management grades in 2022/23.
The rate of promotions declines as the age of staff increases after the 30-39 age bracket. In 2022/23, staff aged under 30 had a promotion rate of 6.4% while staff aged 30 to 39 had the highest rate of promotion at 7.6% of staff in post, compared to 6.5% for staff aged 40 to 49, 4.4% for the 50-59 age group and 1.3% for staff aged 60 and over.
In the 12 months ending 31 March 2023, ethnic minority staff had a lower promotion rate at 4.8% than white staff at 6.2%. Within the ethnic minority groups, those identifying as mixed ethnicity had the highest rate at 5.9%. Probation Service below management grade was the only grade where ethnic minority staff had a higher promotion rate compared to white staff (4.8% for ethnic minority group compared to 4.7% for white).
In 2022/23, the rate of promotion between staff who declared themselves disabled was lower than that of non-disabled staff, at 5.3% and 6.1% respectively. This pattern was seen across all grades apart from band 3-5 prison officers, OSGs, and non-operational managers. For band 3-5 prison officers, the rate of promotion was 6.3% for staff who declared themselves as disabled compared to 6.1% of non-disabled staff; for OSGs, the rate of promotion was 5.6% for staff who declared themselves as disabled compared to 5.1% of non-disabled staff and for non-operational managers, the rate of promotion was 7.4% for staff who declared themselves as disabled compared to 7.2% of non-disabled staff.
In 2022/23, the promotion rate was higher for Christian staff (5.8%) compared to non-Christian staff (5.1%). These rates were lower compared to the promotion rates of those with no religion (6.7%). Within the non-Christian religion subset groups, staff who declared as Jewish had the highest rate of promotion at 7.9%. This figure should be treated with caution due to the small number of average Jewish staff in post in 2022/23 (115).
Staff who identified themselves as LGBO (Lesbian, Gay, Bisexual, or Other) had a lower rate of promotion compared to heterosexual staff (6.0% and 6.1% respectively). Across grades (where figures are large enough to disclose), operational managers who identified themselves as LGBO had higher rates of promotion (14.9%) compared to heterosexual operational managers (9.3%). This was also the case for non-operational below manager grades (10.8% of LGBO, 8.7% heterosexual) and Probation Service below management grades (5.4% LGBO, 4.7% heterosexual).
5. Recognition and reward bonuses
In 2022/23, 40.1% of staff employed in the year were awarded a recognition and reward bonus.
The rate of bonuses awarded was higher for; females (45.1%) compared to their male counterparts (34.1%), white staff (42.2%) compared to ethnic minority staff (40.1%), and disabled staff (46.6%) compared to non-disabled staff (41.8%).
Recognition and reward (R&R) bonuses allow local management the opportunity to recognise and reward any member of staff for exceptional performance in a particularly demanding task or situation through a one-off non-consolidated lump sum payment of up to £2,000 (or up to £20,000 with CEO approval). R&R bonuses can be rewarded in either cash or voucher form. The figures here represent staff receiving an award of either kind.
In 2022/23, there was a total of 74,198 staff in post within the year (including leavers), of which 29,754 staff (40.1%) were awarded a recognition and reward bonus in the year. The average value of R&R bonuses for staff who received a bonus was £170 of awards per staff member.
Across the grades, the rate of bonuses awarded was higher for managerial positions than for junior positions. In operational grades, 49.1% of operational managers were awarded bonuses compared to the more junior operational positions of band 3-5 officers at 28.7%, and OSGs at 18.2%. A similar pattern was seen for non-operational and Probation Service grades too; 53.5% of non-operational managers were awarded bonuses compared to more junior non-operational positions at 33.6%, and 82.3% of Probation Service management grades were awarded bonuses compared to 56.9% of Probation Service below management grades.
The rate of recognition and reward bonuses and the average value per award across protected characteristics are illustrated in figures 7 and 8 below. Recognition and reward bonus statistics can be viewed in tables 5a & 5b.
Figure 7: Percentage of staff who received a recognition and reward bonus, 1 April 2022 to 31 March 2023
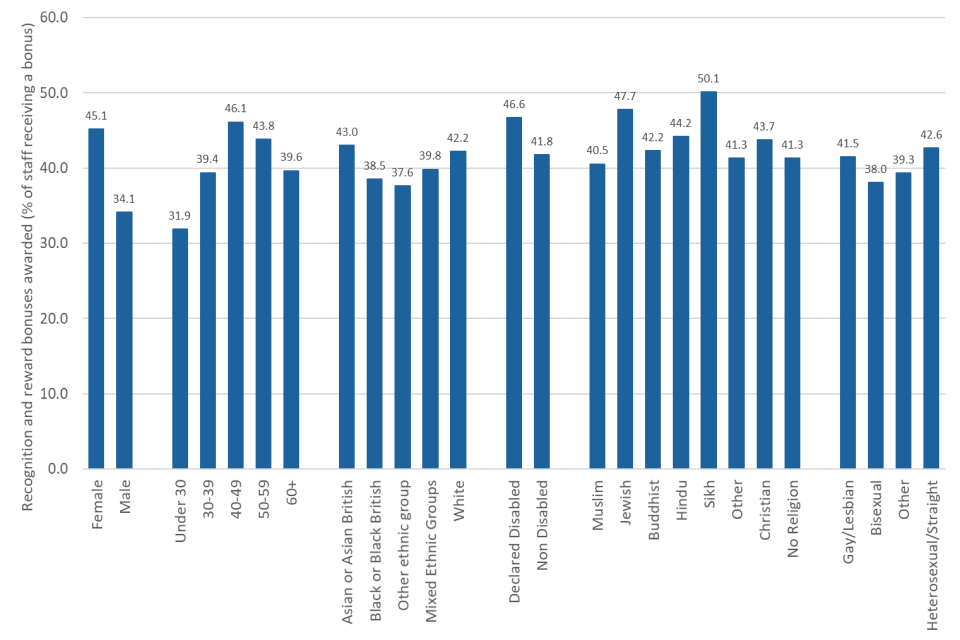
Figure 8: Average value of recognition and reward bonuses per employee, 1 April 2022 to 31 March 2023
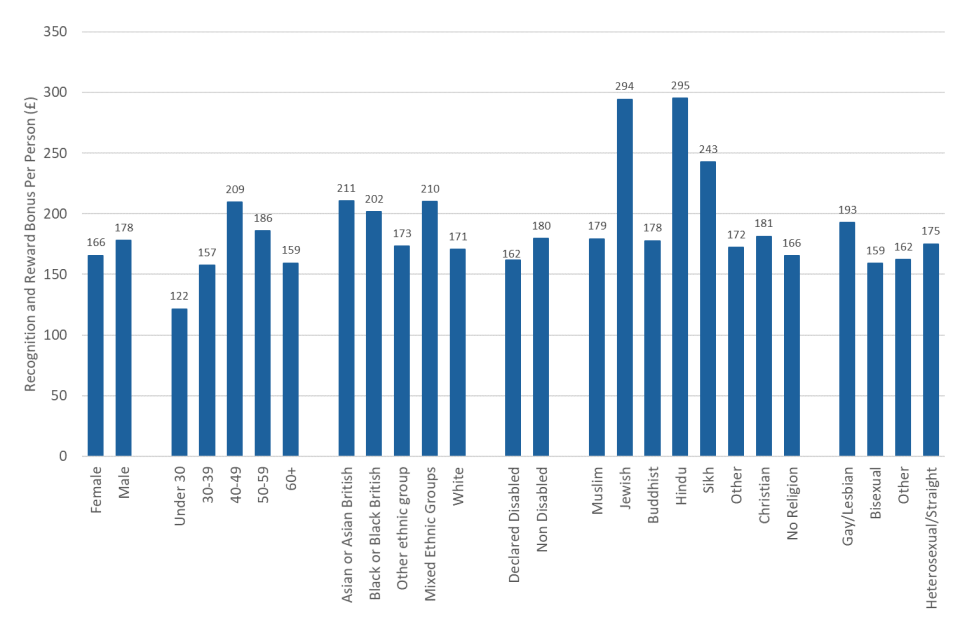
In 2022/23, females were awarded recognition and reward bonuses at a higher rate than males at 45.1% compared to 34.1%, respectively. However, the average value of the bonuses was higher for males who received an average of £178 compared to females who received an average of £166. The rate of R&R bonuses awarded was higher for females than males across all grades.
In 2022/23, staff in the 40-49 age group had the highest rate of bonuses awarded at 46.1%, and the average value of bonuses for this age group was the highest compared to the other age groups at £209. Staff aged under 30 had the lowest rate of bonuses awarded at 31.9% as well as the lowest average value of £122.
In 2022/23, the rate of bonuses awarded to ethnic minority staff was lower compared to white staff (40.1% compared to 42.2% respectively), but the average value of bonuses awarded to ethnic minority staff was higher with an average of £205 for ethnic minority staff and £171 for white staff. There were differences between the rates and average value of bonuses awarded to the different groups of ethnic minority staff. Staff who declared themselves as Asian or Asian British were awarded the highest bonuses at a rate of 43.0%, with an average value of £211 per person. In contrast, staff who declared themselves as ‘other ethnic group’ were awarded the lowest number of bonuses at a rate of 37.6% and were also awarded the least, with an average value of bonuses of £173.
The rate of bonuses awarded in 2022/23 to those who declared as disabled was 46.6 %, compared to 41.8% for non-disabled staff. The average value of these bonuses was lower for those declared disabled at £162 compared to non-disabled at £180.
In 2022/23, the rate of bonuses awarded to those who declared as being affiliated with no religion (41.3%) was lower compared to those who declared as Christian (43.7%) and non-Christian (42.3%). Staff who declared themselves as LGBO (Lesbian, Gay, Bisexual and Other) were awarded bonuses at a lower rate than heterosexual/straight staff (40.1% compared to 42.6%). However, LGBO staff were awarded a slightly higher average value of the awards (£179) compared to heterosexual/straight staff (£175).
6. Grievances
In 2022/23, 923 staff raised grievances resulting in 1,082 cases. Of these cases, 48.8% were upheld/partially upheld.
This is an increase from 2021/22 where 741 staff raised grievances resulting in 843 cases. The raising of grievances in 2022/23 was higher for: ethnic minority staff (at 2.2 per 100 staff) compared to white staff (at 1.3 per 100 staff) and disabled staff (at 2.7 per 100 staff) compared to non-disabled staff (at 1.2 per 100 staff).
A grievance is defined as any concern, problem or complaint raised by an individual member of staff relating to his or her employment. Only grievances that have gone through the formal procedure are analysed here. Grievances resolved locally or through mediation are not recorded centrally. Further details on grievances can be found in tables 6a, 6b(i), 6b(ii).
In 2022/23, there were 923 staff who raised grievances, resulting in 1,082 cases. Of these cases, 48.8% (528 cases) were upheld or partially upheld, a decrease of 2.6 percentage points compared to the previous year. The overall figure for the number of grievances raised in 2022/23 represented 1.5 per 100 staff, an increase from 2021/22 (1.2 per 100 staff). Across grade breakdowns, band 3-5 prison officers and operational mangers had the highest rate in terms of raising a grievance at 1.7 per 100 staff.
Figures 9 and 10 show the rate per 100 staff raising grievances and the percent of cases upheld or partially upheld, split by protected characteristic.
Figure 9: Number of staff per 100 staff raising grievances, 1 April 2022 to 31 March 2023
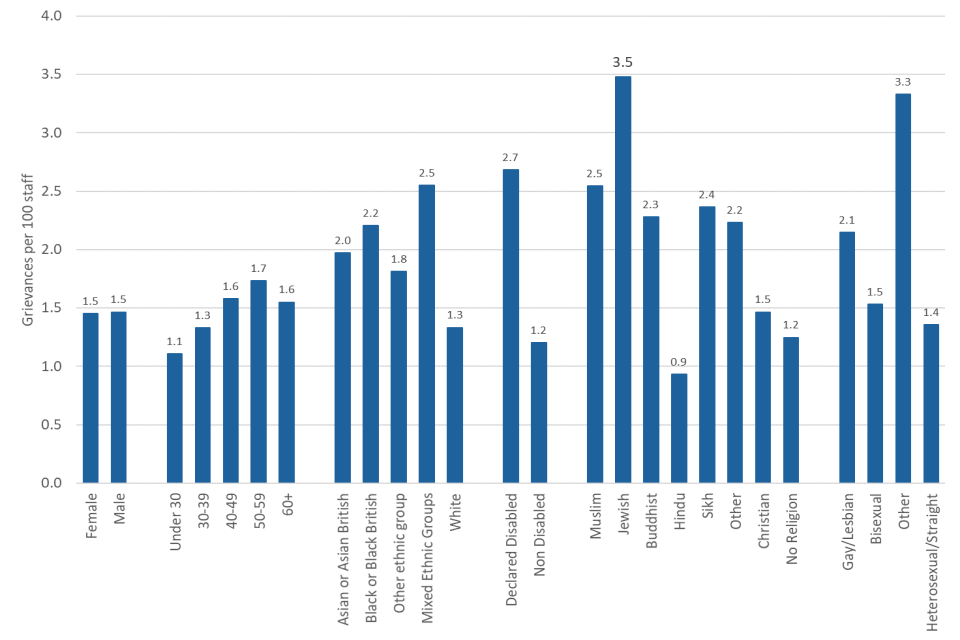
Figure 10: Percent of cases upheld or partially upheld, 1 April 2022 to 31 March 2023
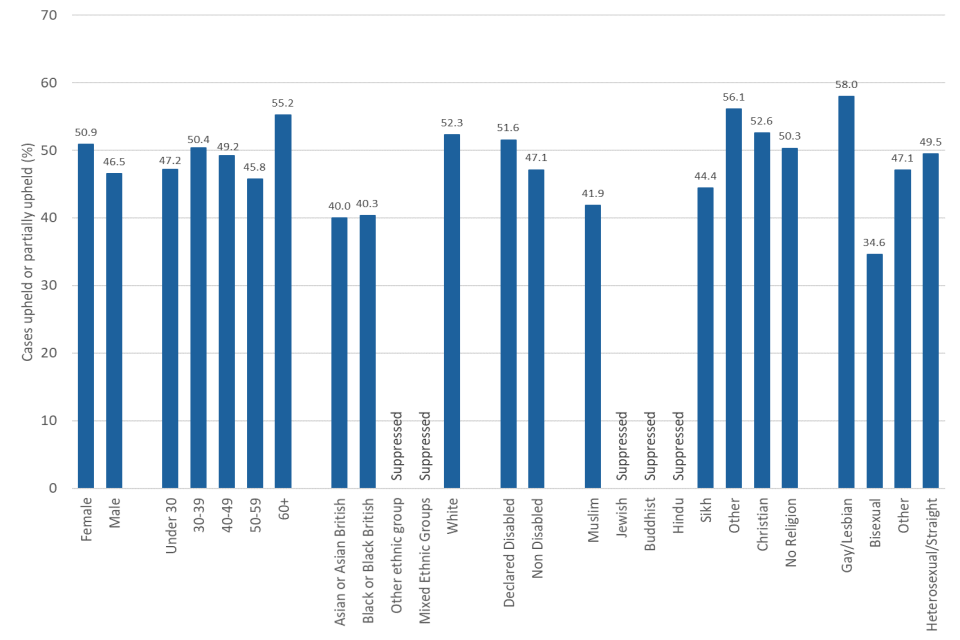
Overall, female staff raised grievances in 2022/23 at a similar rate than males, with both at 1.5 per 100 staff. Across grades, females raised fewer grievances per 100 staff compared to males in Probation Service grades junior grades but more at the senior grades. In operational grades (operational managers, band 3-5 officers, OSGs) female staff raised a higher rate of grievances than male staff but there were differences in non-operational grades (non-operational manager and non-operational below management grades), where female staff raised a higher rate of grievances than male staff at the lower grades but had a lower rate at the higher grades. The largest difference between rates of female and male staff who raised a grievance was for the operational manger grade group (at 2.2 and 1.4 per 100 staff respectively). The percentage of cases upheld or partially upheld in 2022/23 was higher for females (50.9%) than for males (46.5%).
In 2022/23, there was a tendency for the rate of grievances to increase with age. Staff under 30 had a grievance rate of 1.1 per 100 staff compared to 1.7 per 100 staff aged 50-59 and 1.6 for staff aged 60 and over.
The overall rate of grievances raised per 100 staff was higher amongst ethnic minority staff compared to white staff, at 2.2 per 100 and 1.3 per 100 staff, respectively. The percentage of cases upheld or partially upheld was higher for white staff at 52.3% compared to staff from an ethnic minority background at 40.5%.
Overall, self-declared disabled staff raised more grievances, at a rate of 2.7 per 100 staff, than non-disabled staff, at 1.2 per 100 staff. Considering grades where numbers are large enough to disclose, this pattern was seen across all grades.
Non-Christian staff raised more grievances than Christian staff, at 2.3 and 1.5 per 100 staff, respectively. Of the non-Christian staff, the rate of grievances raised was highest for Jewish staff at 3.5 per 100 staff. Considering grades where numbers are large enough to disclose, this pattern of non-Christian grievance rates being higher than Christian rate was seen across all grades. Christian staff had a higher proportion of cases being upheld or partially upheld at 52.6% compared to non-Christian staff at 47.4%.
Staff who identified themselves as LGBO raised more grievances, at a rate of 2.1 per 100 staff, compared to heterosexual staff, as at a rate of 1.4 per 100 staff. The percentage of cases upheld or partially upheld was the same for heterosexual staff and LGBO staff, at 49.5%.
7. Investigations and Conduct & Discipline cases
In 2022/23, the overall rate of investigated staff was 2.8 per 100 staff, a decrease from 2.9 per 100 staff in 2021/22
The rate was higher amongst; male staff (4.2 per 100 males) compared to female staff (1.6 per 100 females), ethnic minority staff (3.8 per 100 staff) compared to white staff (2.7 per 100 staff), and those aged 30-39 (3.5 per 100 staff) compared to staff in other age bands.
In 2022/23, the overall rate of conduct and discipline cases was 1.1 per 100 staff, a decrease from 1.2 per 100 staff in 2021/22
The rate was almost three times higher for male staff (1.7 per 100 male staff) compared to female staff (0.6 per 100 female staff). Staff from an ethnic minority background had a higher rate of conduct & discipline cases (1.5 per 100 staff), compared to white staff (1.0 per 100 staff).
Investigations into staff conduct are designed to establish the truth of the case and to determine whether conduct and discipline action is recommended. A conduct and discipline case imposes a penalty on a member of staff for wrongdoing. In cases of summary dismissal, it is not always possible to have had a full internal investigation.
Both investigations and conduct and discipline cases may involve multiple charges and may have multiple outcomes for the different parts of the case. More than one member of staff can also be charged and penalised in a single case. For the purpose of this report, a case is defined as a charge or set of charges being brought against an individual. Where more than one individual is charged together, they are counted as multiple cases in this report.
Further details on investigations and conduct and discipline cases can be found in tables 7a, 7b(i) and 7b(ii), and 8a, 8b(i) and 8b(ii).
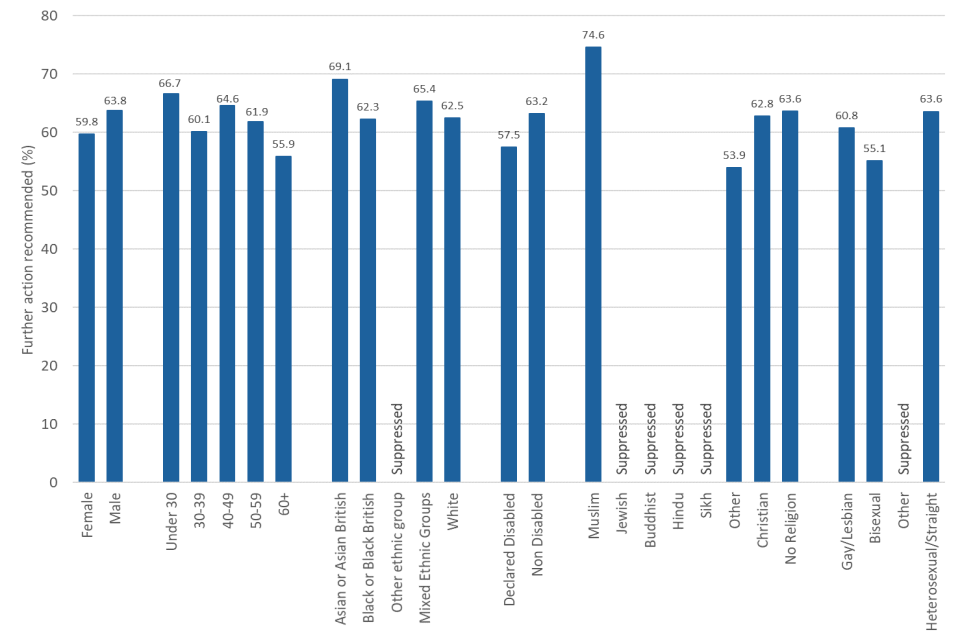
In 2022/23, 1,777 staff faced at least one investigation, representing a rate of 2.8 investigated staff per 100 staff, a decrease from 2.9 investigated staff per 100 for 2021/22. Of the 1,777 cases, 1,197 (62.6%) had further action recommended. In 2022/23, band 3-5 officers had a higher rate of investigations than staff in other grades (5.1 investigated staff per 100 staff, with all other grades with a rate of 3.0 or below).
Overall, male staff were investigated at more than double the rate of female staff in 2022/23, at 4.2 investigated staff per 100 males compared to 1.6 investigated staff per 100 females. The rate of investigations for male staff was higher across all grades except for operational manager where the rates were higher for females (3.7 per 100 staff) compared to males (1.9 per 100 staff). The percentage of cases with further action recommended was also higher for males at 63.8% compared to 59.8% for females.
Figures 11 and 12 show the rates per 100 staff who were investigated in 2022/23 and the proportion of cases where further action was recommended, split by protected characteristic.
Figure 11: Staff subject to at least one investigation per 100 staff in post, 1 April 2022 to 31 March 2023
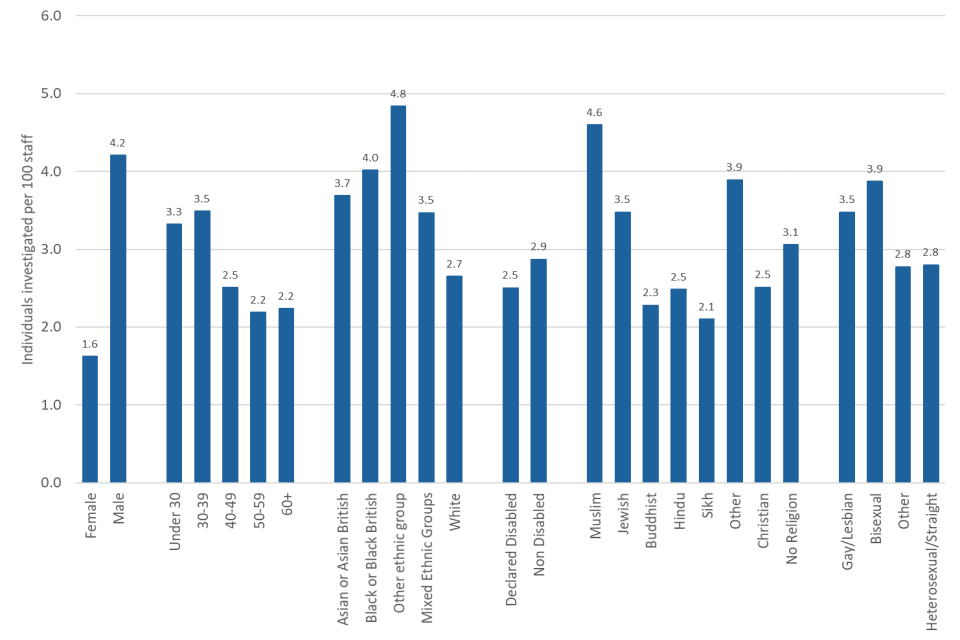
Figure 12: Proportion of Investigations where further action was recommended, 1 April 2022 to 31 March 2023
In 2022/23, there was a tendency for the rate of investigations to decrease with age from 3.3 investigated staff per 100 staff for those aged under 30, and 3.5 investigated staff per 100 staff for those aged 30 to 39, to 2.2 investigated staff per 100 staff aged 50 and over.
The proportion of ethnic minority staff investigated in 2022/23 was higher than the proportion of white staff investigated, at 3.8 investigated staff per 100 for staff from ethnic minority backgrounds compared to 2.7 investigated staff per 100 for white staff. The percentage of cases with further action recommended was also higher for ethnic minority staff (63.4%) than for white staff (62.5%).
In 2022/23, the proportion of staff with non-Christian religious beliefs investigated was higher than for Christian staff, at 3.7 per 100 staff compared to 2.5 per 100 staff, respectively. Non-Christian staff had a lower proportion of cases with further action recommended (62.5%) compared to Christian staff or those with no religion (62.8% and 63.6% respectively).
There were 684 staff subject to conduct and discipline action in 2022/23, a rate of 1.1 per 100 staff. There was a total of 711 conduct cases and of these 26.0% resulted in the penalty of dismissal [footnote 2]. The rate of conduct cases was highest amongst band 3-5 prison officers at 2.0 per 100 staff.
Figures 13 and 14 show the rates per 100 staff who were subject to conduct and discipline action and the proportions of conduct cases leading to dismissal in 2022/23, split by protected characteristics.
Figure 13: Staff per 100 staff subject to conduct and discipline action, 1 April 2022 to 31 March 2023
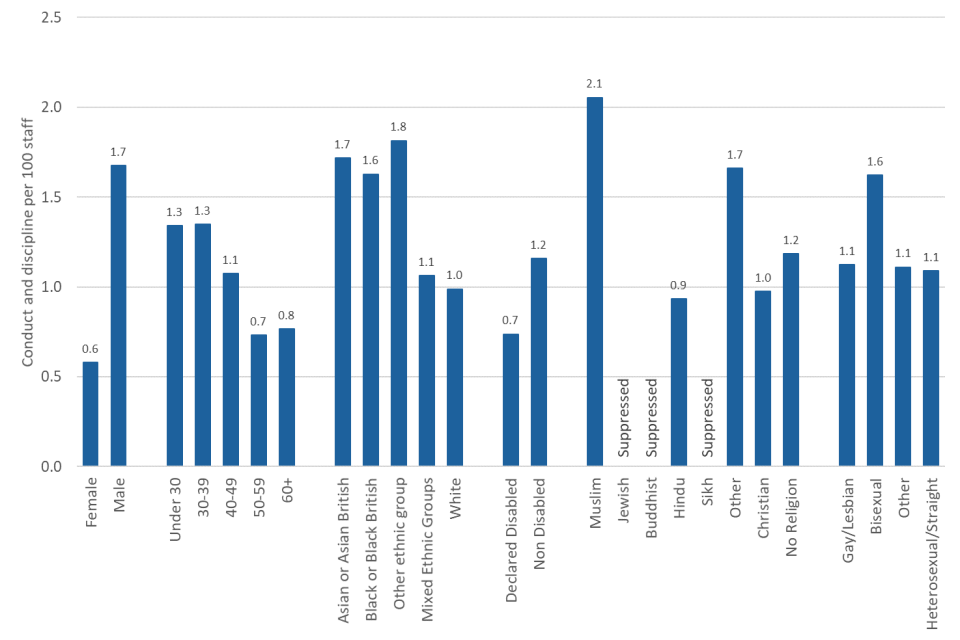
Figure 14: Percentage of conduct cases leading to dismissal, 1 April 2022 to 31 March 2023
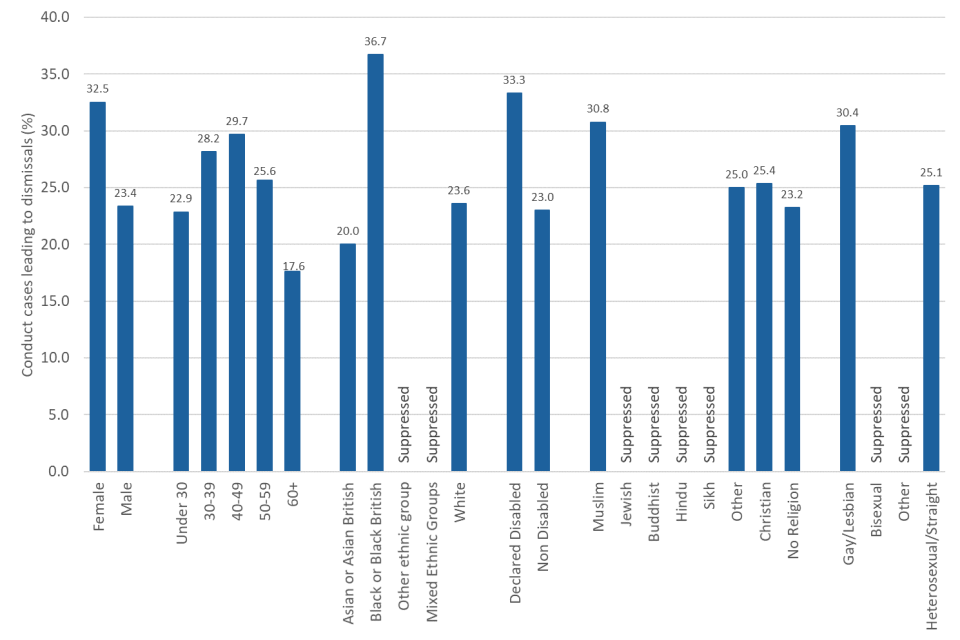
The rate of conduct cases involving male staff was almost three times the rate for female staff, 1.7 per 100 male staff compared to 0.6 per 100 female staff. The proportions of cases resulting in dismissal were higher for female staff compared to male staff (32.5% and 23.4% respectively).
In 2022/23, the rate of conduct and discipline cases was highest among staff aged under 30 and those aged 30-39, at 1.3 per 100 staff, and generally decreased with age where those aged 60 and over had a rate of 0.8 per 100 staff.
In 2022/23, ethnic minority staff had a higher rate of staff subject to conduct and discipline action per 100 staff with 1.5 per 100 staff, compared to white staff with 1.0 per 100 staff. The percentage of dismissals resulting from conduct cases was higher for ethnic minority staff at 30.5% compared to white staff at 23.6%.
There was a smaller proportion of staff subject to conduct and discipline among those who declared themselves as disabled, at 0.7 per 100 staff, compared to non-disabled staff, at 1.2 per 100 staff. The percentage of cases resulting in dismissals was higher for disabled staff compared to non-disabled staff (33.3% and 23.0% respectively).
In 2022/23, staff with non-Christian religious beliefs, 1.5 per 100 staff, were subject to conduct and discipline action at a higher rate than Christian staff, 1.0 per 100 staff. Non-Christian staff had a similar proportion of cases which resulted in dismissals (25.0%) compared to Christian staff (25.4%) and slightly higher than those with no religion (23.2%).
The rate of conduct and discipline cases was slightly higher for staff who identified as LGBO compared to Heterosexual staff (1.3 per 100 staff and 1.1 per 100 staff respectively).
8. Sickness Absence
In 2022/23, HMPPS staff lost an average of 12.6 working days due to sickness, a decrease of 1.1 average working days lost compared to 2021/22.
The average working days lost due to sickness increased with age and was higher for males, and those that declared themselves as ethnic minority, disabled, non-Christian, or LGBO.
Sickness absence is represented in this section by the average working days lost (AWDL) due to sickness per employee per year. To note, figures relating to the effect of COVID-19 on HMPPS staff have been included from 2019/20 in this publication. For further information on sickness reason, please see our [HMPPS workforce release] (https://www.gov.uk/government/collections/national-offender-management-service-workforce-statistics).
In 2022/23, the AWDL due to sickness absence was 12.6, a decrease of 1.1 average workings days lost from 13.8 in 2021/22. In 2022/23, across operational, non-operational and Probation Service roles the AWDL was lower for senior staff compared to grades below management level. Operational, non-operational and Probation Service grades below management level had the highest levels of AWDL; 14.6 days for officers, 13.7 days for OSGs, 10.6 days for non-operational below managers and 13.3 days for Probation Service staff below management grade.
The average working days lost to sickness absence was higher for male staff at 12.9 days, than for female staff at 12.4 days. This was seen across all managerial grades (Operational, non-operational and Probation Service) and non-operational below management grades, whereas the AWDL was higher for female officers, OSGs, and Probation Service below management staff.
Figure 15 illustrates the AWDL in 2022/23 across all protected characteristics. Further details on sickness absence can be found in tables 9a and 9b.
Figure 15: Average working days lost due to sickness absence, 1 April 2022 to 31 March 2023
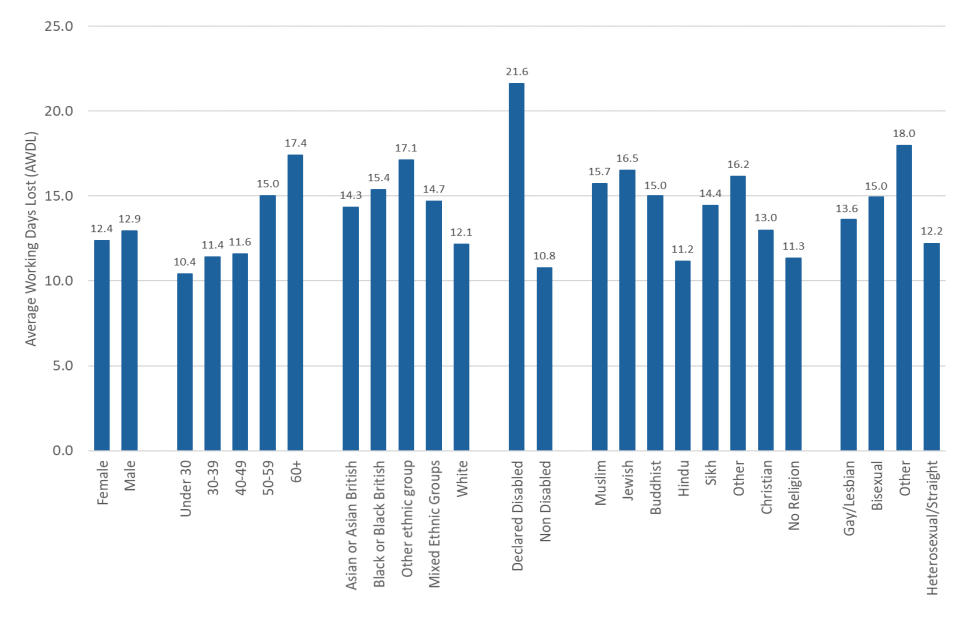
In 2022/23, the average working days lost to sickness absence increased with age from 10.4 days for those aged under 30 to 17.4 days for those aged over 60. This pattern was seen across many of the grades, except for band 3-5 officers, where those aged 50-59 had the highest AWDL at 16.4 days.
In 2022/23, the AWDL was 15.0 days for ethnic minority staff and 12.1 days for white staff. There were some differences in the AWDL between the groups within the ethnic minority group, with ‘other ethnic group’ having the highest rate of 17.1 days, followed by black or black British staff at 15.4 days, mixed ethnicity staff at 14.7 and Asian or Asian British staff at 14.3. Compared to 2021/22, there was a decrease in the AWDL among white staff of 1.1 days and a decrease for all ethnic minority groups (excluding white minorities) of 0.7 days.
By grade, in the 12 months ending 31 March 2023, the AWDL rate was higher for ethnic minority staff in all staff positions, apart from operational managers (7.2 AWDL for white staff compared to 6.0 for ethnic minority staff) and non-operational below manager grades (10.7 AWDL for white staff compared to 10.5 for ethnic minority staff).
For 2022/23, those who declared themselves as being disabled had more working days lost, on average, than that of non-disabled staff, at 21.6 days compared to 10.8 days, respectively. Disabled staff had a higher AWDL compared to non-disabled staff across all grade groups.
In 2022/23, staff who declared themselves as being a non-Christian had a higher rate of AWDL of 15.4 days compared to Christian staff (13.0 days) and staff with no religion (11.3 days). Of the non-Christian religions, Jewish staff had the highest AWDL of 16.5 days. Staff who declared themselves as LGBO had the highest rate of AWDL of 14.5 days compared to an AWDL of 12.2 days in heterosexual/straight staff.
9. Leavers
In 2022/23, the leaving rate of HMPPS staff was 12.5%, a decrease of 0.1 percentage point since 2021/22.
Leaving rates were higher amongst male staff (13.3%) compared female staff (11.8%). By age, the highest leaving rate was for those aged under 30 (19.0%), followed by those aged 60 and over (17.6%).
In the 12 months ending 31 March 2023, 7,832 permanent staff (headcount) left HMPPS. The leaving rate stood at 12.5%, representing a decrease of 0.1 percentage point from the previous year’s rate of 12.6%. For the 12 months to 31 March 2021, the increased uncertainty in the employment market following the COVID-19 pandemic may have contributed to the drop in the number of resignations during most of the year, therefore impacting on the overall reduced leaving rates. Although there was a slight drop in the leaving rates when compared to 2021/22, the leaving rates in the 12 months to end of March 2023 were still higher than pre-pandemic levels. The rates presented include retirement but exclude voluntary exits under the Voluntary Early Departure Scheme and redundancies (VEDSR).
Leaving rates for each protected characteristic are shown in figure 16. Further details on leavers can be found in tables 10a to 10c.
Figure 16: Permanent staff leaving rates (excluding VEDSR), 1 April 2022 to 31 March 2023
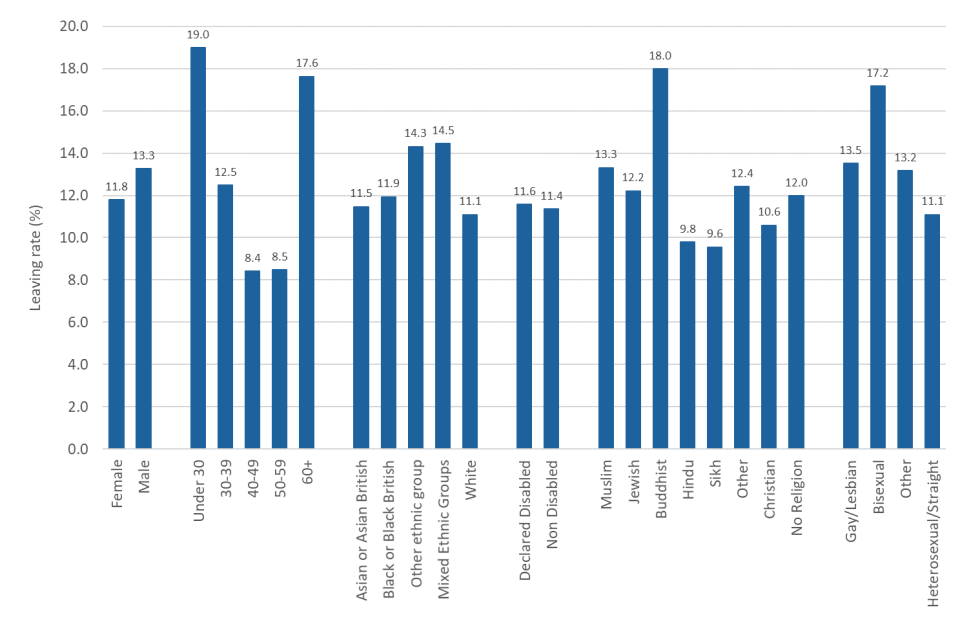
The leaving rate for female staff was lower in the 12 months ending 31 March 2023 at 11.8% than the rate for male staff at 13.3%. This represents a decrease of 0.2 percentage points for female staff whereas for male staff the leaving rate remained the same compared to the previous year.
Considering gender splits of leaving rates by grade group, in 2022/23, operational below management grades had the largest leaving rates; OSGs had a leaving rate of 18.9%, an increase from 18.3% in 2021/22, and band 3-5 officers had a leaving rate of 14.6%, an increase from 14.5% in 2021/22. Band 3-5 prison officers and OSGs were the only grades where females had a higher leaving rate than males; a rate of 15.7% compared to 14.0%, respectively for band 3-5 officers and a rate of 19.0% to 18.8%, respectively for OSGs.
As leaving rates include retirement it would be expected that those aged 60 and over would have one of the highest leaving rates. Accordingly, the leaving rate for those aged 60 and over was the second highest at 17.6% in the 12 months to 31 March 2023, a decrease of 2.0 percentage points compared to the previous 12 months. Those aged under 30 had the highest leaving rates of 19.0%, which was a decrease of 1.5 percentage points compared to the 12 months to 31 March 2022.
In 2022/23, the leaving rate was higher for ethnic minority staff at 12.5%, compared to white staff at 11.1%. Within the ethnic minority subgroups, those who declared themselves as mixed ethnic groups had the highest leaving rates at 14.5%. Staff who had declared themselves as disabled had a leaving rate of 11.6% which was higher than the leaving rate of non-disabled staff at 11.4%.
Declaration rates for religion and sexual orientation are above the level at which meaningful consideration can be made. In 2022/23, staff who declared themselves as a non-Christian had a higher leaving rate of 12.5% compared to Christian staff (10.6%) and staff with no religion (12.0%). Staff who declared themselves as LGBO had a higher leaving rate of 14.7% than heterosexual/straight staff leaving rate of 11.1%.
Further Information
Accompanying files
As well as this report, the following products are published as part of this release:
-
A technical guide and glossary providing details of the data sources and quality. Information on the revisions policy and disclosure relevant to HMPPS staffing data as well as a definition of terms used is also included.
-
A set of tables for the year as well as over time.
Official Statistics
The statistics in this bulletin are classified as official statistics. The Statistics and Registration Service Act 2007 defines ‘official statistics’ as all those statistical outputs produced by the UK Statistics Authority’s executive office (the Office for National Statistics), by central Government departments and agencies, by the devolved administrations in Northern Ireland, Scotland, and Wales, and by other Crown bodies (over 200 bodies in total). The statistics in this bulletin comply with all aspects of the Code of Practice for Official Statistics. The Code encourages and supports producers of statistics to maintain their independence and to ensure adequate resourcing for statistical production. It helps producers and users of statistics by setting out the necessary principles and practices to produce statistics that are trustworthy, high quality and of public value.
Contact
Press enquiries should be directed to the Ministry of Justice press office: Tel: 020 3334 3536 Email: newsdesk@justice.gov.uk
Other enquiries about these statistics should be directed to:
Rob Hartley Workforce Statistics & Analysis Ministry of Justice 10 South Colonnade London E14 4PH
Email: robert.hartley@justice.gov.uk
Next update: 28 November 2024
URL: www.gov.uk/government/collections/national-offender-management-service-workforce-statistics
© Crown copyright
Produced by the Ministry of Justice
Alternative formats are available on request from statistics.enquiries@justice.gov.uk
-
In this report, Probation Service staff are reported according to grade and therefore vary slightly from the total number of staff in the Probation Service. This is due to the small number of Probation Service staff in non-Probation Service grades. ↩
-
Details of appeals are not included in the analysis so several the penalties may have been overturned on appeal. ↩