Main findings: Childcare providers and inspections as at 31 August 2022
Updated 3 March 2023
Applies to England

© Crown copyright 2023
This publication is licensed under the terms of the Open Government Licence v3.0 except where otherwise stated. To view this licence, visit nationalarchives.gov.uk/doc/open-government-licence/version/3 or write to the Information Policy Team, The National Archives, Kew, London TW9 4DU, or email: psi@nationalarchives.gov.uk.
Where we have identified any third party copyright information you will need to obtain permission from the copyright holders concerned.
This publication is available at https://www.gov.uk/government/statistics/childcare-providers-and-inspections-as-at-31-august-2022/main-findings-childcare-providers-and-inspections-as-at-31-august-2022
This is the main findings report for the childcare providers and inspections as at 31 August 2022 release. The following are also available:
-
underlying data
-
methodology
-
pre-release access list
Summary
This release includes:
-
the number of Ofsted-registered childcare providers and their most recent inspection outcomes on 31 August 2022
-
data on inspections and regulatory activity carried out until 31 August 2022
Summary of findings
On 31 August 2022, there were 65,600 childcare providers registered with Ofsted, down by 5,400 since 31 August 2021. Most of this overall decline is due to a fall in the number of childminders.
The number of childcare places has not decreased at the same rate as the number of providers. While the number of providers has fallen by 8% since 31 August 2021, the number of places has only declined by 2%. On 31 August 2022, there were 1.28 million childcare places offered by providers registered on the Early Years Register (EYR).
As at 31 August 2022, 96% of childcare providers have been judged good or outstanding at their most recent inspection. The proportion of providers judged outstanding has decreased from 20% to 15% since 31 August 2019.
During the past 10 years, the number of childminders joining our registers has progressively decreased, while the number of leavers has fluctuated. Since 31 August 2021, about 1,500 childminders have joined our registers and 5,600 have left.
Figure 1: Overall effectiveness of active early years registered providers at their most recent inspection over time

Note: numbers in brackets refer to the number of inspected providers (rounded to the nearest 100). Percentages may not sum to the totals reported in the text due to rounding
View data in an accessible table format.
Introduction
The early years and childcare sector is primarily made up of private nurseries, pre-schools and childminders. In this publication, we refer to 4 types of early years provision:
Childminders
These are people who look after children for payment or reward, in a home that is not the child’s own. Childminders have the option to register either with Ofsted or with a childminder agency.
Childcare on non-domestic premises
These are nurseries, pre-schools, holiday clubs and other group-based settings.
Home childcarers
These are individuals who care for children wholly or mainly in the child’s own home (for example, nannies).
Childcare on domestic premises
These are providers where 4 or more people look after children together in a home that is not the child’s.
Further information about provider types is available in the glossary.
Childcare in early years is also provided in the schools sector. It is offered in state-funded schools and independent schools. For more information, see the early years provision in the schools sector section of this page.
Providers and registers
Number of providers
There were 65,600 childcare providers registered with Ofsted on 31 August 2022, down by 8% (5,400) in the last year.[footnote 1] Since 31 August 2019, the number of providers has fallen by 14% (10,600).
Figure 2: Childcare providers registered with Ofsted as at 31 August 2022, by provider type

Note: numbers are rounded to the nearest 100.
‘Broadly stable’ is used when the change in the number of providers is lower than 20.
View data in an accessible table format.
The number of childcare places has not decreased at the same rate as the number of providers. While the number of providers has fallen by 8% since August 2021, the number of places has only decreased by 2%. This is due to an increase in the number of places offered by each provider over time. On 31 August 2022, there were 1.28 million childcare places offered by providers registered on the EYR.[footnote 2]
Figure 3: Number of childcare places offered by providers on the EYR as at 31 August 2022, by provider type

Note: place numbers of less than 1 million are rounded to the nearest 100. Place numbers of more than 1 million are rounded to the nearest 10,000.
View data in an accessible table format.
For methodological notes on places data, see the methodology and quality report that accompanies this release.
Registers
Childcare providers can be registered on one or more of the following registers:
-
EYR
-
Childcare Register (CR), which is divided into 2 parts:
-
compulsory part of the Childcare Register (CCR)
-
voluntary part of the Childcare Register (VCR)
Further information about these registers is provided in the glossary.
On 31 August 2022, 78% (51,100) of Ofsted-registered childcare providers were on the EYR (see Figure 4). The remaining 22% were only registered on the CR.
Figure 4: Venn diagram of Ofsted-registered providers, by the different registers for childcare

Note: numbers under 100 are rounded to the nearest 10 and numbers over 100 are rounded to the nearest 100, therefore they may not sum to the total
View data in an accessible table format.
Inspections and regulatory activity
Most recent inspections of providers on the EYR
On 31 August 2022, 78% (39,900) of eligible providers on the EYR had received a full inspection.[footnote 3] Full EYR inspections result in a graded judgement of outstanding, good, requires improvement or inadequate. At their most recent inspection, 96% of all childcare providers on the EYR were judged either good or outstanding. This has remained relatively unchanged since 31 August 2019, which was just before we introduced the education inspection framework (EIF). However, over the same period, the proportion of outstanding providers has substantially decreased, from 20% to 15% (see Figure 1).
The current overall effectiveness profile may have been influenced by the quality of the providers leaving the sector. Of the 7,500 providers that left the EYR between August 2021 and August 2022, around 4,700 had received a full inspection. Of these, 15% had been judged outstanding. Around 6% of providers who left had received a judgement of requires improvement or inadequate at their most recent inspection, compared with only 4% of active providers.
Inspections and regulatory activity between 1 September 2021 and 31 August 2022
During 2021/22, we returned to a full programme of inspections after the pause during the pandemic. Since September 2021, our activity has included around 11,700 EYR and 400 CR inspections as well as 2,200 registration visits to prospective providers and 6,000 regulatory events, which include face-to-face visits and phone calls (see Figure 5).
Figure 5: Inspections and regulatory activity between 1 September 2021 and 31 August 2022

Note: numbers are rounded to the nearest 100.
Our agreement with the government is to inspect 10% of providers on the CR each financial year. The number of CR inspections reported above is by academic year and it may therefore appear lower than 10%.
View data in an accessible table format.
Around 9,700 events were full inspections of providers registered on the EYR. Of these, about 40% were first inspections of recently registered providers and 10% were inspections of providers previously judged requires improvement or inadequate (see Figure 6).
Figure 6: Overall effectiveness of active early years registered providers inspected between 1 September 2021 and 31 August 2022, by previous inspection outcome
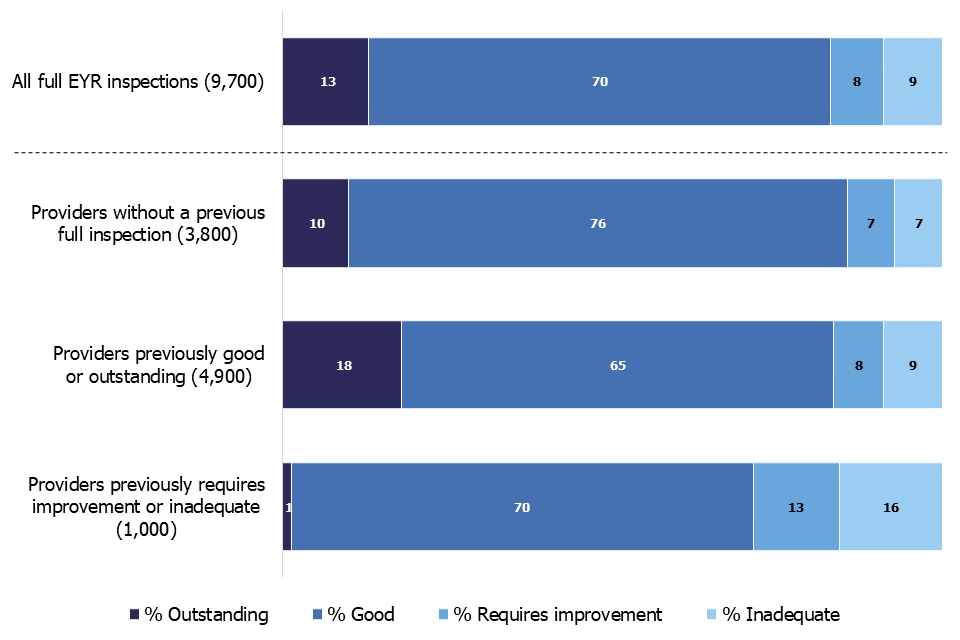
Note: numbers are rounded to the nearest 100.
Numbers in brackets refer to the number of inspected providers (rounded).
The number of providers who were previously judged requires improvement includes a small number of inspections where the provider was judged satisfactory.
View data in an accessible table format.
Early years provision in the schools sector
Early years provision is also offered in the schools sector. This is provided in state-funded nurseries (maintained nursery schools) or within state-funded and independent schools.
On 31 August 2022, there were 400 state-funded nursery schools in England. The majority of them (62%) were judged outstanding and 36% were judged good at their most recent inspection.
In state-funded schools (other than nursery schools) and in non-association independent schools, early years provision is given a separate judgement as part of the overall inspection of the school (see Table 1). If nurseries within schools are looking after children aged younger than 2, they are required to register on the EYR, and are therefore covered in the previous sections of this report.
Table 1: Quality of early years provision in the schools sector, at the school’s most recent inspection
| Number of schools with an EY judgement | Outstanding | Good | Requires improvement | Inadequate | |
|---|---|---|---|---|---|
| State-funded schools | 10,900 | 19% | 70% | 9% | 2% |
| Non-association independent schools | 200 | 18% | 60% | 14% | 8% |
Note: numbers are rounded to the nearest 100. Percentages might not add up to due to rounding.
This table does not include state-funded nursery schools.
For more information on school inspections and outcomes, refer to our statistics collection on state-funded school inspections and outcomes. For more information on non-association independent school inspections and outcomes, see our statistics on non-association independent schools.
Please note that Ofsted only inspects non-association independent schools. The Independent Schools Inspectorate inspects association independent schools.
A focus on childminders
Registration
A childminder is a person who is registered to look after one or more children, to whom they are not related, for payment or reward. Childminders work on domestic premises alongside no more than 2 other childminders or assistants. The majority of childminders register on the EYR because they look after children aged 0 to 5, but those who look after 5- to 7-year-olds need to register on the CCR.
Since September 2014, childminders can also choose to register with a childminder agency instead of registering directly with Ofsted. Childminder agencies are responsible for carrying out quality assurance visits to the childminders who are registered with them.
Data for childminder agencies is available in the provider-level data file accompanying this release.
Long-term trend in the number of childminders
On 31 August 2022, there were 29,600 childminders registered with Ofsted. In addition to these, there were 7 childminder agencies reporting a total of 1,300 childminders on roll.
Over the last 10 years, there has been a consistent downward trend in the number of Ofsted-registered childminders. On 31 August 2022, there were 48% (27,800) fewer providers registered with us than on 31 August 2012. This decline is due to more providers leaving than joining the childcare sector (see Figure 7).
For each of the past 10 years, the proportion of childminders leaving the registers has remained relatively stable, fluctuating between 12% and 17% of the total number of childminders. On the other hand, the proportion of providers joining each year has progressively decreased. In 2021/22, only 1,500 childminders joined our registers, which is the lowest number of annual joiners to date.
Figure 7: Childminders joiners and leavers since 2012/13

Note: most leavers are provider resignations and most joiners are new provider registrations, but some will be providers moving between the EYR and the CR.
View data in an accessible table format.
The number of places offered by childminders has also declined over time. On 31 August 2022, there were 36% (102,000) fewer childcare places than on 31 August 2012. The decrease in the number of places has been proportionally lower in London and the East of England, where places have fallen by 29% in the last 10 years (see Figure 8). Over the same period, the South West and the South East regions have lost the highest proportion of places: 44% and 43% respectively.
Figure 8: Change in the number of places offered by childminders since 31 August 2012, by region

Note: numbers are rounded to the nearest 100.
View data in an accessible table format.
Geographical distribution
Childminders are not evenly distributed across the country. For example, almost 40% of all childminders are in London and the South East region. Deprivation might play a role in the geographical distribution of childminders. The most deprived areas of the country have proportionally fewer childminders compared with other areas of lower deprivation.
The distribution of childminders across the country might also depend on demand. The number of places offered by childminders in each region is roughly proportional to the size of the population aged 0 to 7.[footnote 4] At national level, there are approximately 28 children aged 0 to 7 for each place offered by childminders. In the West Midlands, this figure is greatly above the national level, with 38 children aged 0 to 7 per place offered by childminders (see Figure 9).
Figure 9: Number of children aged 0 to 7 per place offered by childminders, by region

View data in an accessible table format.
Quality of the sector
On 31 August 2022, the proportion of childminders who were judged good or outstanding at their most recent inspection was 97%, which is slightly higher than other provider types (see Figure 10). However, the proportion of childminders judged outstanding (12%) was lower than other provider types.
Figure 10: Overall effectiveness of active early years registered providers at their most recent inspection, by provider type

Note: numbers are rounded to the nearest 100.
Numbers in brackets refer to the number of inspected providers (rounded).
View data in an accessible table format.
The overall quality of childminders registered on the EYR has improved since 31 August 2019, with the proportion of providers judged good or outstanding increasing by 2 percentage points. However, the proportion of providers judged as outstanding has declined by 5 percentage points over the same period.
Ofsted also inspects childminder agencies, with 2 potential inspection outcomes: effective or ineffective. Childminder agencies are only eligible for inspection when they have childminders on roll. On 31 August 2022, only 5 out of the 7 childminder agencies registered with Ofsted reported childminders on roll, and were therefore eligible for inspection. Of these, 4 agencies have been inspected and judged effective.
Notes
There is an explanation about the main uses of this data, further contextual information and the arrangements for quality assurance in the methodology and quality report accompanying this release.
The methodology and quality report also provides information on the strengths and limitations of the statistics.
Education inspection framework
On 1 September 2019, we began inspecting under the EIF. The EIF helps to support consistency across inspections of early years and childcare providers, maintained schools, academies, non-association independent schools, and further education and skills providers in England. We evaluate the overall quality and standards of the early years provision in line with the principles and requirements of the early years foundation stage statutory framework. Inspectors judge the overall effectiveness of the early years provision, taking into account 4 judgements:
-
quality of education
-
behaviour and attitudes
-
personal development
-
effectiveness of leadership and management
Glossary
Definitions of terms are in our statistical glossary.
Further information
We publish the following information on the inspection of early years providers:
Contact for comments or feedback
If you have any comments or feedback on this publication, you should contact Anita Patel on 03000 130 914 or Anita.Patel@ofsted.gov.uk.
Annual Report
We will publish findings from our forthcoming Annual Report on 13 December 2022.
Acknowledgements
Thanks to the following for their contribution to this statistical release: Giada Maugeri, Richard Smith, Chris Dinham, Helen Woodley, Rebecca Vincent, Elisabeth Yarwood, Mundeep Gill and Austen Norris.
Annex: data tables for figures
This section contains the underlying data in an accessible table format for all figures.
Data for figure 1: Overall effectiveness of active early years registered providers at their most recent inspection over time
| Number of inspected providers | % providers judged outstanding | % providers judged good | % providers judged requires improvement | % providers judged inadequate | |
|---|---|---|---|---|---|
| 31 August 2022 | 39,900 | 15 | 82 | 2 | 1 |
| 31 August 2021 | 40,900 | 17 | 80 | 2 | 1 |
| 31 August 2020 | 43,700 | 17 | 79 | 3 | 1 |
| 31 August 2019 | 49,800 | 20 | 76 | 3 | 1 |
See Figure 1.
Data for figure 2: Childcare providers registered with Ofsted as at 31 August 2022, by provider type
| Provider type | Number of providers as at 31 August 2022 | Change since August 2021 | Change since August 2019 |
|---|---|---|---|
| All providers | 65,600 | -5,400 | -10,600 |
| Childminders | 29,600 | -4,100 | -8,800 |
| Childcare on non-domestic premises | 27,000 | -300 | -500 |
| Childcare on domestic premises | 200 | broadly stable | broadly stable |
| Home childcarers | 8,700 | -1,000 | -1,300 |
See Figure 2.
Data for figure 3: Number of childcare places offered by providers on the EYR as at 31 August 2022, by provider type
| Provider type | Number of places as at 31 August 2022 | % of total places on the EYR |
|---|---|---|
| Childcare on non-domestic premises | 1,090,000 | 85% |
| Childcare on domestic premises | 5,200 | <1% |
| Childminders | 180,000 | 14% |
See Figure 3.
Data for figure 4: Venn diagram of Ofsted-registered providers, by the different registers for childcare
| Register combination | Number of childcare providers by register combination |
|---|---|
| EYR | 51,100 |
| CCR | 47,200 |
| VCR | 53,600 |
| EYR, CCR and VCR | 39,300 |
| EYR and CCR | 5,000 |
| EYR and VCR | 50 |
| CCR and VCR | 2,800 |
| EYR only | 6,800 |
| CCR only | 200 |
| VCR only | 11,500 |
See Figure 4.
Data for figure 5: Inspections and regulatory activity between 1 September 2021 and 31 August 2022
| Activity type | Number of events | Details |
|---|---|---|
| EYR inspections | 11,700 | 9,700 of these visits were full inspections. Of these, 40% were to providers without a previous full inspection, 50% were to providers previously judged good or outstanding, and 10% were to providers previously judged requires improvement or inadequate. |
| CR inspections | 400 | 41% of these visits were to home childcarers |
| Registration visits | 2,200 | More than half (56%) of these were prospective childminders intending to register on the EYR or CR, 32% were visits to childcare on non-domestic premises, 11% were visits to home childcarers and 1% were visits to childcare on domestic premises. |
| Regulatory events | 6,000 | About 42% of these visits were to childminders, 53% to childcare on non-domestic premises, 2% to childcare on domestic premises and 3% to home childcarers. |
See Figure 5.
Data for figure 6: Overall effectiveness of active early years registered providers inspected between 1 September 2021 and 31 August 2022, by previous inspection outcome
| Previous inspection outcome | Number of inspections | % providers judged outstanding | % providers judged good | % providers judged requires improvement | % providers judged inadequate |
|---|---|---|---|---|---|
| All full EYR inspections | 9,700 | 13 | 70 | 8 | 9 |
| Providers without a previous full inspection | 3,800 | 10 | 76 | 7 | 7 |
| Providers previously good/outstanding | 4,900 | 18 | 65 | 8 | 9 |
| Providers previously requires improvement/inadequate | 1,000 | 1 | 70 | 13 | 16 |
See Figure 6.
Data for figure 7: Childminders joiners and leavers since 2012/13
| Academic year | Joiners | Leavers | Total number of childminders |
|---|---|---|---|
| 2012/13 | 5,499 | 7,367 | 55,606 |
| 2013/14 | 5,214 | 8,724 | 51,771 |
| 2014/15 | 5,019 | 8,854 | 47,936 |
| 2015/16 | 4,180 | 7,430 | 44,686 |
| 2016/17 | 3,943 | 5,886 | 42,743 |
| 2017/18 | 3,412 | 5,376 | 40,779 |
| 2018/19 | 2,749 | 5,056 | 38,472 |
| 2019/20 | 2,877 | 4,718 | 36,631 |
| 2020/21 | 1,964 | 4,912 | 33,683 |
| 2021/22 | 1,530 | 5,588 | 29,625 |
See Figure 7.
Data for figure 8: Change in the number of places offered by childminders since 31 August 2012, by region
| Region | Number of places as at 31 Aug 2022 | Net loss of places since 2012 | Percentage change since 2012 |
|---|---|---|---|
| South East | 32,103 | 23,827 | -43% |
| London | 31,398 | 12,732 | -29% |
| East of England | 22,827 | 9,398 | -29% |
| North West | 21,924 | 10,794 | -33% |
| Yorkshire and the Humber | 19,533 | 9,129 | -32% |
| South West | 15,554 | 12,087 | -44% |
| East Midlands | 15,328 | 10,436 | -41% |
| West Midlands | 14,553 | 9,529 | -40% |
| North East | 7,999 | 4,118 | -34% |
See Figure 8.
Data for figure 9: Number of children aged 0 to 7 per place offered by childminders, by region
| Region | Number of children aged 0 to 7 per place offered by childminders |
|---|---|
| West Midlands | 38 |
| North West | 31 |
| London | 27 |
| South West | 29 |
| North East | 28 |
| East Midlands | 27 |
| South East | 25 |
| Yorkshire and the Humber | 25 |
| East of England | 25 |
See Figure 9.
Data for figure 10: Overall effectiveness of active early years registered providers at their most recent inspection, by provider type
| Provider type | Number of inspections | % providers judged outstanding | % providers judged good | % providers judged requires improvement | % providers judged inadequate |
|---|---|---|---|---|---|
| All providers on the EYR | 39,900 | 16 | 81 | 2 | 1 |
| Childminders | 23,400 | 12 | 84 | 2 | 1 |
| Childcare on non-domestic premises | 16,300 | 18 | 78 | 3 | 1 |
| Childcare on domestic premises | 200 | 20 | 70 | 4 | 5 |
See Figure 10.
-
Numbers are rounded to the nearest 100. ↩
-
Places numbers of less than one million are rounded to the nearest 100. Places numbers of more than one million are rounded to the nearest 10,000. ↩
-
A small proportion of providers may have only received a no-children-on-roll inspection. These are excluded from the total number of providers on the EYR that have received an inspection. We have also excluded providers that, under the EIF, are now classed as out-of-school day-care providers, but may have previously had a full EYR inspection. ↩
-
The size of the population aged 0 to 7 is based on ‘Demography and migration data, England and Wales: Census 2021’, Office for National Statistics, November 2022. ↩