Salmonid and fisheries statistics for England and Wales 2019
Updated 8 April 2021
Applies to England and Wales

© Crown copyright 2021
This publication is licensed under the terms of the Open Government Licence v3.0 except where otherwise stated. To view this licence, visit nationalarchives.gov.uk/doc/open-government-licence/version/3 or write to the Information Policy Team, The National Archives, Kew, London TW9 4DU, or email: psi@nationalarchives.gov.uk.
Where we have identified any third party copyright information you will need to obtain permission from the copyright holders concerned.
This publication is available at https://www.gov.uk/government/publications/salmonid-and-freshwater-fisheries-statistics-2019/salmonid-and-fisheries-statistics-for-england-and-wales-2019
This report provides a summary of the declared catches of salmon, sea trout, eels, smelt and lamprey by rods, nets and other fishing instruments for 2019. It covers England, Wales and the Border Esk in Scotland.
See the full Salmonid and freshwater fisheries data tables.
The Environment Agency and Natural Resources Wales use catch return data to assess and manage salmon and sea trout stocks in a sustainable way.
The catch data represents declared catches for 2019. You should not accept it as a definitive record of the total numbers of fish landed.
1. Status of salmon and sea trout stocks
The 2019 assessment of salmon stocks in England and Wales shows that the status of salmon populations continues to be of concern. The assessment places each river’s salmon stock into 1 of 4 categories with the strongest classed as ‘not at risk’ and the weakest as ‘at risk’.
In England:
- 39 of 42 principal salmon rivers were assessed as being ‘at risk’ or ‘probably at risk’
- none were categorised as ‘not at risk’
In Wales:
- all 22 principal salmon rivers were assessed as being ‘at risk’ or ‘probably at risk’
- none were categorised as ‘not at risk’
State of 64 principal salmon rivers in England and Wales 2019
Salmon rivers in England and Wales are assessed against a management objective. The management objective is the probability of a river’s salmon population exceeding its Conservation Limit in 4 years out of 5. The Conservation Limit is the minimum spawning stock level below which stocks should not be allowed to fall.
Figure 1 – Salmon stock status in England 2019
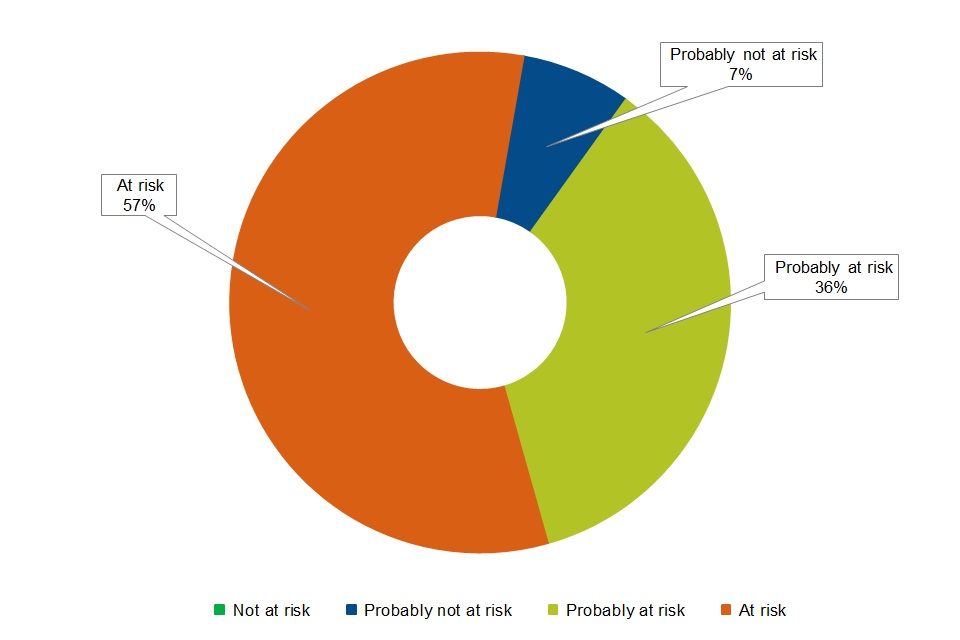
Figure 2 – Salmon stock status in Wales 2019
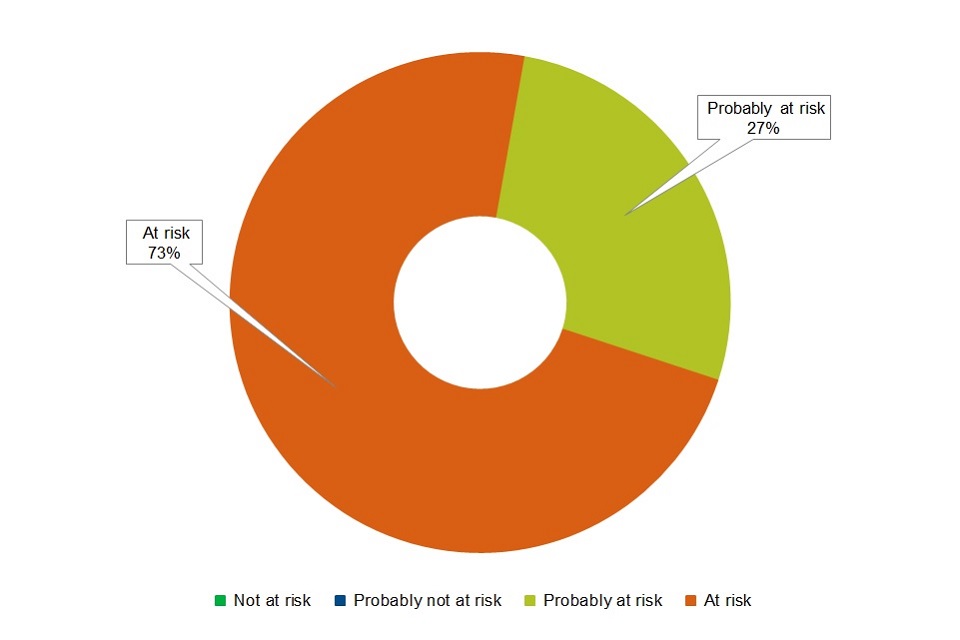
Figure 3 – Percentage of principal salmon rivers in each risk category assessed against the management objective, for 2004 to 2019 and as predicted for 2024 for rivers in England
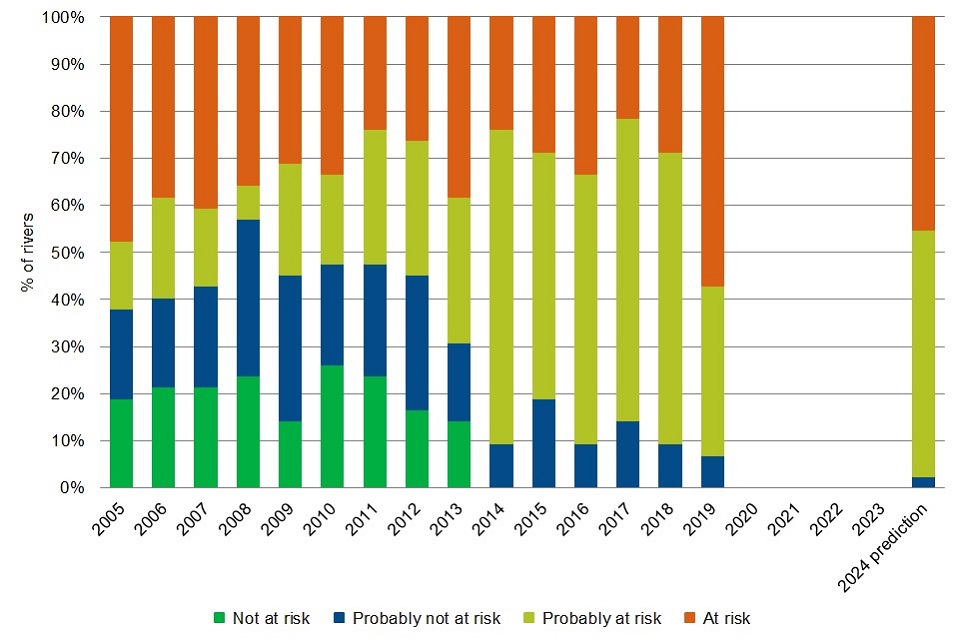
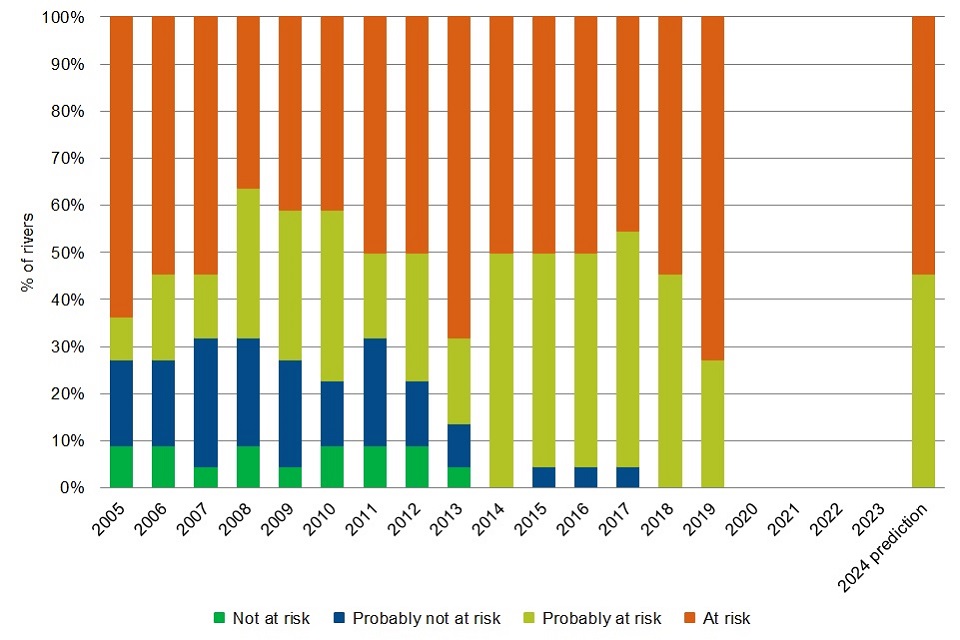
Figure 4 – Percentage of principal salmon rivers in each risk category assessed against the management objective, for 2004 to 2019 and as predicted for 2024 for rivers in Wales
2. Rod and net licence catch returns
The Environment Agency sent a total of 95,860 catch return reminders to salmon and sea trout licence holders. Reminders stated that licence holders must submit their catch returns at the end of the season (by 1 January). This is a requirement even if no fish are caught.
For net catch returns, 95% of logbooks were accounted for in 2019.
The total returns received for the 2019 season was 23,539 (76% of the total licences issued).
The Environment Agency introduced an updated online catch return service in 2018. The number and percentage of paper and online catch returns is shown in table 1.
Table 1 – Number and percentage of paper and online catch returns, 2017, 2018 and 2019
| Year | Total returns | Paper returns | Paper (%) | Online returns | Online (%) |
|---|---|---|---|---|---|
| 2017 | 20,772 | 7,182 | 35% | 13,590 | 65% |
| 2018 | 20,736 | 5,239 | 25% | 15,497 | 75% |
| 2019 | 23,539 | 4,974 | 21% | 18,565 | 79% |
3. National overview and summary of main findings
Table 2 – England and Wales summary of declared salmon and sea trout rod catches for in 2019 showing % change on 2018 and the 5-year mean (2014 to 2018)
| Rods | 2019 | 2018 | 5-year mean (2014 to 2018) | % change 2019 on 2018 | % change 2019 on 5-year mean |
|---|---|---|---|---|---|
| Licences issued* | 31,099 | 31,655 | 31,887 | -2% | -2% |
| Days declared fished* | 125,297 | 106,085 | 134,029 | 18% | -7% |
| Salmon caught | 9,163 | 7,787 | 10,799 | 18% | -15% |
| Salmon released | 8,171 | 6,857 | 8,783 | 19% | -7% |
| % salmon released | 89% | 88% | 81% | 1% | 10% |
| Sea trout caught | 21,330 | 13,608 | 23,785 | 57% | -10% |
| Sea trout released | 18,217 | 11,603 | 18,647 | 57% | -2% |
| % sea trout released | 85% | 85% | 78% | 0% | 9% |
*Salmon and sea trout rod licences only.
Table 3 – Summary of declared salmon and sea trout net catches in England and Wales for 2019 showing % change on 2018 and the 5-year mean (2014 to 2018)
| Nets | 2019 | 2018 | 5-year mean (2014 to 2018) | % change 2019 on 2018 | % change 2019 on 5-year mean |
|---|---|---|---|---|---|
| Licences issued | 154 | 231 | 265 | -33% | -42% |
| Salmon caught | 453* | 10,645 | 14,039 | -96% | -97% |
| Sea trout caught | 14,599 | 24,082 | 43,276 | -39% | -66% |
*306 fish released (68%).
Rods summary
These are the rod statistics for 2019.
The number of salmon and sea trout rod licences issued (31,099) decreased by 2% compared with 2018. This represents a 2% decrease when compared with the 5-year mean (31,887).
The total declared salmon caught by rod (9,163) increased by 18% compared with 2018 (7,787). This represents a 15% decrease when compared with the 5-year mean (10,799).
The total declared sea trout caught by rod (21,330) increased by 57% compared with 2018 (13,608). This represents a 10% decrease when compared with the 5-year mean (23,785).
Catch-and-release rates for rod caught salmon (89%) and sea trout (85%) showed an increase of 1% for salmon and remained the same for sea trout on those recorded in 2018.
Anglers using a fly caught salmon 51% (4,698) and sea trout 56% (11,860). Spinning yielded 38% (3,482) of salmon and 33% (7,116) of sea trout. Bait captured 9% (846) of salmon and 9% (2,000) of sea trout. There was no method information for 491 catches.
The River Tyne had the highest declared rod catch of salmon (2,968). This accounted for 32% of the total for England and Wales. Next were the Wear (667), Eden (530) and Coquet (530).
The River Teifi had the highest declared rod catch of sea trout (2,035). This accounted for 10% of the total for England and Wales. Next were the Dyfi/Dovey (1,699), Tywi/Towy (1,211) and Tyne (1,175).
For salmon on the Wye, Test and Itchen, we have used catch data from official catch returns. This is in preference to owner’s data which we have used in the past.
Nets summary
These are the nets statistics for 2019.
A total of 154 salmon and sea trout commercial net licences were issued. This compares with 231 in 2018 and a 5-year mean of 265. Since 1985 there has been an 85% reduction in the number of net licences issued annually in England and Wales (from 1,026 to 154).
The salmon net catch (453) decreased by 96% compared with 2018 (10,645) and decreased by 97% when compared with the 5-year mean (14,039). All net fisheries showed decreases in salmon caught – most notably North East (9,433 to 129), South West (232 to 5) and Midlands (102 to 4).
Of the 453 salmon caught by net fishers in 2019, 68% were released (306).
The average weight of net caught salmon was 3.76kg. This compares with an average weight of 4.31kg for rod caught salmon. In 2018 the average weight of net caught salmon was 3.6kg and that for rod caught salmon was 4.38kg.
Net fisheries exempted from the ‘spring’ byelaws (that is those targeting sea trout) released all salmon before 1 June.
A total of 14,599 sea trout were declared caught by the net fisheries, a decrease of 39% compared with the 2018 catch of 24,082 and a decrease of 66% compared with the 5-year mean of 43,276.
The average weight of net caught sea trout was 1.56kg. This compares with an average weight of 0.86kg for rod caught sea trout. In 2018 the average weight of net caught sea trout was 1.73kg and that for rod caught sea trout was 0.87kg.
Table 4 – Number of net and fixed engine licences issued (1985 to 2019) and total number of days fished by salmon and sea trout rod licence holders (1994 to 2019), England and Wales
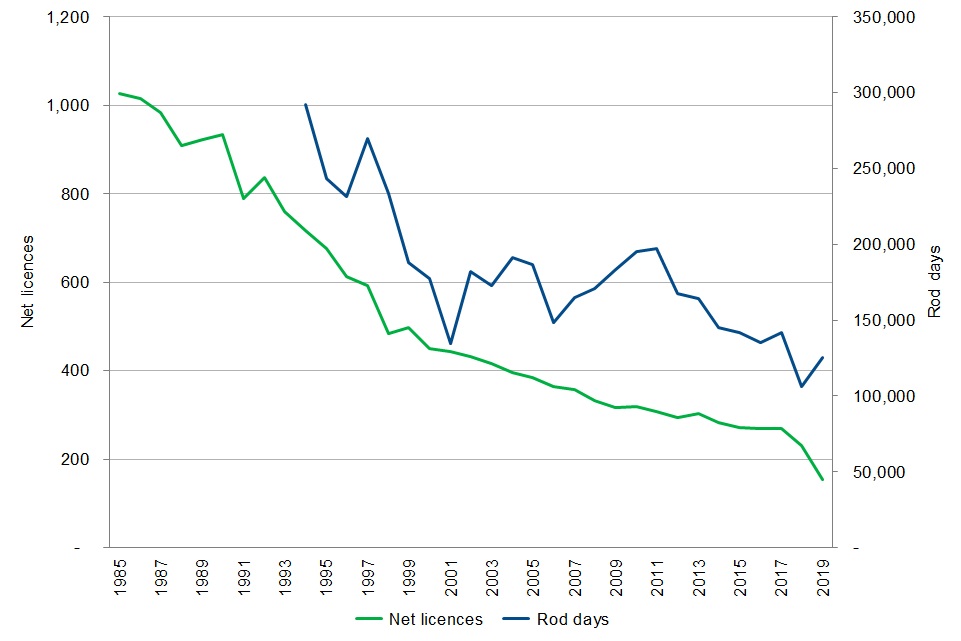
| Year | Net licences | Rod days |
|---|---|---|
| 1985 | 1,026 | - |
| 1986 | 1,016 | - |
| 1987 | 983 | - |
| 1988 | 908 | - |
| 1989 | 923 | - |
| 1990 | 933 | - |
| 1991 | 789 | - |
| 1992 | 837 | - |
| 1993 | 760 | - |
| 1994 | 716 | 292,449 |
| 1995 | 677 | 243,288 |
| 1996 | 613 | 231,744 |
| 1997 | 593 | 269,705 |
| 1998 | 484 | 233,401 |
| 1999 | 498 | 187,998 |
| 2000 | 449 | 177,532 |
| 2001 | 444 | 134,853 |
| 2002 | 432 | 181,850 |
| 2003 | 417 | 172,729 |
| 2004 | 395 | 191,205 |
| 2005 | 385 | 186,877 |
| 2006 | 363 | 148,307 |
| 2007 | 357 | 164,679 |
| 2008 | 333 | 171,033 |
| 2009 | 317 | 183,287 |
| 2010 | 319 | 195,086 |
| 2011 | 308 | 196,902 |
| 2012 | 294 | 167,257 |
| 2013 | 304 | 164,449 |
| 2014 | 283 | 144,914 |
| 2015 | 272 | 141,811 |
| 2016 | 269 | 135,393 |
| 2017 | 269 | 141,943 |
| 2018 | 231 | 106,085 |
| 2019 | 154 | 125,297 |
Note: The term fixed engine is an ancient one used in the UK as a general descriptor of stationary fishing gears.
Table 5 – Total declared salmon rod catch for England and Wales, 1956 to 2019
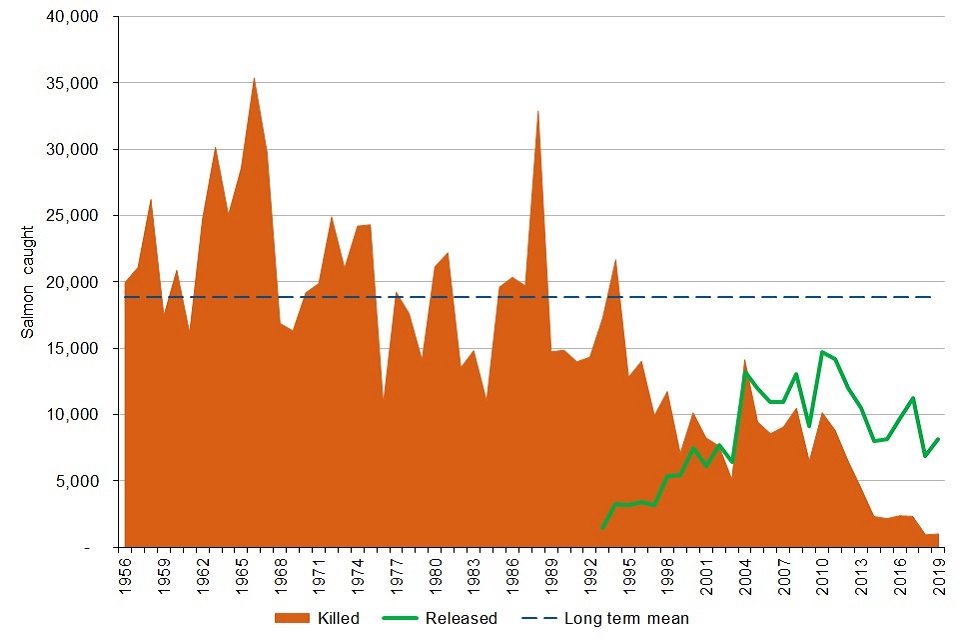
| Year | Total | Killed | Released |
|---|---|---|---|
| 1956 | 19,955 | 19,955 | – |
| 1957 | 21,090 | 21,090 | – |
| 1958 | 26,209 | 26,209 | – |
| 1959 | 17,440 | 17,440 | – |
| 1960 | 20,873 | 20,873 | – |
| 1961 | 16,138 | 16,138 | – |
| 1962 | 24,743 | 24,743 | – |
| 1963 | 30,145 | 30,145 | – |
| 1964 | 25,034 | 25,034 | – |
| 1965 | 28,594 | 28,594 | – |
| 1966 | 35,353 | 35,353 | – |
| 1967 | 29,735 | 29,735 | – |
| 1968 | 16,860 | 16,860 | – |
| 1969 | 16,306 | 16,306 | – |
| 1970 | 19,180 | 19,180 | – |
| 1971 | 19,869 | 19,869 | – |
| 1972 | 24,889 | 24,889 | – |
| 1973 | 21,020 | 21,020 | – |
| 1974 | 24,197 | 24,197 | – |
| 1975 | 24,300 | 24,300 | – |
| 1976 | 10,779 | 10,779 | – |
| 1977 | 19,219 | 19,219 | – |
| 1978 | 17,605 | 17,605 | – |
| 1979 | 14,108 | 14,108 | – |
| 1980 | 21,145 | 21,145 | – |
| 1981 | 22,190 | 22,190 | – |
| 1982 | 13,524 | 13,524 | – |
| 1983 | 14,815 | 14,815 | – |
| 1984 | 11,022 | 11,022 | – |
| 1985 | 19,601 | 19,601 | – |
| 1986 | 20,347 | 20,347 | – |
| 1987 | 19,702 | 19,702 | – |
| 1988 | 32,876 | 32,876 | – |
| 1989 | 14,721 | 14,721 | – |
| 1990 | 14,849 | 14,849 | – |
| 1991 | 13,974 | 13,974 | – |
| 1992 | 14,319 | 14,319 | – |
| 1993 | 18,742 | 17,294 | 1,448 |
| 1994 | 24,891 | 21,664 | 3,227 |
| 1995 | 16,006 | 12,819 | 3,187 |
| 1996 | 17,444 | 14,016 | 3,428 |
| 1997 | 13,047 | 9,915 | 3,132 |
| 1998 | 17,109 | 11,738 | 5,371 |
| 1999 | 12,505 | 7,058 | 5,447 |
| 2000 | 17,596 | 10,126 | 7,470 |
| 2001 | 14,383 | 8,240 | 6,143 |
| 2002 | 15,282 | 7,624 | 7,658 |
| 2003 | 11,519 | 5,094 | 6,425 |
| 2004 | 27,336 | 14,125 | 13,211 |
| 2005 | 21,418 | 9,435 | 11,983 |
| 2006 | 19,509 | 8,550 | 10,959 |
| 2007 | 19,984 | 9,071 | 10,913 |
| 2008 | 23,512 | 10,477 | 13,035 |
| 2009 | 15,563 | 6,467 | 9,096 |
| 2010 | 24,826 | 10,135 | 14,691 |
| 2011 | 23,008 | 8,812 | 14,196 |
| 2012 | 18,450 | 6,498 | 11,952 |
| 2013 | 14,920 | 4,462 | 10,458 |
| 2014 | 10,307 | 2,315 | 7,992 |
| 2015 | 10,261 | 2,150 | 8,111 |
| 2016 | 12,068 | 2,367 | 9,701 |
| 2017 | 13,571 | 2,315 | 11,256 |
| 2018 | 7,787 | 930 | 6,857 |
| 2019 | 9,163 | 992 | 8,171 |
Table 6 – Total declared sea trout rod catch for England and Wales, 1978 to 2019
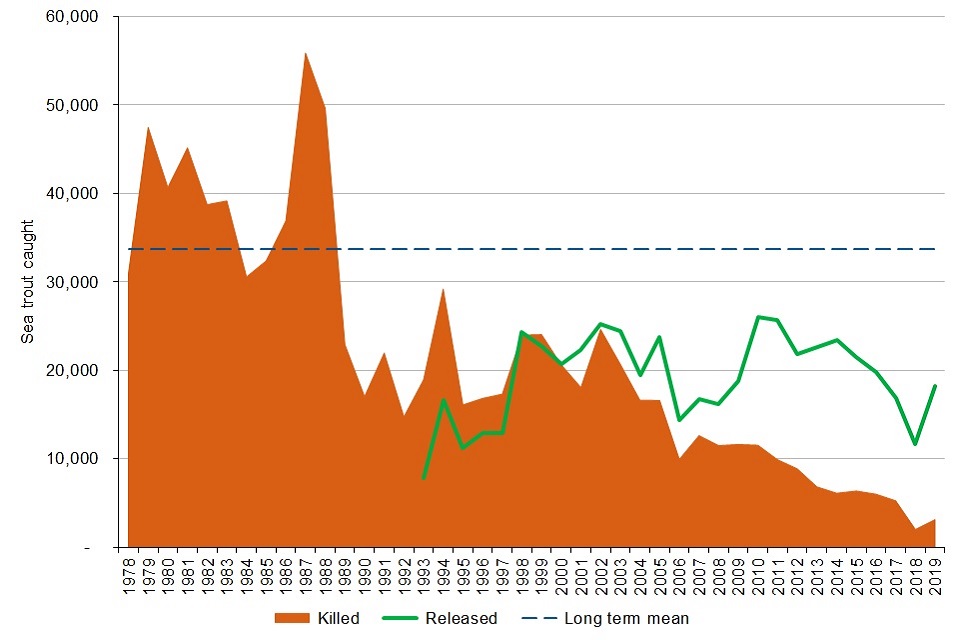
| Year | Total | Killed | Released |
|---|---|---|---|
| 1978 | 30,966 | 30,966 | - |
| 1979 | 47,462 | 47,462 | - |
| 1980 | 40,668 | 40,668 | - |
| 1981 | 45,152 | 45,152 | - |
| 1982 | 38,730 | 38,730 | - |
| 1983 | 39,157 | 39,157 | - |
| 1984 | 30,560 | 30,560 | - |
| 1985 | 32,379 | 32,379 | - |
| 1986 | 36,882 | 36,882 | - |
| 1987 | 55,863 | 55,863 | - |
| 1988 | 49,618 | 49,618 | - |
| 1989 | 22,910 | 22,910 | - |
| 1990 | 17,031 | 17,031 | - |
| 1991 | 21,951 | 21,951 | - |
| 1992 | 14,742 | 14,742 | - |
| 1993 | 26,685 | 18,931 | 7,754 |
| 1994 | 45,759 | 29,184 | 16,575 |
| 1995 | 27,335 | 16,091 | 11,244 |
| 1996 | 29,685 | 16,825 | 12,860 |
| 1997 | 30,142 | 17,302 | 12,840 |
| 1998 | 48,312 | 23,978 | 24,334 |
| 1999 | 46,797 | 24,035 | 22,762 |
| 2000 | 41,322 | 20,628 | 20,694 |
| 2001 | 40,392 | 18,061 | 22,331 |
| 2002 | 49,796 | 24,626 | 25,170 |
| 2003 | 45,101 | 20,698 | 24,403 |
| 2004 | 36,100 | 16,611 | 19,489 |
| 2005 | 40,319 | 16,590 | 23,729 |
| 2006 | 24,269 | 9,940 | 14,329 |
| 2007 | 29,398 | 12,622 | 16,776 |
| 2008 | 27,707 | 11,488 | 16,219 |
| 2009 | 30,354 | 11,616 | 18,738 |
| 2010 | 37,543 | 11,533 | 26,010 |
| 2011 | 35,564 | 9,884 | 25,680 |
| 2012 | 30,700 | 8,859 | 21,841 |
| 2013 | 29,427 | 6,820 | 22,607 |
| 2014 | 29,560 | 6,105 | 23,455 |
| 2015 | 27,851 | 6,348 | 21,503 |
| 2016 | 25,779 | 5,988 | 19,791 |
| 2017 | 22,135 | 5,251 | 16,884 |
| 2018 | 13,608 | 2,005 | 11,603 |
| 2019 | 21,330 | 3,113 | 18,217 |
Table 7 – Total declared salmon net and fixed engine catch for England and Wales, 1956 to 2019
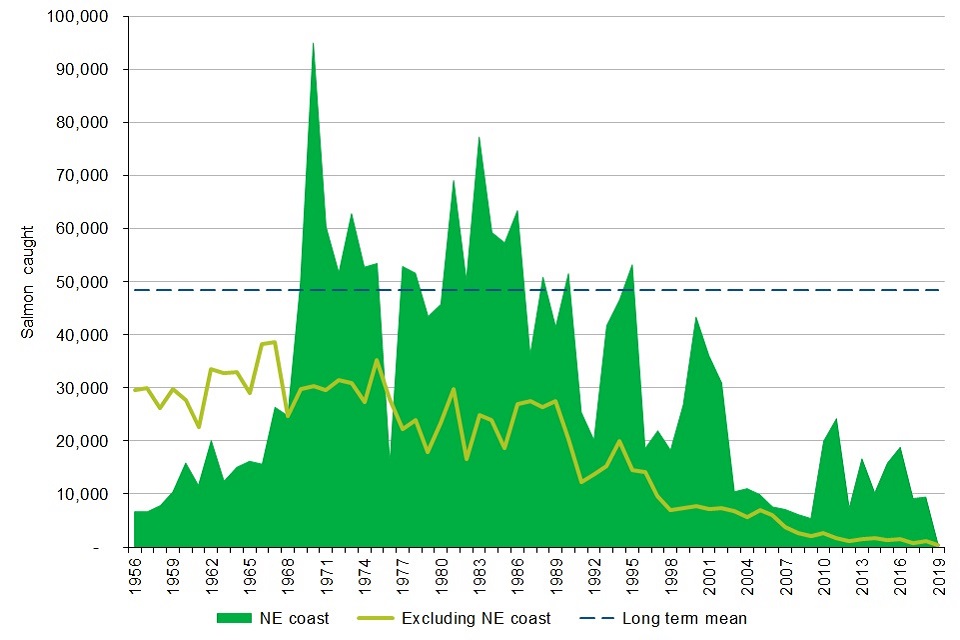
| Year | Total | Excluding NE coast | NE coast |
|---|---|---|---|
| 1956 | 36,225 | 29,564 | 6,661 |
| 1957 | 36,591 | 29,921 | 6,670 |
| 1958 | 34,075 | 26,264 | 7,811 |
| 1959 | 40,302 | 29,861 | 10,441 |
| 1960 | 43,648 | 27,792 | 15,856 |
| 1961 | 34,334 | 22,699 | 11,635 |
| 1962 | 53,559 | 33,469 | 20,090 |
| 1963 | 45,290 | 32,858 | 12,432 |
| 1964 | 47,947 | 32,907 | 15,040 |
| 1965 | 45,161 | 28,980 | 16,181 |
| 1966 | 53,970 | 38,336 | 15,634 |
| 1967 | 64,953 | 38,594 | 26,359 |
| 1968 | 49,380 | 24,630 | 24,750 |
| 1969 | 79,624 | 29,800 | 49,824 |
| 1970 | 125,244 | 30,253 | 94,991 |
| 1971 | 89,992 | 29,639 | 60,353 |
| 1972 | 83,185 | 31,504 | 51,681 |
| 1973 | 93,766 | 30,924 | 62,842 |
| 1974 | 80,128 | 27,372 | 52,756 |
| 1975 | 88,762 | 35,311 | 53,451 |
| 1976 | 43,515 | 27,814 | 15,701 |
| 1977 | 75,063 | 22,175 | 52,888 |
| 1978 | 75,520 | 23,890 | 51,630 |
| 1979 | 61,278 | 17,814 | 43,464 |
| 1980 | 69,073 | 23,293 | 45,780 |
| 1981 | 98,849 | 29,736 | 69,113 |
| 1982 | 66,765 | 16,598 | 50,167 |
| 1983 | 102,180 | 24,903 | 77,277 |
| 1984 | 83,249 | 23,954 | 59,295 |
| 1985 | 75,932 | 18,576 | 57,356 |
| 1986 | 90,447 | 27,022 | 63,425 |
| 1987 | 63,728 | 27,585 | 36,143 |
| 1988 | 77,317 | 26,468 | 50,849 |
| 1989 | 68,940 | 27,487 | 41,453 |
| 1990 | 71,827 | 20,297 | 51,530 |
| 1991 | 37,675 | 12,246 | 25,429 |
| 1992 | 33,849 | 13,705 | 20,144 |
| 1993 | 57,081 | 15,281 | 41,800 |
| 1994 | 66,457 | 19,903 | 46,554 |
| 1995 | 67,659 | 14,449 | 53,210 |
| 1996 | 32,680 | 14,099 | 18,581 |
| 1997 | 31,459 | 9,537 | 21,922 |
| 1998 | 25,179 | 6,914 | 18,265 |
| 1999 | 34,146 | 7,313 | 26,833 |
| 2000 | 50,998 | 7,644 | 43,354 |
| 2001 | 43,243 | 7,128 | 36,115 |
| 2002 | 38,279 | 7,299 | 30,980 |
| 2003 | 17,219 | 6,784 | 10,435 |
| 2004 | 16,581 | 5,564 | 11,017 |
| 2005 | 16,811 | 6,914 | 9,897 |
| 2006 | 13,578 | 6,012 | 7,566 |
| 2007 | 10,922 | 3,831 | 7,091 |
| 2008 | 8,798 | 2,668 | 6,130 |
| 2009 | 7,505 | 2,110 | 5,395 |
| 2010 | 22,615 | 2,633 | 19,982 |
| 2011 | 25,896 | 1,682 | 24,214 |
| 2012 | 8,429 | 1,130 | 7,299 |
| 2013 | 18,143 | 1,500 | 16,643 |
| 2014 | 11,976 | 1,766 | 10,210 |
| 2015 | 17,132 | 1,269 | 15,863 |
| 2016 | 20,307 | 1,488 | 18,824 |
| 2017 | 10,133 | 712 | 9,157 |
| 2018 | 10,645 | 1,212 | 9,433 |
| 2019 | 453 | 324 | 129 |
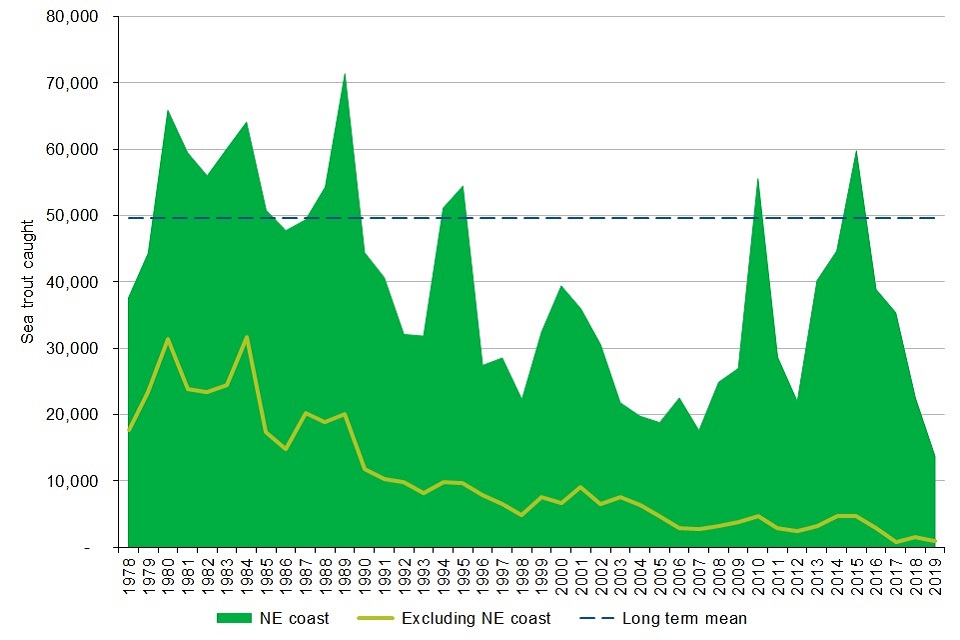
Table 8 – Total declared sea trout net and fixed engine catch for England and Wales, 1978 to 2019
| Year | Total | Excluding NE coast | NE coast |
|---|---|---|---|
| 1978 | 55,300 | 17,709 | 37,591 |
| 1979 | 67,667 | 23,352 | 44,315 |
| 1980 | 97,206 | 31,351 | 65,855 |
| 1981 | 83,333 | 23,852 | 59,481 |
| 1982 | 79,353 | 23,374 | 55,979 |
| 1983 | 84,511 | 24,442 | 60,069 |
| 1984 | 95,699 | 31,623 | 64,076 |
| 1985 | 68,130 | 17,351 | 50,779 |
| 1986 | 62,452 | 14,735 | 47,717 |
| 1987 | 69,556 | 20,217 | 49,339 |
| 1988 | 73,184 | 18,899 | 54,285 |
| 1989 | 91,487 | 20,118 | 71,369 |
| 1990 | 56,194 | 11,777 | 44,417 |
| 1991 | 50,903 | 10,250 | 40,653 |
| 1992 | 41,903 | 9,834 | 32,069 |
| 1993 | 39,887 | 8,073 | 31,814 |
| 1994 | 60,895 | 9,759 | 51,136 |
| 1995 | 64,128 | 9,689 | 54,439 |
| 1996 | 35,259 | 7,861 | 27,398 |
| 1997 | 34,986 | 6,464 | 28,522 |
| 1998 | 27,159 | 4,899 | 22,260 |
| 1999 | 40,068 | 7,610 | 32,458 |
| 2000 | 46,022 | 6,635 | 39,387 |
| 2001 | 44,926 | 8,994 | 35,932 |
| 2002 | 37,018 | 6,478 | 30,540 |
| 2003 | 29,248 | 7,477 | 21,771 |
| 2004 | 26,055 | 6,313 | 19,742 |
| 2005 | 23,429 | 4,656 | 18,773 |
| 2006 | 25,311 | 2,819 | 22,492 |
| 2007 | 20,351 | 2,785 | 17,566 |
| 2008 | 27,974 | 3,109 | 24,865 |
| 2009 | 30,755 | 3,798 | 26,957 |
| 2010 | 60,229 | 4,683 | 55,546 |
| 2011 | 31,559 | 2,922 | 28,637 |
| 2012 | 24,418 | 2,465 | 21,953 |
| 2013 | 43,376 | 3,182 | 40,194 |
| 2014 | 49,250 | 4,606 | 44,644 |
| 2015 | 64,468 | 4,726 | 59,742 |
| 2016 | 41,803 | 2,940 | 38,863 |
| 2017 | 37,002 | 810 | 35,372 |
| 2018 | 24,082 | 1,574 | 22,508 |
| 2019 | 14,599 | 926 | 13,673 |
4. Area catch summaries – 2019, 2018 and 5-year mean
Table 9 – Summary of salmon rod catches by area
| Environment Agency area | 2019 | 2018 | 5-year mean (2014-2018) | % change (+/-) 2019 on 2018 | % change (+/-) 2019 on 5-year mean |
|---|---|---|---|---|---|
| North East | 4,468 | 3,356 | 3,999 | 33% | 12% |
| Anglian | - | - | - | - | - |
| South East | 217 | 140 | 316 | 55% | -31% |
| South West | 656 | 598 | 1,158 | 10% | -43% |
| Midlands | 161 | 185 | 306 | -13% | -47% |
| North West | 2,172 | 2,209 | 2,526 | -2% | -14% |
| England | 7,674 | 6,488 | 8,305 | 18% | -8% |
| Wales | 1,489 | 1,299 | 2,494 | 15% | -40% |
| England and Wales | 9,163 | 7,787 | 10,799 | 18% | -15% |
Table 10 – Summary of sea trout rod catches by area
| Environment Agency area | 2019 | 2018 | 5-year mean (2014-2018) | % change (+/-) 2019 on 2018 | % change (+/-) 2019 on 5-year mean |
|---|---|---|---|---|---|
| North East | 2,894 | 1,918 | 2,810 | 51% | 3% |
| Anglian | 1 | - | 5 | - | -81% |
| South East | 728 | 801 | 979 | -9% | -26% |
| South West | 3,640 | 2,303 | 3,912 | 58% | -7% |
| Midlands | 8 | 16 | 23 | -50% | -65% |
| North West | 4,260 | 3,210 | 5,466 | 33% | -22% |
| England | 11,531 | 8,248 | 13,194 | 40% | -13% |
| Wales | 9,799 | 5,360 | 10,590 | 83% | -7% |
| England and Wales | 21,330 | 13,608 | 23,785 | 57% | -10% |
Table 11 – Summary of salmon net and fixed engine catches by area
| Environment Agency area | 2019 | 2018 | 5-year mean (2014-2018) | change (+/-) 2019 on 2018 | % change (+/-) 2019 on 5-year mean |
|---|---|---|---|---|---|
| North East | 129 | 9,433 | 12,815 | -99% | -99% |
| Anglian | - | - | 2 | - | -100% |
| South East | - | - | - | - | - |
| South West | 5 | 232 | 302 | -98% | -98% |
| Midlands | 4 | 102 | 124 | -96% | -97% |
| North West | 126 | 561 | 550 | -78% | -77% |
| England | 264 | 10,328 | 13,792 | -97% | -98% |
| Wales | 189 | 317 | 246 | -40% | -23% |
| England and Wales | 453 | 10,645 | 14,039 | -96% | -97% |
Table 12 – Summary of sea trout net and fixed engine catches by area
| Environment Agency area | 2019 | 2018 | 5-year mean (2014-2018) | % change (+/-) 2019 on 2018 | % change (+/-) 2019 on 5-year mean |
|---|---|---|---|---|---|
| North East | 13,673 | 22,508 | 40,666 | -39% | -66% |
| Anglian | 163 | 219 | 314 | -26% | -48% |
| South East | - | - | 1 | - | -100% |
| South West | 85 | 147 | 298 | -42% | -71% |
| Midlands | - | - | - | - | - |
| North West | 167 | 433 | 679 | -61% | -75% |
| England | 14,088 | 23,307 | 41,959 | -40% | -66% |
| Wales | 511 | 775 | 1,318 | -34% | -61% |
| England and Wales | 14,599 | 24,082 | 43,276 | -39% | -66% |
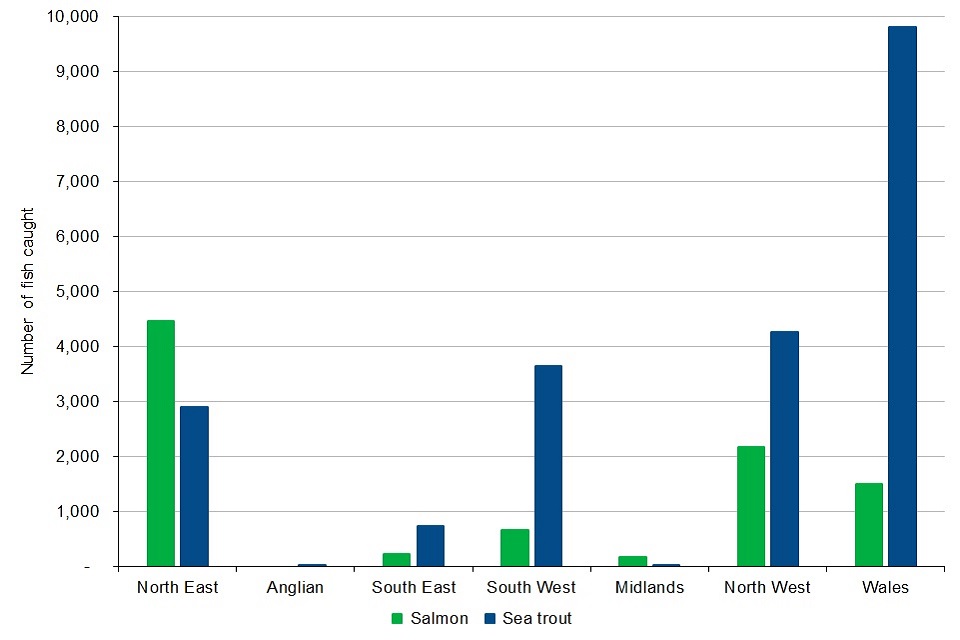
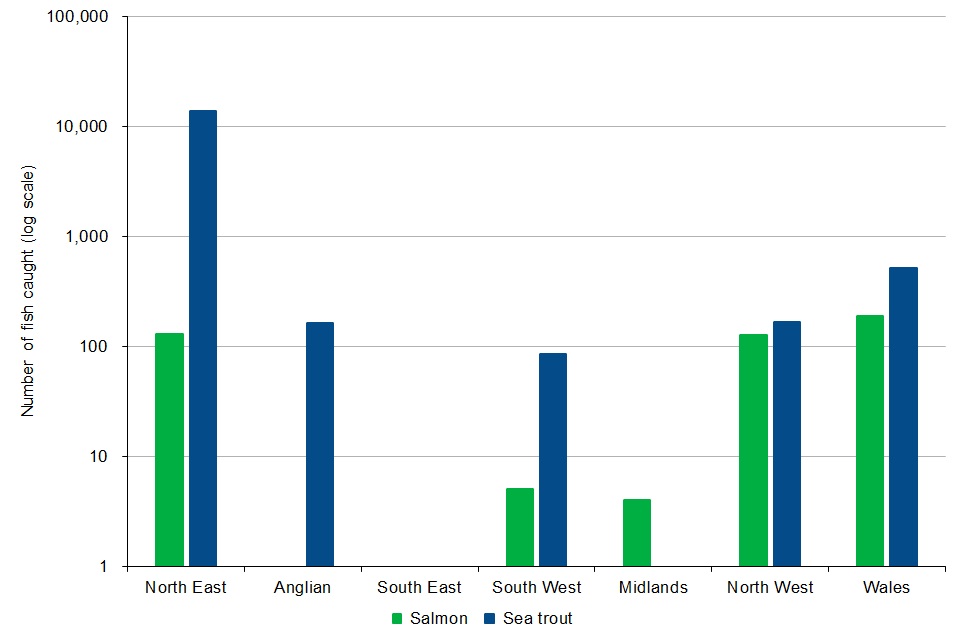
Figure 5 – Declared salmon and sea trout rod catches by area
| Environment Agency area | Salmon | Sea trout |
|---|---|---|
| North East | 4,468 | 2,894 |
| Anglian | - | 1 |
| South East | 217 | 728 |
| South West | 656 | 3,640 |
| Midlands | 161 | 8 |
| North West | 2,172 | 4,260 |
| Wales | 1,489 | 9,799 |
| Total | 9,163 | 21,330 |
Figure 6 – Declared salmon and sea trout net and fixed engine catches by area
| Environment Agency area | Salmon | Sea trout |
|---|---|---|
| North East | 129 | 13,673 |
| Anglian | - | 163 |
| South East | - | - |
| South West | 5 | 85 |
| Midlands | 4 | - |
| North West | 126 | 167 |
| Wales | 189 | 511 |
| Total | 453 | 14,599 |
5. River catch summaries by area
Table 13 – Salmon rod catches 2019
North East salmon rod catches
| River | Salmon caught | Salmon released | Percentage released |
|---|---|---|---|
| Aln | 5 | 5 | 100% |
| Coquet | 530 | 491 | 93% |
| Tyne | 2,968 | 2,558 | 86% |
| Wear | 667 | 573 | 86% |
| Tees | 25 | 24 | 96% |
| Esk (Yorks) | 74 | 73 | 99% |
| Ouse (Yorks) | 199 | 198 | 99% |
| Other | - | - | - |
| Total | 4,468 | 3,922 | 88% |
South East salmon rod catches
| River | Salmon caught | Salmon released | Percentage released |
|---|---|---|---|
| Itchen | 122 | 122 | 100% |
| Test | 94 | 94 | 100% |
| Other | 1 | 1 | 100% |
| Total | 217 | 217 | 100% |
South West salmon rod catches
| River | Salmon caught | Salmon released | Percentage released |
|---|---|---|---|
| Avon (Hants) | 31 | 31 | 100% |
| Frome | 53 | 53 | 100% |
| Axe | 5 | 5 | 100% |
| Exe | 96 | 88 | 92% |
| Teign | 39 | 34 | 87% |
| Dart | 14 | 13 | 93% |
| Avon (Devon) | 7 | 7 | 100% |
| Erme | 1 | 1 | 100% |
| Yealm | - | - | - |
| Plym | 5 | 5 | 100% |
| Tavy | 25 | 20 | 80% |
| Lynher | 27 | 25 | 93% |
| Tamar | 101 | 92 | 91% |
| Fowey | 52 | 51 | 98% |
| Camel | 58 | 58 | 100% |
| Torridge | 14 | 14 | 100% |
| Taw | 78 | 70 | 90% |
| Lyn | 46 | 46 | 100% |
| Other | 4 | 4 | 100% |
| Total | 656 | 617 | 94% |
Midlands salmon rod catches
| River | Salmon caught | Salmon released | Percentage released |
|---|---|---|---|
| Severn | 159 | 157 | 99% |
| Other | 2 | 2 | 100% |
| Total | 161 | 159 | 99% |
North West salmon rod catches
| River | Salmon caught | Salmon released | Percentage released |
|---|---|---|---|
| Ribble | 380 | 369 | 97% |
| Wyre | - | - | - |
| Lune | 255 | 205 | 80% |
| Kent | 126 | 108 | 86% |
| Crake | 6 | 6 | 100% |
| Leven | 41 | 41 | 100% |
| Duddon | 37 | 34 | 92% |
| Irt | 38 | 33 | 87% |
| Esk (Cumbrian) | 39 | 37 | 95% |
| Calder | 5 | 5 | 100% |
| Ehen | 132 | 104 | 79% |
| Derwent | 182 | 162 | 89% |
| Ellen | - | - | - |
| Eden | 530 | 516 | 97% |
| Esk (Border) | 400 | 381 | 95% |
| Other | 1 | 1 | 100% |
| Total | 2,172 | 2,002 | 92% |
England total
Total number of salmon rod catches for 2019:
- salmon caught – 7,674
- salmon released – 6,917
- percentage released – 90%
Wales salmon rod catches
| River | Salmon caught | Salmon released | Percentage released |
|---|---|---|---|
| Wye | 243 | 242 | 100% |
| Usk | 216 | 197 | 91% |
| Taff | 11 | 7 | 64% |
| Ogmore | 13 | 13 | 100% |
| Afan | 8 | 4 | 50% |
| Neath | 7 | 6 | 86% |
| Tawe | 19 | 16 | 84% |
| Loughor | 13 | 9 | 69% |
| Gwendraeth Fach | - | - | - |
| Tywi/Towy | 186 | 111 | 60% |
| Taf | 28 | 17 | 61% |
| Cleddau (E&W) | 23 | 19 | 83% |
| Nevern | 5 | 5 | 100% |
| Teifi | 142 | 102 | 72% |
| Ystwyth | 3 | 2 | 67% |
| Rheidol | 6 | 6 | 100% |
| Dyfi/Dovey | 65 | 45 | 69% |
| Dysynni | 2 | 2 | 100% |
| Mawddach | 59 | 52 | 88% |
| Artro | 1 | 1 | 100% |
| Dwyryd | 1 | 0 | 0% |
| Glaslyn | 11 | 10 | 91% |
| Dwyfawr | 8 | 7 | 88% |
| Gwyrfai | 1 | 1 | 100% |
| Seiont | 10 | 6 | 60% |
| Ogwen | 57 | 47 | 82% |
| Conwy | 119 | 110 | 92% |
| Clwyd | 19 | 18 | 95% |
| Dee | 211 | 198 | 94% |
| Other | 2 | 1 | 50% |
Wales total
Total number of salmon rod catches for 2019:
- salmon caught – 1,489
- salmon released – 1,254
- percentage released – 84%
England and Wales total
Total number of salmon rod catches for 2019:
- salmon caught – 9,163
- salmon released – 8,171
- percentage released – 89%
Table 14 – sea trout rod catches 2019
North East sea trout rod catches
| River | Sea trout caught | Sea trout released | Percentage released |
|---|---|---|---|
| Aln | 4 | 3 | 75% |
| Coquet | 279 | 247 | 89% |
| Tyne | 1,175 | 929 | 79% |
| Wear | 770 | 644 | 84% |
| Tees | 3 | 3 | 100% |
| Esk (Yorks) | 586 | 474 | 81% |
| Ouse (Yorks) | 57 | 54 | 95% |
| Other | 20 | 14 | 70% |
| Total | 2,894 | 2,368 | 82% |
Anglian sea trout rod catches
Total number of:
- sea trout caught – 1
- sea trout released – 1
- percentage released – 100%
South East sea trout rod catches
| River | Sea trout caught | Sea trout released | Percentage released |
|---|---|---|---|
| Thames | 1 | 0 | 0% |
| Rother (Petworth) | 9 | 8 | 89% |
| Ouse (Sussex) | 13 | 13 | 100% |
| Itchen | 404 | 387 | 96% |
| Test | 190 | 176 | 93% |
| Beaulieu | 18 | 13 | 72% |
| Lymington | 35 | 34 | 97% |
| Other | 58 | 48 | 83% |
| Total | 728 | 679 | 93% |
South West sea trout rod catches
| River | Sea trout caught | Sea trout released | Percentage released |
|---|---|---|---|
| Avon (Hants) | 335 | 300 | 90% |
| Stour | 27 | 18 | 67% |
| Piddle | 6 | 6 | 100% |
| Frome | 223 | 206 | 92% |
| Brit | 3 | 2 | 67% |
| Axe | 172 | 156 | 91% |
| Otter | 66 | 62 | 94% |
| Exe | 20 | 20 | 100% |
| Teign | 538 | 461 | 86% |
| Dart | 194 | 143 | 74% |
| Avon (Devon) | 42 | 31 | 74% |
| Erme | 34 | 29 | 85% |
| Yealm | 2 | 1 | 50% |
| Plym | 18 | 13 | 72% |
| Tavy | 284 | 227 | 80% |
| Lynher | 123 | 113 | 92% |
| Tamar | 573 | 489 | 85% |
| Looe | 5 | 4 | 80% |
| Fowey | 398 | 357 | 90% |
| Camel | 196 | 157 | 80% |
| Torridge | 120 | 110 | 92% |
| Taw | 245 | 208 | 85% |
| Lyn | 8 | 8 | 100% |
| Other | 8 | 7 | 88% |
| Total | 3,640 | 3,128 | 86% |
Midlands sea trout rod catches
| River | Sea trout caught | Sea trout released | Percentage released |
|---|---|---|---|
| Severn | 8 | 8 | 100% |
| Other | - | - | - |
| Total | 8 | 8 | 100% |
North west sea trout rod catches
| River | Sea trout caught | Sea trout released | Percentage released |
|---|---|---|---|
| Ribble | 696 | 635 | 91% |
| Wyre | 22 | 21 | 95% |
| Lune | 961 | 859 | 89% |
| Kent | 205 | 186 | 91% |
| Crake | 47 | 39 | 83% |
| Leven | 29 | 26 | 90% |
| Duddon | 129 | 115 | 89% |
| Irt | 207 | 184 | 89% |
| Esk (Cumbrian) | 94 | 88 | 94% |
| Calder | - | - | - |
| Ehen | 332 | 307 | 92% |
| Derwent | 255 | 244 | 96% |
| Ellen | 19 | 16 | 84% |
| Eden | 333 | 325 | 98% |
| Esk (Border) | 925 | 839 | 91% |
| Other | 6 | 6 | 100% |
| Total | 4,260 | 3,890 | 91% |
England total
Total number of sea trout rod catches for 2019:
- sea trout caught – 11,531
- sea trout released – 10,074
- percentage released – 87%
Wales sea trout rod catches
| River | Sea trout caught | Sea trout released | Percentage released |
|---|---|---|---|
| Wye | 46 | 44 | 96% |
| Usk | 161 | 142 | 88% |
| Rhymney | 3 | 3 | 100% |
| Taff | 20 | 15 | 75% |
| Ogmore | 166 | 153 | 92% |
| Afan | 53 | 50 | 94% |
| Neath | 59 | 52 | 88% |
| Tawe | 92 | 90 | 98% |
| Loughor | 49 | 35 | 71% |
| Gwendraeth Fach | 17 | 16 | 94% |
| Tywi/Towy | 1,211 | 1,002 | 83% |
| Taf | 21 | 14 | 67% |
| Cleddau (E&W) | 144 | 122 | 85% |
| Nevern | 224 | 136 | 61% |
| Teifi | 2,035 | 1,548 | 76% |
| Aeron | 155 | 97 | 63% |
| Ystwyth | 90 | 75 | 83% |
| Rheidol | 127 | 117 | 92% |
| Dyfi/Dovey | 1,699 | 1,459 | 86% |
| Dysynni | 246 | 223 | 91% |
| Mawddach | 425 | 403 | 95% |
| Artro | 31 | 20 | 65% |
| Dwyryd | 20 | 18 | 90% |
| Glaslyn | 383 | 313 | 82% |
| Dwyfawr | 149 | 93 | 62% |
| Dwyfach | 10 | 10 | 100% |
| Llyfni | 53 | 34 | 64% |
| Gwyrfai | - | - | - |
| Seiont | 81 | 63 | 78% |
| Cefni | 3 | 3 | 100% |
| Ogwen | 252 | 202 | 80% |
| Conwy | 516 | 485 | 94% |
| Clwyd | 823 | 739 | 90% |
| Dee | 407 | 350 | 86% |
| Other | 28 | 17 | 61% |
Wales total
Total number of sea trout rod catches for 2019:
- sea trout caught – 9,799
- sea trout released – 8,143
- percentage released – 83%
England and Wales total
Total number of sea trout rod catches for 2019:
- sea trout caught – 21,330
- sea trout released – 18,217
- percentage released – 85%
Table 15 – Salmon net catches 2019
North East salmon net catches
| River/fishery | Fishing method | Total number | Total weight (kg) |
|---|---|---|---|
| Northumbria and Yorkshire | Drift nets | - | - |
| Northumbria (D1) | T nets | 59 | 93 |
| Yorkshire (3-7) | T or J nets | 70 | 326 |
| Whole area | Total | 129 | 419 |
Anglian salmon net catches
| River/fishery | Fishing method | Total number | Total weight (kg) |
|---|---|---|---|
| Coastal | Drift nets | 0 | 0 |
| Coastal | Other nets (var.) | 0 | 0 |
| Whole area | Total | 0 | 0 |
South East (southern) salmon net catches
| River/fishery | Fishing method | Total number | Total weight (kg) |
|---|---|---|---|
| Solent area | Seine nets | 0 | 0 |
| Whole area | Total | 0 | 0 |
South West salmon net catches
| River/fishery | Fishing method | Total number | Total weight (kg) |
|---|---|---|---|
| Avon and Stour | Seine nets | - | - |
| Poole Harbour | Seine nets | 0 | 0 |
| Exe | Seine nets | - | - |
| Teign | Seine nets | 5 | 22 |
| Dart | Seine nets | - | - |
| Camel | Drift nets | - | - |
| Tavy | Seine nets | - | - |
| Tamar | Seine nets | - | - |
| Lynher | Seine nets | - | - |
| Fowey | Seine nets | - | - |
| Taw/Torridge | Seine nets | - | - |
| Whole area | Total | 5 | 22 |
Midlands salmon net catches
| River/fishery | Fishing method | Total number | Total weight (kg) |
|---|---|---|---|
| Severn | Seine/Draft nets | - | - |
| Severn | Lave nets | 4 | 17 |
| Severn | Putcher Rank | - | - |
| Whole area | Total | 4 | 17 |
North West salmon net catches
| River/fishery | Fishing method | Total number | Total weight (kg) |
|---|---|---|---|
| Ribble | Drift nets | - | - |
| Lune | Haaf nets | 17 | 69 |
| Lune | Drift nets | - | - |
| Kent | Lave nets | - | - |
| Leven | Lave nets | 5 | 15 |
| Eden and Esk (Solway) | Haaf nets | 104 | 455 |
| Eden | Coop traps | 0 | 0 |
| Whole area | Total | 126 | 540 |
England total
Total salmon net catches for 2019:
- salmon total number – 264
- salmon total weight – 998kg
Wales salmon net catches
| River/fishery | Fishing method | Total number | Total weight (kg) |
|---|---|---|---|
| Wye | Lave nets | 2 | 8 |
| Tywi/Towy | Seine nets | 10 | 42 |
| Tywi/Towy | Coracle nets | 65 | 227 |
| Tywi/Towy and Wye | Combined river total | 77 | 277 |
| Taf | Wade net | 0 | 0 |
| Taf | Coracle nets | - | - |
| Taf | River total | 0 | 0 |
| Cleddau (E&W) | Compass nets | 0 | 0 |
| Nevern | Seine nets | - | - |
| Teifi | Seine nets | 9 | 22 |
| Teifi | Coracle nets | 102 | 401 |
| Teifi | River total | 111 | 423 |
| Dyfi/Dovey | Seine nets | 0 | 0 |
| Dysynni | Seine nets | - | - |
| Mawddach | Seine nets | 0 | 0 |
| Glaslyn | Seine nets | - | - |
| Conwy | Basket trap | - | - |
| Conwy | Seine nets | 1 | 4 |
| Conwy | River total | 1 | 4 |
| Dee | Trammel nets | - | - |
| Dee | Draft/seine nets | - | - |
| Dee | River total | - | - |
Wales total
Total salmon net catches for 2019:
- salmon total number – 189
- salmon total weight – 704kg
England and Wales total
Total salmon net catches for 2019:
- salmon total number – 453
- salmon total weight – 1,702kg
Table 16 – sea trout net catches 2019
North East sea trout net catches
| River/fishery | Fishing method | Total number | Total weight (kg) |
|---|---|---|---|
| Northumbria and Yorkshire | Drift nets | - | - |
| Northumbria (D1) | T nets | 4,252 | 6,356 |
| Yorkshire (3-7) | T or J nets | 9,421 | 14,930 |
| Whole area | Total | 13,673 | 21,286 |
Anglian sea trout net catches
| River/fishery | Fishing method | Total number | Total weight (kg) |
|---|---|---|---|
| Coastal | Drift nets | 133 | 148 |
| Coastal | Other nets (var.) | 30 | 46 |
| Whole area | Total | 163 | 195 |
South East (southern) sea trout net catches
| River/fishery | Fishing method | Total number | Total weight (kg) |
|---|---|---|---|
| Solent area | Seine nets | 0 | 0 |
| Whole area | Total | 0 | 0 |
South West sea trout net catches
| River/fishery | Fishing method | Total number | Total weight (kg) |
|---|---|---|---|
| Avon and Stour | Seine nets | - | - |
| Poole Harbour | Seine nets | 3 | 4 |
| Exe | Seine nets | - | - |
| Teign | Seine nets | 82 | 107 |
| Dart | Seine nets | - | - |
| Camel | Drift nets | - | - |
| Tavy | Seine nets | - | - |
| Tamar | Seine nets | - | - |
| Lynher | Seine nets | - | - |
| Fowey | Seine nets | - | - |
| Taw/Torridge | Seine nets | - | - |
| Whole area | Total | 85 | 110 |
Midlands sea trout net catches
| River/fishery | Fishing method | Total number | Total weight (kg) |
|---|---|---|---|
| Severn | Draft/seine nets | - | - |
| Severn | Lave nets | 0 | 0 |
| Severn | Fixed (Putcher Rank) | - | - |
| Whole area | Total | 0 | 0 |
North West sea trout net catches
| River/fishery | Fishing method | Total number | Total weight (kg) |
|---|---|---|---|
| Ribble | Drift nets | - | - |
| Lune | Haaf nets | 34 | 71 |
| Lune | Drift nets | - | - |
| Kent | Lave nets | - | - |
| Leven | Lave nets | 0 | 0 |
| Solway | Haaf nets | 133 | 164 |
| Eden | Coop traps | 0 | 0 |
| Whole area | Total | 167 | 235 |
England total
Total number of sea trout nets catches for 2019:
- sea trout total number – 14,088
- sea trout total weight – 21,827kg
Wales sea trout net catches
| River/fishery | Fishing method | Total number | Total weight (kg) |
|---|---|---|---|
| Tywi/Towy | Seine nets | 43 | 68 |
| Tywi/Towy | Coracle nets | 109 | 278 |
| Tywi/Towy | River total | 152 | 346 |
| Taf | Wade net | 0 | 0 |
| Taf | Coracle nets | - | - |
| Taf | River total | 0 | 0 |
| Cleddau (E&W) | Compass nets | 2 | 7 |
| Nevern | Seine nets | - | - |
| Teifi | Seine nets | 0 | 0 |
| Teifi | Coracle nets | 330 | 571 |
| Teifi and Cleddau (E&W) | Combined river total | 332 | 578 |
| Dyfi/Dovey | Seine nets | 19 | 47 |
| Dysynni | Seine nets | - | - |
| Mawddach | Seine nets | 0 | 0 |
| Conwy | Basket trap | - | - |
| Conwy | Seine nets | 8 | 9 |
| Conwy and Dyfi/Dovey | Combined river total | 27 | 56 |
| Clwyd | Sling nets | - | - |
| Dee | Trammel nets | - | - |
| Dee | Draft/seine nets | - | - |
| Dee | River total | - | - |
Wales total
Total number of sea trout nets catches for 2019:
- sea trout total number – 511
- sea trout total weight – 980kg
England and Wales total
Total number of sea trout nets catches for 2019:
- sea trout total number – 14,599
- sea trout total weight – 22,807kg
6. Eel, smelt, and lamprey catches
The Environment Agency, together with Natural Resources Wales, issue commercial fishing authorisations for eel, elver, lamprey, and smelt fishing.
Eel and elver fishing
Authorisations for commercial yellow and silver eel fishing are restricted to those already licensed to fish. Elver fishing is restricted to certain locations with fishers only authorised to use hand held ‘dip nets’.
Adult eel fishing was authorised between 1 April and 30 November 2019. Elver fishers were authorised to fish between 15 February and 25 May 2019.
Smelt and lamprey fishing
Authorisations for smelt and lamprey fishing are restricted to those already authorised to fish.
Smelt fishing is generally authorised between 20 February and 25 April each year. Fishers must provide the Environment Agency with a completed catch return within 30 days of the expiry of their authorisation. The total weight of smelt taken is subject to a quota.
The fishing season for river lamprey is 1 November to 10 December each year. The total weight of lamprey that can be taken is subject to a quota. Fishers must provide the Environment Agency with a completed catch return within 30 days of the expiry of their authorisation.
Table 17 – Eel, elver, lamprey and smelt authorisations – number, value and catch, 2019 season
Adult eel fishery
Number of authorisations – 51
| Method | Number of instruments | Value (£) | Caught (kg)* |
|---|---|---|---|
| Small wingless traps | 214 | £560 | - |
| Fyke nets | 1,649 | £3,310 | - |
| Fixed traps | 5 | £575 | - |
| Total | 1,868 | £4,445 | - |
*Data not available
Elver fishery
Number of authorisations – 395
| Method | Number of instruments | Value (£) | Caught (kg) |
|---|---|---|---|
| Dip net | 395 | £85 | 6,029 |
| Total | 395 | £33,575 | 6,029 |
Lamprey fishery
Number of authorisations – 2
| Method | Number of instruments | Value (£) | Caught (kg)* |
|---|---|---|---|
| Pot traps | 20 | £70 | 81.25 |
| Total | 20 | £70 | 81.25 |
*18.90kg of lamprey retained.
Smelt fishery
Number of authorisations – 12
| Method | Number of instruments | Value (£) | Caught (kg) |
|---|---|---|---|
| Pot traps/Fyke nets | 676 | - | 1,330 |
| Total | 676 | - | 1,330 |
Note: Smelt fishers given a 2-year authorisation in 2018. No payment was taken in 2019.