
Forestry Commission map browser with Land Information Search: operations note 48
Updated 7 October 2021
Applies to England

© Crown copyright 2021
This publication is licensed under the terms of the Open Government Licence v3.0 except where otherwise stated. To view this licence, visit nationalarchives.gov.uk/doc/open-government-licence/version/3 or write to the Information Policy Team, The National Archives, Kew, London TW9 4DU, or email: psi@nationalarchives.gov.uk.
Where we have identified any third party copyright information you will need to obtain permission from the copyright holders concerned.
This publication is available at https://www.gov.uk/government/publications/map-browser-with-land-information-search-operations-note-48/forestry-commission-map-browser-with-land-information-search-operations-note-48
Date: 6 October 2021
1. Purpose
This Operations Note provides customers with guidance on how to use the new Forestry Commission map browser and how to run a Land Information Search.
2. Introduction
The Forestry Commission (FC) map browser was launched in December 2018. As part of the England Tree Planting Programme, in October 2021 the FC launched the first in a series of developments to its map browser and Land Information Search (LIS), improving the experience for users. These developments include the expansion of data available to users through the addition of 54 interactive data layers, as well as updating the LIS to enable users to better identify constraints and opportunities for woodland creation.
This guidance will help you understand the basic functionality and take you through the process of using the tools within the map browser.
3. Access to the FC map browser
The Map Browser can be accessed via GOV.UK guidance page: Forestry Commission map browser and Land Information Search.
4. What is the map browser for?
The FC map browser is a public information tool that allows you to view data layers published by the Forestry Commission. You are able to see how they interact with areas of land you have an interest in, and can identify various agreements for forestry and woodland management activity that has been approved.
The map browser should be used by:
- anyone planning to undertake forestry activities, to aid with their planning and stakeholder engagement
- anyone who has an interest in forestry or woodland management activity in their area, and who wants reassurance that the work is legitimate
Not all the data layers which are relevant to forestry activity are able to be shown on the FC map browser (due to licensing and data sharing issues), so users should also check the www.MAGIC.gov.uk map browser as part of any map searches you are doing.
The functions the map browser could assist with include:
- creating (to draw and / or measure) new features or boundaries on an Ordnance Survey map backdrop, and to print those new features as part of a new PDF map
- identifying approved (current and legacy) grant schemes and felling permissions
- searching against the published data layers to see what features or designations of interest influence a particular areas of land
- producing a constraints check report against a proposal area, as evidence that you have carried out these basic checks
- engaging with stakeholders once you have assessed the results of a LIS check
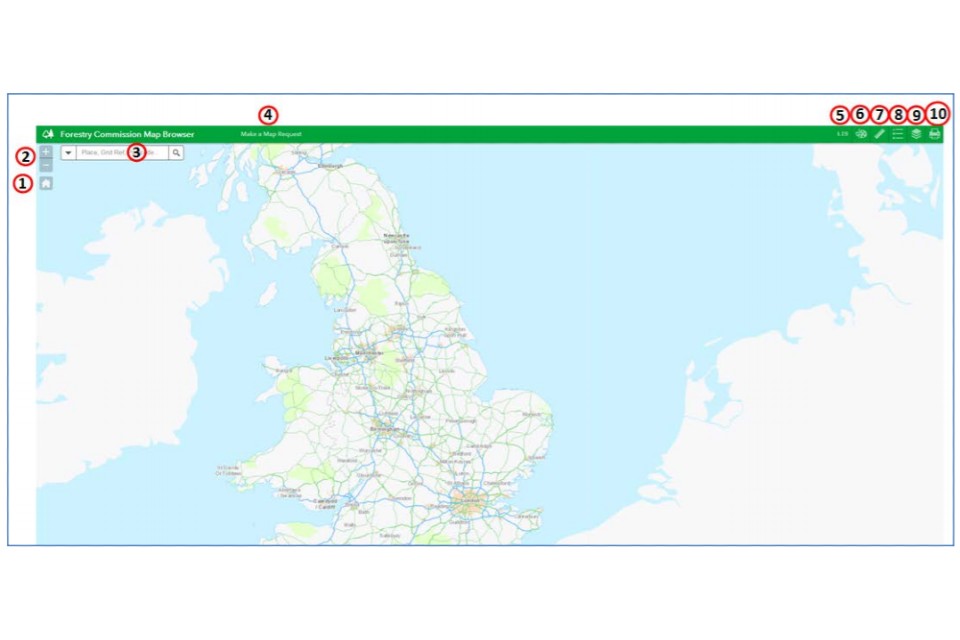
5. Screen layout
This section will explain the layout of the map browser and what each control button can be used for.
- Click this home button to return the map back to the England view
- Zoom in and zoom out functions
- Gazetteer search bar – can search by grid reference, postcode, place name
- Link to the .gov.uk\Map Request Service webpage and form
- Pops open Land Information Search within Map Browser
- Draw shapes and add text
- Measurement tools
- Legend for the map layers selected
- Lists of available map layers to turn on and off
- Print button
6. Navigation of the map browser
There are various ways to navigate the map browser. The most common are as follows:
- enter a Grid Reference, Post Code or Place Name into the search bar
- drag the map using the left button on the mouse
- zoom into the map using the + and – zoom functions on screen, or by scrolling on your mouse wheel
- you can also press ‘Shift’ and then drag on the map to create a box; this then zooms in to that extent
7. Using the draw tools
The Draw tool is used to draw on the map in your chosen location, or to label your drawing on the map. You cannot save your drawings on the Map Browser, or edit the features you draw - these are for printing only.
Once you click on the ‘Draw’ icon, the list of options shown below will open.
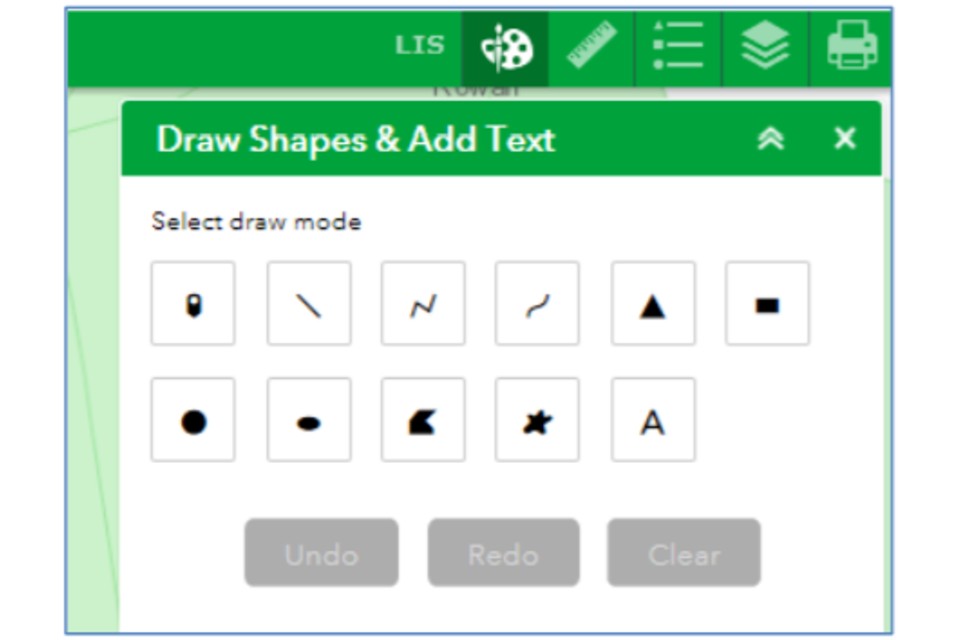
7.1 To draw a Point:
- click the Point icon
- then, choose the style of the point, such as the colour, style and outline
- then, Click in the map where you want your point to appear
7.2 To draw a Line:
- click one of the Line icons
- then choose the style of the line, such as the colour, style width and transparency. Switch on the Show distance measurement and set the unit of measurement if you want to know how long the line drawn is
Then, click on the map where you want your line to start.
- for a straight line, drag the line from start point to end point
- for a multi-directional line, click at every point your line changes direction, and double-click on the last point of the line to finish
- for a freeform line, click and then move the mouse along the proposed route
7.3 To draw Shapes:
- click the Shape icon you would like to draw: triangle, square, circle, ellipse
- choose the style of the shape, such as the colour, line width and transparency. Switch on the Show area measurement and choose a measure unit if you want to know big your shape area is. Switch on the Show distance measurement and choose a measure unit if you want to know what the perimeter distance of your area is
Then, for fixed shapes: * click on the map where you want your shape to start, and drag your click until it reaches the extent intended
Then, for free hand shapes: * click at every point where your shape edge changes direction. When you have made three points or more, a shape will begin to develop. Double-click on the last point of the shape to finish
Then, for a freeform shape: * click and then move the mouse along the proposed boundary
When you have completed your drawn feature, if you have selected the area / perimeter distance measurements, these will be shown on the map as labels against your shape.
7.4 To add Text:
*click the Text icon * write the text you want to appear on the map in the text box. This should be used, for example, to add an OS Grid Reference onto the map you are creating at e.g. the entrance to a woodland. You must click outside the text box field to show a preview of the text * adjust the font colour and font size * click on the map where you want to drop the text * if you place it in the wrong place, you can press ‘undo’ and then drop the text again
7.5 To delete anything you have drawn:
- if you need to, or want to delete the last item drawn, click Undo
- alternatively, click Clear if you want to start again. Clear will delete everything on the map
You cannot edit the points, lines or shapes you have drawn, or the text when applied, so you will need to use the Undo or Clear buttons to fix any errors.
Using the Draw tool settings will allow you to measure the distance and area of your feature if you switch this ‘on’. However, if you want to use the Measure tools separately, this is explained below.
8. Using the measure tools
The Measure tool can be an alternative way to measure a drawn item on your map.
Once you click on the Measure icon, the list of options shown below will open.
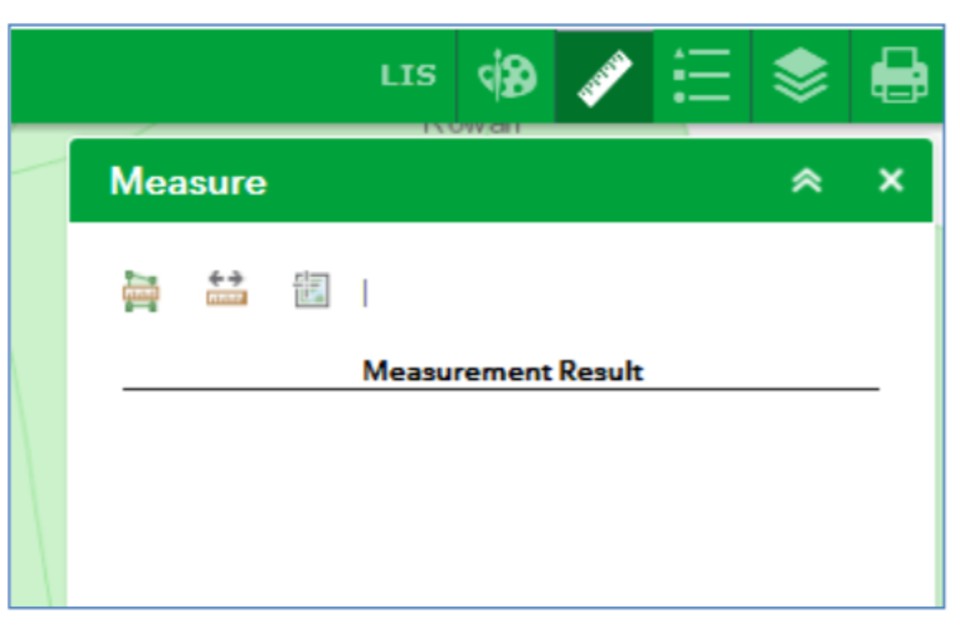
To measure the Area:
- click the Area icon
- choose your unit of measurement
- draw around the area you are interested in, or over the shape or line you have already created. Double-click on the last point of the shape to finish
To measure the Distance:
- click the Distance icon
- choose your unit of measurement
- draw along the line or boundary you are interested in, or over the shape or line you have already created. Double-click on the last point of the shape to finish
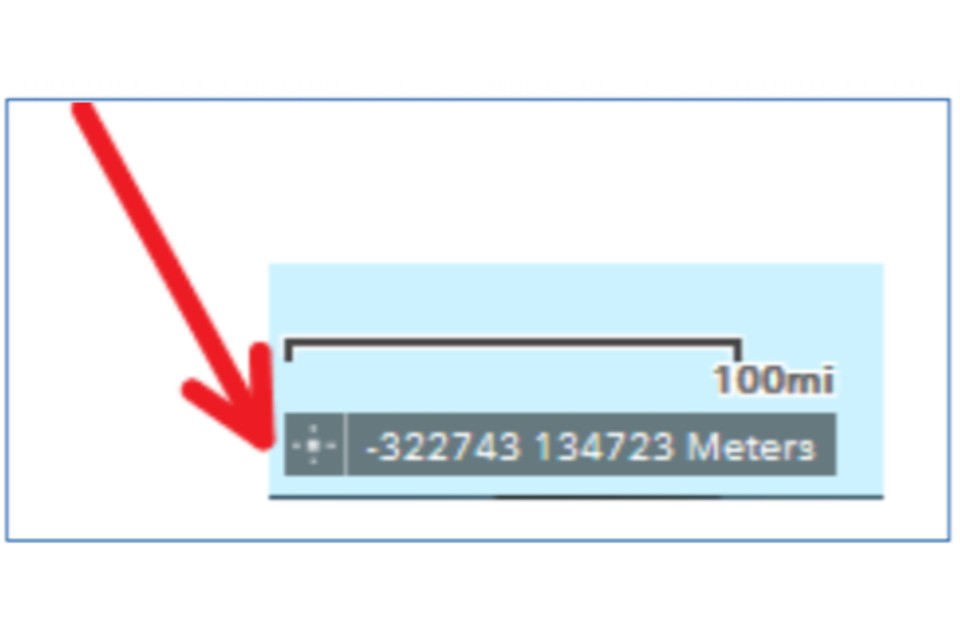
If you ‘hover’ your mouse over a particular point on the map, the grid reference of that point will show in the bottom left hand corner of the map.
There’s a cross icon on the bottom left hand corner, if you click this and then click on the map, the grid reference freezes at this location which will allow you to copy and paste the grid reference.
9. Using the map layers
The FC map browser hosts a series of forestry and woodland management related map layers, and these are divided into a series of themed folders.
Once you click on the Map Layers icon, the list of folders will open.
Click on the blue square to open a map layer folder.
Within a selected folder, you can then switch each individual map layer on or off by clicking the individual map layer tick boxes.
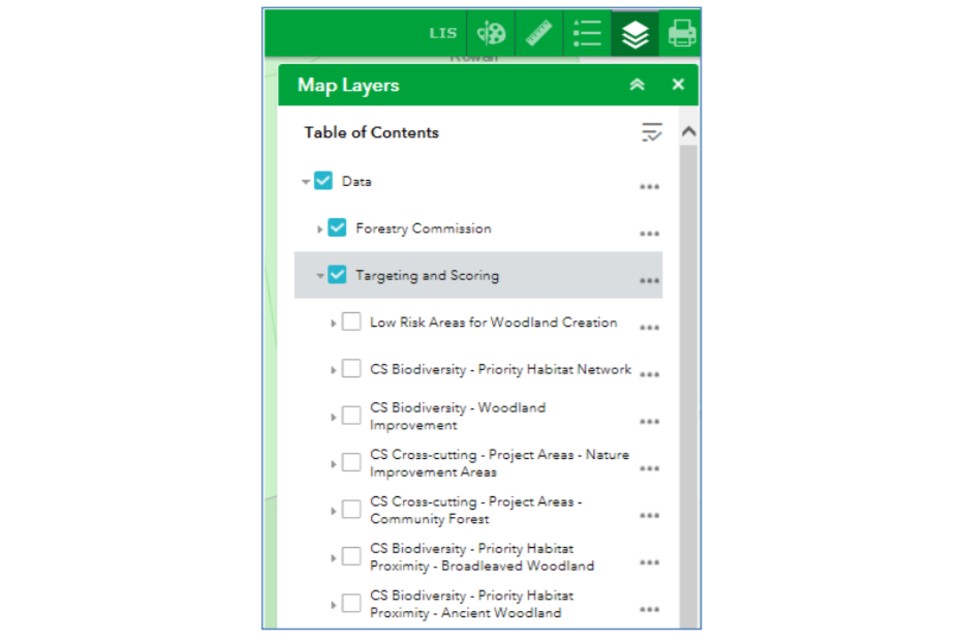
Switching different layers on and off will immediately be reflected on the map. There is no need to refresh the screen.
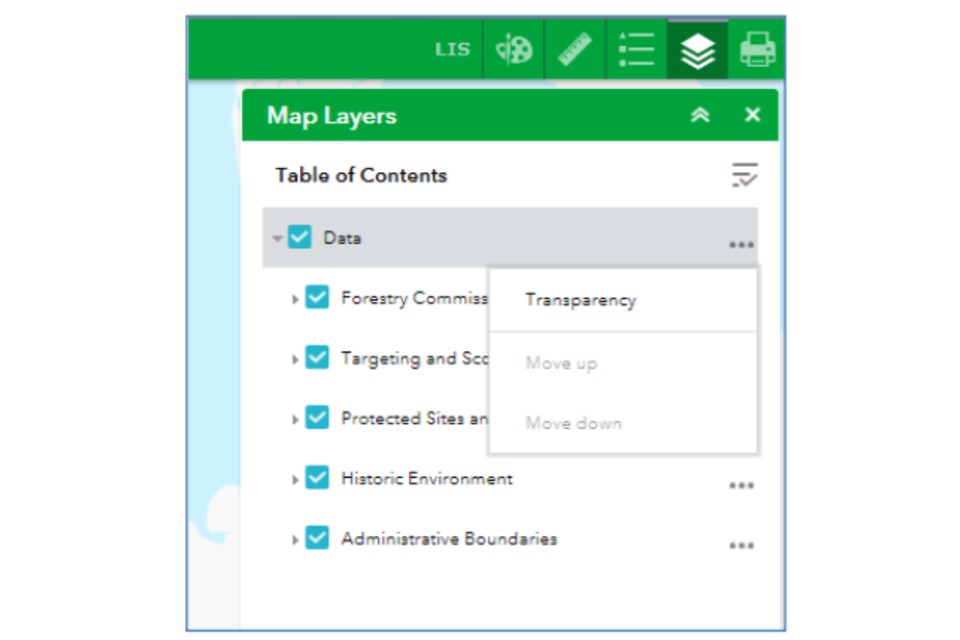
Some map layers have a coloured fill that blocks out the background map.
You can also change the transparency of the map layers by clicking on the ellipses (the three dots) on the ‘Data’ folder in the map layer tool.
In the example below the ‘EWGS Case Boundary’ layer switched to ‘on’.
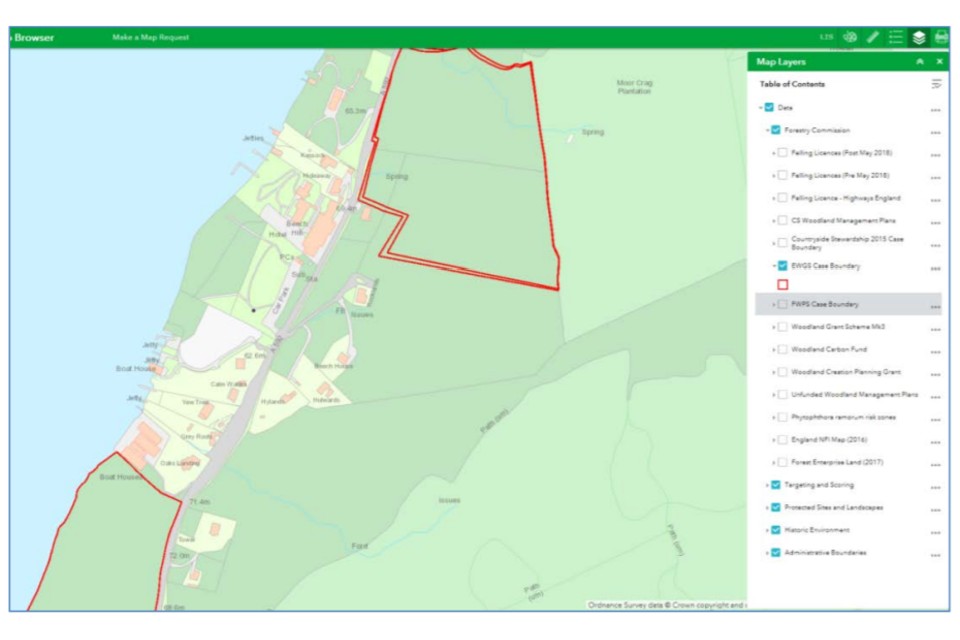
You can see on the left of this image that part of the map has a red boundary, where the EWGS map layer selected overlays the background map.
You can expand each of these map layers by clicking the dropdown (the arrow head next to the layer tick box) to show a legend; this shows what the different components of the map layer are. In this example you can see in the map layers list, that the legend for EWGS has been expanded to show that the boundary of a EWGS case is shown in red.
If you click on any map layer feature on the map browser, you will see a popup providing basic information about what that particular feature is.
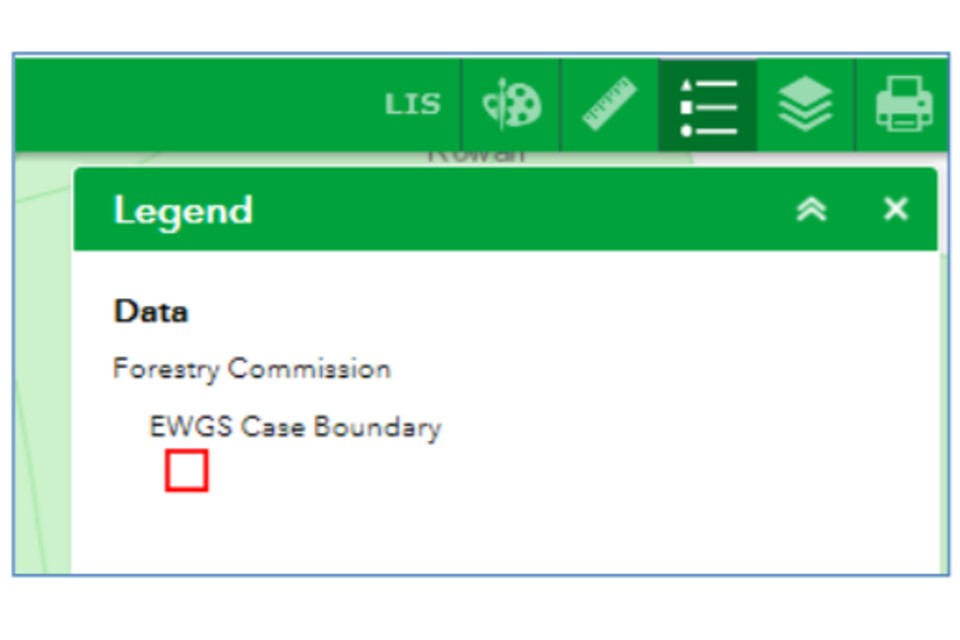
9.1 Using the Map Legend
The Legend tool can be used to view the relevant legend for a particular layer.
Once you click on the Legend icon, a list of legend information will open in the tab.
From the previous example, the EWGS Case Boundary is switched on, so, by clicking the Legend tool you can view the EWGS Case Boundary legend. The Legend tool will show the legend for all the map layers that are open at the point you select it.
If you click on any map layer feature on the map browser, you will see a popup providing basic information about what that particular feature is.
10. Printing and saving your map
To save the map you have created, click the Print icon.
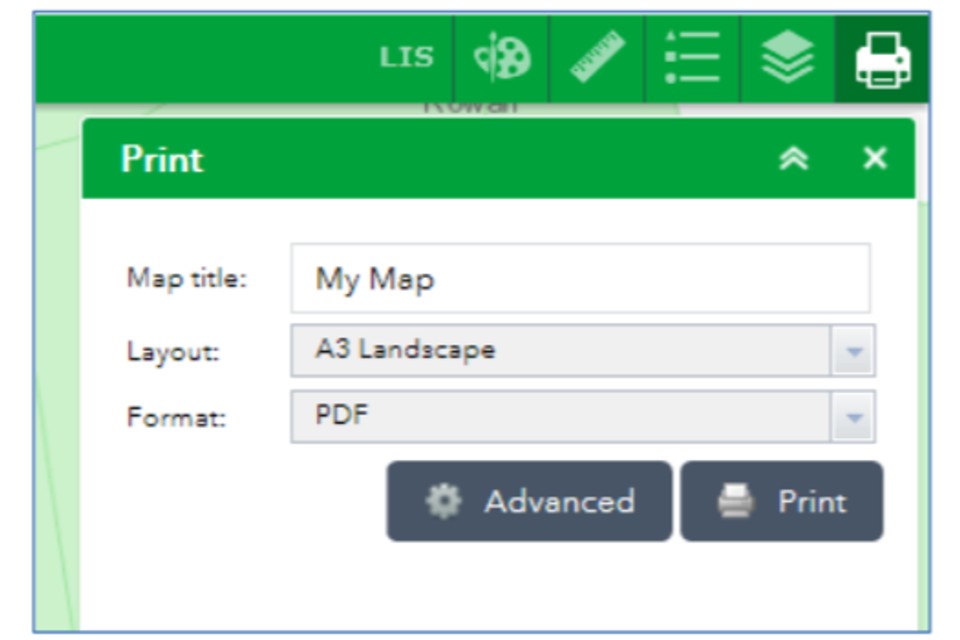
Once you click on the Print icon, the Print tool will open.
10.1 To Print or Save:
- type in your map title
- select the paper orientation and page size (portrait or landscape / A4 or A3)
- select the print format. This is automatically set to PDF, but there are other options in the dropdown. Make sure your system is able to support alternative print formats
- then press Print
A scrolling bar Icon appears which, once the map has been generated, changes to a PDF icon. You can click on this to open the PDF map and view it.
The PDF map can then be saved to your local desktop, or printed using the print options on your computer or via the PDF itself.
An example map PDF.
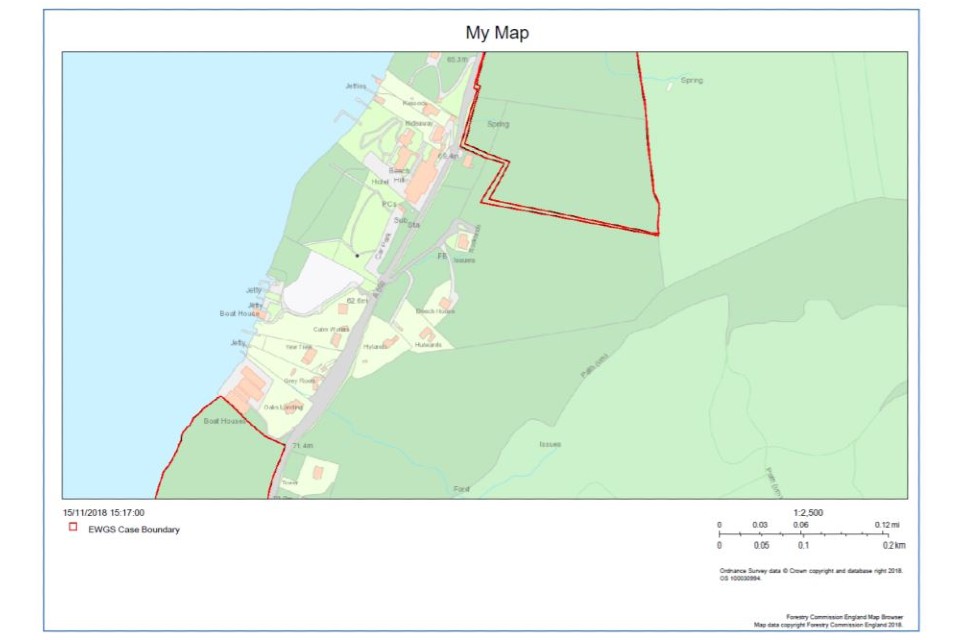
The PDF map will show what you have drawn as a feature and what layers you have selected or switched on. The PDF map will also show the map title and scale. You will have to add an OS Grid Reference manually using the Text tool.
10.2 To use Advanced print function:
There are also advanced print functions which allow you to set map scale and extent, to include the map legend or not, and to set the size of the image and the DPI (dots per inch) of the PDF.
11. FC Land Information Search
A Land Information Search (LIS) is a check run on a feature or shape you have drawn in the LIS tool against all the other data layers on this map browser.
The LIS report generated will detail what other features or interests overlap or lie near the location you have drawn.
This section will explain how the Land Information Search tool is used.
Once you click on the LIS icon, the LIS tool will open.
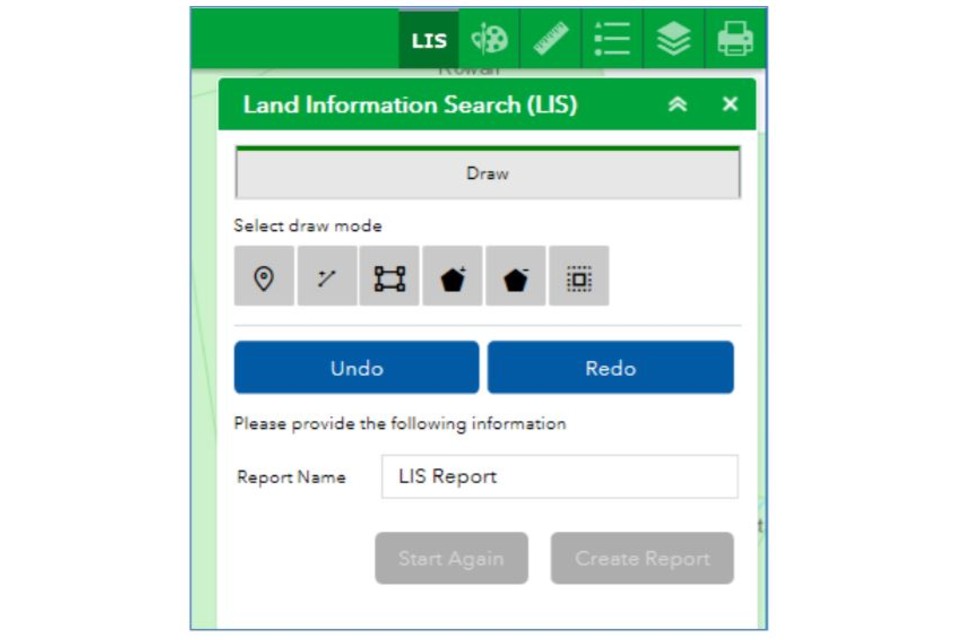
11.1 Using the LIS tool to create a LIS report
Important to Note:
To run a LIS check, you must draw your feature polygon (lines or shapes) in the LIS tool in order to run a LIS report. You cannot use features (shapes or points) you have drawn previously on the Map Browser.
Draw a feature to search against:
Using the LIS tool, you are able to select drawing tools to draw a point, a line, a rectangle or any other shape of polygon, using the methods explained in Navigation of the map browser.
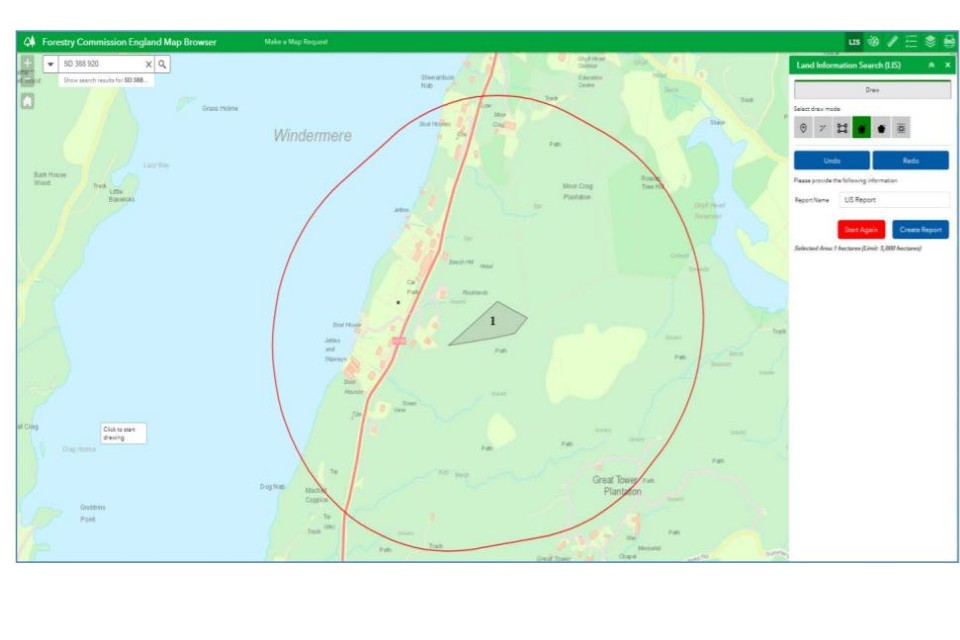
However, within the LIS tool, when you have finished drawing your feature or area of interest, an automated buffer (a red line) will appear around your shape(s) and your shape will be automatically numbered, as shown below.
Draw more than one feature:
On completion of the first shape, simply drag the map to the new location, or use the zoom in / zoom out tools, and draw the next feature.
The new feature will automatically be buffered when you finish drawing, and will be given the next automated number in the sequence. This is so you can identify which feature or area is which when viewing the LIS report.
You can draw a combined maximum of 5000 hectares in one report.
Use the Cut tool:
Having drawn a shape or feature you now want to remove part of it. * click the Cut icon * draw on your shape the section you want to be removed. Double click to finish The Cut tool will remove the section you have selected.
Fixing errors:
If you think you have made a mistake when drawing, you can use the Undo tool to go remove the features you have drawn, one at a time.
Equally, you can use the Redo button to reinstate features that you have just removed using the Undo button.
Alternatively, you can use the Start Again button, but this will clear all your activity to that point, and means you will need to start all your work again.
11.2 Running a LIS report
To run a LIS report on a feature or features you have drawn, follow these steps.
- fill in the Report Name section to give your LIS report a title
- click Create Report. This will run a constraints check against all layers
11.3 LIS Search results
Initially your results will be shown via the Land Information Search tab. The tab is broken into three categories;
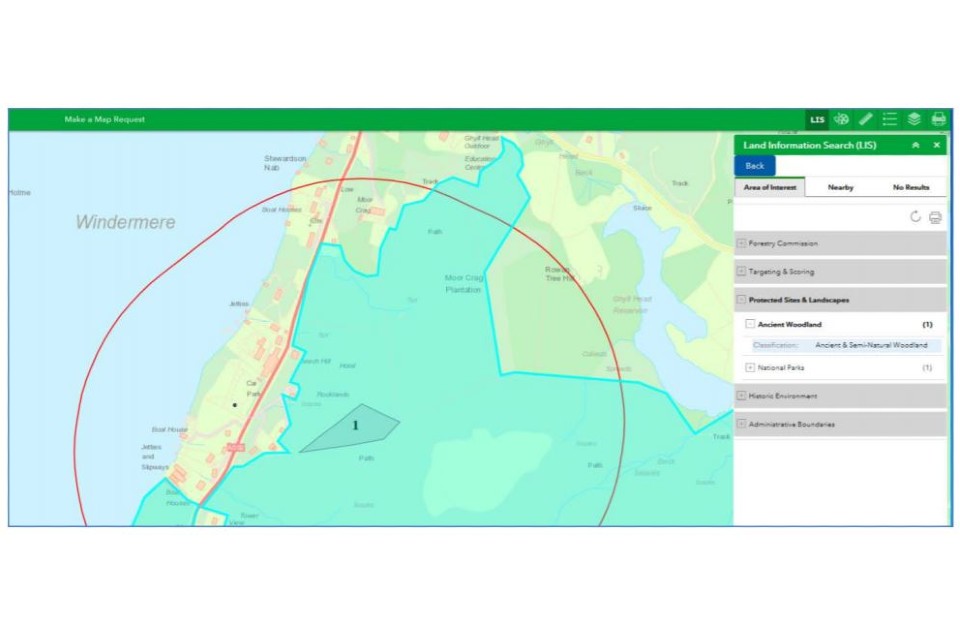
Area of Interest:
Results that appear under Area of Interest tab show layers that directly intersect with your shape(s).
If you expand the layer category it will reveal what map layers are affecting your shape. If you click on the detail of a particular layer, a pale blue shading will identify the specific affected area, as shown below.
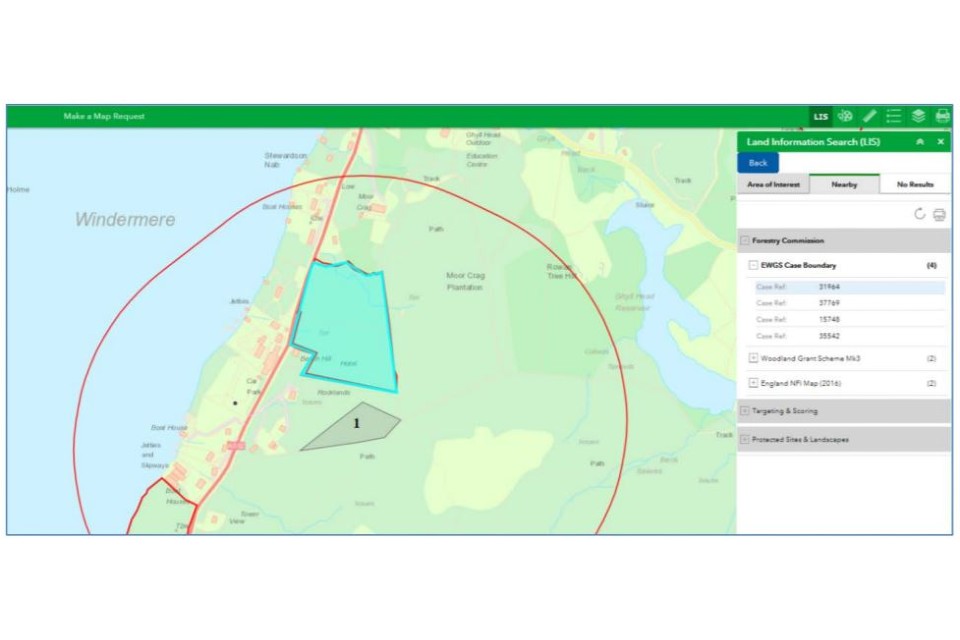
Nearby:
Results that appear under the Nearby tab show layers that do not intersect with your shape but do intersect with the 500-metre buffer.
Again, if you expand the layer category it will reveal what map layers are affecting your shape. If you click on the detail of a particular layer, a pale blue shading will identify the specific affected area, as shown below.
No Results:
The No Results tab lists the layers which have been used in the search, but which do not affect your shape or buffer zone at all.
11.4 Printing and saving the LIS report
To create a LIS report which you can print or save, click the grey print button on the LIS tab (this is not the green Print tool). This will open a LIS report in a new window. This new window may open behind your internet browser!
Depending on how big an area your LIS report covers, or how many parts there are to the LIS report, this may take a few minutes to load.
The LIS report is designed to fit standard A4 paper in portrait view. The first page of the report will contain the map title you gave it, the OS Grid Reference and the Area in hectares, along with a small map showing the search area. The LIS report itself will be laid out based on the order of features you drew.
- if you have 3 compartments, the report will show results for Cpt 1 first, then Cpt 2, followed by Cpt 3
- for each compartment, the LIS report will list the Area of Interest interactions first and then Nearby interactions. There will be a No Results list at the end of the report
Saving the PDF LIS report:
To save the LIS report as a PDF:
- right click on the web page window and select Print
- choose a suitable PDF print converter (such as CutePDF) from your print options, and press Print. You can choose where to save the PDF document, for example, on your PC or on a server
Once saved locally as a PDF, this can be printed off on paper using normal print functions.
If you don’t have a PDF print function, you can use the Save to PDF button on the LIS report, but depending on your IT system or software, this may not always work.
12. Versions
Version 1, issued 5 December 2018 (first issue) Version 1.1, issued 5 October 2021
13. Annex A – Map layers catalogue
13.1 Forestry Commission (14)
- Felling Licences (Post May 2018)
- Felling Licences (Pre May 2018)
- Felling Licence - Highways England
- CS Woodland Management Plans
- Countryside Stewardship 2015 Case Boundary
- EWGS Case Boundary
- FWPS Case Boundary
- Woodland Grant Scheme Mk3
- Woodland Carbon Fund
- Woodland Creation Planning Grant
- Unfunded Woodland Management Plans
- Phytophthora ramorum risk zones
- England NFI Map (2016)
- Forestry Enterprise Land (2017)
13.2 Targeting and scoring (23)
- Low Risk Areas for Woodland Creation
- CS Biodiversity - Priority Habitat Network
- CS Biodiversity - Woodland Improvement
- CS Cross-cutting - Project Areas - Nature Improvement Areas
- CS Cross-cutting - Project Areas - Community Forest
- CS Biodiversity - Priority Habitat Proximity - Broadleaved Woodland
- CS Biodiversity - Priority Habitat Proximity - Ancient Woodland
- CS Biodiversity - Priority Species - Red squirrel - Creation
- CS Biodiversity - Priority Species - Red Squirrel - Management
- CS Water - Water Quality
- CS Water - Water Quality - Acidification
- CS Water - Flood Risk
- CS Cross-cutting - Keeping Rivers Cool
- CS Cross-cutting - Project Areas - Demonstration Test Catchment / Making Space for Water Demonstration Catchment
- CS Cross-cutting - Project Areas - Woodland for Water Priority Catchments
- Woodland for Water Project Areas
- W4W Less-than-good Quantitative Status
- Woodland for Water
- Priority Places for England
- Ward Forester Project Areas
- HS2 - Safeguarding Zones
- HS2 - Phase 1 25 mile buffer
13.3 Protected sites and landscapes (14)
- Ancient Woodland
- Areas of Outstanding Natural Beauty
- Common Land
- Community Forests
- Local Nature Reserves
- Moorland Line
- National Forest
- National Nature Reserves
- National Parks
- Nature Improvement Areas
- Ramsar sites
- Sites of Special Scientific Interest
- Special Areas for Conservation
- Special Protection Areas
13.4 Historic environment (4)
- Heritage Coast
- Registered Parks and Gardens
- Scheduled Monuments
- World Heritage Site
13.5 Administrative boundaries (4)
- Forest Services Areas
- England Region boundaries
- County boundaries
- Unitary and District boundaries