English Housing Survey: a segmentation analysis of private renters
Published 16 June 2022
Applies to England

© Crown copyright 2022
This publication is licensed under the terms of the Open Government Licence v3.0 except where otherwise stated. To view this licence, visit nationalarchives.gov.uk/doc/open-government-licence/version/3 or write to the Information Policy Team, The National Archives, Kew, London TW9 4DU, or email: psi@nationalarchives.gov.uk.
Where we have identified any third party copyright information you will need to obtain permission from the copyright holders concerned.
This publication is available at https://www.gov.uk/government/publications/english-housing-survey-a-segmentation-analysis-of-private-renters/english-housing-survey-a-segmentation-analysis-of-private-renters
To better understand private renters, the Department for Levelling Up, Housing and Communities (DLUHC) commissioned a segmentation analysis of private renters. This report uses latent class analysis and the 2019-20 English Housing Survey (EHS) to group private rented households based on characteristics that might limit their access to good quality housing. The analysis identified 6 clusters, or latent classes, of private renters based on the available data. This analysis paints a picture of the private rented sector as it is now, and allows us to generate further insight into the private rented sector and the people who live there.
Main findings
There are 6 distinct classes of private renters, based on differences in their financial and family circumstances.
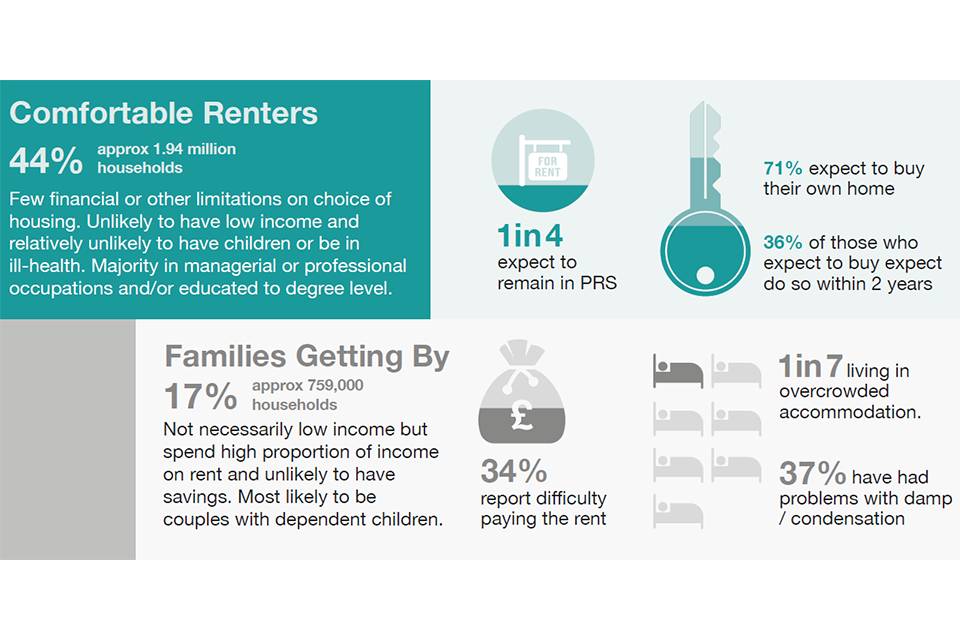
Comfortable Renters make up 44% of the PRS or approximately 1.94 million households.
- Comfortable Renters experience few financial or other limitations on choice of housing. They are unlikely to have low income and relatively unlikely to have children or be in ill-health. They are the most likely group to have savings.
- Comfortable Renters are among the least likely to experience issues with their accommodation such as overcrowding (6%) or damp (33%) or to have difficulty paying the rent (16%). They are the most likely to expect to move out of the PRS by buying their own home, with many in this class (36%) expecting to do this within the next 2 years.
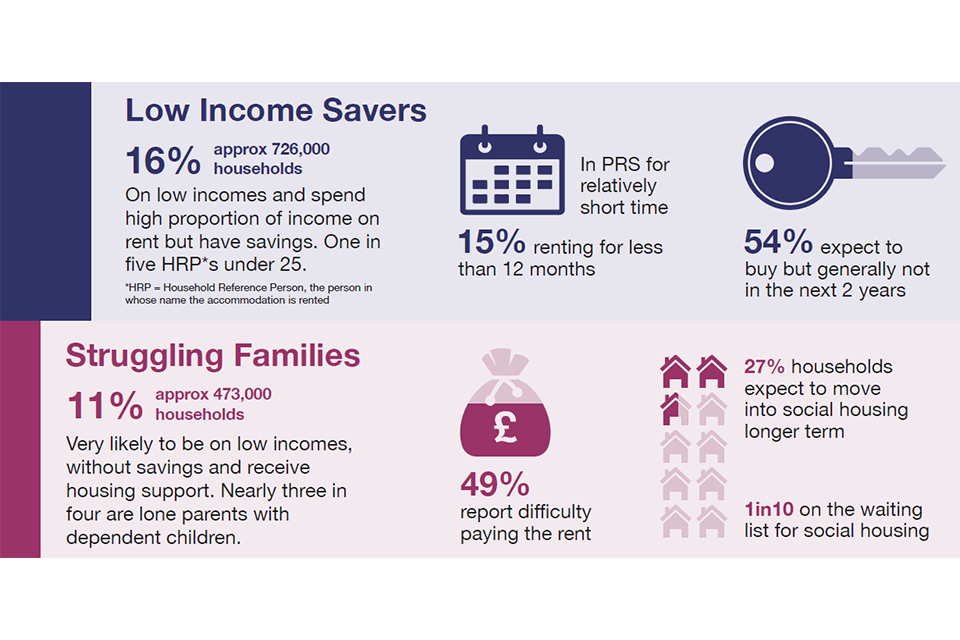
Low Income Savers make up 16% of the PRS or approximately 726,000 households.
- Low Income Savers tend to be on low incomes and are likely to be spending more than 30% of their income on rent. However, they also tend to have savings.
- Low Income Savers generally have quite high levels of satisfaction with their current property. However, they are more likely than Comfortable Renters to struggle to pay the rent (31%). Many Low Income Savers are young (20% are under 25) and have so far spent relatively little time in the PRS. Around half of this class (54%) expect to buy their own property though generally not in the next 2 years.
Families Getting By make up 17% of the PRS or approximately 759,00 households.
-
Families Getting By do not necessarily have low incomes but are quite likely to be spending at least 30% of their income on rent. They are also unlikely to have savings. They are very likely to have dependent children.
-
Families Getting By are quite likely to have difficulty paying the rent (34%). They are among the least likely to be satisfied with their current accommodation and among the most likely to experience overcrowding (14%).
Struggling Families make up 11% of the PRS or approximately 473,000 households.
- Struggling Families are very likely to have dependent children. They are very likely to have a low income, spend more than 30% of their income on rent, and receive housing support.
- Nearly 1 in 4 (73%) of Struggling Families are lone parents. They are the group most likely to experience problems with damp (43%) and the most likely to experience overcrowding (15%). This group is also the most likely to have difficulty paying the rent (49%) and has the highest proportion of households who expect to move into the Social Rented Sector (27%), with 10% of households currently on the waiting list for social housing.
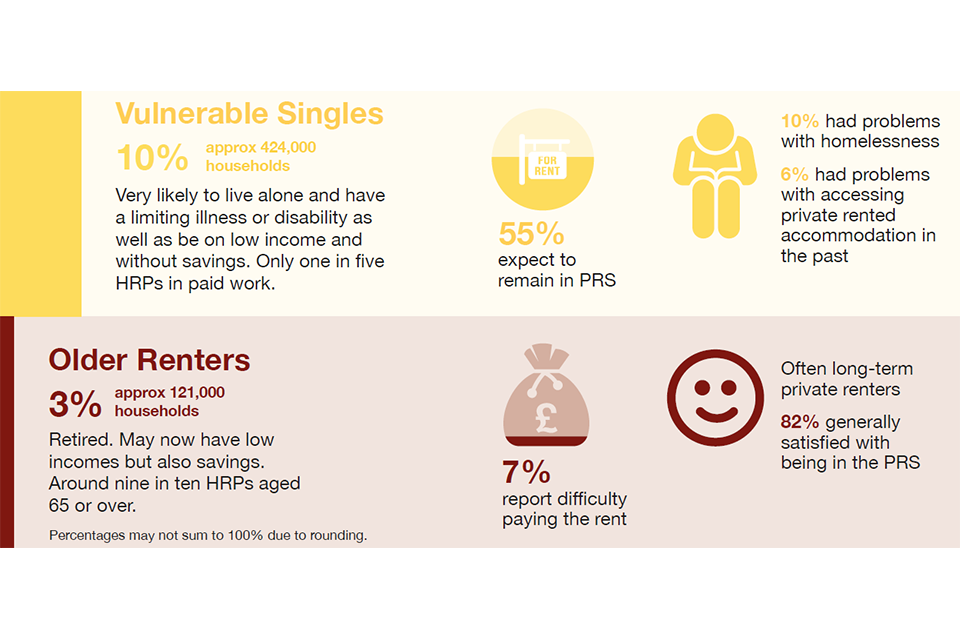
Vulnerable Singles make up 10% of the PRS or approximately 424,000 households
-
Vulnerable Singles are very likely to live alone and have a limiting illness or disability as well as be on low income and without savings.
-
Only 1 in 5 HRPs (household reference person – the person in whose name the accommodation is rented) in Vulnerable Single households is in paid work. They are often long term private renters, over half (55%) expect to remain in the PRS. This group is among the most likely to have difficulty paying the rent (43%). Some have struggled with homelessness in the past (10%) or been denied access to private rented accommodation (6%).
Older Renters make up 3% of the PRS or approximately 121,000 households.
-
Older Renters are mostly retired and while some may be on low incomes, they generally also tend to have savings.
-
Older Renters are among the most satisfied with their property (87%) and its state of repair (77%) and their current tenure (82%). They tend to have been in both the PRS and their current accommodation for a relatively long time and half expect to remain in the PRS.
Comfortable renters are 44% of privately renting households – approximately 1.94 million households
This group have few financial or other limitations on choice of housing. They are unlikely to have low income and relatively unlikely to have children or be in ill-health. The majority in managerial or professional occupations and/or educated to degree level.
- 1 in 4 expect to remain in the PRS
- 71% expect to buy their own home
- 36% expect to buy their own home within 2 years
Families Getting By are 17% of privately renting households – approximately 759,000 households
This group are not necessarily low income but spend high proportion of income on rent and unlikely to have savings. They are most likely to be couples with dependent children.
- 34% report difficulty paying rent
- 1 in 7 are living in overcrowded accommodation
- 37% have problems with damp or condensation
Low Income Savers are 16% of privately renting households – approximately 726,000 households
This groups are on low incomes and spend a high proportion of income on rent but have savings.
1 in 5 of household reference people in this group are under 25.
- They have been in the PRS for a relatively short amount of time – 15% have been renting for less than 12 months
- 54% expect to buy, but generally not within the next two years
Struggling families are 11% of privately renting households – approximately 473,000 households
Households in this group are very likely to be on low incomes, without savings and receive housing support. Nearly 3 in 4 are lone parents with dependent children.
- 49% report difficulty paying rent
- 27% of households expect to move into social housing in the longer term
- 1 in 10 households are on the list for social housing
Vulnerable Singles are 10% of privately renting households – approximately 424,000 households
People in this group are very likely to live alone and have a limiting illness or disability as well as be on low income and without savings. Only 1 in 5 have a household reference person in paid work.
- 55% expect to remain in the PRS
- 10% had problems with homelessness
- 6% had problems with accessing private rented accommodation in the past
The Older renters group account for 3% of privately renting households – approximately 121,000 households
Household reference people in this group are retired. They may now have low incomes but are also likely to have savings.
Around 9 in 10 household reference people in this group are aged 65 or over.
- 7% report difficulty paying the rent
- They are often long-term private renters – 82% are generally satisfied with being in the PRS
Introduction
The Levelling Up White Paper, published in February 2022 by the Department for Levelling Up, Housing and Communities, contained a number of measures to support the PRS. These include consulting on plans to introduce a legally binding Decent Homes Standard in the PRS for the first time (with the aim of reducing the number of non-decent rented homes by 50% by 2030), exploring a National Landlord Register and bringing forward other measures to reset the relationship between landlords and tenants, including through ending section 21 “no fault evictions”. The White Paper also included a commitment to ensure that by 2030, renters will have a secure path to ownership with the number of first-time buyers increasing in all areas.
Relatedly, and released at the same time as this report, the Department published the white paper A fairer private rented sector, outlined measures that would provide a better deal for private renters. This document set out a 12 point plan of action that included commitments to decrease the number of non-decent homes in the PRS, abolishing section 21 ‘no fault’ evictions and delivering a simpler more secure tenancy structure, the creation of a new Ombudsman for the private rented sector, as well as developing an online portal so landlords, tenants and local authorities to access information they need.
In 2019-20, the Private Rented Sector (PRS) accounted for 4.4 million or 19% of households in England.[footnote 1] The sector comprises a range of different household types, in different economic circumstances and with different housing experiences and aspirations. DLUHC commissioned secondary analysis of the English Housing Survey to support the development of upcoming policies and legislation by providing an enhanced understanding of the different types of households that make up the PRS. It has 3 main aims:
- to segment the PRS in England into distinct groups or classes. Specifically, different types of private renters will be identified based on objective economic and family circumstances which serve as potential barriers to accessing high-quality housing
- to understand the demographic characteristics (age, family circumstances, education, occupation, ethnicity) of the different PRS groups identified and their potential vulnerabilities
- to compare the housing experiences, attitudes and aspirations of the different PRS groups
Analysis was conducted using data from the English Housing Survey 2019-20. Data were collected from a representative sample of 13,223 households between April 2019 and March 2020. This includes 2,438 households in the PRS, the focus of this analysis.
Latent Class Analysis (LCA) was used to segment the PRS. The different classes were then compared on a variety of outcomes using descriptive statistics. Statistical testing was carried out to assess whether the experiences of each class of private renter were significantly different from one another.
1. Constructing a typology of private renters
Latent Class Analysis
Latent Class Analysis (LCA) is a statistical technique used to uncover unobserved groups or ‘classes’ within the data. Our analysis started from the assumption that there are unobserved groups of private renters, each facing different combinations of limitations when accessing the private rental market. Using LCA, we can learn about the set of limitations facing each group, and the relative size of each group in the wider population. Crucially, we can then use these groups to explore their demographic characteristics, experiences and aspirations in the private rental sector further. More information on this technique is given in the Technical notes.
A wide range of variables that may capture how people interact with the private rental market were tested in a variety of configurations. These included variables capturing households’ geographical location, their financial circumstances, employment situation, household composition and personal circumstances, for example whether anyone in the households faced limitations due to ill health. Over 100 different model specifications, i.e. different combinations of variables representing these limitations, were tested in total. The inclusion of a number of variables consistently produced a poorer model fit (see Technical notes for more on this): geographical location, whether the Household Reference Person (HRP) was a student and work status all resulted in a worse goodness-of-fit and so were not included in the final model.
Our final model segmented responding households based on whether they:
- were a single adult household
- had children
- fell into the 2 lowest income quintiles
- received housing benefit
- spent more than 30% of income on rent
- had savings
- contained someone with a limiting illness or disability
- had a HRP who was retired
Resulting typology: 6 types of private renter
Our final model resulted in 6 distinct classes of private renters. To understand how these classes are distinct and differ from one another, we can look at the likelihood that the model assigns to a household in a given class having each of the characteristics listed above. We can use these to create portraits of the classes as follows.
Comfortable Renters were unlikely to have a low income and unlikely to spend more than 30% of their income on rent or to receive housing support. They were the most likely group to have savings. They were unlikely to have a limiting illness or to be retired and were somewhat unlikely to have children.
Low Income Savers were unlikely to receive any housing support (including Housing Benefit, Local Housing Allowance or the housing support portion of Universal Credit). They were likely to have a low income but were also quite likely to have savings. They were unlikely to have children, to have a limiting illness or to be retired.
Families Getting By were very likely to have children. They were relatively unlikely to have a low income but somewhat likely to spend more than 30% of their income on rent and unlikely to have savings.
Struggling Families were very likely to have children. They were even less likely to have savings than Families Getting By and very likely to have a low income, spend more than 30% of their income on rent, and receive housing support.
Vulnerable Singles were very likely to live alone and likely to have a limiting illness. They were very unlikely to have children. They were also unlikely to have savings and very likely to have a low income, to spend more than 30% of their income on rent and to receive housing support.
Older Renters were very likely to be retired and quite likely to have a limiting illness. They were also likely to have savings but were somewhat likely to have a low income.
Further details of what the model assumes for the composition of each class are given in the Technical notes.
Predicting class membership in the wider population
The LCA model outlined above was used to predict the class membership of EHS sample members. Every household in the sample is assigned a probability of being in each class based on how closely (or otherwise) they aligned with the portraits above. They are then allocated to a predicted class based on the class to which they have the highest probability of belonging, that is the class that they most closely resemble.
On the basis of these predicted classes, we can make inferences about the distribution of the 6 different types of private renters across the wider population of private renters in England. The largest class was Comfortable Renters which covered 44% of households. Low Income Savers accounted for 16% of private renters while 17% of private renters were classed as Families Getting By and 11% fell into the Struggling Families class. 10% of households fell into the Vulnerable Singles class, and 3% were Older Renters, Figure 1.1.
This equates approximately to there being in England in 2019-20:
- 1,936,000 Comfortable Renter households
- 726,000 Low Income Savers
- 759,000 Families Getting By
- 473,000 Struggling Families
- 424,000 Vulnerable Singles
- 121,000 Older Renters
Figure 1.1: Class composition in the wider population, 2019-20

Base: all private renters
Source: English Housing Survey 2019-20, full household sample
2. Profiling private renters: demographic characteristics
This chapter compares households within the PRS based on their predicted class membership. Characteristics compared include their geographical location, age, working status, education, occupation and ethnicity.
Age of HRP
The age of private renters differed across the classes. Most Comfortable Renters had a HRP within the 25 to 74 age range (89%) with the largest proportion aged 25-34 (39%). Low Income Savers were the class with the highest proportion of HRPs aged 16 to 24 (20%). Conversely, Vulnerable Singles tended to be older than Comfortable Renters with 71% of HRPs in this class aged 45 or over, Figure 2.1.
Families Getting By and Struggling Families had a similar age profile with most HRPs in the 25 to 44 age bracket (73% of Families Getting By and 72% of Struggling Families). However, Struggling Families were slightly younger with 47% under 35 compared to 38% of Families Getting By.
Figure 2.1: Age of HRP by PRS class, 2019-20

Base: All Private Renters
Source: English Housing Survey 2019-20, full household sample
Ethnicity and nationality
Struggling Families (26%) and Families Getting By (23%) were the classes most likely to have a non-white HRP (compared with 18% of Comfortable Renters). Older Renters (5%) and Vulnerable Singles (11%) were less likely than Comfortable Renters to have a non-white HRP, perhaps reflecting the older age profile of these classes.
Comfortable Renters were among the most likely to have a HRP who was born outside the UK (34%) along with Families Getting By (37%). It is possible that these classes contain a relatively high proportion of economic migrants who moved to the UK to take up employment opportunities and which, at least in the case of Comfortable Renters, may be well paid professional jobs. Struggling Families were less likely than Comfortable Renters to have a HRP born outside the UK (22% compared with 34%). Vulnerable Singles and Older Renters (8% and 6% respectively) were even less likely to have a HRP born outside the UK, again likely related to their age and, potentially, their lower likelihood of being in work, Figure 2.2.
Excluding households where the HRP was born in the UK and Ireland, Comfortable Renters and Families Getting By were most likely to have HRPs from post-2004 EU countries. For Comfortable Renters, 36% of non-British born HRPs came from post-2004 EU countries compared with 27% from pre-2004 countries (the remaining 36% came from the Rest of the World). Among Families Getting By, 46% came from post-2004 EU countries compared with 15% from pre-2004 countries (and 39% from the Rest of the World). The pattern for Low Income Savers was slightly different; a lower proportion of HRPs were from post-2004 EU countries (25%) compared to pre-2004 EU/EFTA countries (38%) and the Rest of the World (37%).
Figure 2.2: Proportion of HRPs born outside of the UK by PRS Class, 2019-20

Base: All Private Renters
Source: English Housing Survey 2019-20, full household sample
Compared to other tenures, the PRS as a whole had the lowest proportion of HRPs born in the UK and Ireland (72%) compared to owners (96%) and social renters (92%). The origin of HRPs born outside the UK or Ireland was also different in the PRS compared with other tenures. The proportion of HRPs born in post 2004 EU countries was higher for the PRS (36%) compared with owners (26%) and social renters (28%). This may reflect the fact that the PRS tends to be younger and more transitory than other tenures.
Couples with children vs lone parents
Comfortable Renters, Low Income Savers, Vulnerable Singles and Older Renters were most likely to either be single adults or couples without (dependent) children. In contrast, nearly all Families Getting By and Struggling Families had dependent children (91% and 100% respectively). However, whereas most Families Getting By were couples with dependent children (83%), Struggling Families were most likely to be lone parents with dependent children (73%), Figure 2.3.
While the HRP in Families Getting By was most likely to be male (71%), the HRPs in Struggling Families were predominantly female (76%).
Figure 2.3 Proportion of couples and lone parents with dependent children by PRS class, 2019-20

Base: All Private Renters
Source: English Housing Survey 2019-20, full household sample
Employment status
Comfortable Renters were the most likely class to be economically active with 96% of HRPs in employment, this was followed by Families Getting By with 90% working. A lower proportion of HRPs – though still the majority – within Low Income Saver households and Struggling Families were employed (72% and 61% respectively). However, Vulnerable Singles were much less likely to be in employment with only a fifth of HRPs in this class in work, Figure 2.4.
Figure 2.4: Proportion of HRPs in work by PRS class, 2019-20

Base: All Private Renters
Source: English Housing Survey 2019-20, full household sample
Socio-economic class and education
Over half of Comfortable Renters (56%) had a HRP (or had been, if not currently, in work) in a managerial or professional occupation[footnote 2]. The other classes (with the exception of Older Renters) were less likely than Comfortable Renters to have a HRP in managerial or professional jobs and more likely to have a HRP in routine or semi-routine occupations. Vulnerable Singles were the class with the highest proportion of HRPs in semi-routine or routine jobs (51%) followed by Struggling Families (45%), Figure 2.5.
The proportion of HRPs who had achieved qualifications at degree level or higher varied across the classes. Whereas a majority of HRPs in the comfortable renter class (56%) were educated to degree level or above, this was the case for only a quarter of Vulnerable Singles and 19% of Struggling Families. Low Income Savers (30%) and Families Getting By (33%) were also less likely to have a HRP educated to degree level or above compared with Comfortable Renters.[footnote 3]
Figure 2.5: Socio-economic class of HRP by PRS class, 2019-20

Base: All Private Renters
Source: English Housing Survey 2019-20, full household sample
Regional distribution of PRS groups
The prevalence of different types of private renter varied by region. London and the South East was home to 43% of Comfortable Renters, higher than the proportion of this class in any another other region. In contrast the North of England[footnote 4] was home to the lowest proportion of Comfortable Renters, with 20% living in the North of England, Figure 2.6.
Figure 2.6: Household region by PRS group, 2019-20

Base: All Private Renters
Source: English Housing Survey 2019-20, full household sample
All other classes apart from Families Getting By were less likely to live in London and the South East than comfortable renters and (with the exception of Older Renters) more likely to live in the North of England. Vulnerable Singles and struggling families (both 37%) were the classes with the highest proportion of households living in the North of England.
Area deprivation
Older Renters were the least likely to be located in the most deprived 20% of areas (12%), followed by Comfortable Renters (17%)[footnote 5]. All other classes were more likely than Comfortable Renters to be located in the most deprived quintile. 34% of Struggling Families were located in one of the 20% most deprived areas along with 30% of Vulnerable Singles, 28% of Low Income Savers and 27% of Families Getting By, Figure 2.7.
Figure 2.7 Area deprivation by PRS class, 2019-20

Base: All Private Renters
Source: English Housing Survey 2019-20, full household sample
3. Profiling private renters: housing circumstances
This section compares the housing circumstances of different classes of private renters. Initially their time in the PRS and their current home is compared, followed by a comparison of the type of property and landlord. The condition of the property is explored before comparing differences in housing affordability between the different classes of private renters. This section also considers which classes are more likely to have had difficulties with accessing housing, for example to have experienced homelessness or been denied access to accommodation as a result of receiving benefits.
Time in Private Rented Sector and accommodation
Older Renters and Vulnerable Singles had spent the longest time in the PRS with 70% of Older Renters and 73% of Vulnerable Singles having spent 5 years or more in the sector. This compares with just 51% of Comfortable Renters who had spent 5 years or more in the sector, Figure 3.1.
Figure 3.1: Time in private rented sector by PRS class, 2019-20

Base: All Private Renters
Source: English Housing Survey 2019-20, full household sample
As well as having spent longer in the PRS overall, Older Renters were the most likely to have lived in their current accommodation for 5 years or more (71%). It was less common for Vulnerable Singles (50%) to have spent 5 or more years in their current accommodation. However, Vulnerable Singles were more likely to have spent 5 or more years in their current accommodation compared with Comfortable Renters (22%), Low Income Savers (23%), Families Getting By (31%) or Struggling Families (32%).
Type of property and landlord
The type of property lived in varied by class. Vulnerable Singles (34%) and Comfortable Renters (31%) were the classes most likely to live in purpose-built flats. The proportion of Comfortable Renters living in purpose-built flats was higher than the proportion of Struggling Families (23%), Families Getting By (14%) and Older Renters (14%) that did so, Figure 3.2.
Struggling Families (42%) and Families Getting By (44%) were the classes most likely to live in terraced housing. They were more likely than Comfortable Renters (33%) to do so. The 2 ‘family’ classes were also more likely than Comfortable Renters to live in a semi-detached house (27% of Families Getting By and 26% of Struggling Families compared with 17% of Comfortable Renters).
Vulnerable Singles (24%) and Low Income Savers (16%) were more likely to live in a flat conversion or room compared with Comfortable Renters (8%) while Older Renters (31%) were more likely than all other classes to live in a detached house or bungalow.
The variation in housing type across classes is likely to be related to affordability but also household size and composition (more families living in houses while classes with a higher prevalence of single adults living in flats). It should also be noted that the availability of different types of property will vary by region as, for example, it is more common for people in London and the South of England to live in flats compared with the North or Rest of England. Some of the variation in property type by PRS class may therefore reflect the different geographical spread of the classes (see above).
Figure 3.2: Type of property by PRS class, 2019-20

Base: All Private Renters
Source: English Housing Survey 2019-20, full household sample
There was little variation in the type of landlord households within the PRS said they had. With the exception of Older Renters, 85% or more of households in all classes reported that they had a private individual (as opposed to their employer, a family member or an organisation) as their landlord. For Older Renters, however, only 53% reported a private individual as their landlord while 34% of Older Renters (more than in any other class) reported that their landlord was a friend or relative.
Condition of Property
Overcrowding
Families Getting By (14%) and Struggling Families (15%) had higher rates of overcrowding compared with other classes. This is consistent with these classes being more likely than other classes to have children in the household. In comparison, the proportion of Comfortable Renters who lived in overcrowded houses was 6%, Figure 3.3.
Figure 3.3: Overcrowding by PRS class, 2019-20

Base: All Private Renters
Source: English Housing Survey 2019-20, full household sample
Damp, mould or condensation
A relatively high proportion of households in all classes reported issues with damp, mould or condensation, Figure 3.4. Struggling Families were the class most likely (43%) to say their property had these problems and significantly more likely to report these problems compared with Comfortable Renters (33%). Low Income Savers had the joint lowest rates of reported damp (27%, with Older Renters) and were less likely to report problems than Comfortable Renters.[footnote 6]
Figure 3.4: Reported presence of damp in the property by PRS class, 2019-20

Base: All Private Renters
Source: English Housing Survey 2019-20, full household sample
Support for home improvements
Older Renters were the class most likely to have received financial support for energy efficiency improvements in their home (18%). This support could have been received from either a government scheme, local authority or the landlord. There were no significant differences in the proportions of other classes that had received support, which included 7% of Struggling Families and Vulnerable Singles and 4% of Comfortable Renters and Families Getting By.
Affordability
Difficulty paying rent
Struggling Families (49%) were the most likely to have had difficulty paying their rent. This class was substantially more likely than all other classes (with the exception of Vulnerable Singles where the differences was not statistically significant), to say they found it difficult to pay their rent.
All classes except Older Renters (7%) were more likely than Comfortable Renters (16%) to say they found it difficult to pay their rent, Figure 3.5.
Figure 3.5: Proportion households reporting difficulty paying rent by PRS class, 2019-20

Base: All Private Renters
Source: English Housing Survey 2019-20, full household sample
Rent arrears
The findings on households in rent arrears follow a similar pattern to those described for difficulty paying rent. A lower proportion of Comfortable Renters (4%) had been in rent arrears in the past year compared with all other classes (although the difference with Older Renters, 8%, was not statistically significant).
Struggling Families (15%) were the class with the highest proportion of households who had been in rent arrears, significantly higher than Comfortable Renters, Low Income Savers (9%) and Families Getting By (8%). 11% of Vulnerable Singles had been in rent arrears in the past year.
Difficulty accessing housing
Struggling Families and Vulnerable Singles were the groups most likely to report previous difficulties with accessing housing. For example, 14% of Vulnerable Singles and 10% of Struggling Families had previously experienced a period of homelessness. This compares with just 1% of Comfortable Renters, Figure 3.6.
Similarly, 10% of Struggling Families and 6% of Vulnerable Singles reported being denied access to rented accommodation as a result of being in receipt of housing support. This compares with less than 1% of Comfortable Renters who reported this experience.
Figure 3.6: Proportion who have experienced homelessness by PRS class, 2019-20

Base: All Private Renters
Source: English Housing Survey 2019-20, full household sample
4. Profiling private renters: housing aspirations
This section compares different classes of private renters with respect to both satisfaction with their current accommodation (including the property, neighbourhood and being in the Private Rented Sector (PRS)) and their longer-term expectations and aspirations. The report presents findings on which type of tenure households expect in the longer term, whether they expect to buy their own property and in what time frame.
Satisfaction with current accommodation
Comfortable Renters (86%), Low Income Savers (87%) and Older Renters (87%) were mostly happy with their current property. While all classes were more likely to say they were satisfied than dissatisfied, Vulnerable Singles (81%), Families Getting By (78%) and Struggling Families (74%) were the least likely to report being satisfied with their current property, Figure 4.1.
Struggling Families were also the least likely to be satisfied with the current state of repair of their property (66%). They were the only class less likely to be satisfied than Comfortable Renters (74%).
Older Renters were the most likely to be satisfied with their current neighbourhood (89%) followed by Comfortable Renters (86%) and Vulnerable Singles (85%). Low Income Savers (79%) and Struggling Families (77%) were less likely than Comfortable Renters to be satisfied with their neighbourhood, perhaps because issues with housing affordability had given them less choice over where to rent.
Figure 4.1: Proportion satisfied with current accommodation by PRS group, 2019-20

Base: All private renters
Source: English Housing Survey 2019-20, full household sample
Older Renters were also the most likely to be satisfied with their current tenure (private renting) and more likely to be satisfied than Comfortable Renters (82% compared with 70%). This is consistent with Older Renters having spent more time in the PRS (see previous section) and being among the most likely to expect to remain in the sector (see below).
Struggling Families were the least likely to be satisfied with their current tenure (62%) and significantly less likely to be satisfied even than Comfortable Renters, though potentially for different reasons. While most Comfortable Renters were looking to move out of the PRS to buy, a sizeable proportion of Struggling Families were looking to move from the PRS to the Social Rented Sector (SRS, see below).
Expectations for the longer term
Comfortable Renters were the least likely to say they expected to remain in the PRS (25%), followed by Families Getting By (27%). All other classes were more likely than Comfortable Renters to expect to remain in the PRS. In particular, half of Older Renters and just over half (55%) of Vulnerable Singles expected to remain in the PRS, Figure 4.2. This is consistent with these 2 classes reporting the highest satisfaction with their current tenure.
Figure 4.2: Type of housing expect to live in in the longer term by PRS group, 2019-20

Base: All private renters
Source: English Housing Survey 2019-20, full household sample
The proportion of those who did not think they would remain in the PRS varied between classes. A relatively high proportion of Struggling Families (27%) and Vulnerable Singles (21%) said they expected to be in the SRS in the longer term. In addition, 19% of Struggling Families and 10% of Vulnerable Singles said they were currently on the waiting list for social housing. Struggling Families, Vulnerable Singles and Families Getting By (14%) were all more likely than Comfortable Renters (4%) to expect to be in the SRS in the longer term.
In contrast, Comfortable Renters were the most likely to say that they expected to be an owner occupier rather than remaining in the PRS (68%). All other classes were less likely than Comfortable Renters to say they expected to be an owner occupier, with Vulnerable Singles the least likely to expect this (15%).
When asked specifically whether or not they expected to buy a house, Comfortable Renters were the most likely to say yes (71%), followed by Families Getting By (67%), Figure 4.3. Low Income Savers and Struggling Families were both less likely than Comfortable Renters to expect to buy (54% of both groups) while Older Renters and Vulnerable Singles were the least likely to expect to buy (22% and 21% respectively). The reasons for not expecting to buy are likely to vary between groups (though the survey did not ask about this directly). Affordability is likely to be a key factor for Low Income Savers and Struggling Families while age or ill health may be more of a factor for Vulnerable Singles or Older Renters.
As well as being the most likely to expect to buy, Comfortable Renters generally expected to do this sooner than other classes. Among those who said they expected to buy, 36% of Comfortable Renters said they expected to buy within the next 2 years compared with only 24% of Families Getting By, 14% of Low Income Savers and 6% of Struggling Families. In contrast, Low Income Savers (47%) and Struggling Families (67%) were more likely than Comfortable Renters (29%) to expect to buy 5 or more years in the future, perhaps reflecting the fact that they would need longer to save for a deposit. While 21% of Comfortable Renters had savings of £16,000 or more (and 10% had savings of £50,000 or more), this was the case for only 1% of Families Getting By and Struggling Families, 3% of Vulnerable Singles and 8% of Low Income Savers.
Figure 4.3: Proportion who expect to buy by PRS group, 2019-20

Base: All private renters
Source: English Housing Survey 2019-20, full household sample
Summary
A segmentation analysis of the private rented sector (PRS) using the English Housing Survey points to 6 different classes of household in the PRS each facing different limitations on their ability to access high-quality housing and, as such, likely to require different degrees (and types) of policy support.
The largest class within the PRS are Comfortable Renters (44% of the PRS or approximately 1.9 million households). This class face relatively few limitations on their choice of housing – being unlikely to have low income or be spending a high proportion of their income on rent and relatively unlikely to have children or be experiencing ill health – and as such are relatively unlikely to require further support. This group – a high proportion of whom are in managerial or professional occupations and have a degree – are among the least likely to experience issues with their accommodation such as overcrowding or damp or to have difficulty paying the rent. They are the most likely to expect to move out of the PRS by buying their own home, with many in this class expecting to do this within the next 2 years.
The analysis also identified a small class of Older Renters (3% of the PRS or approximately 121,000 households), most of whom are retired, who appear to have relatively little need for additional support with their tenure. Some of this class face issues with low income and/or poor health but they are among the most satisfied with their property and its state of repair and their current tenure. They tend to have been in both the PRS and their current accommodation for a relatively long time and expect to remain in the PRS.
Compared with Comfortable Renters and Older Renters, Low Income Savers (16% of the PRS or approximately 726,000 households) face some financial barriers to accessing housing as a result of low income. As a result, a higher proportion of this class reported difficulty in paying their rent compared with Comfortable Renters. However, this group had similar levels of satisfaction with their current property to Comfortable Renters. Many Low Income Savers are young and have so far spent relatively little time in the PRS. Around half of this class expect to buy their own property and for these households their time in the PRS may be a temporary stepping-stone to home ownership as their income (and savings) grow over the life course. However, there is also the potential that members of this group who are not in a position to buy may require further support over time.
Along with Comfortable Renters, Families Getting By (17% of the PRS or approximately 759,000 households) are the group most likely to expect to leave the PRS and to expect to buy their own property. However, this group – who face financial barriers to accessing housing as well as being very likely to have children – are among the most dissatisfied with their current property. They are also more likely than Comfortable Renters to have problems paying their rent to have problems with overcrowding. They may therefore benefit from additional help to buy and/or financial support to enable them to move to a larger property.
Struggling Families – who represent 11% of the PRS or approximately 473,000 households – face some of the biggest limitations on their housing situation and are likely to benefit most from additional support. They are very likely to have children as well as to be on low incomes, in receipt of housing benefit and without savings. Compared with Families Getting By, this group comprises a higher proportion of lone parents, people from semi-routine or routine occupations and non-white backgrounds. They are the class most likely to experience problems with damp and, along with Families Getting By, more likely than other groups to experience overcrowding. This class is also the most likely to have difficulty paying the rent and has the highest proportion of households who expect to move into the SRS, with 10% of households currently on the waiting list for social housing.
Vulnerable Singles - who represent 10% of the PRS or approximately 424,000 households - look quite different demographically to Struggling Families. They are more likely to be older, without children and less likely to be in work and are generally more satisfied with their current accommodation and tenure. However, along with Struggling Families, they are the group most likely to struggle with housing affordability. Alongside Struggling Families this group are also the most likely to have had difficulties with homelessness or accessing private rented accommodation in the past and to be potential candidates for a move to the SRS.
Technical notes
Significance testing
Where comparative statements have been made in the text, these have been significance tested to a 95% confidence level. All tests have been carried out using Comfortable Renters as a reference group. This means we are 95% confident that there is a real world difference between the group being discussed and Comfortable Renters.
Small sample sizes
The reliability of the results of sample surveys, including the English Housing Survey, is positively related to the unweighted sample size. Results based on small sample sizes should therefore be treated as indicative only because inference about the national picture cannot be drawn. This is a particular consideration when drawing conclusions about the Older Renter class which is relatively small, comprising only 3% of the sample or 71 households. The actual number of cases available for analysis may sometimes be lower than this depending, for example, on questionnaire routing or other missing data.
Latent Class Analysis
A common issue when working with social survey data is that we collect information on a number of objective measures that can be used to describe cases, such as demographic variables or specific experiences. These variables themselves are often inter-linked, and may be underpinned by an unobserved, latent trait. The common pattern of response between these variables – the thing which links these patterns of response - is therefore unobserved i.e. it is not recorded explicitly in the data.
Latent Class Analysis is an analytical technique that aims to classify individual cases into groups – or classes - based on their pattern of response to a range of separate, but inter-linked survey items. Unlike traditional segmentation methods, LCA uses models based on unobserved, latent variables that underpin these manifest survey items to assign respondents into meaningful sub-groups rather than assuming that survey items are independent predictors of class membership. Therefore “true” class membership is not known, but an optimal class can be estimated for each case (or household) from an LCA model.
To derive classes we selected categorical dependent variables to serve as ‘indicators’ of someone’s class membership. These indicators were dichotomised and coded 1 if a household had a certain characteristic and 0 otherwise. For this project, we focused on a range of risk factors which might limit households’ abilities to access the rental market.
With the indicators broadly defined, we tested over 100 models with different configurations of indicators and numbers of classes. We selected the optimal number of classes using the Bayesian Information Criterion (BIC), the preferred goodness-of-fit statistic for assessing LCA models. For any given configuration of indicators, we selected the number of classes with the lowest BIC value. We used the poLCA package in R to build a loop to automatically select the number of classes with the lowest BIC and set the starting seed to ensure comparability between models.
The choice of indicator variables was driven by 2 key considerations. Firstly, our final model needed to adequately cover the ways in which a renter might be limited when accessing the rental market. Following discussions among the research team the following dimensions of potential limitations were identified as important to include:
- Income
- Receipt of housing benefit
- Illness or disability
- Number of adults and dependents living in the household
- The rental market in their area
Second, we sought to identify a model that captured the above with the best goodness-of-fit. Because LCA typically assumes local independence, we could not utilise 2 indicators capturing the same or similar limitations in the same model. Therefore, we adopted an iterative process to identify indicators that produced best model fit per the model’s BIC.
Based on these criteria, we initially arrived at a 5 class solution which included the following variables:
- were a single adult household
- had children
- fell into the 2 lowest income quintiles
- received housing benefit
- spent more than 30% of income on rent
- had savings
- contained someone with a limiting illness or disability
However, further examination of the classes identified 1 class which was hard to interpret as it contained high proportions of both retired people and young people. Following discussions with DLUHC it was decided to add retirement status to the model and split this class into 2. Adding retirement status to the model resulted in a 6 class solution which had a slightly worse fit than the original 5 class solution. However, the 6 class solution was retained as it was felt the resulting typology would be more informative for targeting policies to different classes effectively. The final set of indicator variables used was:
- were a single adult household
- had children
- fell into the 2 lowest income quintiles
- received housing benefit
- spent more than 30% of income on rent
- had savings
- contained someone with a limiting illness or disability
- Household Reference Person was retired
From an LCA model, 2 sets of probabilities can be produced.
- Conditional item-response probabilities: These are the probabilities of a case (or household) having any given input characteristic, given their class membership. In this analysis they show the likelihood that respondents in each class exhibit each of the household characteristics described in the indicator variables; for example, the probability of households in Comfortable Renters being a single adult household. These can be used to describe each class and show how they are distinct from one another.
- Class membership probabilities: These are estimated for all cases for all classes and reflect the likelihood that each individual case will belong to any particular class.
Because the definition of the classes, and allocation of cases to those classes, is based on probabilities we can talk in terms of classes being more or less likely to hold each of the input characteristics (as we do in the first section of this report). However, we cannot make definitive statements about the precise composition of each class.
To enable us to make more definitive statements about the classes and compare the housing circumstances of different classes (as we do in subsequent sections of this report) each case is assigned to one class. The class to which cases are assigned is the one to which they had the highest probability of belonging.
Once households have been assigned to a class, we can investigate the differences between classes according to a range of relevant variables. This does not include the input variables used to construct the LCA model, as these are used in the process of defining the classes themselves. But using the predicted class assignment (based on class membership probabilities) from these models, the membership of all classes can be described and compared in terms of the prevalence as other demographic variables, their housing conditions, satisfaction and aspirations.
Acknowledgements
Each year the English Housing Survey relies on the contributions of a large number of people and organisations. The Department for Levelling Up, Housing and Communities (DLUHC) would particularly like to thank the following people and organisations, without whom the 2019-20 survey and this report, would not have been possible: all the households who gave up their time to take part in the survey, NatCen Social Research, the Building Research Establishment (BRE) and CADS Housing Surveys.
This report was produced by Sarah Butt, Joseph Cant, Imogen Stevenson, Bea Taylor and Isabel Taylor from NatCen Social Research in collaboration with DLUHC.
If you have any queries about this report, would like any further information or have suggestions for analyses you would like to see included in future EHS reports, please contact ehs@levellingup.gov.uk.
The responsible analyst for this report is: Chauncey Glass, Housing and Planning Analysis Division, DLUHC. Contact via ehs@levellingup.gov.uk
-
English Housing Survey 2019-20 Headline Report. 2019-20 data were the latest available at the time this report was commissioned. ↩
-
Socio-economic class is measured using the National Statistics Socio-economic classification. ↩
-
Only HRPs under the age of 75 were asked about their educational qualifications. ↩
-
North of England is defined as the North-east, North-west and Yorkshire and the Humber. ↩
-
Deprivation is measured using the 2019 Indices of Multiple Deprivation. ↩
-
The difference between Older Renters and Comfortable Renters is not statistically significant given the low sample size for the older renter group. ↩