Employers’ understanding of the gender pay gap and actions to tackle it: research report on the 2018 survey
Published 21 January 2019

© Crown copyright 2019
This publication is licensed under the terms of the Open Government Licence v3.0 except where otherwise stated. To view this licence, visit nationalarchives.gov.uk/doc/open-government-licence/version/3 or write to the Information Policy Team, The National Archives, Kew, London TW9 4DU, or email: psi@nationalarchives.gov.uk.
Where we have identified any third party copyright information you will need to obtain permission from the copyright holders concerned.
This publication is available at https://www.gov.uk/government/publications/employers-understanding-of-the-gender-pay-gap-and-actions-to-tackle-it-research-report-on-the-2018-survey/employers-understanding-of-the-gender-pay-gap-and-actions-to-tackle-it-research-report-on-the-2018-survey
Employers’ understanding of the gender pay gap and actions to tackle it
Research report on the 2018 survey
January 2019
James Murray, Paul Rieger and Hannah Gorry – OMB Research
This research was commissioned by the Government Equalities Office (GEO). The GEO is responsible for equality legislation and policy for gender and LGBT.
The research was undertaken by OMB Research. We would like to thank all of the private, voluntary and public sector organisations that kindly took the time to participate in the quantitative survey, and those who subsequently provided additional feedback during the qualitative follow-up interviews.
1. Executive summary
1.1 Introduction
The government has introduced gender pay gap (GPG) transparency regulations[footnote 1], which are designed to encourage large employers to take informed action to close their GPG where one exists. These regulations came into force in April 2017 and affect around 10,000 employers across the private, voluntary and public sectors in England, Scotland and Wales.
This report provides results from the 2018 research which was conducted shortly after the deadline for employers to publish their first set of GPG data. The survey covered large employers’ understanding of the GPG, their experiences of complying with the regulations, and the actions they were taking to close their GPG (or ensure one did not develop). It followed on from an initial survey in 2017 which provided a baseline measure of employers’ awareness, understanding and actions.[footnote 2] Where available, comparative results have been provided from the 2017 research to show any changes over time.
This research consisted of a telephone survey of 900 large employers (with 250+ staff), and 30 follow-up qualitative interviews to explore the key issues in more detail. It took place between July and October 2018.
1.2 Understanding of the GPG
Overall, 82% of respondents (typically senior HR staff) felt they had a good understanding of what the GPG is and how it is calculated, and a further 16% believed they had a reasonable understanding but were not sure of the specifics. The remaining 2% indicated that they had only a limited understanding of the GPG.
The vast majority (88%) also believed they had a good understanding of the difference between ‘closing the GPG’ and ‘ensuring equal pay between men and women’. In most cases they were at least reasonably confident that this knowledge extended to the top levels of their organisation. A quarter (25%) believed their board/leadership team had a ‘very good’ understanding of the GPG and approaching two-thirds (63%) felt they had a ‘fairly good’ understanding.
Across all these measures, knowledge of the GPG has improved significantly since the 2017 baseline survey. The proportion of respondents with a good understanding of the GPG has increased from 48% to 82%, the proportion with a good understanding of how it differs from equal pay increased from 63% to 88%, and the proportion judging their board to have a very or fairly good understanding of this increased from 71% to 87%.
The qualitative interviews found that the process of identifying, collating and analysing their data had improved employers’ understanding of what the GPG is and how it differs from equal pay. Where understanding was still more limited, this was typically because the employer either did not have a GPG or did not place a high priority on reducing it.
Although employer understanding had improved, some were concerned that it was less well understood by their staff and/or the general public (particularly the difference between GPG and equal pay). A number added that the steps they had taken to educate their staff and customers had been impeded by some of the media reporting on the issue.
1.3 Experiences and impact of the regulations
Almost all of the surveyed employers (97%) had reported their first year’s GPG data on the official government portal, with a slightly lower proportion (91%) publishing it on their own website. Among the 3% that had not reported on the portal, this was primarily because they did not meet the eligibility criteria when the regulations came into force (for example, they had fewer than 250 employees at the 5th April 2017 ‘snapshot’ date).[footnote 3] GEO data shows that 100% of in-scope employers published their data.[footnote 4][footnote 5]
Among those that published their GPG data on the portal, 96% did so by the official deadline. However, most (88%) did this towards the end of the reporting period, between January and April 2018. This is consistent with GEO data on the reporting dates for all in- scope employers.[footnote 6] The main reasons for not reporting earlier related to the time taken to complete the various tasks (collating the data, running the analysis, etc). A minority referenced more deliberate or strategic reasons such as focusing on more important priorities, simply aiming for the agreed deadline, or delaying to first see other organisations’ results and how these were explained.
The qualitative interviews found that the timing of publication was often influenced by a combination of factors. The time taken to collate and calculate the data was often said to be exacerbated by a slow internal sign-off process and/or a reluctance among senior leaders to publish early.
The vast majority (96%) obtained internal sign-off from their leadership team prior to publishing and most (83%) produced a narrative commentary. Commentaries were typically used to explain the reasons for the employer’s GPG (90%), and most reported that these included strategies and actions to reduce it (62%) and more detailed analysis of their data (59%).[footnote 7]
In the qualitative phase, most employers explained that the key influence on the decision to produce a narrative commentary (and its content) was due to the size of their GPG and its perceived causes. Those with a large (or higher than expected) GPG typically focused on explaining the underlying reasons and how they were planning to address it. This was often driven by a desire to minimise any negative perceptions among employees and customers. Those with a low or no GPG were more likely to use the narrative commentary to highlight the ‘good news’ and explain why this was the case.
Regardless of the size of their GPG, most employers used their commentary to explain how the GPG was calculated and stress that it differed from equal pay.
There was also qualitative evidence that some employers had developed or adapted the content of their commentaries after reviewing what other organisations had published.
This was often the case when employers were producing commentaries in a short timeframe, immediately before the reporting deadline.
When asked to rate the overall ease of complying with the GPG reporting regulations, just over a third (35%) of respondents judged it to be very or fairly straightforward.
However, a similar proportion (30%) found it very or fairly difficult. In terms of the individual tasks involved, employers typically found it very/fairly straightforward to submit their results on the portal (81%). However, reaction was more divided for the other tasks. 47% found it straightforward to understand what they were required to do, 41% to gather the necessary data, 53% to calculate their results and 45% to decide and agree how to explain their results.
The qualitative interviews found that employers’ experiences of the ease of complying were driven by 3 main factors: the complexity of their workforce and pay structures (for example, multiple divisions, use of contract staff, bonus schemes), the sophistication of their payroll system (whether the software could produce automated GPG reports) and the availability of knowledgeable/experienced staff to undertake the process. In a minority of cases respondents highlighted a lack of clarity on specific regulatory requirements (for example, exactly what should/should not be included in their calculations).
Many employers in the qualitative sample had under-estimated the complexity of the task and the time required to complete it. However, most expected the process to be smoother and quicker in future, now that they were aware of the requirements and had developed a process to meet them.
A third (33%) of employers believed they would have benefited from additional support or guidance that was not available to them. The main suggestions related to providing more guidance on how to calculate their results (including how to deal with issues such as salary sacrifice, commission and contract staff) and making the information easier to understand and/or more concise.
Most respondents believed that the requirement to measure and report their GPG data had resulted in a greater engagement with the issue at senior-level within their organisation. Around two-thirds agreed that the regulations had increased awareness of gender pay issues at board level (69%) and prompted board level discussion or conversation about their GPG (67%). Approaching half (46%) reported that this had resulted in the board taking action to address their GPG. All of these were most prevalent within larger organisations of 1,000 or more staff, and the likelihood of the board taking action increased among those with a higher GPG.
The qualitative interviews again provided further insight into the motivations behind this senior-level engagement. Some boards wanted to know how to tackle their GPG in order to be fair and ethical but others adopted a more defensive approach, questioning the validity of the GPG figure and/or considering how best to minimise negative publicity.
Respondents were often unable to pinpoint specific changes in board-level plans or behaviour, beyond a broad intention to monitor their GPG and/or seek to find ways to reduce it in the future.
When asked about their GPG results in the survey, two-thirds of employers (66%) indicated that women’s median pay was lower than men’s and they therefore had a GPG in favour of men.[footnote 8] Half (50%) had drawn their employees’ attention to their published GPG results but done nothing further. While 16% had adopted an active engagement strategy, a third (32%) had not done any promotional activity at all. The higher their self- reported GPG, the more likely employers were to have actively engaged with their staff about the results. Evidence from the qualitative interviews suggests that employers’ primary motivation for communicating results to their staff was to maintain morale and avoid concerns developing.
Most organisations reported that there had been little response to their published GPG results among their employees. 81% said there had been little or no reaction, 17% indicated there had been some (but not widespread) attention paid to them and only 2% reported widespread reaction. Even among those with a high self-reported GPG of over 20%, just 7% reported widespread staff reaction.
1.4 Reducing the GPG
Employer attitudes to reducing the GPG varied widely, with 23% allocating it a high priority, 45% a medium priority and 29% a low (or non-) priority. There has been no change since the baseline survey in the proportion treating the GPG as a high priority (24% in 2017 compared with 23% in 2018), but the proportion viewing it as either a high or medium priority has risen from 61% to 69%.
The larger an employer’s self-reported GPG, the more likely they were to treat it as a high priority (ranging from 32% of those with a GPG in excess of 20%, down to 6% of those with a GPG of up to 5%). However, those organisations indicating that they did not have a GPG at all were most likely to allocate a high priority to maintaining this situation (39%).
Those treating their GPG as a high priority were typically motivated by moral or ethical considerations such as a desire to be fair/non-discriminatory (51%). However, a fifth (20%) also highlighted the potential impact on their reputation as a motivating factor.
Employers that allocated a low (or non-) priority to reducing their GPG were generally evenly split into those that did not need to do any more (for example, they only had a small GPG), those that believed they could not do any more (for example, there was little they could do to change it, there were few female applicants in their sector), and those that had no desire to do any more (for example, they had other priorities, they explained that they paid based on ability not gender).
Three-quarters (73%) felt that the priority allocated to reducing their GPG had not changed since calculating their results to meet the regulations. However, a quarter (24%) indicated it was now a higher priority (with this rising to 43% among those with a high GPG of over 20%).
The qualitative interviews suggested that most employers still had a relatively passive attitude to GPG, and therefore the priority allocated to it had rarely changed significantly (as yet). In some cases, while awareness had increased, other issues were still considered more pressing. Many employers felt it was too early (after just one year of measuring data) to judge the scale of their GPG issue and the action required.
Furthermore, a small number of respondents felt that the GPG measure as defined by the regulations did not provide a fair or useful reflection of their employment practices and/or approach to gender equality. They felt that it ignored broader factors such as the availability of female candidates, found it too blunt a measure or thought that the actions required to reduce GPG would be detrimental to their wider equality and diversity.
In terms of employers’ approach to reducing their GPG (or ensuring they continued to have no GPG), there was a roughly even split between those that had developed a formalised strategy (34%), those that intended to take action but had not yet developed specific plans (33%) and those that did not intend to take any action (30%). Around half of those that had developed a GPG strategy had already implemented some or all of the specified actions (16% of all employers).
The proportion of employers that had developed a GPG strategy has increased since the baseline wave (from 21% to 34%), with a notable rise in the proportion that had already implemented some of these actions (from 6% to 16%). Over half (56%) of employers with a self-reported high GPG in excess of 20% had developed a formalised strategy to address it.
In most cases employers’ GPG strategies included a range of measures, and the proportions adopting each of these has increased since the baseline wave. The majority included offering or promoting flexible working (87% in 2018 compared with 71% in 2017), promoting parental leave policies that encourage both men and women to share childcare (76% compared with 65%), seeking to make cultural changes within their organisation (65% compared with 51%), and implementing gender-specific recruitment, promotion or mentoring schemes (62% compared with 35%).
Although two-thirds (67%) of surveyed employers had either already developed a GPG strategy or planned to take action in future, there appears to be some reluctance to publicise GPG reduction measures. Only 30% of employers had either published a specific GPG action plan or intended to do so. Furthermore, only around half of this group (equating to 16% of all surveyed employers) indicated this would be published externally (for example, on their website).
The qualitative research found that GPG strategies and action plans were often part of a wider equality and diversity plan/policy, and few employers had a dedicated action plan that focussed solely on GPG. As such, although they were applicable to GPG, many of the initiatives had already been put in place to address other equality/diversity objectives. However, in some cases these existing activities had been reviewed and revised in the context of reducing the organisation’s GPG.
Qualitative interviews with those employers that had produced a GPG action plan often found that this simply consisted of a list of actions incorporated into their narrative commentary. Most of these were said to be relatively succinct, involving a small number of overarching ambitions or commitments rather than specific, measurable actions.
While many had aspirations to address their GPG in future, examples of concrete action taken in response to the regulations were relatively rare. Where employers had already implemented actions, this was typically because these actions had been in place for some time as part of other strategies and initiatives (and had often been ‘re-badged’ for their GPG plan). However, in a minority of cases the qualitative interviews found that employers had implemented new actions such as reviewing pay structures, recruitment practices and policies.
Most (72%) of those that had already taken steps to reduce their GPG planned to evaluate the impact of these actions as part of a formalised process rather than on an ad- hoc basis, with this typically undertaken at least annually. However, the qualitative interviews found that this ‘formalised’ evaluation often only involved employers continuing to monitor their GPG results.
The qualitative interviews also explored the perceived challenges to reducing the GPG (across the various measures). The vast majority of employers mentioned broad issues relating to their industry sector or society as a whole (for example, lack of female applicants, lack of qualified female candidates, and a perception that women were more likely to prioritise family life over their careers). Many also mentioned internal barriers such as the slow turnover of senior-level staff and the scale and structure of their current workforce, meaning that it would be very difficult to significantly reduce their GPG in the short term.
1.5 Future GPG measurement and reporting
Almost all respondents (99%[footnote 9]) were aware that, going forwards, large employers would be required to report their GPG results every year.[footnote 10] Approaching two-thirds (61%) intended to next publish their results in the final quarter of the reporting period (between January and April 2019). A further 16% expected to publish between October and December 2018, with just 5% planning to do so between April and September 2018 and 17% still undecided.
However, the qualitative interviews found that although employers now had a better understanding of the timescales involved in producing their GPG data, most were not working towards a specific publication date but rather acting on loose plans for when they would carry out the work and subsequently publish. While all employers thought that complying with the regulations was important, none considered publishing early to be a priority. Instead, most were simply focussed on publishing their data by the deadline.
When asked their views on the metrics that they were required to report under the regulations, the vast majority felt that the proportion of women in each pay quartile was either very or fairly useful (83%). Two-thirds (66%) described the differences in mean/median hourly rate as useful but there was less consensus on the metrics relating to bonuses. 57% felt the proportion paid bonuses was useful and 52% found the differences in mean/median bonus pay useful.
Around a quarter (23%) felt that there were other metrics that employers should be required to report, in addition to the current ones. The most widespread suggestions were comparisons across job roles (7%), the full and part time split by gender (4%) and the proportion of men and women employed across the organisation as a whole (4%).
1.6 Conclusions
The introduction of the transparency regulations has succeeded in driving up employer awareness and understanding of GPG and how it differs from equal pay. However, more accurate and wide-reaching communication of this to the general public would help reassure employers that their GPG results will not be misinterpreted.
Despite calculating their GPG prompting increased consideration of the issue among many employers, engagement remains relatively reactive. In most cases the focus has been on complying with the regulations, explaining or justifying their results and communicating an intention to reduce their GPG in the future. As yet the regulations do not appear to have resulted in many employers developing concrete, measurable and targeted actions to reduce their GPG.
If the regulations are to have a significant impact on overall GPG, more widespread and specific actions by employers will be required. Many employers are still waiting for longer term confirmation that their GPG needs addressing or believe that any actions they take will require several years to have an impact. Furthermore, some believe that reducing their GPG is outside of their control and the qualitative interviews found that others do not do not consider the GPG measure to provide a fair refection of their organisation. These perceptions typically deter employers from taking action, so further engagement to educate and challenge these views would be beneficial.
Despite evidence that complying with the regulations was a considerable burden on many employers, the process should become increasingly straightforward in the future now that employers are familiar with the requirements.
2. Introduction
This report details the findings from a study carried out by OMB Research, commissioned by the Government Equalities Office (GEO). The research provides evidence on large employers’ understanding of the gender pay gap (GPG), their experiences of complying with the GPG transparency regulations, and the actions they are taking to close their GPG (or ensure that one does not develop).
The research used both quantitative and qualitative methods and was conducted between July and October 2018.
2.1 Background
The government has committed to eliminate the gender pay gap. The GPG is an overall measure which reflects differences in median[footnote 11] hourly earnings and labour market participation by gender. Currently the overall gender pay gap for all employees is 17.9%, the lowest since records began.[footnote 12]
New regulations introducing mandatory gender pay gap reporting for large employers aim to encourage employers to take informed action to close their GPG where there is one.
These regulations came into force in April 2017 and require private and voluntary sector organisations with 250+ employees to publish GPG statistics every year.[footnote 13] The same requirements have been introduced for public sector organisations in England (and non- devolved authorities operating across England, Scotland and Wales) by amending the Specific Duties regulations made under Section 153 of the Equality Act 2010.
The Government Equalities Office (GEO) commissioned OMB Research to develop a robust research programme to measure large employers’ understanding of the GPG, understand their experiences of complying with the transparency regulations, and identify the actions they are taking to close their GPG (or ensure that one does not develop).
This report provides results from the 2018 survey, which followed on from an initial baseline survey in 2017.[footnote 14] Comparative results from the 2017 research have been provided to identify any changes over time.
The primary aims of the 2018 research were:
- to provide insight on employers’ understanding of the GPG, covering both HR and board level staff
- to understand employers’ experiences of complying with the regulations, including how and when they published their statistics, how easy or difficult they found the process, and any impact on board-level awareness and actions
- to gather detail on the level of priority employers allocate to reducing their GPG, the actions they are taking (or planning) to address it, and the success of any such actions to date
- to understand the perceived barriers to taking action
The research took place between July and October 2018, 3 to 6 months after the deadline for employers to publish their 2017 GPG data.
2.2 Methodology
The research consisted of a quantitative survey of large employers, supplemented by qualitative in-depth interviews with a selection of those who participated in the main survey.
Quantitative survey
Telephone interviews were conducted with 900 large employers between 11th July and 16th August 2018, and covered private, voluntary and public sector organisations with 250 or more employees. These interviews lasted an average of 22 minutes and were conducted with HR directors/managers or other senior staff who confirmed they had responsibility for dealing with their organisation’s response to the GPG transparency regulations.
The sample was provided by the Office for National Statistics (ONS) and was sourced from the Inter-Departmental Business Register (IDBR), which has comprehensive coverage of large employers. All employers in Northern Ireland, and public sector organisations in Scotland and Wales, were excluded from the sample as they are not subject to the GPG transparency regulations.[footnote 15]
Quotas were set on broad sector, size band and Standard Industrial Classification (SIC) code to ensure good coverage of the large employer population. While these quotas were largely representative of the target population, the voluntary and public sectors were over-sampled to allow robust sub-analysis. For example, voluntary sector organisations account for 12% of the large employer universe but made up 28% of the interviews conducted. This resulted in statistical confidence intervals of ±4.8% for the private sector, ±5.5% for the voluntary sector and ±5.5% for the public sector.[footnote 16]
Table 1 sets out the profile of all large GB employers subject to the GPG transparency regulations (based on ONS data), and the profile of the achieved interviews.
Table 1 - Universe and achieved interviews by sector and size
| Sector | Size | Universe (ONS data): Number | Universe (ONS data): % | Interviews: Number | Interviews: % |
|---|---|---|---|---|---|
| Private | 250 to 499 employees | 3,721 | 38% | 178 | 20% |
| 500 to 999 employees | 1,889 | 19% | 112 | 12% | |
| 1,000 or more employees | 1,725 | 17% | 101 | 11% | |
| Sub-total: Private | 7,335 | 74% | 391 | 43% | |
| Voluntary | 250 to 499 employees | 595 | 6% | 126 | 14% |
| 500 to 999 employees | 310 | 3% | 67 | 7% | |
| 1,000 or more employees | 299 | 3% | 59 | 7% | |
| Sub-total: Voluntary | 1,204 | 12% | 252 | 28% | |
| Public | 250 to 499 employees | 505 | 5% | 87 | 10% |
| 500 to 999 employees | 272 | 3% | 57 | 6% | |
| 1,000 or more employees | 557 | 6% | 113 | 13% | |
| Sub-total: Public | 1,334 | 14% | 257 | 29% | |
| Total | 9,873 | 100% | 900 | 100% |
Overall, 90% of the interviews were conducted with organisations based in England, 7% in Scotland and 3% in Wales. This closely replicates the geographical distribution of large employers across Great Britain.
The final survey data was then weighted back to the true profile of large GB employers, with the weights applied based on a combination of size (employee numbers) and sector.
Qualitative depth interviews
In addition to the main survey, a total of 30 qualitative follow-up interviews were completed between 27th July and 3rd October 2018. These in-depth interviews were conducted by telephone and lasted an average of 30 minutes.
The sample consisted of 2 different groups:
- Longitudinal sample: 12 interviews were conducted with employers who were also interviewed in the equivalent qualitative phase of the 2017 research, allowing a detailed analysis of how their views and plans had developed over time.
- Fresh sample: 18 interviews were conducted with employers who were interviewed in the 2018 quantitative survey.
In each case, these respondents had previously given consent to be contacted for follow- up research on the GPG for GEO.
Interlocking quotas were set on level of engagement with the GPG (derived from the survey data[footnote 17]) and size of business. The quotas were intentionally skewed towards employers that were more engaged with the GPG, in order to better understand the actions taken.
The achieved interview profile is set out in Table 2.
Table 2 - Qualitative interviews by GPG engagement and size
| GPG engagement | Employees: 250 to 499 | Employees: 500 to 999 | Employees: 1000 or more | Total |
|---|---|---|---|---|
| Already taking action / engaged | 3 | 2 | 4 | 9 |
| Planning / likely to take action | 3 | 5 | 3 | 11 |
| Not taking action / unengaged | 4 | 3 | 3 | 10 |
| Total | 10 | 10 | 10 | 30 |
Further quotas were set on broad sector. Overall, 21 of the qualitative interviews were conducted with the private sector, 4 with the voluntary sector and 5 with the public sector. As far as possible within the constraints of the above quotas, a representative spread was also achieved by SIC and region (including coverage of the devolved administrations).
2.3 Analysis and reporting conventions
This report contains findings from both the quantitative survey and the qualitative follow- up interviews. Where results are based on the qualitative data, this is clearly identified.
Quantitative reporting
Throughout this report, references to ‘all employers’ and the ‘total’ columns in the charts and tables refer only to the employer population sampled for the survey (GB private, public and voluntary sector organisations with 250 or more employees).
Unless explicitly noted, all quantitative findings are based on weighted data. Unweighted bases (the number of responses from which the findings are derived) are displayed on tables and charts as appropriate to give an indication of the robustness of results.
The quantitative data presented in this report is from a sample of large employers rather than the total population. This means the results are subject to sampling error.
Differences between sub-groups and changes over time are commented on only if they are statistically significant at the 95% confidence level (unless otherwise stated). This means that there is at least a 95% probability that any reported differences are real and not a consequence of sampling error.[footnote 18]
When interpreting the data presented in this report, please note that results may not sum to 100% due to rounding and/or due to employers being able to select more than one answer to a question.
Where relevant, this report contains analysis of the survey results by the size of employers’ median GPG. This analysis is based on the self-reported GPG figures collected during the interviews rather than using the official data they published on the GPG portal. Respondents were not asked to look up the exact figure during the telephone interview and the survey data may therefore not always match their published figures (due to poor recall, rounding, confusion between the median and mean figures, etc.).
Qualitative reporting
It should be noted that the qualitative phase of the research was based on interviews with a small sample of employers. Although the weight of opinion has sometimes been provided for clarity and transparency, these findings should be treated as indicative and cannot necessarily be extrapolated to the wider population.
Direct quotations have been provided as illustrative examples. However, in some cases these have been abbreviated and/or paraphrased for the sake of brevity and comprehension (without altering the original sense of the quote).
3. Understanding of the GPG
This chapter explores employers’ awareness and understanding of the gender pay gap. More specifically, it covers:
- understanding of what the GPG refers to and how it’s calculated
- understanding of the difference between closing the GPG and ensuring equal pay between men and women
3.1 Respondent understanding of the GPG
Overall, 82% of respondents felt they had a good understanding of what the GPG is and how it is calculated (Figure 1). Most of the remainder (16%) believed they had a reasonable understanding. While a small minority (2%) indicated that they only had limited understanding of the GPG, none of the survey respondents reported that they had never heard of the term ‘gender pay gap’ or knew nothing about it.
Figure 1 - Self-reported understanding of the GPG
| Never heard of it | Heard term but don’t know anything about it | Limited understanding of what it refers to | Reasonable understanding but not how it’s calculated | Good understanding of what it is and how it’s calculated | |
|---|---|---|---|---|---|
| Total | 0% | 0% | 2% | 16% | 82% |
| Private sector | 0% | 0% | 2% | 17% | 81% |
| Voluntary sector | 0% | 0% | 0% | 15% | 85% |
| Public sector | 0% | 0% | 0% | 15% | 85% |
| 250 to 499 employees | 0% | 0% | 3% | 17% | 80% |
| 500 to 999 employees | 0% | 0% | 1% | 16% | 83% |
| 1,000 or more employees | 0% | 0% | 0% | 15% | 85% |
Base: all respondents (Base, Don’t know). Total (900, 0%), Private (391, 0%), Voluntary (252, 0%), Public (257, 0%), 250 to 499 employees (391, 0%), 500 to 999 (236, 0%), 1,000 or more (273, 0%)
There were no statistically significant differences by sector or employer size, with at least 80% of each group reporting a good understanding of the GPG.
Figure 2 shows that understanding of the GPG has improved significantly since the 2017 survey, which was conducted after the transparency regulations had come into force but before the deadline for employers to publish their GPG data. The proportion with a good understanding has risen from 48% to 82%, with this increase evident across all sectors and employer sizes. In 2017 understanding of the GPG was lower in the private and voluntary sectors than the public sector, but it is now at a similar level. Employers with 250 to 999 staff also displayed lower understanding than those with 1,000 or more staff in 2017, but this difference is no longer evident.
Figure 2 – Proportion reporting a good understanding of the GPG (over time)
| 2017 survey | 2018 survey | |
|---|---|---|
| Total | 48% | 82% |
| Private sector | 47% | 81% |
| Voluntary sector | 49% | 85% |
| Public sector | 58% | 85% |
| 250 to 499 employees | 43% | 80% |
| 500 to 999 employees | 47% | 83% |
| 1,000 or more employees | 60% | 85% |
Base: all respondents (2017/2018). Total (900, 900), Private (406/391), Voluntary (243/252), Public (251/257), 250 to 499 employees (412/391), 500 to 999 (214/236), 1,000 or more (274/273)
Qualitative insight
The qualitative interviews provide further detail about understanding of the GPG, how it is calculated and how to interpret it. They also show how levels of understanding have changed since 2017. The majority of respondents were able to accurately define GPG, and many spontaneously described some or all of the calculations made and what these related to. Most mentioned mean and median figures and analysis of data by quartiles.
“It is the average pay differences between male and females and it is worked out on quartiles. We have had to become very familiar with this.” (500 to 999, Private sector)
Many employers explained their understanding of GPG had increased significantly as a result of going through the processes required to comply with the GPG reporting regulations. Some respondents who were also interviewed last year (the longitudinal qualitative sample) described how their initial basic level of understanding (often obtained through training seminars and guidelines published by GEO or Acas) had been enhanced by the first-hand experience of identifying, collating and analysing real data.
“Our understanding is hugely different now. I suppose we were forced to find out more about this by the regulations. Everyone has been really interested.” (250 to 499, Private sector)
A minority of employers provided less accurate descriptions of GPG and how it is calculated. In line with findings from last year, these respondents were usually confused about the difference between GPG and equal pay.
“It is something to do with looking at the wage structure. How it is different from paying men and women equally is a good question, I am not sure.” (250 to 499, Private sector)
Those with more limited understanding of GPG explained that they had not given the topic much thought since completing the calculations and publishing their data for 2017. This was usually because they either did not have a GPG or did not place a high priority on reducing their GPG. The reasons for disengagement with GPG are described in more detail in chapter 5.1 of this report.
“We don’t have a problem. It isn’t something we discuss very much.” (250 to 499, Private sector)
3.2 Understanding of difference between GPG and equal pay
Reflecting the high levels of understanding of what the GPG is, the vast majority of respondents (88%) also believed they had a good understanding of the difference between ‘closing the gender pay gap’ and ‘ensuring equal pay between men and women’ (Figure 3). A further 11% knew there was a difference but were not sure of the detail, and just 2% did not know that it differed from equal pay.
Figure 3 - Understanding of the difference between ‘closing the GPG’ and ‘ensuring equal pay’
| Didn’t know there was a difference | Know there’s a difference but not sure exactly what this is | Good understanding of how they differ | |
|---|---|---|---|
| Total | 2% | 11% | 88% |
| Private sector | 2% | 12% | 86% |
| Voluntary sector | 1% | 6% | 93% |
| Public sector | 0% | 7% | 93% |
| 250 to 499 employees | 2% | 13% | 85% |
| 500 to 999 employees | 2% | 9% | 89% |
| 1,000 or more employees | 1% | 8% | 91% |
Base: all respondents (Base, Don’t know). Total (900, 0%), Private (391, 0%), Voluntary (252, 0%), Public (257, 0%), 250 to 499 employees (391, 0%), 500 to 999 (236, 0%), 1,000 or more (273, 1%)
The proportion with a good understanding of how the GPG differs from equal pay was higher among respondents from voluntary and public sector organisations (both 93%) than those working in the private sector (86%).
Respondents from smaller organisations with 250 to 499 employees were less likely to report a good understanding (85%, compared to 89% for 500 to 999 and 91% for 1,000 or more).
As detailed in Figure 4, self-reported understanding of the difference between closing the GPG and ensuring equal pay has risen significantly over the last year, with 63% of respondents reporting a good understanding in 2017 compared to 88% in 2018.
Figure 4 – Proportion reporting a good understanding of the difference between ‘closing the GPG’ and ‘ensuring equal pay’ (over time)
| 2017 survey | 2018 survey | |
|---|---|---|
| Total | 63% | 88% |
| Private sector | 60% | 86% |
| Voluntary sector | 63% | 93% |
| Public sector | 76% | 93% |
| 250 to 499 employees | 57% | 85% |
| 500 to 999 employees | 64% | 89% |
| 1,000 or more employees | 71% | 91% |
Base: all respondents (2017/2018). Total (900, 900), Private (406/391), Voluntary (243/252), Public (251/257), 250 to 499 employees (412/391), 500 to 999 (214/236), 1,000 or more (274/273)
The above data refers to respondents’ own perceptions of their understanding. To explore their knowledge in more detail, respondents were provided with 3 different scenarios and asked to indicate whether each one referred to a breach of equal pay law, a gender pay gap issue (but not a breach of equal pay law) or neither. The scenarios tested were as follows:
-
A company where there is a difference in the annual pay of men and women solely because more women work fewer hours.
-
A company where there is a difference in the average hourly pay of men and women because more women work in less senior roles.
-
A company where men and women are paid a different hourly rate for doing the same job.
As set out in Figure 5 below, 90% of respondents correctly identified that scenario 3 referred to a breach of equal pay law and 80% correctly identified that scenario 2 referred to a GPG issue.
However, there was less consensus on scenario 1 and only 40% of respondents correctly identified that this was neither a breach of equal pay law nor a GPG issue. Most of the remainder (46% of all respondents) believed that this was a GPG issue.
Figure 5 - Scenarios to explore understanding of the difference between GPG issues and breaches of equal pay law
| Breach of equal pay law | GPG issue | Neither | Don’t know | |
|---|---|---|---|---|
| Scenario 1: A company where there is a difference in the annual pay of men and women solely because more women work fewer hours | 10% | 46% | 40% | 4% |
| Scenario 2: A company where there is a difference in the average hourly pay of men and women because more women work in less senior roles | 7% | 80% | 11% | 2% |
| Scenario 3: A company where men and women are paid a different hourly rate for doing the same job | 90% | 7% | 2% | 1% |
- In scenario 1, 40% correctly answered ‘neither’
- In scenario 2, 80% correctly answered ‘GPG issue’
- In scenario 3, 90% correctly answered ‘Breach of equal pay law’
Base: all respondents (900)
Similar proportions of respondents from each sector and size band identified that scenario 1 was neither a breach of equal pay law nor a GPG issue. However, public and voluntary sector respondents were more likely than those in the private sector to know that scenario 2 was a GPG issue and scenario 3 was a breach of equal pay law. Larger employers (1,000 or more staff) were more likely to provide the correct response to scenario 2.
Qualitative insight
The improvement in understanding of the difference between the GPG and breaches of equal pay law observed in the quantitative survey was echoed in the qualitative interviews. Many respondents noted that it had taken some time for them to fully understand the differences, but through the process of calculating their GPG and deciding how to present the results, the differences had become more apparent.
However, some respondents explained that they were still unclear about the issue to some extent. While they were now aware that a difference exists (which they had often not been prior to the introduction of the regulations), they were still not fully aware of exactly how the 2 concepts differed.
“We know that there is a difference, but it is a very confusing thing. They seem very similar.” (500 to 999, Private sector)
As in the 2017 research, some respondents were concerned that the difference between GPG and equal pay was not well understood by their staff and/or the general public.
Many had taken steps to educate their staff and customers through the narrative commentary they produced to accompany their GPG results, and via other channels such as team meetings. However, they could not be sure that everyone had fully understood what they had been told. Furthermore, some felt that public understanding of the meaning of GPG had been damaged by media reporting on the issue.
“I really think that the public are very unclear on this issue. It was not helped by lots of coverage about the BBC, which was really to do with equal pay rather than the gender pay gap.” (500 to 999, Voluntary sector)
3.3 Leadership team’s understanding and engagement
As detailed in Figure 6, when asked specifically about their leadership team or board approaching two-thirds (63%) felt that this group had a ‘fairly’ good understanding of the gender pay gap and the difference between this and equal pay. A quarter (25%) described their leadership team as having a ‘very’ good understanding of this issue.
Figure 6 - Leadership team’s perceived understanding of the GPG and the difference from equal pay
| Very pooor understanding | Fairly poor understanding | Fairly good understanding | Very good understanding | |
|---|---|---|---|---|
| Total | 1% | 11% | 63% | 25% |
| Private sector | 1% | 12% | 63% | 22% |
| Voluntary sector | 0% | 6% | 61% | 33% |
| Public sector | 0% | 7% | 61% | 31% |
| 250 to 499 employees | 1% | 12% | 65% | 21% |
| 500 to 999 employees | 0% | 12% | 60% | 26% |
| 1,000 or more employees | 1% | 7% | 60% | 31% |
Base: all respondents (Base, Don’t know). Total (900, 1%), Private (391, 1%), Voluntary (252, 0%), Public (257, 1%), 250 to 499 employees (391, 1%), 500 to 999 (236, 1%), 1,000 or more (273, 1%)
Voluntary and public sector organisations had the most confidence in their leadership team’s understanding of this issue, with 94% and 92% respectively judging this to be very or fairly good (compared to 85% for the private sector). This also increased among larger employers of 1,000 or more staff, with 91% of this group believing that their board had a very or fairly good understanding of the GPG and how it differs from equal pay.
The survey data suggests that knowledge of the GPG at senior-level has risen since large employers have been required to measure and report their data (Table 3). The proportion describing their leadership team as having a very or fairly good understanding has increased from 71% in the 2017 survey to 87% in 2018. This increase can be seen across all sectors and employer sizes.
Table 3 - Leadership team’s perceived understanding of the GPG and the difference from equal pay (over time)
| Total | Sector: private | Sector: voluntary | Sector: public | Size: 250 to 499 | Size: 500 to 999 | Size: 1,000 or more | ||
|---|---|---|---|---|---|---|---|---|
| Base: All respondents | 2017 | 900 | 406 | 243 | 251 | 412 | 214 | 274 |
| Base: All respondents | 2018 | 900 | 391 | 252 | 257 | 391 | 236 | 273 |
| Very good understanding | 2017 | 17% | 17% | 15% | 22% | 14% | 19% | 22% |
| Very good understanding | 2018 | 25% | 22% | 33% | 31% | 21% | 26% | 31% |
| Very or fairly good understanding | 2017 | 71% | 70% | 69% | 79% | 68% | 72% | 77% |
| Very or fairly good understanding | 2018 | 87% | 85% | 94% | 92% | 86% | 87% | 91% |
Qualitative insight
Evidence from the qualitative interviews supports the assertion that the GPG reporting regulations have increased understanding among senior-level staff. Many respondents explained that their boards or leadership teams were better informed about the issue than they were a year ago (and often more engaged with it).
“Before the regulations, understanding and interest were negligible, but since we are now being made to publish, the chair of trustees has really taken ownership.” (250 to 499, Voluntary sector)
However, in line with the findings reported in 2017, employers reporting very high levels of understanding among their senior-level staff often explained that GPG had formed part of their wider diversity and equality strategy, and as such had been monitored for some time. In these cases, the regulations had not served to increase understanding of GPG and how it differs from equal pay.
Most respondents were HR professionals. Many explained that their (and their team’s) understanding of GPG was more detailed and complete that that of their senior leaders. Most had sought to educate their senior staff on the topic since the announcement of the GPG reporting regulations, and had often done so at various points during the period of complying for the first time. Some had provided detailed briefings or training sessions at board meetings. Others had less formal discussions with senior staff and shared written information about the regulations.
“We had always done equal pay audits, but in the past 18 months I have been trailing the introduction of GPG with the board to get them thinking in this way as well.” (250 to 499, Private sector)
“We did a lot of communications with the board after the regulations were announced. I would say it is reasonably well understood at that senior level now, and better than it was.” (1,000 or more, Private sector)
However, a minority of employers reported a continued lack of understanding among some or all senior-level staff since the introduction of the regulations. They explained that while they had informed and advised senior leaders about the GPG this information did not appear to have been retained, typically because the organisation did not have a (significant) GPG or the leadership team did not regard reducing it as a priority.
In some cases, respondents explained that it had taken a number of attempts to make senior leaders understand the difference between equal pay and gender pay gap. This was said to be due to a lack of engagement and interest in the topic, in some cases linked to scepticism about the fairness and sensitivity of GPG as a measure.
“It has been difficult to get some of the board to accept it. They can’t understand how there can be a gap when we pay men and women the same for the same job.” (250 to 499, Private sector)
4. Experiences and impact of the regulations
This chapter looks at employers’ experiences of the first year of the GPG regulations. Specifically, it covers:
- how employers reported their GPG data, including narrative commentaries
- when employers published their results and the reasons
- GPG results among the surveyed employers
- ease of complying and additional support required
- impact of the regulations on board-level awareness and action
- how GPG results were communicated and the reaction among staff
4.1 Reporting of GPG data
It is a legal requirement for eligible organisations with 250+ employees to report their gender pay data on the government portal and publish it on their own public-facing website.[footnote 19] The vast majority (97%) of surveyed employers confirmed that they had reported their first year’s GPG data on the government portal by the time they were interviewed.
Although GEO data shows that 100% of all in-scope employers reported their GPG results on the portal[footnote 20], at the time they were interviewed a small minority (3%) of the surveyed employers indicated that they had not done this. As shown in Table 4, this was typically because they did not meet the eligibility criteria when the regulations came into force in April 2017 (for example, they had fewer than 250 employees at that time[footnote 21]).
A very small number of those that had not published at the time they were interviewed claimed that this was because they were unaware of the regulations/requirement (4 respondents) or were still waiting for a 3rd party to produce their GPG data (1 respondent). However, this may be linked to the timing of the survey. Four of these were interviewed in July and could therefore have published after this point but prior to the GEO announcing 100% compliance on 1st August. It may also be the case that some of those unaware of the regulations were in fact out of scope (for example, fewer than 250 employees at the time of the GPG ‘snapshot’ date, but 250+ by the time they were interviewed).
Table 4 - Reasons for not publishing GPG data on the government portal
| All not publishing | |
|---|---|
| Base: All who did not publish GPG data on portal | 32 |
| Not required as had less than 250 employees | 69% |
| Not aware of regulations / requirement to report on portal | 14% |
| Not required as subject to Scottish/Welsh specific duties (for example, university)[footnote 22] | 9% |
| Not required as was not yet a legal entity | 3% |
| Results published by different part of organisation (for example, head office or different subsidiary) | 3% |
| Waiting for 3rd party to produce the GPG data/report | 1% |
Overall, 91% of employers confirmed that they had published their GPG data on their own website. This proportion was slightly lower among private sector employers (90%) than those in the voluntary (95%) or public (94%) sectors. Smaller organisations with 250 to 499 employees were also less likely to have done this (88%, compared to 93% for 500 to 999 and 95% for 1,000 or more).
As shown in Figure 7, most employers (85%) published one set of GPG data for their entire organisation. However, the larger the organisation the more likely they were to instead publish separate data for different subsidiaries, with almost a quarter (24%) of those with 1,000 or more staff adopting this approach.
Figure 7 - Whether GPG results were published for the entire organisation or separately for different subsidiaries
| Separate GPG data for different subsidiaries | One set of GPG data for whole organisation | |
|---|---|---|
| Total | 13% | 85% |
| Private sector | 15% | 83% |
| Voluntary sector | 8% | 89% |
| Public sector | 4% | 94% |
| 250 to 499 employees | 7% | 91% |
| 500 to 999 employees | 11% | 87% |
| 1,000 or more employees | 24% | 75% |
Base: all who published GPG data on government portal (Base, Don’t know). Total (868, 2%), Private (380, 2%), Voluntary (240, 2%), Public (248, 2%), 250 to 499 employees (368, 2%), 500 to 999 (233, 1%), 1,000 or more (267, 2%)
The vast majority of employers (96%) obtained internal sign-off from their leadership team or board prior to publishing their results. Most (83%) produced a narrative commentary alongside their GPG data, and three-quarters (73%) used the GPG viewing service to review results from other organisations (Table 5).
Table 5 - Internal sign-off, narrative commentaries and use of the GPG viewing service
| Total | Sector: Private | Sector: Voluntary | Sector: Public | Size: 250 to 499 | Size: 500 to 999 | Size: 1,000 or more | |
|---|---|---|---|---|---|---|---|
| Base: All publishing GPG data on portal | 868 | 380 | 240 | 248 | 368 | 233 | 267 |
| Got internal sign-off from leadership team or board | 96% | 97% | 94% | 95% | 96% | 95% | 98% |
| Produced accompanying narrative commentary | 83% | 81% | 92% | 90% | 77% | 86% | 93% |
| Used GPG viewing service | 73% | 72% | 73% | 78% | 71% | 72% | 78% |
Private sector employers were least likely to have produced a narrative commentary (81%, compared to 92% of voluntary and 90% of public sector organisations). The use of narrative commentaries also increased with employer size, ranging from 77% of those with 250 to 499 staff to 93% of those with 1,000 or more staff.
Comparative data from the 2017 baseline survey suggests that discovering the extent of their GPG prompted many employers to produce an accompanying narrative commentary to explain their results. At the time of the 2017 survey (when most employers had not yet run their GPG calculations) just 15% planned to publish a narrative commentary, whereas the 2018 survey data shows that 83% of employers ultimately decided to do this.
This is supported by further analysis of the 2018 data (Table 6), which shows that those employers with a GPG were more likely to have produced a narrative commentary than those without a GPG (88% compared with 77%). This proportion was highest among those with larger GPGs of over 10%. A similar pattern was seen when it came to use of the GPG viewing service to review results from other organisations.
Table 6 - Internal sign-off, narrative commentaries and use of the GPG viewing service (by self-reported size of GPG)
| Has a GPG: Yes | Has a GPG: No | Size of GPG: 20% or higher | Size of GPG: 11% to 20% | Size of GPG: 6% to 10% | Size of GPG: Less than 6% | |
|---|---|---|---|---|---|---|
| Base: All publishing GPG data on portal | 576 | 252 | 142 | 165 | 93 | 103 |
| Got internal sign-off from leadership team or board | 97% | 94% | 99% | 96% | 97% | 99% |
| Produced accompanying narrative commentary | 88% | 77% | 95% | 94% | 84% | 85% |
| Used GPG viewing service | 79% | 62% | 85% | 80% | 85% | 75% |
Figure 8 shows that the vast majority of the employers that produced a narrative commentary used this to explain the reasons for their GPG (90%). Many commentaries were also used to focus on how employers would address any issues, with 62% including GPG strategies/actions and 17% incorporating targets for reducing their GPG.
Figure 8 - Narrative commentary content
| Content | Percentage |
|---|---|
| An explanation of the reasons for your GPG | 90% |
| Strategies and actions to reduce your GPG | 62% |
| More detailed analysis of your data | 59% |
| Comparisons with your sector or key competitors | 31% |
| Targets for reducing your GPG | 17% |
| Other | 9% |
Base: all who produced narrative commentary (Base, Don’t know, None of these). Total (754, 2%, 2%)
Qualitative insight
All employers in the qualitative phase had developed some form of narrative commentary to accompany their results, and the interviews explored how these had been developed.
Decisions about whether to produce a commentary, and its content, were usually made through discussion between senior managers and HR teams. However, the exact approach varied to some extent by organisation size and sector. Smaller employers were more likely to have tasked one individual (often the HR Director) with the preparation of the commentary, which would then be signed off by senior leaders. Larger employers were more likely to have involved marketing and external communications departments.
Most employers explained that the size of their GPG (and its perceived causes) was the key influence on whether they produced a narrative commentary and what they included in this. For example, those with a large GPG working in male dominated sectors were focused on how best to explain the underlying reasons and minimise the negative impression their headline figure may give to (prospective) employees and customers.
Others (often with unexpectedly large GPGs) who placed a high priority on being a fair and equal employer wanted to explain what they were planning to do to reduce it. Those with a low or no GPG were more likely to use the narrative commentary to highlight the ‘good news’ and explain why this was the case.
There is also some evidence that employers were prompted to produce a narrative commentary after logging onto the GPG viewing portal and seeing the number and type of other organisations that had done this.
“We looked at what other companies had done. We were not sure how we were going to approach it, so essentially did what most had done.” (500 to 999, Private sector)
Furthermore, some employers explained that they had also adapted the content of their commentaries after reviewing what other organisations had published. In some cases, they had looked at a range of commentaries and taken inspiration or ideas for how to present their own data. Others explained that they had used another organisation’s commentary as a template for their own. This was often the case when employers were producing commentaries in a short timeframe, immediately before the reporting deadline.
“We did it all a bit last minute, so we adapted another report from the website. It was simple, just the facts.” (250 to 499, Private sector)
The media coverage of other high-profile cases led to some employers re-examining their approach and amending the content of their commentary. However, media coverage more often influenced the decision to produce a commentary (and associated timings) rather than its content. Employers often explained that they had decided to produce a commentary relatively late on (in response to media attention) and this was therefore less detailed and considered than they would ideally have wanted. Some planned to address this earlier in future to allow them to produce a more comprehensive commentary.
“It was bumped to late in the year by other things, and we only realised late on we should do a commentary, so it was very basic. We will look at it in more detail next year.” (500 to 999, Private sector)
In a minority of cases, employers used third parties such as HR consultants to create or check their commentaries (along with their GPG data) before publication. They wanted to make sure they were staying within the law and were not misrepresenting their results.
The scale and coverage of the commentaries described by employers varied. The following broad types of document were described:
- Short, factual based summaries of results. This approach was common among employers with a small or no GPG and/or those who did not see addressing their GPG as a priority. In these cases, organisations felt they only needed to provide the information, explain how the calculations were made and what they meant. However, some with large GPGs also adopted this approach. They explained that they did not want to draw attention to their results or they did not want to appear to be ‘making excuses’ for their GPG, as both could prompt negative publicity.
- Short summaries with accompanying explanations. This approach included more information explaining why employers were reporting a (large) GPG figure.
Employers often explained that they wanted to show that their figure was not a ‘fair’ representation of their recruitment and employment policies. Some also wanted to use the commentary as a means of drawing attention to factors they felt contributed to the GPG but were outside their control, such as limited availability of suitable female candidates in their sector. Those with low or no GPG sometimes included statements from senior staff outlining the policies that they had in place which were likely to have contributed to their results. In other cases their commentaries also included benchmarking data to highlight how their GPG compared with their competitors or sector.
- Short summaries with action plans. In some cases, employers included action plans to reduce their GPG within short summary narrative commentaries. They explained that they wanted to demonstrate a commitment to tackling the issue. The detail and content of action plans varied (and is discussed in more detail in chapter 5.3). However, the majority were described as relatively succinct, often describing commitments to maintain/review existing policies or consider how best to tackle the issue, rather than detailed and specific actions.
- Longer, more detailed ‘GPG reports’. A minority of employers (often larger and/or public sector) had produced more comprehensive reports. These often included a detailed explanation of how GPG is calculated, a full breakdown of the organisation’s results, additional analysis (for example, by division or department) and information about their employment and equality/diversity policies. They usually included action plans for reducing GPG (or maintaining a low GPG).
4.2 Timing of publication
Among the surveyed employers that published their GPG data on the portal, 96% did so by the deadline of 4th April 2018 (or 30th March 2018 for public sector organisations), as detailed in Table 7. However, most (88%) did not do so until early 2018.
Table 7 - Date of publishing GPG data on the government portal
| Total | Sector: Private | Sector: Voluntary | Sector: Public | Size: 250 to 499 | Size: 500 to 999 | Size: 1,000 or more | |
|---|---|---|---|---|---|---|---|
| Base: All publishing GPG data on portal | 868 | 380 | 240 | 248 | 368 | 233 | 267 |
| Published by deadline | 96% | 95% | 98% | 98% | 96% | 93% | 98% |
| - Apr-Jun 2017 | 1% | 1% | 0% | 1% | 0% | 1% | 1% |
| - Jul-Sep 2017 | 1% | 1% | 1% | 1% | 1% | 1% | 0% |
| - Oct-Dec 2017 | 2% | 1% | 2% | 4% | 2% | 1% | 2% |
| - Jan-Apr 2018 | 88% | 88% | 92% | 87% | 90% | 84% | 88% |
| - Don’t know date | 4% | 5% | 4% | 5% | 3% | 6% | 6% |
| Published after deadline | 4% | 5% | 2% | 2% | 4% | 7% | 2% |
The above is consistent with GEO data on the publication dates for all in-scope large employers, which shows that 4% published between April and December 2017, 90% between January and April 2018 (by the relevant deadline) and 6% published after the deadline.[footnote 23] This suggests that the achieved survey sample is representative of the overall population of employers that are subject to the transparency regulations.
Overall, 80% of the surveyed employers reported their GPG data in March or April 2018 (within around 5 weeks of the deadline). When asked why they had not published earlier than this, most highlighted the time taken to complete the required tasks – 40% for collating the data, 27% for running the analysis, 11% for obtaining senior-level approval and 6% the time taken by 3rd parties to provide the data or analysis (Figure 9).
However, a number referenced more deliberate or strategic reasons such as focusing on more important priorities (12%), simply deciding to work towards the agreed deadline (10%) or delaying to first see other organisations’ results (6%) and/or how these were reported and explained (6%).
Figure 9 - Reasons for not publishing GPG data earlier than March/April 2018
| Reason | Percentage |
|---|---|
| Time taken to collate the data | 40% |
| Time taken to run the analysis or calculations | 27% |
| Other more important or competing priorities | 12% |
| Time taken to get internal approval of figures or commentary (for example, from senior management board) | 11% |
| Worked toward the deadline (not required to do it earlier, or thought had to publish on deadline) | 10% |
| Wanted to see results from other organisations first | 6% |
| Wanted to see how other organisations reported or explained their results | 6% |
| Staffing issues or lack of resource | 6% |
| Time taken by third parties to provide the data or analysis (for example, payroll providers, consultants) | 6% |
| Wanted to get a better understanding of what or how to report | 5% |
Base: all who published in March/April 2018 (Base, Don’t know). Total (672, 4%)
The small minority (4%) of employers that published their data after the deadline were also asked for their reasons. As set out in Table 8 below, a third of this group (32%) attributed their late reporting to difficulties with the registration process. Other reasons included lack of internal resources and software problems (both 14%).
Table 8 - Reasons for not publishing GPG data until after the deadline
| All publishing after deadline | |
|---|---|
| Base: All who did not publish GPG data until after deadline | 28 |
| Difficulties registering on the portal | 32% |
| Staffing/resource issues | 14% |
| Software issues/delays | 14% |
| Time taken to collate data / complexity of calculations | 10% |
| Other more important/competing priorities | 10% |
| Calculation/submission errors | 10% |
| Other reasons | 14% |
| Don’t know | 1% |
Qualitative insight
The timing of publication was often determined by a combination of factors. For example, difficulties with understanding exactly what to do, collating data or running calculations were sometimes also accompanied by additional pressures and competing priorities, meaning that less time was spent on the task than originally planned.
Many employers noted that although they had ambitions to comply within a particular timeframe, these were not firm plans. Consequently, many reported that their original timetables slipped due to resources being diverted to other business activities.
Furthermore, some explained that they started the process quite late because compliance was not considered an urgent requirement and they were simply working towards the official publication deadline.
There is also evidence that employers often underestimated the time it would take to complete the various tasks required by the regulations. Some respondents explained that once they started the process of compliance, they realised it would take longer than expected or encountered issues or difficulties that they had not anticipated.
“It was quite a big job to deal with as it was the first time. I had to go through and work out what information to pull and where it all comes from.” (500 to 999, Private sector)
In particular, a number of respondents highlighted collating data as a challenging stage of the compliance process, and a reason for publication being delayed. Specific difficulties experienced were as follows:
- Having to manually extract data from different systems. For example, where businesses had merged or acquired others, or where payments relating to bonuses were held on different systems to payroll data.
- Waiting for payroll software to be updated in order that they could produce the relevant reports for GPG. Sometimes this resulted in having to collate the data manually, adding extra time. In other cases, software providers did not provide updates until very close to the publication deadline.
Employers also described other difficulties and challenges associated with the compliance process which contributed to a delay in publication. These usually related to confusion (or disagreement) about exactly what data to include/exclude in the calculations or how to treat particular types of data (as detailed in chapter 4.4).
Further exploration showed that some employers published their data a number of weeks or months after completing their calculations. This was often because their senior leaders did not give consent to publish until a later date. In some cases, sign-off was required by the board, and was therefore delayed until the next scheduled meeting.
In other cases, senior leaders had made a strategic decision to delay publication, usually driven by their GPG results. Those with high median and/or mean GPG figures sometimes wanted to avoid attracting negative publicity by publishing before other similar organisations. Some respondents explained that senior staff had become nervous about publication after reading high profile media stories about other employers.
“We were not brave enough to publish early. Especially after some of the reports in the media, we wanted to wait and not stand out.” (500 to 999, Private sector)
Some employers wanted to see how others had presented and explained their results before publishing their own. They were either seeking reassurance that their approach was in-line with the majority (more often larger employers) or were looking for ideas and inspiration to adapt (typically smaller employers).
A minority of employers (franchisees, subsidiaries or public sector organisations) were required to publish their results in a coordinated way. They explained that the decision was not in their hands and the need to publish alongside other associated organisations meant they had to wait for all others were ready before doing so.
4.3 GPG results
Exploring the GPG results, two-thirds of surveyed employers reported that women’s median pay was lower than men’s and they therefore had a GPG (Figure 10).[footnote 24] This analysis is based on the self-reported GPG figures collected during the interviews rather than the official data they published on the GPG portal. Respondents were not asked to look up the exact figure during the telephone interview so in some cases may have provided incorrect data (due to poor recall, confusing the median with the mean figure, etc).
Figure 10 - Proportion of employers with a GPG (self-reported)
| Women’s median hourly pay was lower than men’s | Women’s median hourly pay was exactly the same | Women’s median hourly pay was higher than men’s | |
|---|---|---|---|
| Total | 66% | 14% | 15% |
| Private sector | 65% | 15% | 15% |
| Voluntary sector | 54% | 19% | 22% |
| Public sector | 81% | 6% | 11% |
| 250 to 499 employees | 63% | 12% | 17% |
| 500 to 999 employees | 67% | 15% | 13% |
| 1,000 or more employees | 68% | 17% | 13% |
Base: all who published GPG data on government portal (Base, Don’t know). Total (868, 5%), Private (380, 6%), Voluntary (240, 5%), Public (248, 3%), 250 to 499 employees (368, 7%), 500 to 999 (233, 4%), 1,000 or more (267, 3%)
Public sector organisations were most likely to report that women’s median pay was lower than men’s (81%), with voluntary sector employers least likely to do so (54%). There was relatively little difference in this respect by employer size.
4.4 Ease of complying
Employers were asked to rate the overall process of complying with the GPG reporting regulations on a 5-point scale, where 1 meant it was very difficult and 5 meant it was very straightforward. Figure 11 shows that perceptions varied widely, with just over a third (35%) describing it as very or fairly straightforward but 30% judging it to have been very or fairly difficult.
Figure 11 - Overall ease of complying with the regulations
| Very difficult | Fairly difficult | Neither difficult nor straightforward | Fairly straightforward | Very straightforward | |
|---|---|---|---|---|---|
| Total | 9% | 21% | 34% | 24% | 10% |
| Private sector | 10% | 22% | 35% | 22% | 10% |
| Voluntary sector | 7% | 19% | 33% | 28% | 12% |
| Public sector | 6% | 18% | 28% | 35% | 13% |
| 250 to 499 employees | 9% | 18% | 38% | 23% | 10% |
| 500 to 999 employees | 11% | 24% | 25% | 29% | 10% |
| 1,000 or more employees | 8% | 24% | 34% | 22% | 11% |
Base: all who published GPG data on government portal (Base, Don’t know). Total (868, 1%), Private (380, 2%), Voluntary (240, 0%), Public (248, 1%), 250 to 499 employees (368, 2%), 500 to 999 (233, 1%), 1,000 or more (267, 1%)
Public sector organisations were most positive about the process, with almost half (47%) finding it straightforward.
Respondents were also asked to rate their experiences of the different tasks involved, using the same 5-point scale. As shown in Figure 12, employers typically found it easy to submit their results on the portal, with 81% judging this task to be straightforward (and 50% rating it as very straightforward).
However, reaction was more divided for the other tasks. 47% found it straightforward to understand what they were required to do, 41% to gather the necessary data, 53% to calculate their results and 45% to decide and agree how to explain their results (with the latter only applicable to those producing a narrative commentary). Of all the tasks, employers were most likely to report issues with gathering the data, with almost a third (31%) finding this very or fairly difficult.
Figure 12 - Ease of completing the different tasks associated with the regulations (summary)
| Very difficult | Fairly difficult | Neither difficult nor straightforward | Fairly straightforward | Very straightforward | |
|---|---|---|---|---|---|
| Understanding what you were required to do | 5% | 19% | 29% | 31% | 15% |
| Gathering the necessary data | 10% | 21% | 27% | 28% | 13% |
| Calculating your results | 5% | 14% | 26% | 34% | 19% |
| Submitting your results on the government portal | 3% | 3% | 8% | 31% | 50% |
| Deciding and agreeing how to explain your results in the narrative commentary | 3% | 14% | 34% | 36% | 9% |
Base (Don’t know). All who published on government portal (868, 1%, 1%, 2%, 4%). All who produced commentary (754, 4%)
As detailed in Table 9 below, private sector organisations were least likely to have found each task straightforward. There were no consistent differences by employer size.
Table 9 - Ease of completing the different tasks associated with the regulations
| Proportion finding each task straightforward (4 to 5) | Total | Sector: Private | Sector: Voluntary | Sector: Public | Size: 250 to 499 | Size: 500 to 999 | Size: 1,000 or more |
|---|---|---|---|---|---|---|---|
| Base: All publishing GPG data on portal | 868 | 380 | 240 | 248 | 368 | 233 | 267 |
| Understanding what you were required to do | 47% | 44% | 54% | 55% | 46% | 46% | 49% |
| Gathering the necessary data | 41% | 39% | 44% | 50% | 42% | 41% | 41% |
| Calculating your results | 53% | 51% | 55% | 63% | 52% | 57% | 52% |
| Submitting your results on the government portal | 81% | 80% | 82% | 90% | 79% | 84% | 82% |
| Deciding and agreeing how to explain your results in the narrative commentary | 45% | 42% | 54% | 54% | 42% | 48% | 47% |
Respondents were asked whether there was any specific support or guidance that was not available but which would have made the process easier for them (Table 10). A third believed this was the case, and the main suggestions related to providing more guidance on how to calculate their results (including how to deal with issues such as salary sacrifice, commission and contract staff) and making the information easier to understand and/or more concise.
Table 10 - Whether there was any support that was not available but that would have made the process easier
| Total | Sector: Private | Sector: Voluntary | Sector: Public | Size: 250 to 499 | Size: 500 to 999 | Size: 1,000 or more | |
|---|---|---|---|---|---|---|---|
| Base: All publishing GPG data on portal | 868 | 380 | 240 | 248 | 368 | 233 | 267 |
| Yes | 33% | 33% | 34% | 31% | 31% | 28% | 40% |
| - More/better guidance on how to calculate their results (inc. salary sacrifice, commission, contract staff) | 9% | 8% | 14% | 10% | 9% | 9% | 11% |
| - Easier to understand/more concise information/guidance | 8% | 8% | 8% | 7% | 7% | 5% | 10% |
| - Better communication (for example, clearer, more timely) | 4% | 4% | 3% | 5% | 4% | 4% | 5% |
| - Dedicated helpline/point of contact/adviser | 3% | 4% | 2% | 2% | 2% | 3% | 5% |
| No | 64% | 64% | 64% | 66% | 65% | 70% | 58% |
| Don’t know | 3% | 3% | 2% | 3% | 4% | 2% | 2% |
The table only shows responses mentioned by at least 3% of respondents
Perhaps linked to their greater staff numbers and hence more complex structures, large organisations with 1,000 or more staff were most likely to identify a need for further support.
Qualitative insight
Challenges to compliance
Evidence from the qualitative interviews supports the quantitative findings about the ease of complying with the regulations and provides additional insight into areas of difficulty. A wide range of views were given about the process, with some respondents describing it as simple and straightforward and others reporting considerable challenges. It appears that differences in perceptions of the process are driven by 3 main factors:
- Complexity of workforce and/or pay structures. Many employers reporting difficulties described a wide range of job types and divisions within their organisations and/or more complex approaches to remuneration (for example, use of consultants on an ad hoc basis, flexible bonus schemes). Respondents explained that collating and checking data became very long-winded in these circumstances.
-
Sophistication of payroll system. Respondents often explained that their payroll software provider had provided an update to enable automated GPG reports to be run. However, in some cases this update had not been delivered in time to make the necessary calculations, meaning that respondents had needed to adopt a more manual and time-consuming approach.
- Availability and experience of staff. In a minority of cases, respondents (typically from smaller organisations with 250 to 499 staff) explained that they had limited resources to deal with compliance with the GPG regulations. They reported feeling under pressure as a result of having to take on most or all of the reporting tasks themselves. Some added that they were new in their role or new to the organisation, making the task more challenging.
In a minority of cases, employers described specific challenges associated with the GPG reporting regulations themselves. Some felt the guidance was not clear enough and they therefore had to spend additional time checking with colleagues, third parties or other HR professionals to clarify exactly what should/should not be included in their calculations. A small minority explained that the guidance from GEO regarding what to include had changed after the regulations had been announced. This caused confusion, and they explained it took too long for the government to respond to their requests for clarification.
“I felt like I was doing lots of checking and double checking. I am sure they changed the requirements at one point, which was frustrating.” (500 to 999, Private sector)
A number of employers explained that they had underestimated how complex the compliance process would be and how long it would take. During interviews conducted in the initial 2017 study, many respondents anticipated that the process would be straightforward. However, some of those interviewed again in the 2018 research explained that it was not until they started to collate data and run calculations that they had appreciated the scale of the task.
Most respondents felt that compliance would be much easier in the second year of the regulations, now that they had done it once. Many added that updated payroll systems would make the process quicker and simpler than before.
The vast majority of employers in the qualitative sample had documented the compliance process in some way. In most cases, this involved creating one or more of the following:
- step-by-step guidance notes, covering the collation of data and calculations
- template spreadsheets or databases into which figures can be added and calculations run
- explanations of the different values and data types (in a minority of cases)
When asked if they would do (or were already doing) anything differently in the second year, most said they were planning to start the process earlier in order to allow more time to complete it. Some also said that they would have a more streamlined process as they have done it once before and would no longer have to rely on trial and error.
One respondent explained that they planned an entirely different approach to the process. They had adopted an ad hoc approach in the first year, completing small parts of the process as and when time allowed. However, they felt this had led to mistakes and inaccuracies. Therefore, in future they planned to set aside a block of time in which to complete the work. Another explained that they had changed some of the ways they recorded payroll data in order to make data collation easier in subsequent years.
Use of external support
Most employers in the qualitative sample had obtained some form of support or guidance to help them with the compliance process. Typically, this was accessed at the start of the process as a means of understanding exactly what the regulations required. A minority had accessed support once the compliance process was underway. For example, some had retained the services of accountants or consultants to advise throughout the process on how to approach the calculations and how to present and contextualise the results.
“We went through a very detailed process of consideration about what we should and should not include. We used Deloitte for that.” (1,000 or more, Private sector)
The most commonly mentioned sources of guidance were GEO and Acas. In line with the findings reported last year, most of those who had read this guidance felt that it was clear and comprehensive. However, a minority would have liked more detailed information and illustrative examples of exactly how to calculate or present their results.
“The general information on those [Acas/GEO] was OK, but it was a bit one size fits all. We wanted to know exactly how we should do the calculation for a company like ours.” (250 to 499, Private sector)
The majority of respondents had also attended seminars held by law firms, recruitment consultants or HR specialists. They welcomed the opportunity to hear an expert view on how to comply and the chance to network with other HR professionals.
Only a minority of employers in the qualitative sample felt that they had support needs that had not been met. These related to how to report their gender pay data, including the acceptable and expected way to present the information and the commentary around it.
4.5 Impact of GPG regulations on board-level engagement
Most respondents believed that the requirement to measure and report their GPG data had resulted in a greater engagement with the issue at senior-level within their organisation.
As detailed in Figure 13 below, around two-thirds agreed that the regulations had increased awareness of gender pay issues at board level (69%) and prompted board level discussion or conversation about their GPG (67%). Approaching half (46%) reported that this had resulted in the board taking action to address their GPG (or, if they had no GPG, to ensure that one did not develop).
Relatively few disagreed that the regulations had increased board level awareness or prompted conversations on the topic (10% and 14% respectively), although this proportion rose to 25% when it came to the board taking action.
Figure 13 - Impact of the regulations on board-level engagement with the GPG (summary)
| Strongly disagree | Disagree | Neither agree nor disagree | Agree | Strongly agree | |
|---|---|---|---|---|---|
| Increased awareness of gender pay issues at board level | 4% | 6% | 19% | 45% | 24% |
| Prompted board level discussion or conversation about your GPG | 3% | 12% | 13% | 45% | 22% |
| Resulted in board taking action to address your GPG | 6% | 20% | 23% | 34% | 12% |
Base: all who published GPG data on government portal (Base, don’t know). Total (868, 1%, 5%, 6%
As shown in Table 11, all of these effects on board level engagement were most prevalent within larger organisations of 1,000 or more staff. Increased awareness and board level conversations were also more likely to be reported by public sector organisations.
Table 11 - Impact of the regulations on board-level engagement with the GPG
| Proportion agreeing that regulations have… | Total | Sector: Private | Sector: Voluntary | Sector: Public | Size: 250 to 499 | Size: 500 to 999 | Size: 1,000 or more |
|---|---|---|---|---|---|---|---|
| Base: All publishing GPG data on portal | 868 | 380 | 240 | 248 | 368 | 233 | 267 |
| Increased awareness at board level | 69% | 66% | 75% | 80% | 64% | 64% | 82% |
| Prompted board level discussion or conversation | 67% | 64% | 72% | 79% | 66% | 61% | 76% |
| Resulted in board taking action | 46% | 45% | 48% | 50% | 38% | 48% | 59% |
As set out in Table 12 below, there is some indication that these impacts were more widespread among those employers that had a GPG, although this difference is only statistically significant for prompting board level conversation on the topic. However, the likelihood of the board taking action to address the issue increased among employers with a larger GPG. Almost two-thirds (61%) of those with a GPG of over 20% reported this impact, compared to less than a third (31%) of those with a GPG of less than 6%.
Table 12 - Impact of the regulations on board-level engagement with the GPG (by self- reported size of GPG)
| Proportion agreeing that regulations have… | Has a GPG: Yes | Has a GPG: No | Size of GPG: 20% or higher | Size of GPG: 11% to 20% | Size of GPG: 6% to 10% | Size of GPG: Less than 6% |
|---|---|---|---|---|---|---|
| Base: All publishing GPG data on portal | 576 | 252 | 142 | 165 | 93 | 103 |
| Increased awareness at board level | 71% | 65% | 77% | 77% | 75% | 59% |
| Prompted board level discussion or conversation | 70% | 62% | 78% | 73% | 79% | 54% |
| Resulted in board taking action | 47% | 46% | 61% | 50% | 46% | 31% |
Qualitative insight
The qualitative interviews provide further insight into the impact of the regulations on board level engagement with GPG. In all cases where senior-level staff were described as unengaged or unaware of GPG before the introduction of the regulations, engagement was said to have increased to at least some extent. The only employers reporting no impact at all explained that their board level staff had already been highly engaged with the topic.
The introduction of the regulations had increased engagement in both a direct and indirect manner. Some respondents explained that senior-level staff had become interested as a direct result of finding out that they had a GPG, as they wanted to understand exactly what this meant and what was causing it. Others explained that the general publicity and media reporting had increased interest in the topic among their board (rather than this being a direct result of discovering the level of their own GPG).
“There has been a big impact on awareness among the board and other managers. It is certainly getting talked about more than before.” (250 to 499, Private sector)
The types of board level conversations reported varied, depending on the size of organisations’ GPGs and the perceived causes of them. Some boards (more typically from larger and/or public sector organisations) were said to be positively engaged, wanting to know how to tackle their GPG in order to fulfil their ambitions to be fair and ethical. Others (more typically smaller) adopted a more defensive approach, questioning the fairness of the GPG figure as a reflection of their employment practices and/or considering how best to explain it to minimise negative publicity.
While employers often reported increased awareness and discussion about GPG at a board level as a result of the regulations, firm action was less commonly described.
Respondents were often unable to pinpoint specific changes in plans or behaviour, beyond an intention among board members to monitor their GPG and/or seek to find ways to reduce it in the future.
In a minority of cases, respondents explained that their boards had taken decisions to incorporate actions to reduce GPG into existing equality and diversity strategies. A small minority also reported GPG specific targets being written into policies.
“We have been working on a number of initiatives as part of a diversity agenda, but there is now more of a spotlight on how they impact GPG. We are aiming for a 2% drop in the mean figure in the first year.” (500 to 999, Private sector)
4.6 Communication of GPG results and staff reaction
Employers were asked how they had communicated their GPG results, both to their employees and to external stakeholders such as clients, suppliers and investors.
As detailed in Figure 14 only a minority (16%) had adopted an active engagement strategy with their employees, with half (50%) drawing their attention to it and a third (32%) not doing any promotion of their results. Communication of GPG results to external stakeholders was comparatively rare, with the majority (60%) not doing any promotional activity and just 5% adopting an active engagement strategy.
Figure 14 - How GPG results were communicated to employees and stakeholders
| For employees | For clients, suppliers, investors and other stakeholders | |
|---|---|---|
| Adopted a comprehensive and active engagement strategy | 16% | 5% |
| Drawn their attention to it but nothing further | 50% | 31% |
| Not done any promotion or engagement activity | 32% | 60% |
Base: all who published GPG data on government portal (Base, Don’t know approach for employees, Don’t know approach for stakeholders). Total (868, 2%, 4%)
There was little difference by sector in this respect, although private sector organisations were least likely to have communicated results to their staff. 36% had not done any promotion or engagement activity, compared to 20% of voluntary and 22% of public sector employers. Larger organisations with 1,000 or more staff were comparatively more likely to have adopted an active engagement strategy, for both their employees (24%) and stakeholders (9%).
Those employers that had a GPG were also more inclined to actively engage with their staff about their results (19% compared with 8% of those with no GPG). This proportion increased in line with the size of their GPG, ranging from 9% of those with a GPG of less than 6% up to 34% of those with a GPG of over 20%.
As shown in Table 13, most organisations reported that there had been little response to their GPG results by their employees. 81% said there had been little or no reaction from staff, 17% indicated there had been some (but not widespread) attention paid to them and only 2% reported widespread reaction (for example, asking questions, raising concerns).
While still a minority, the proportion of employers reporting that their staff paid at least some attention to the results increased among those with a GPG (22% compared with 14% of those with no GPG). This rose to 36% for those with a large GPG of over 20% (with 7% reporting widespread reaction from their employees).
Table 13 - Employee reaction to the GPG results (by self-reported size of GPG)
| Total | Has a GPG: Yes | Has a GPG: No | Size of GPG: 20% or higher | Size of GPG: 11% to 20% | Size of GPG: 6% to 10% | Size of GPG: Less than 6% | |
|---|---|---|---|---|---|---|---|
| Base: All publishing GPG data on portal | 868 | 576 | 252 | 142 | 165 | 93 | 103 |
| Widespread reaction to them | 2% | 2% | 1% | 7% | 0% | 0% | 0% |
| Some attention paid but not widespread | 17% | 20% | 13% | 29% | 21% | 21% | 10% |
| Little or no reaction from staff | 81% | 77% | 86% | 64% | 77% | 79% | 89% |
| Don’t know | 1% | 1% | 0% | 0% | 2% | 0% | 1% |
There were no significant differences in staff reaction to the GPG results by employer sector or size.
Qualitative insight
Evidence from the qualitative interviews suggests that employers’ primary motivation for communicating their GPG results to their staff was to maintain morale and avoid concerns developing. Most employers were concerned to some extent that their staff might not fully understand what a GPG is, and how it differs from equal pay. Therefore, the primary goal of most was to explain how the calculations were made and what they meant. As such, even those who reported a very ‘light touch’ approach to communicating with staff wanted to reduce ambiguity or potential for confusion. They therefore made their results available alongside a narrative commentary.
“We put the report on the intranet and staff were told about it by their managers, but we didn’t make a fuss. The report was quite clear.” (500 to 999, Private sector)
All employers in the qualitative sample had made their results available on their intranet and/or drawn employees’ attention to them via newsletters or through staff meetings. In a minority of cases, larger employers had arranged dedicated ‘all staff’ meetings or similar to present their results. In these cases, the results were presented by senior-level staff.
These employers also delivered more detailed commentaries to accompany their results, providing reasons for their GPG figures and how they planned to reduce their GPG.
“We took care to give staff lots of clear information. We did a special newsletter, with the detailed commentary included. This explained what the GPG was and what it meant, as well as what we are doing to address it.” (250 to 499, Voluntary sector)
A small minority of larger employers had also disseminated their results through other staff forums such as women’s groups. They invited discussion and debate in these sessions about how to tackle their GPG.
There is some evidence that employers were anticipating a more widespread and/or intense reaction to the publication of their GPG results from their staff. Some explained that they had prepared Q&A papers and briefed managers on how to deal with questions from staff. However, they had generally not needed to use these as they received very little reaction from staff.
5. Reducing the GPG
This chapter looks at the extent to which employers are seeking to reduce their gender pay gap, and the approaches they are adopting to do so. Specifically, it covers:
- the degree to which reducing the GPG is a priority and the reasons behind this
- whether this priority has changed since the introduction of the GPG reporting regulations
- the extent to which employers have developed (and acted on) a strategy to reduce their GPG
- the specific actions or measures developed to reduce their GPG
- whether employers will publish GPG action plans
5.1 Priority given to reducing the GPG
There was a broad spectrum of employer attitudes when it came to the perceived importance of reducing their GPG (or ensuring they continued to have no GPG). As set out in Figure 15, a quarter (23%) considered this to be a high priority and approaching half (45%) a medium priority, but 29% viewed it as a low priority or not a priority at all.
Figure 15 - Priority given to reducing the GPG
| Not a priority at all | A low priority | A medium priority | A high priority | |
|---|---|---|---|---|
| Total | 11% | 19% | 45% | 23% |
| Private sector | 11% | 19% | 45% | 22% |
| Voluntary sector | 9% | 16% | 44% | 30% |
| Public sector | 9% | 19% | 48% | 22% |
| 250 to 499 employees | 13% | 24% | 43% | 18% |
| 500 to 999 employees | 13% | 15% | 46% | 24% |
| 1,000 or more employees | 4% | 12% | 49% | 32% |
Base: all respondents (Base, Don’t know). Total (900, 2%), Private (391, 2%), Voluntary (252, 1%), Public (257, 3%), 250 to 499 employees (391, 2%), 500 to 999 (236, 2%), 1,000 or more (273, 2%)
The larger the employer, the more likely they were to allocate a high or medium priority to reducing their GPG (82% of those with 1,000 or more staff, 70% of 500 to 999, 61% of 250 to 499).
Voluntary sector organisations were also most likely to treat it as a high priority (30%).
Table 14 shows that, at the overall level, there has been no increase since the baseline survey in the proportion of employers treating the GPG as a high priority (24% in 2017 compared with 23% in 2018). However, the proportion allocating it either a high or medium priority has risen from 61% to 69%. This pattern is broadly consistent across the different employer sectors and sizes, although there have been no statistically significant changes for the public sector or those with 250 to 499 employees.
Table 14 - Priority given to reducing the GPG (over time)
| Total | Sector: Private | Sector: Voluntary | Sector: Public | Size: 250 to 499 | Size: 500 to 999 | Size: 1,000 or more | ||
|---|---|---|---|---|---|---|---|---|
| Base: All respondents | 2017 | 900 | 406 | 243 | 251 | 412 | 214 | 274 |
| Base: All respondents | 2018 | 900 | 391 | 252 | 257 | 391 | 236 | 273 |
| High priority | 2017 | 24% | 24% | 25% | 28% | 24% | 21% | 29% |
| High priority | 2018 | 23% | 22% | 30% | 22% | 18% | 24% | 32% |
| High or medium priority | 2017 | 61% | 59% | 63% | 73% | 56% | 61% | 72% |
| High or medium priority | 2018 | 69% | 68% | 74% | 70% | 61% | 70% | 82% |
As detailed in Table 15 below, employers that self-reported (in the survey) that they did not have a GPG were most likely to treat the GPG as a high priority (39% compared with 17% of those with a GPG).[footnote 25] However, among those that did have a GPG, the priority allocated to addressing it increased. 80% of those with a GPG in excess of 20% saw this as a high or medium priority to their organisation (with 32% describing it as a high priority).
Table 15 - Priority given to reducing the GPG (by self-reported size of GPG)
| Has a GPG: Yes | Has a GPG: No | Size of GPG: 20% or higher | Size of GPG: 11% to 20% | Size of GPG: 6% to 10% | Size of GPG: Less than 6% | |
|---|---|---|---|---|---|---|
| Base: All publishing GPG data on portal | 576 | 252 | 142 | 165 | 93 | 103 |
| High priority | 17% | 39% | 32% | 17% | 12% | 6% |
| High or medium priority | 66% | 76% | 80% | 67% | 66% | 56% |
Figure 16 details employers’ reasons for the priority given to reducing their GPG. This was captured via an open question and respondents were able to provide more than one reason. Their responses have been coded into common themes and all reasons mentioned by 5%+ of respondents in each priority group have been shown.
Figure 16 - Reasons for priority given to reducing the GPG (unprompted)
High priority:
- Right thing to do, want to be fair or non-discriminatory – 51%
- Important to our reputation (for example, image, attracting staff) – 20%
- Important to address our GPG or working to reduce (or maintain) it – 18%
- Important for us to provide equal pay and opportunities – 16%
- Have a GPG or gender imbalance in workforce (or certain areas) – 11%
- Legal requirement or regulation – 5%
- Diversity is good for business (for example, profit, productivity, engagement) – 5%
Medium priority:
- Important to address our GPG or working to reduce (or maintain) it – 25%
- Nothing or little we can do (for example, nature of sector, few female applicants) – 19%
- Other more important priorities – 16%
- Our GPG is small or not a big issue or has reduced – 15%
- Right thing to do, want to be fair or non-discriminatory – 8%
- Don’t have a GPG – 6%
- Important for us to provide equal pay and opportunities – 5%
Low priority:
- Our GPG is small or not a big issue or has reduced – 29%
- Nothing or little we can do (for example, nature of sector, few female applicants) – 25%
- Other more important priorities – 15%
- All workers are paid equally regardless of gender – 12%
- We employ and pay based on ability not gender or other factors – 9%
- Have a set pay scale or structure – 7%
- Long term issue and will take time to solve – 6%
- Don’t have a GPG – 6%
Not a priority at all:
- Nothing or little we can do (for example, nature of sector, few female applicants) – 34%
- Our GPG is small or not a big issue or has reduced – 21%
- We employ and pay based on ability not gender or other factors – 17%
- All workers are paid equally regardless of gender – 13%
- Don’t see it as important or relevant – 12%
- Other more important priorities – 8%
- Have a set pay scale or structure – 5%
Base: All respondents. High (223), Medium (412), Low (160), Not at all (87). Chart only shows responses mentioned by at least 5% of respondents.
Among those allocating a high priority to reducing their GPG, this decision was primarily driven by moral or ethical considerations (a desire to be fair, provide equal opportunities, etc.). A fifth of this group (20%) also highlighted the potential impact on their reputation as a motivating factor. While only a small minority (5%) explicitly referred to diversity being good for their business (in terms of profitability, productivity, etc.), some of the more common motivations can be bridges to improved business performance (for example, reputation, attracting staff).
Those employers treating their GPG as a medium priority gave a wide range of reasons, covering both motivations and barriers. The most common positive drivers were that they felt it was important to address their GPG (25%) and wanted to be fair and non- discriminatory (8%). However, 19% believed there was little they could do (due to the nature of their sector, lack of female applicants, etc.) and 16% referenced other competing priorities. A significant proportion also explained that it was not a greater priority because they only had a small GPG (15%) or did not have one at all (6%).
Those seeing the GPG as a low or non-priority were generally split into those that did not need to do any more (for example, they only had a small GPG), those that believed they could not do any more (for example, there was little they could do to change it, there were few female applicants in their sector, it was a long-term issue), and those that had no desire to do any more (for example, other priorities, they paid based on ability not gender, they did not see it as important). There was a broadly even split of employers across these 3 groups.
However, 12% of the low priority and 13% of the non-priority group indicated that this was because all their workers were already paid equally regardless of gender. This suggests some confusion between equal pay and the GPG (an issue that also emerged in the baseline wave), although it may also reflect a degree of scepticism about the validity of the GPG as a measure of equality.
Employers were directly asked whether the priority they allocated to reducing their GPG had changed since calculating their results to meet the regulations (see Figure 17). While most (73%) felt this had not changed, a quarter (24%) indicated it was now a higher priority. Larger employers with 1,000 or more staff were most likely to have allocated the GPG a higher priority since calculating their results (38%).
Figure 17 - Impact of the regulations on GPG priority
| Now a lower priority | Not changed | Now a higher priority | |
|---|---|---|---|
| Total | 1% | 73% | 24% |
| Private sector | 1% | 73% | 24% |
| Voluntary sector | 0% | 75% | 22% |
| Public sector | 1% | 72% | 26% |
| 250 to 499 employees | 1% | 75% | 20% |
| 500 to 999 employees | 2% | 81% | 16% |
| 1,000 or more employees | 0% | 60% | 38% |
Base: all respondents (Base, Don’t know). Total (900, 2%), Private (391, 2%), Voluntary (252, 3%), Public (257, 2%), 250 to 499 employees (391, 3%), 500 to 999 (236, 2%), 1,000 or more (273, 1%)
As might be expected, those employers that found they had a GPG were more likely to now view it as a greater priority (29% compared with 15% of those with no GPG). This proportion increased among those with a larger GPG (Table 16).
Table 16 - Impact of the regulations on GPG priority (by self-reported size of GPG)
| Has a GPG: Yes | Has a GPG: No | Size of GPG: 20% or higher | Size of GPG: 11% to 20% | Size of GPG: 6% to 10% | Size of GPG: Less than 6% | |
|---|---|---|---|---|---|---|
| Base: All publishing GPG data on portal | 576 | 252 | 142 | 165 | 93 | 103 |
| Now a higher priority | 29% | 15% | 43% | 33% | 32% | 13% |
| Not changed | 67% | 83% | 53% | 61% | 66% | 86% |
| Now a lower priority | 1% | 1% | 2% | 1% | 1% | 0% |
| Don’t know | 3% | 1% | 2% | 4% | 1% | 1% |
Qualitative insight
The qualitative interviews further explored the level of priority afforded to reducing GPG, the reasons for this and who within the organisation was driving it. They also explored whether employers had increased or decreased the priority they afforded to reducing their GPG and the reasons.
Employers explained that senior level staff determined the overall priority allocated to reducing GPG, although they were often advised and encouraged by HR and/or equality and diversity staff.
The question of whether and how to tackle a GPG (or prevent one from developing) depended on a range of factors. These factors are consistent with those reported in 2017 and are illustrated in Figure 18 below. It is important to note that employers usually described multiple reasons for their current attitude towards GPG, making the ultimate ‘priority rating’ quite complex and multifaceted.
Figure 18 - Factors impacting attitudes towards closing GPG
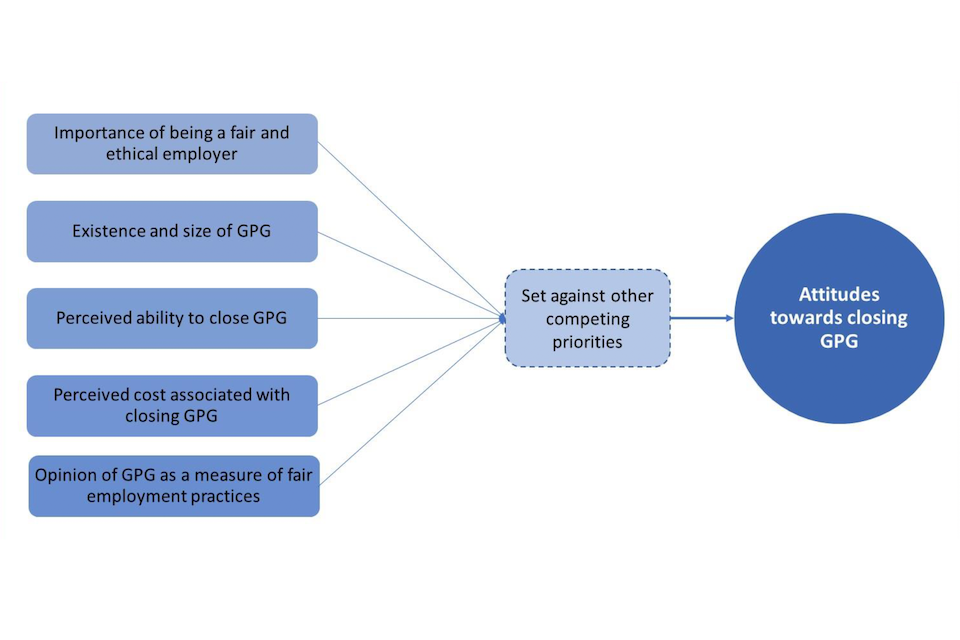
These factors are defined as follows:
- Importance of being a fair and ethical employer: The degree to which organisations place importance on looking after their employees and giving them opportunities regardless of their gender or any other defining characteristic.
- Awareness of GPG (and its size): Whether an employer knows (or thinks) it has a GPG, its size and what is causing it. This will determine its perceived negative impact on staff, reputation, recruitment and sales.
- Perceived ability to close GPG: Whether an organisation believes there is anything (more) that they can do to reduce their GPG or avoid one opening up.
- Perceived cost associated with closing GPG: What an employer believes the likely costs to them will be of closing their GPG (direct financial costs as well as time and resources associated with taking steps).
- Opinion of GPG as a measure of fair employment practices: Whether employers consider GPG to be a ‘valid’ indication of how fair and ethical they are, and therefore whether they feel that closing their GPG is necessary or appropriate.
The priority afforded to closing their GPG was always set against the relative importance of other issues, challenges and ambitions that the organisation faced. In this context, while some employers in the qualitative sample indicated that closing the GPG was a high priority, none of them described it as one of their top priorities overall.
The factors affecting attitudes towards closing the GPG combine to create different levels of priority/engagement. These can be mapped against employers’ broad attitudes towards the GPG as a measure of fair and equitable employment practices. The result is 5 attitudinal groups, summarised in Figure 19 below.
Figure 19 - Range of attitudes towards closing GPG
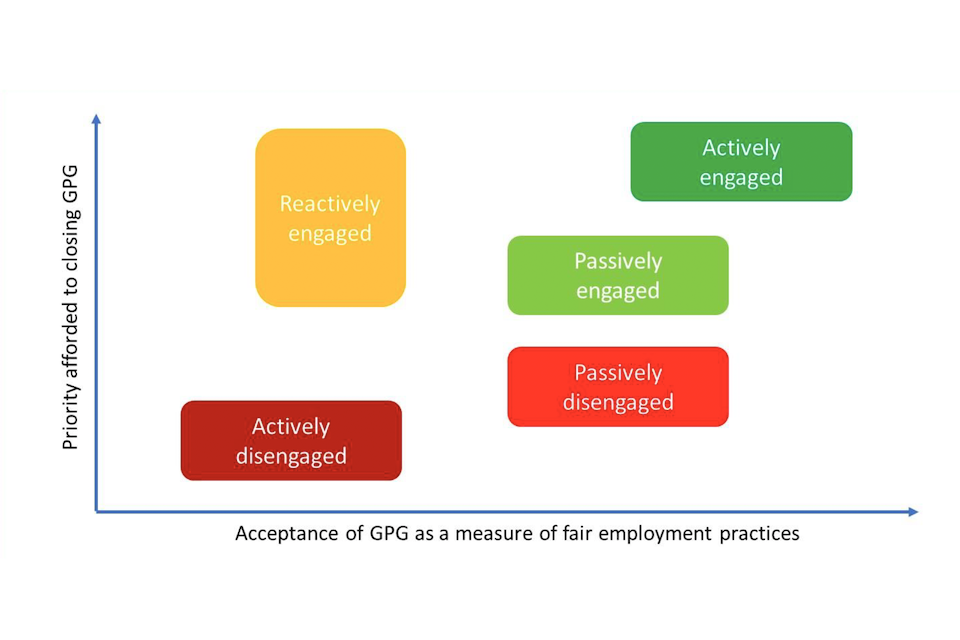
Most of the employers in the qualitative sample could be categorised as either passively engaged or passively disengaged. More details of each of these 5 groups are provided below.
Actively engaged
A minority of employers described a very proactive approach to closing their GPG (or ensuring one does not develop). Most had been measuring their GPG before the reporting regulations were introduced. They agreed that the GPG was a useful addition to other equality and diversity measures in helping to identify areas of inequality. Their drive to address their GPG was often attributed to policies and strategies set out by senior leaders. These employers were usually large and/or public sector.
Employers in the longitudinal sample who displayed this attitude in the 2017 research continued to do so in 2018. In addition, a small number of respondents (from both the longitudinal and fresh samples) explained that they were now actively engaged in seeking to reduce their GPG as a result of complying with the reporting regulations. They had been surprised by the size of their GPG and this had triggered internal discussion among senior staff and an ambition to make changes accordingly.
“It wasn’t an issue prior to the reporting. Now there is a lot of interest at board level…it has gone from eye-rolling, to more of a sense that this is important.” (1,000 or more, Private sector)
Reactively engaged
A minority of employers were committed to reducing their GPG, despite having doubts about the legitimacy of the measure. These organisations usually felt that their GPG was caused by factors outside of their control and did not reflect how fair or ethical they were. However, they wanted to reduce any negative press and potential damage to their reputation and commercial performance associated with having a large GPG. They often described their industry sectors as being a particular focus of media attention on the GPG. Therefore, they were keen to identify ways of reducing it.
“It has become a big issue for companies like ours in the past couple of years. The media are looking for a story and we have to work out how to manage that.” (500 to 999, Private sector)
It is important to note that while these employers were primarily motivated to reduce their GPG by the impact on their reputation, this does not mean that they were not already engaged with equality and diversity more generally. They often reported initiatives that they already had in place which could have an impact on reducing their GPG, but had not been explicitly developed and implemented for that reason.
Some employers within this group explained that the priority they placed on reducing their GPG had increased since completing their calculations and discovering the size of the gap. Others explained that they had been looking at the issue since the plan to introduce reporting regulations was announced. Therefore, while the priority placed on reducing their GPG had not changed in the past year, the regulations had still had an impact.
Passively engaged
Many employers in the qualitative sample adopted a passive attitude towards reducing their GPG. During the initial 2017 research, many employers had neither considered the issue of GPG in much detail nor calculated their own GPG. This resulted in many adopting a ‘wait and see’ approach to the topic. One year on, while all this group of passively engaged employers had now calculated their GPG, they had still not given serious or detailed consideration to the issue of reducing it.
These employers regarded closing their GPG as a legitimate and worthwhile ambition, recognising the benefits of doing so. In some cases, they described these benefits in ‘altruistic’ terms, with a focus on doing what is morally or ethically right. In others, the motivation to consider closing their GPG related to the potential commercial benefits associated with doing so. They explained the importance of being seen as an employer of choice, enabling them to attract and retain high calibre staff.
Passively engaged employers often explained that they had an ambition to address their GPG at some point in the future. However, they were not always convinced of the need to take action. Some continued to adopt a ‘wait and see’ policy, feeling that with just one year’s calculations to go on, it was not yet clear whether they had a notable issue to deal with. They wanted to understand what the trend was in their GPG data over time.
“It isn’t a top priority yet. We will see how it develops next year.” (1,000 or more, Public sector)
These employers generally explained that reducing their GPG was one of a number of equality and diversity priorities. While they wanted to reduce it, they did not see a valid argument for focusing on GPG to the detriment of other priorities. Furthermore, some organisations noted that they were already undertaking actions which could be having a positive impact on their GPG (although they had not always measured this). Therefore, they did not feel that they were ignoring the issue completely.
Passively disengaged
This group of employers felt that the GPG was a legitimate measure, but reducing it was a low (or non-) priority. Most were organisations that did not have a GPG, or who felt their GPG was at an acceptable level (for example, below the national average, lower than their competitors). They therefore felt no need to address it.
A minority within this group had a GPG, explained that they would ideally want to reduce it, but did not feel this was possible. They argued that a lack of trained and/or interested female candidates meant that they were unable to address the issue. They often felt that they were already doing all they could to attract more women. As such they saw little point in prioritising a goal (reducing GPG) that they were not able to achieve. Within the small qualitative sample, this attitude was most prevalent among respondents in the manufacturing and engineering sectors.
“It’s not just down to businesses, it is a wider issue. It will take a generation to deal with.” (250 to 499, Private sector)
As was the case in the 2017 research, some employers reported that their senior leaders were simply not interested in the topic or felt that other issues were significantly more important that tackling their GPG. In some cases, employers had an above average GPG but had not experienced any negative impact in terms of staff reaction or commercial performance. Therefore, they saw no need to take further action at this time.
Actively disengaged
As was found in the 2017 research, a number of employers described a definitive and deliberate lack of engagement with closing their GPG. They were not convinced about the validity of seeking to reduce their GPG. They felt that the measure failed to take into consideration broader factors such as the availability of women candidates in their sector or other valid reasons for differentials in average pay. They explained that their priority in relation to their GPG was to explain it rather than reduce it.
In some cases, respondents felt that the measures they would need to take to reduce their GPG would be detrimental to their wider equality and diversity, or that the introduction of measures typically considered beneficial in terms of encouraging fair pay across the workforce could result in an increase in their GPG because of the way the reporting requirements are structured.
“We do encourage flexible working, but this has an impact on the bonus pay gap. So because of how it is calculated, offering this type of positive initiative can actually make the GPG worse.” (1,000 or more, Private sector)
It is important to note that some employers who placed a low priority on closing their GPG felt that the regulations had commendable goals and agreed with the principle of transparency around gender pay. Some added that the introduction of the regulations had helped increase awareness of the broader issue of gender equality (which they welcomed). However, they felt that the calculations required under the regulations were too general and lacked sufficient granularity to provide a clear and accurate picture of their working practices. Therefore, they placed no priority on reducing the GPG figure that they were required to publish.
“It is just not a subtle enough measure. It actually shows us to have a low GPG overall, but this does not take into account the 2 different divisions. One of them is actually in a less positive position. So the GPG calculations are good, in that they increase awareness, but it is not a useful measure to us.” (250 to 499, Private sector)
Impact of regulations on priority given to closing GPG
Large scale shifts in the overall priority afforded to closing GPG were not commonly observed during the qualitative interviews. A minority of employers had switched from a passively disengaged attitude to a passively engaged attitude after finding out that they had a GPG (when they had not been expecting one). Others had become more aware of the causes of their GPG and the areas of their business where action was required. This had led them to adopt a more proactive position on closing their GPG.
However, in many other cases employers explained that their attitudes had not changed significantly. Some were waiting to see if their GPG changed in the second year of the regulations before deciding whether they needed to make it a higher priority (and implement actions to address it). Others explained that competing business priorities were still considered more important than closing their GPG. These included: dealing with skills shortages in certain departments, encouraging ethnic diversity, improving opportunities for disabled employees, managing change as a result of mergers and acquisitions, and tackling falling sales or slow financial growth.
It is important to note that employers tended not to think about tackling their GPG as an isolated issue. Rather, their attitude to closing the GPG was part of their overall attitude to the recruitment and management of their workforce. As such, it was not always easy for respondents to separate the priority they placed on closing their GPG from other, related priorities.
As discussed previously (see Figure 16), the priority put on closing the GPG depended on a range of factors. By examining how employers’ attitudes and behaviours have changed since the 2017 qualitative research, we have explored how the introduction of the GPG reporting regulations has impacted each of these factors, and therefore the ultimate priority afforded to tackling GPG:
- Importance of being a fair and ethical employer: There is little evidence to suggest that this factor has been affected by the regulations as yet. Some employers explained that awareness of the issue of GPG had led to a greater focus on the topic to some extent, but underlying attitudes were generally felt to have remained consistent.
- Awareness of GPG (and its size): The regulations were said to have had a significant impact on this factor, bringing the issue to the attention of employers, and making some aware that they had a problem to address.
- Perceived ability to close GPG: There is only limited evidence to suggest that this has been affected by the first year of the regulations. Most employers had not yet explored the feasibility of closing their GPG in any more detail than they had previously. Furthermore, some employers with large GPGs were somewhat daunted by the prospect of trying to close it, reducing their drive to do so.
- Perceived cost associated with closing GPG: There is little evidence to suggest that the perceived costs have changed as yet.
- Opinion of GPG as a measure of fair employment practices: There is some evidence that the process of calculating their GPG and developing a narrative commentary increased some employers’ understanding of it, and consequently led to an increased appreciation of the value in measuring and closing it. However, for a minority, scepticism about GPG was increased because of the way in which the regulations required this to be calculated, which was considered invalid.
5.2 Strategy for reducing the GPG
As shown in Figure 20, three-quarters (76%) of those employers that had a GPG indicated that they had tried to identify the underlying causes. This proportion increased among voluntary sector organisations (86%) and also rose in line with employer size.
Figure 20 - Whether employers have tried to identify or diagnose the causes of their GPG
| No | Yes | |
|---|---|---|
| Total | 23% | 76% |
| Private sector | 25% | 74% |
| Voluntary sector | 14% | 86% |
| Public sector | 18% | 79% |
| 250 to 499 employees | 27% | 73% |
| 500 to 999 employees | 23% | 77% |
| 1,000 or more employees | 17% | 82% |
Base: All with a GPG (Base, Don’t know). Total (576, 1%), Private (246, 0%), Voluntary (129, 0%), Public (201, 2%), 250 to 499 employees (226, 0%), 500 to 999 (156, 1%), 1,000 or more (194, 2%)
All employers were asked to specify their current approach to reducing their GPG (or ensuring they continued to have no GPG). As detailed in Figure 21, there was a roughly even split between those that had developed a formalised strategy (34%), those that intended to take action but had not yet developed specific plans (33%) and those that did not intend to take any action (30%). Among those that had developed a strategy, around half (16% of all employers) had implemented at least some of the actions it included.
Figure 21 - Employers’ approach to reducing their GPG
| No plans to take any action | Intend to take action but not yet developed specific plans | Developed formalised strategy but not yet implemented any actions | Developed formalised strategy and undertaken some or all of the actions | |
|---|---|---|---|---|
| Total | 30% | 33% | 18% | 16% |
| Private sector | 33% | 32% | 17% | 15% |
| Voluntary sector | 28% | 32% | 20% | 16% |
| Public sector | 17% | 36% | 24% | 18% |
| 250 to 499 employees | 34% | 34% | 15% | 13% |
| 500 to 999 employees | 35% | 35% | 17% | 12% |
| 1,000 or more employees | 17% | 28% | 26% | 25% |
Base: all respondents (Base, Don’t know). Total (900, 3%), Private (391, 3%), Voluntary (252, 4%), Public (257, 4%), 250 to 499 employees (391, 4%), 500 to 999 (236, 1%), 1,000 or more (273, 4%)
Over half (51%) of employers with 1,000 or more staff had developed a formalised GPG strategy, and this proportion was also higher among public sector organisations (42%). Conversely, employers with 250 to 999 staff and those in the private and voluntary sectors were most likely to have no plans to take action to address their GPG.
Table 17 shows that the proportion of employers that had developed a GPG strategy has increased since the baseline wave (from 21% to 34%), with a notable rise in the proportion that had already implemented some or all of the actions set out in their strategy (from 6% to 16%).
Table 17 - Employers’ approach to reducing their GPG (over time)
| Year | Total | Sector: Private | Sector: Voluntary | Sector: Public | Size: 250 to 499 | Size: 500 to 999 | Size: 1,000 or more | |
|---|---|---|---|---|---|---|---|---|
| Base: All respondents | 2017 | 900 | 406 | 243 | 251 | 412 | 214 | 274 |
| Base: All respondents | 2018 | 900 | 391 | 252 | 257 | 391 | 236 | 273 |
| Developed strategy and undertaken actions | 2017 | 6% | 6% | 6% | 8% | 5% | 5% | 11% |
| Developed strategy and undertaken actions | 2018 | 16% | 15% | 16% | 18% | 13% | 12% | 25% |
| Developed strategy but not implemented actions | 2017 | 15% | 14% | 16% | 20% | 12% | 13% | 23% |
| Developed strategy but not implemented actions | 2018 | 18% | 17% | 20% | 24% | 15% | 17% | 26% |
| Intend to take action but not yet developed plans | 2017 | 50% | 49% | 52% | 53% | 49% | 56% | 45% |
| Intend to take action but not yet developed plans | 2018 | 33% | 32% | 32% | 36% | 34% | 35% | 28% |
| No plans to take action | 2017 | 20% | 22% | 17% | 11% | 25% | 16% | 14% |
| No plans to take action | 2018 | 30% | 33% | 28% | 17% | 34% | 35% | 17% |
While there has also been an increase in the proportion not planning to take action (from 20% to 30%), in the 2018 survey many of this group did not have a GPG. Table 18 shows that employers without a GPG were more likely to have no plans to take action (46% compared with 22% of those with a GPG), and among those with a large GPG of over 20% just one-in-ten (10%) did not intend to take action.
Correspondingly, employers with a GPG were significantly more likely to have developed a formalised strategy to address this (38% compared with 28% of those with no GPG). This proportion also increased in line with the size of the employer’s GPG, ranging from 18% of those with a GPG of less than 6% up to 56% of those with a GPG in excess of 20%.
Table 18 - Employers’ approach to reducing their GPG (by self-reported size of GPG)
| Has a GPG: Yes | Has a GPG: No | Size of GPG: 20% or higher | Size of GPG: 11% to 20% | Size of GPG: 6% to 10% | Size of GPG: Less than 6% | |
|---|---|---|---|---|---|---|
| Base: All publishing GPG data on portal | 576 | 252 | 142 | 165 | 93 | 103 |
| Developed strategy and undertaken actions | 17% | 13% | 24% | 21% | 15% | 9% |
| Developed strategy but not implemented actions | 21% | 14% | 31% | 25% | 17% | 10% |
| Intend to take action but not yet developed plans | 37% | 25% | 31% | 32% | 40% | 46% |
| No plans to take action | 22% | 46% | 10% | 17% | 27% | 33% |
| Don’t know | 3% | 2% | 4% | 5% | 1% | 2% |
There was also a correlation between the priority allocated to reducing their GPG and the degree of action employers had taken to achieve this. Over half (56%) of those treating it as a high priority had developed a formalised strategy, compared to 38% of the medium priority group and just 10% of the low or non-priority group.
As detailed previously, 34% of employers had developed a formalised strategy to reduce their GPG. This group were asked to provide details of the specific actions or measures included in this strategy. Figure 22 below shows that in most cases these included offering or promoting flexible working (87%), promoting parental leave policies that encourage both men and women to share childcare (76%), seeking to make cultural changes within the organisation (65%), and implementing gender-specific recruitment, promotion or mentoring schemes (62%). A third (33%) also incorporated voluntary internal targets.
Figure 22 - Measures included in employers’ GPG strategies
| 2017 survey | 2018 survey | |
|---|---|---|
| Offering or promoting flexible working arrangements | 71% | 87% |
| Promoting parental leave policies that encourage men and women to share childcare | 65% | 76% |
| Making cultural changes within your organisation | 51% | 65% |
| Voluntary internal targets | 39% | 33% |
| Gender-specific recruitment, promotion or mentoring schemes | 35% | 62% |
| Other actions or measures | 12% | 25% |
Base: All that have developed a formalised GPG strategy (Base, Don’t know). 2017 survey (204, 10%), 2018 survey (328, 3%).
With the exception of voluntary internal targets, the proportion of employers including each of these measures in their GPG strategy has risen since the baseline wave. This increase was most notable for gender-specific HR practices (from 35% in 2017 to 62% in 2018). The qualitative interviews explored this further, as discussed below.
Qualitative insight
The qualitative interviews found that employers had approached the identification of the causes of their GPG in different ways. A minority (all larger organisations) described formal meetings among senior staff to analyse their GPG results in detail and therefore establish the areas of their operations that were causing the overall gap between men and women’s average pay. Some used these meetings and analysis to form the basis of action planning.
“We had a series of meetings with the board, looking at the figures and targeting the parts of the business that were most in need of attention.” (1,000 or more, Private sector)
Many other employers described a less formal approach to identifying the causes of their GPG. Some were fully expecting to have a GPG and explained that they were aware of the reason already (for example, a lack of suitable female candidates for particular roles). Others had taken some time to look at the data and had applied the results to their existing knowledge of their organisation’s structure, recruitment policy or staff development procedures.
“We knew where we would have an issue. This has focused our attention on that.” (500 to 999, Private sector)
Formal plans and strategies aimed specifically at reducing GPG were not common within the qualitative sample. While some larger, public sector employers described such strategies, most organisations had general equality and diversity plans or strategies that had been adapted to include GPG. In many other cases (especially smaller employers) respondents explained that ‘planning to take action’ referred to a general ambition to do so, rather than a firm or time-specific commitment.
“A GPG report was produced, which includes actions and strategies. Some of these were already in place as part of the Equality and Diversity strategy, but the GPG elements have been enhanced.” (1,000 or more, Public sector)
“We don’t have a specific strategy at this point, but we will keep an eye on it and certainly want to tackle it.” (250 to 499, Private sector)
Similarly to the 2017 baseline study, some employers who claimed to be taking no action in the quantitative survey described measures they already had in place which could have an impact on their GPG, but explained that they were not undertaking these with the specific purpose of reducing their GPG.
The qualitative interviews also sought to identify examples of employers having taken action to reduce their GPG over the last year. However, in most cases the primary impact of the regulations was said to be an increased awareness of the issue and a more engaged attitude towards it. Examples of concrete action taken in response to the regulations were rare.
Where action had been taken, this usually related to either a strengthening/expansion of existing actions or a consideration of the potential impact of existing practices on GPG. Furthermore, some respondents explained that even though they had undertaken new initiatives in the last year these were prompted by other factors as well as (or instead of) the GPG reporting regulations. However, in a minority of cases employers had implemented new initiatives and actions as a direct result of the regulations.
Employers described specific activities in relation to reducing their GPG, some of which had been introduced since the regulations came into force. These closely mirrored those reported in the quantitative survey. They included:
- Flexible working: Nearly all businesses in the qualitative sample offered flexible working of some kind, and this was often part of a general drive to attract or retain (female) employees. A minority explained that they had extended or were reviewing their flexible working policies as part of their planned approach to reducing their GPG.
-
Offering enhanced maternity and/or paternity leave: Many employers offered enhanced maternity and paternity leave. They understood that such policies encourage women and men to share childcare responsibilities, and therefore enable women to return to work (sooner). However, low uptake of shared parental leave was often reported, with employees said to feel it was too complicated for them to take advantage of.
- Making cultural changes: In a small number of cases, employers in the private sector were taking steps to encourage different attitudes and behaviour among mid-level management in relation to recruitment, professional development and negotiation of wages (including unconscious bias training). Some HR professionals felt able to raise the issue more often because they could use their GPG figures as a reason for managers to take notice and adjust their behaviour.
- Voluntary internal targets: Some employers had put in place targets on the number of women employed in senior positions. While these had often been introduced some time ago, a small minority had done so since analysing their GPG results. In addition, some smaller employers had made senior female appointments since publishing their GPG data and suggested that the increased awareness of the issue among board level staff had influenced their decision- making.
- Women-specific recruitment, promotion or mentoring schemes: Some employers had implemented equality or gender initiatives aimed at increasing opportunities for women to join, stay and progress in the organisation. These included mandating a gender split on interview shortlists and interview panels, introducing returner programmes, amending or extending management training schemes, setting up women’s groups and networks, and working with schools to raise awareness of their profession among female students. Some had reviewed existing policies or re-introduced programmes as a result of discovering the extent of their GPG.
5.3 GPG action plans
This chapter of the report focuses on employers’ GPG action plans. In theory these are distinct from the GPG strategies discussed in the previous chapter, which often related to a general approach to the GPG rather than specific actions to address it. However, the qualitative interviews found that there was high degree of overlap between the two, and there was considerable subjectivity as to whether employers described these as GPG “strategies” or “action plans”.
As set out in Figure 23, approaching a third (30%) of employers had published, or intended to publish, an action plan for how they would try to reduce their GPG.
Figure 23 - Proportion of employers intending to publish a GPG action plan
| Percentage | |
|---|---|
| Total | 30% |
| Private sector | 26% |
| Voluntary sector | 37% |
| Public sector | 47% |
| 250 to 499 employees | 25% |
| 500 to 999 employees | 27% |
| 1,000 or more employees | 44% |
Base: all respondents (Base, Don’t know). Total (900, 11%), Private (391, 11%), Voluntary (252, 7%), Public (257, 11%), 250 to 499 employees (391, 11%), 500 to 999 (236, 9%), 1,000 or more (273, 11%)
While almost half of public sector (47%) and over a third of voluntary sector (37%) organisations intended to publish an action plan, this fell to a quarter (26%) among private sector employers. Large organisations with 1,000 or more employees were also comparatively more likely to publish a GPG action plan (44%).
As detailed in Table 19, the proportion of employers intending to publish an action plan has fallen since the baseline survey (from 39% to 30%). This pattern is consistent across all sectors and sizes, with the exception of those with 1,000 or more staff.
Table 19 - Proportion of employers intending to publish a GPG action plan (over time)
| Year | Total | Sector: Private | Sector: Voluntary | Sector: Public | Size: 250 to 499 | Size: 500 to 999 | Size: 1,000 or more | |
|---|---|---|---|---|---|---|---|---|
| Base: All respondents | 2017 | 900 | 406 | 243 | 251 | 412 | 214 | 274 |
| Base: All respondents | 2018 | 900 | 391 | 252 | 257 | 391 | 236 | 273 |
| Have or intend to publish action plan | 2017 | 39% | 36% | 44% | 57% | 35% | 44% | 44% |
| Have or intend to publish action plan | 2018 | 30% | 26% | 37% | 47% | 25% | 27% | 44% |
However, this decline over time is partly due to the impact of those employers that, having completed their calculations, found that they did not have a GPG. As shown in Table 20 below, just 21% of this group intended to publish an action plan. In contrast, among those that did have a GPG the proportion planning to publish an action plan was closer to the 2017 level, at 35%.
The larger their GPG, the more likely employers were to publish an action plan to address it. This ranged from around a quarter (28%) of those with a GPG of less than 6% to half (51%) of those with a GPG in excess of 20%.
Table 20 - Proportion of employers intending to publish a GPG action plan (by self- reported size of GPG)
| Has a GPG: Yes | Has a GPG: No | Size of GPG: 20% or higher | Size of GPG: 11% to 20% | Size of GPG: 6% to 10% | Size of GPG: Less than 6% | |
|---|---|---|---|---|---|---|
| Base: All publishing GPG data on portal | 576 | 252 | 142 | 165 | 93 | 103 |
| Have or intend to publish an action plan | 35% | 21% | 51% | 39% | 32% | 28% |
| Don’t know | 11% | 9% | 5% | 12% | 12% | 11% |
Those organisations that had or intended to produce a GPG action plan were asked whether this would be published externally (for example, on their website, in their annual report) and/or internally (for example, on their intranet, in a staff newsletter). As set out in Table 21, while the vast majority (89%) intended to publish their plan internally, only half (53%) intended to make it available to external audiences (equating to 16% of all surveyed employers).
Table 21 - Whether action plans will be published internally or externally
| Total | Sector: Private | Sector: Voluntary | Sector: Public | Size: 250 to 499 | Size: 500 to 999 | Size: 1,000 or more | |
|---|---|---|---|---|---|---|---|
| Base: All who have/plan to publish GPG action plan | 321 | 104 | 93 | 124 | 109 | 77 | 135 |
| Published internally | 89% | 93% | 84% | 80% | 94% | 84% | 86% |
| Published externally | 53% | 47% | 54% | 69% | 44% | 52% | 63% |
Public sector organisations and those with 1,000 or more staff were most likely to publish their plan externally (69% and 63% respectively).
Qualitative insight
Types and content of action plans
The qualitative interviews provided evidence of a range of different definitions of action plans. All employers in the qualitative sample who had developed action plans described them as part of a wider plan or document. In some cases, GPG measures had been included in existing quality and diversity strategies. The strategies themselves were often described as very comprehensive, including a wide range of targets and policies, with some specific additions or enhancements made to address GPG.
“We have a diversity strategy, which includes a schools outreach program, an apprenticeship program and flexible working. This has been enhanced to be more focused on GPG, with the addition of a returners program and management training.” (500 to 999, Private sector)
In some cases, actions to tackle GPG were included in the narrative commentary that the employer had produced to accompany their GPG results. They had labelled one part of this as an ‘action plan’. The level of detail of these plans varied. Most were said to be relatively succinct, often involving a small number of over-arching ambitions or commitments. Some respondents added that they intended to expand their action plans in the future. They explained that as yet (with only one year’s results to consider) they had not yet had time or did not yet feel able to set out more comprehensive actions.
“It is quite brief, really just outlining the commitment to continue what we are doing and describing what that is.” (1,000 or more, Private sector)
A minority of public sector and/or larger employers described more comprehensive GPG reports, which included sections setting out their plans to narrow the GPG. They considered these to be their GPG action plans and were using them internally to monitor their progress.
In terms of content, most employers in the sample who had developed action plans explained that these set out their ambitions in relation to reducing their GPG, described a commitment to address the issue in the future or reiterated what was already being done (confirming a commitment to continue). In some cases, plans went no further than this.
However, in a minority of cases (larger and/or public sector employers), plans were described as including more detailed, specific actions such as:
- a commitment to increase the number of women candidates interviewed for senior positions
- a commitment to review existing policies
- starting women’s groups/networks and/or providing new training opportunities for women
- launching pay or bonus reviews for senior staff
- supporting women in the applications for promotions and/or bonuses
Development and publication of plans
The approach to developing plans largely depended on their type and content, as described above. In many cases, employers explained that much of the content of their plans was already written in other documents or was created by summarising existing initiatives and either ‘re-badging’ or ‘re-emphasising’ them to focus on GPG. Plans of this type were often drafted by HR directors or others in their teams, before being signed-off by senior managers.
In a small minority of cases, a more formal approach was adopted to developing the content of action plans. This involved discussions among senior managers, presentation of ideas by key staff (for example, those in HR and equality/diversity roles) and formal analysis of proposed actions against agreed criteria.
“One of the main criteria was whether the plans were achievable and realistic. Our HR team worked with internal and external expertise to develop a draft to take to the board.” (1,000 or more, Private sector)
Employers who anticipated they would develop a (more concrete) plan in the future sometimes explained that the decision on what to include would be taken as a result of formal discussion and evaluation of the GPG data and potential actions.
“The results have been discussed by the senior managers and will be reviewed by the EMT each year. They will decide on any actions.” (500 to 999, Voluntary sector)
Most of the GPG-specific action plans developed by employers in the qualitative sample had been published in the public domain. However, this was generally because they were part of their narrative commentary. A small minority had published their broader equality and diversity action plans (which included GPG reduction within them). These were public sector organisations who described a policy to publish such data.
Employers who had set out actions to tackle their GPG were generally keen to make these actions known to the public via their websites. However, some employers did not feel it appropriate to share internal policies which might be commercially sensitive.
Implementation of plans
Some employers had already implemented the actions set out in their plans. This was typically because these actions had been in place for some time as part of other strategies and initiatives. However, in a minority of cases, employers had also implemented new actions such as reviewing pay structures, recruitment practices and policies.
“Lots of these things are just on-going, so yes we have started to implement the plan in that sense.” (1,000 or more, Private sector)
Respondents often explained that some actions in their plans would take longer to implement. For example, one employer wanted to re-start a women’s network but this was taking time to deliver due to limited resources and other priorities. Others mentioned that commitments such as enhanced training for managers would take further planning before they could be implemented in full. In the case of some large public sector employers, sign-off on specific initiatives was required at a regional or national level.
“We will have to wait for the go-ahead on providing assistance to applicants for bonuses.” (1,000 or more, Public sector)
5.4 Measuring the impact of plans and strategies
As detailed previously (Figure 21), 16% of the employers interviewed in the quantitative survey had developed a formalised GPG strategy and already undertaken at least some of the specified actions. This group were asked about how the impact of these actions would be evaluated and how successful they had been to date (Table 22).
Table 22 - Evaluation of actions taken to reduce GPG
| All already taking action to reduce GPG | |
|---|---|
| Base: All who have already taken action to reduce their GPG | 149 |
| How impact of actions will be evaluated | |
| Formalised process – at least annually | 72% |
| Formalised process – less often | 1% |
| Ad hoc/less formal basis | 25% |
| Do not plan to evaluate their impact | 1% |
| Don’t know | 2% |
| Whether already evaluated current impact of actions | |
| Yes | 26% |
| No | 69% |
| Don’t know | 5% |
| Perceived success of actions to date | |
| Very successful | 6% |
| Fairly successful | 52% |
| Neither successful nor unsuccessful | 24% |
| Fairly unsuccessful | 4% |
| Very unsuccessful | 0% |
| Too early to say | 13% |
Most (72%) of those that had already taken actions to reduce their GPG planned to evaluate their impact as part of a formalised process rather than on an ad hoc basis, with this typically undertaken at least annually. However, as discussed below, the qualitative interviews suggested that in some cases this ‘formalised’ evaluation simply consisted of employers continuing to monitor their GPG result.
Reflecting the fact that many of these strategies had been developed recently, only a quarter (26%) of employers had already evaluated their impact. Over half already judged these actions to have been successful (6% very successful and 52% fairly successful).
Most of the remainder felt that, to date, the actions had been neither successful nor unsuccessful (24%) or indicated that it was too early to say (13%).
Qualitative insight
While the above quantitative data relates solely to those employers that had already taken action to reduce their GPG, the qualitative interviews also explored this topic among those planning to take action.
In most cases, the only formal method of evaluating the success of their GPG actions was continuing to calculate their GPG results (as is required by the transparency regulations). Beyond this, the qualitative interviews pointed to a relatively informal approach to measuring the impact of these actions. Very few respondents were able to describe any formal assessment processes linking their GPG to specific actions or initiatives. They often explained that closing a GPG would take a considerable period of time, and that it would be difficult to attribute any success to specific measures.
However, where formalised plans were in place to encourage women back to work or encourage more women applicants (both external and internal), employers were monitoring the success of these particular objectives (but not their impact on overall GPG). Others were monitoring the success of initiatives to support women in terms of the level of interest in them (the number of women signing up or participating). Where actions described a commitment or ambition to achieve a particular gender balance at a certain pay grade within a certain timeframe, employers were formally monitoring these on a regular basis as part of their HR and/or equality and diversity reporting.
All employers explained that they will continue to monitor their GPG and that this will be reported as required by the regulations, and in some cases as part of other formal reporting mechanisms, such as Equal Pay Audits. However, employers did not expect their GPG to reduce very much in the short term. Some added that with a range of factors potentially impacting GPG, it was not realistic to set firm reduction targets.
“We can’t set targets that anyone is measured and rewarded against, it just isn’t realistic.” (500 to 999, Private sector)
While the vast majority of employers expected that it would take a number of years to reduce their GPG, there is no evidence to suggest that this will deter or demotivate those who are committed to tackling it. Respondents explained that their senior-level staff were realistic and recognised the challenges.
“It won’t make a difference. We are only doing things that we feel are the right thing to do anyway, it is not just about reducing the GPG.” (250 to 499, Private sector)
5.5 Barriers and challenges
This section of the report explores the barriers and challenges associated with closing the GPG. All findings are based on the qualitative in-depth interviews. These issues were not covered in the quantitative survey.
Barriers to taking action
Employers were asked to explain what was preventing them from taking (further) action to reduce their GPG. These barriers were often closely linked to their views on the key challenges to closing their GPG (set out in more detail in the next section). Some employers were not taking more action because they felt there was little point as there was nothing they could do to reduce their GPG.
“With such a low staff turnover, there isn’t really anything we can do.” (250 to 499, Private sector)
Furthermore, specific barriers were not easily identified, particularly where employers simply did not consider the issue a priority and felt that other issues were more important to tackle.
In some cases, organisations explained that they were not aware of anything (else) they could do. For example, some employers who were already providing flexible working (and had been doing so for some time) and adopted a ‘best person for the role’ approach to recruitment, felt that they were already doing all they could and were not able to think of anything else. Some of these explained that the only possible option they could think of would be to impose quotas on recruitment shortlists, but they were opposed to doing so on principle.
“I can’t think of anything. We could go down the route of employing women over men, but that is not something we are comfortable with.” (250 to 499, Private sector)
However, it is important to note that most employers were able to describe further actions they could potentially take to reduce their GPG. They were aware that additional training, flexible working arrangements and different recruitment approaches could contribute to a lower GPG over time.
Some employers explained that they could not afford to take the necessary action to close their GPG. They felt that to do this they would need to increase recruitment activity, implement new training or increase pay at certain grades. This was not considered economically viable for them at the current time.
“The main thing is that we are just not in a position to hire people at the moment. We can’t afford to. So how can we change the structure of pay?” (500 to 999, Private sector)
A minority of employers explained that the attitude of senior staff remained a barrier to taking action on their GPG. In some cases, senior managers were simply not engaged with the issue enough to drive through change. In others, respondents explained that senior staff were too focused on other priorities to devote time to considering how to reduce their GPG.
Challenges to reducing GPG
When asked what they considered to be the biggest challenge to reducing their GPG, the vast majority of qualitative respondents mentioned broad issues relating to their industry sector or society as a whole. Many explained that they were operating in a traditionally male-oriented sector (for example, construction, engineering, manufacturing). They explained that while efforts were being made to encourage women to apply for jobs in their sector, the supply of (suitable) women candidates was limited. Therefore, it was not always possible to interview women candidates, even in cases where it was a policy to do so.
“There is a shortage of applicants in general, and especially women. We can’t recruit if there isn’t anyone to recruit.” (500 to 999, Private sector)
Some employers added that they were facing broader challenges in recruiting staff (of any gender) with particular skills. Therefore, they were not in a position to reject a suitable male candidate (and keep looking for a female alternative) if one was available.
The underlying causes for the limited supply of female candidates were sometimes mentioned. Respondents in ‘male dominated’ sectors explained that not enough female students were taking up the relevant subjects required to become qualified to work in the sector. Some added that they were attempting to address this through outreach programmes in schools and colleges, but this was a long-term solution.
Some employers felt that the societal norms relating to work and raising children were key barriers to closing their GPG. They explained that women were more likely to take career breaks to raise a family. While they offered comprehensive maternity and paternity provision, flexible working or training/mentoring to encourage career progression, they explained that they could not force women to take advantage of these. Similarly, some felt that attitudinal shifts among women workers would take many years to materialise.
“The big barrier is the attitudes and choices made by women. Often, they do not want to take on senior roles, they have other priorities in life.” (1,000 or more, Private sector)
In addition to these wider issues, some employers noted that their ability to close their GPG was limited by the slow turnover of (senior) staff. They explained that in order to make a significant reduction in their GPG, a notable change in the ratio of men and women at very senior levels would be required. However, staff in these positions were often said to remain in post for many years.
Some large employers added that due to the size and structure of their workforce, the scale of changes required to deliver significant shifts in their GPG would be unrealistically large. They explained that while they were making efforts to reduce their GPG, they did not anticipate closing it (at least in the short term).
“There are initiatives which may reduce GPG in the long term, but probably not significantly. Given the size and shape of the organisation, it just isn’t feasible.” (1,000 or more, Private sector)
6. Future GPG measurement and reporting
This chapter looks at employers’ plans and views in relation to the future GPG reporting requirements. Specifically, it covers:
- awareness of future GPG reporting requirements
- intentions around publishing their next set of GPG data and progress made to date
- perceived usefulness of GPG metrics and any additional metrics considered useful
6.1 Future GPG reporting
Large employers will be required to next publish their GPG data by 4th April 2019 (or 30th March in the case of public sector organisations). Almost all respondents (99%) were aware that, going forwards, large employers would be required to report their GPG results every year. This was true of at least 98% of each employer sector and size band.
The 1% that were unaware of the future reporting requirements equated to just 9 employers. Most of these had 250 to 499 employees (6 respondents) and were in the private sector (6). They typically had a lower than average knowledge of the GPG, with only 4 of the 9 claiming to have a good understanding. Most had reported their first year’s GPG data (7), and all of these either had no GPG or a relatively low GPG of 5% or less. Of the 2 that had not reported on the portal by the time they were interviewed, one was unaware of the requirement to do so and one had fewer than 250 employees at the snapshot date.
As set out in Figure 24 below, at the time of the survey approaching two-thirds (61%) of employers intended to publish their results in the final quarter of the reporting period (between January and April 2019). A further 16% expected to publish between October and December 2018, with a small minority planning to do so between April and September 2018. Most of the remainder were still undecided.
However, a very small minority (1%) did not intend to publish at all, equating to just 7 survey respondents. All of these indicated that they would not be required to do so: 4 because they had fewer than 250 employees at the GPG snapshot date[footnote 26] and 3 because they were universities subject to Scottish/Welsh specific duties.
Figure 24 - Planned publication date for next set of GPG data
| Do not intend to publish | Not decided or don’t know | Jan to Apr 2019 | Oct to Dec 2018 | Apr to Sep 2018 | |
|---|---|---|---|---|---|
| Total | 1% | 17% | 61% | 16% | 5% |
| Private sector | 1% | 16% | 63% | 15% | 5% |
| Voluntary sector | 2% | 16% | 57% | 19% | 7% |
| Public sector | 0% | 19% | 58% | 18% | 5% |
| 250 to 499 employees | 1% | 13% | 67% | 14% | 6% |
| 500 to 999 employees | 0% | 16% | 65% | 15% | 5% |
| 1,000 or more employees | 0% | 25% | 48% | 22% | 5% |
Base: all respondents (Base). Total (900), Private (391), Voluntary (252), Public (257), 250 to 499 employees (391), 500 to 999 (236), 1,000 or more (273)
There were few significant differences in expected publication date by sector or size, although larger employers with 1,000 or more staff were comparatively more likely to publish by the end of 2018 (27%).
The above data in Figure 24 suggests that significant numbers of employers will publish their results earlier than they did in the first year of the regulations, when only 4% of all in-scope employers uploaded their results by the end of December (based on GEO data). However, the original baseline survey (conducted in March/April 2017) also suggested a significantly earlier reporting trajectory, but many employers subsequently did not meet this. Further qualitative research in 2017 found that the expected publication dates given in the baseline survey tended to be ambitions rather than firm plans, other issues or tasks often took priority over early compliance, and some employers found the process more time consuming then initially anticipated.
Furthermore, GEO data shows that in the first year of the regulations 81% of all in-scope employers published their GPG data in the final 30 days before the deadline (with 45% doing so in the final week). As such, while Figure 22 shows that 61% of employers plan to publish their results between January and April 2019, if the pattern is similar to that seen in Year 1 then many of these will not do so until March or April.
Qualitative insight
The qualitative interviews explored the progress employers had made towards complying with the second year of the GPG regulations. Figure 25 below summarises the typical stages of this process.
Figure 25 - Compliance process for second year of GPG reporting
Stage 1: Collating data
- Extracted from payroll system
- HR or payroll team in house
- Or external payroll provider
Stage 2: Making calculations
- HR or payroll team
- Sometimes management level
- Produces final key measures
Stage 3: Reviewing results and writing commentary
- Senior HR role
- Shared and debated with senior management
- Legal advice sought
Stage 4: Publication
- Final version uploaded to portal
At the time the qualitative interviews were conducted, most employers in the sample had not taken any steps towards compliance. This contrasts with the findings from the 2017 qualitative phase (conducted at a similar date), when most had already started to collate the data. However, this was often due to a desire to understand the requirements as soon as possible, and now that most employers were more comfortable that they knew what to do to they did not feel the need to start the process as early this year.
In a minority of cases, the employers interviewed in 2018 had already collated data and made the calculations. Some explained that they had been monitoring their GPG on a regular basis since the 2017 snapshot was taken, meaning that they had the data for their 2018 snapshot almost immediately.
The vast majority of employers explained that they planned to start the calculation stage earlier than last year (when many left this until February/March). This is partly because they envisaged the data collation stage would be quicker this time, and partly to ensure there was less of a rush in the final stages.
However, most were not working towards a specific publication date but rather acting on loose plans for when they would carry out the work and subsequently publish. These timescales varied, but many were planning to carry out the required work soon after Christmas. This was sometimes an arbitrary date that simply felt like a ‘sensible’ time before the deadline. In other cases, employers identified the New Year period as suitable because their workload was less than at other times of year.
“We will wait until January. We have other priorities before then, like external auditors. January is a little bit quieter.” (250 to 499, Private sector)
As was the case in 2017, all employers thought that complying with the regulations was important and therefore a high priority. However, none considered it to be an urgent priority, due to the time available to comply. Other initiatives were often being given priority over GPG (including complying with other HR-related tasks and regulations).
When asked what would encourage them to publish earlier, respondents struggled to identify any potential motivations. They explained that they worked towards the deadline set by the government, fitting the work in around other priorities. Some added that they did not equate the priority afforded to complying with the regulations to the importance placed on reducing their GPG. They felt that complying with the regulations was a requirement which they would fit in when convenient. In contrast, reducing their GPG was a more fundamental issue, with its importance reflected in the type of actions taken to address it but not in their approach to reporting their results.
“We had hoped to have done it already, but with the merger going on, it is less of a priority…Closing the GPG is certainly a priority but reporting is not, as long as we comply and meet the deadline.” (500 to 999, Private sector)
6.2 Perceptions of GPG metrics
When asked their views on the metrics that they were required to report under the regulations, the proportion of women in each pay quartile was felt to be the most valuable (Figure 26). The vast majority of respondents (83%) described this as either very or fairly useful. Two-thirds (66%) found the differences in mean/median hourly rate useful but there was less consensus on the metrics relating to bonuses. 57% felt the proportion paid bonuses was useful and 52% found the differences in mean/median bonus pay useful.
Figure 26 - Perceived usefulness of the current GPG metrics (summary)
| Not at all useful | Not very useful | Fairly useful | Very useful | |
|---|---|---|---|---|
| Differences in mean and median hourly rate | 8% | 23% | 51% | 15% |
| Proportion of women in each pay quartile | 5% | 10% | 50% | 33% |
| Proportion of women and men paid bonuses | 19% | 19% | 34% | 22% |
| Differences in mean and median bonus pay | 20% | 22% | 36% | 15% |
Base: all respondents (Base, Don’t know). Total (900, 3%, 2%, 6%, 6%)
Table 23 shows that public and voluntary sector employers tended to be more positive than those in the private sector about the value of the mean/median hourly rate and proportion of women in each pay quartile. However, they were less likely to describe the 2 metrics on bonuses as useful, perhaps reflecting the lower use of bonuses in these sectors. Employers with 1,000 or more staff were more likely to view each of the 4 metrics as useful.
Table 23 - Perceived usefulness of the current GPG metrics
| Proportion rating as very/fairly useful | Total | Sector: Private | Sector: Voluntary | Sector: Public | Size: 250 to 499 | Size: 500 to 999 | Size: 1,000 or more |
|---|---|---|---|---|---|---|---|
| Base: All respondents | 900 | 391 | 252 | 257 | 391 | 236 | 273 |
| Differences in mean and median hourly rate | 66% | 64% | 70% | 74% | 63% | 65% | 73% |
| Proportion of women in each pay quartile | 84% | 82% | 86% | 89% | 81% | 81% | 91% |
| Proportion of men and women paid bonuses | 57% | 63% | 29% | 44% | 53% | 57% | 62% |
| Differences in mean and median bonus pay | 52% | 57% | 31% | 42% | 49% | 53% | 56% |
Those employers who had a GPG were comparatively more likely to rate the proportion of women in each pay quartile as a useful metric (87% compared with 77% of those with no GPG). However, there were no differences in this respect on the other metrics.
As detailed in Figure 27, around a quarter (23%) of employers felt that there were other metrics they should be required to report in addition to the current ones. The most widespread suggestions were comparisons across job roles (7%), the full and part time split by gender (4%) and the proportion of men and women employed across the organisation as a whole (4%).
Figure 27 - Whether employers think they should be required to report additional metrics
| Response | Percentage |
|---|---|
| Yes | 23% |
| Comparing across job roles (for example, department, seniority, contract or permanent) | 7% |
| Full and part-time split between men and women | 4% |
| Overall number or proportion of men and women employed | 4% |
| Equal pay data | 2% |
| Other protected characteristics (for example, ethnicity, disability, age) | 2% |
| No | 75% |
Base: All respondents (Base, Don’t know). Total (900, 2%)
7. Employer gender profile
This chapter reports on the gender balance of the large employers interviewed in this survey, for both the workforce as a whole and for the senior management team specifically.
7.1 Gender profile of workforce
The survey data (Table 24) suggests that women are slightly under-represented in large organisations, with 54% of employers reporting that women made up no more than half of their total workforce. Just 11% were female dominated (76% to 100% of employees are female), whereas 23% were male dominated (0% to 25% female).
Table 24 - Proportion of employees that are women (respondent estimates)
| Total | Sector: Private | Sector: Voluntary | Sector: Public | Size: 250 to 499 | Size: 500 to 999 | Size: 1,000 or more | |
|---|---|---|---|---|---|---|---|
| Base: All respondents | 900 | 391 | 252 | 257 | 391 | 236 | 273 |
| 0% to 25% are women | 23% | 30% | 0% | 3% | 26% | 22% | 19% |
| 26% to 50% | 31% | 36% | 18% | 14% | 32% | 33% | 26% |
| 51% to 75% | 34% | 26% | 51% | 61% | 32% | 33% | 37% |
| 76% to 100% are women | 11% | 6% | 28% | 20% | 9% | 9% | 17% |
| Don’t know | 2% | 2% | 3% | 1% | 2% | 3% | 0% |
However, the above pattern was driven by the private sector, which accounts for 74% of all GB organisations with 250+ employees (based on ONS data[footnote 27]). When looking at the voluntary and public sectors in isolation, women actually made up the majority of the workforce sectors (79% and 82% respectively reported that over half of their employees were female).
Women accounted for over half of the workforce in 54% of 1,000 or more employee organisations, compared to 42% of 500 to 999 employee organisations and 41% of 250 to 499 employee organisations.
7.2 Gender profile of senior management team
The gender imbalance was significantly more pronounced when it came to the senior management teams of large employers (Table 25). Just 24% reported that the majority of their senior management were women, and 40% indicated that women accounted for no more than a quarter of all senior positions.
Table 25 - Proportion of senior management team that are women (respondent estimates)
| Total | Sector: Private | Sector: Voluntary | Sector: Public | Size: 250 to 499 | Size: 500 to 999 | Size: 1,000 or more | |
|---|---|---|---|---|---|---|---|
| Base: All respondents | 900 | 391 | 252 | 257 | 391 | 236 | 273 |
| 0% are women | 2% | 3% | 0% | 1% | 4% | 3% | 0% |
| 1% to 25% | 38% | 46% | 13% | 15% | 38% | 41% | 34% |
| 26% to 50% | 32% | 31% | 36% | 37% | 34% | 29% | 33% |
| 51% to 75% | 17% | 11% | 29% | 34% | 14% | 18% | 20% |
| 76% to 99% | 6% | 4% | 17% | 7% | 7% | 5% | 6% |
| 100% are women | 1% | 1% | 0% | 0% | 1% | 3% | 0% |
| Don’t know | 4% | 3% | 4% | 6% | 2% | 3% | 7% |
Again, the overall results were driven by the private sector, with half (49%) of these companies reporting that women made up no more than 25% of their senior management team (and 3% having no female representation at a senior level).
Although women accounted for the majority of all voluntary and public sector employees, they were less well represented at senior levels in these organisations. 47% of voluntary sector and 41% of public sector organisations reported that more than half of their senior management team were women.
There was relatively little difference by employer size in this respect.
8. Conclusions
In summary, this research shows that the introduction of the transparency regulations has succeeded in driving up awareness and understanding of GPG and gender pay issues in general. This is the case for both HR professionals and at board level.
While the majority of employers now have a clear understanding of the difference between GPG and equal pay, concerns remain that this is not reflected among the general public. More wide-reaching communication of the differences would help reassure employers that their GPG results will not be misinterpreted.
The impact of the regulations on employers’ attitudes and actions is less consistent. Calculating their GPG prompted increased consideration of the issue among many employers, but their engagement often remains relatively reactive. In most cases the primary focus has been on complying with the regulations, explaining or justifying their results and communicating an intention to reduce their GPG in the future.
This research suggests that the regulations do not (as yet) appear to have resulted in many employers developing concrete, measurable and targeted actions to reduce their GPG. Where action has been taken, it was often an extension of existing equality and diversity activities.
If the regulations are to have a significant impact on overall GPG, more employers will need to commit to taking action to address it. Currently, some employers are deferring action until they have longer term confirmation that their GPG needs addressing (based on several years’ data). Others perceive there to be intractable barriers to reducing their GPG which are outside of their control. The qualitative interviews also found that a minority do not consider the GPG measure to provide a fair or useful reflection of their employment practices and/or approach to gender equality. These perceptions typically deter employers from taking any action, so further engagement to educate and challenge these views would be beneficial.
The research shows that the process of complying with the first year of the regulations was a considerable burden on a significant proportion of employers. However, many of the challenges related to working out what to do and how to do it. As such, complying should become increasingly straightforward in the future as previous knowledge is applied and processes become established and embedded. Additionally, employer awareness of their duty to report on a yearly basis is near universal.
However, due to the diversity of employers’ staff structures and remuneration practices, a ‘one size fits all’ approach to information and guidance around compliance will not suffice. More granular support is required to effectively address specific, complex circumstances (for example, contract staff, salary sacrifice).
9. Annex A. Full survey results
This annex provides the results to each individual question in the quantitative survey. Results have been shown at the total level, by sector and by employer size.
9.1 S1b – Please can I take a note of your job title?
| Total | Sector: Private | Sector: Voluntary | Sector: Public | Size: 250 to 499 | Size: 500 to 999 | Size: 1,000 or more | |
| Base (unweighted) | 900 | 391 | 252 | 257 | 391 | 236 | 273 |
| HR Director/Manager | 37% | 34% | 52% | 41% | 41% | 41% | 25% |
| HR Administrator/Adviser/ Officer | 12% | 12% | 13% | 15% | 12% | 11% | 13% |
| Finance Director/Manager | 11% | 13% | 7% | 7% | 15% | 10% | 7% |
| Payroll Manager/ Administrator | 10% | 11% | 5% | 4% | 7% | 13% | 11% |
| Rewards/Benefits Manager | 8% | 9% | 5% | 3% | 3% | 5% | 20% |
| HR Business Partner/ Consultant | 5% | 4% | 7% | 8% | 5% | 4% | 6% |
| Accounts Manager/ Administrator | 3% | 4% | 0% | 0% | 4% | 2% | 2% |
| Head of People | 3% | 3% | 3% | 1% | 4% | 1% | 3% |
| Business Director/ Manager | 2% | 2% | 1% | 0% | 2% | 3% | 0% |
| General/Office Manager | 2% | 2% | 0% | 0% | 2% | 1% | 1% |
| Equality/Diversity/ Inclusion Manager | 1% | 0% | 1% | 7% | 0% | 1% | 4% |
| CEO/MD | 1% | 1% | 1% | 1% | 1% | 1% | 1% |
| Operations Director/ Manager | 1% | 1% | 2% | 0% | 1% | 2% | 0% |
| Administrator | 0% | 1% | 0% | 0% | 0% | 0% | 1% |
| Other | 5% | 4% | 4% | 11% | 3% | 4% | 7% |
Base: All respondents
9.2 S2 – Which of the following best describes your organisation?
| Total | Sector: Private | Sector: Voluntary | Sector: Public | Size: 250 to 499 | Size: 500 to 999 | Size: 1,000 or more | |
| Base (unweighted) | 900 | 391 | 252 | 257 | 391 | 236 | 273 |
| A private sector company that seeks to make a profit | 74% | 100% | 0% | 0% | 77% | 76% | 67% |
| A charity, voluntary sector or not-for-profit organisation | 12% | 0% | 100% | 0% | 12% | 13% | 12% |
| A public sector organisation | 14% | 0% | 0% | 100% | 10% | 11% | 22% |
Base: All respondents
9.3 S3a/b – Approximately how many employees does your organisation currently employ in Great Britain?
| Total | Sector: Private | Sector: Voluntary | Sector: Public | Size: 250 to 499 | Size: 500 to 999 | Size: 1,000 or more | |
| Base (unweighted) | 900 | 391 | 252 | 257 | 391 | 236 | 273 |
| 250 to 499 | 49% | 51% | 49% | 38% | 100% | 0% | 0% |
| 500 to 999 | 25% | 26% | 26% | 20% | 0% | 100% | 0% |
| 1,000 or more | 26% | 24% | 25% | 42% | 0% | 0% | 100% |
Base: All respondents
9.4 S4a/b – And approximately what percentage of these employees are women?
| Total | Sector: Private | Sector: Voluntary | Sector: Public | Size: 250 to 499 | Size: 500 to 999 | Size: 1,000 or more | |
| Base (unweighted) | 900 | 391 | 252 | 257 | 391 | 236 | 273 |
| 0% of your employees are women | 0% | 0% | 0% | 0% | 0% | 0% | 0% |
| 1% to 25% | 23% | 30% | 0% | 3% | 26% | 22% | 19% |
| 26% to 50% | 31% | 36% | 18% | 14% | 32% | 33% | 26% |
| 51% to 75% | 34% | 26% | 51% | 61% | 32% | 33% | 37% |
| 76% to 99% | 11% | 6% | 28% | 20% | 9% | 9% | 17% |
| 100% of your employees are women | 0% | 0% | 0% | 0% | 0% | 0% | 0% |
| Don’t know | 2% | 2% | 3% | 1% | 2% | 3% | 0% |
Base: All respondents
9.5 S5a/b – Now thinking just about those working in senior management positions, approximately what percentage of these are women?
| Total | Sector: Private | Sector: Voluntary | Sector: Public | Size: 250 to 499 | Size: 500 to 999 | Size: 1,000 or more | |
| Base (unweighted) | 900 | 391 | 252 | 257 | 391 | 236 | 273 |
| 0% of your senior management are women | 2% | 3% | 0% | 1% | 4% | 3% | 0% |
| 1% to 25% | 38% | 46% | 13% | 15% | 38% | 41% | 34% |
| 26% to 50% | 32% | 31% | 36% | 37% | 34% | 29% | 33% |
| 51% to 75% | 17% | 11% | 29% | 34% | 14% | 18% | 20% |
| 76% to 99% | 6% | 4% | 17% | 7% | 7% | 5% | 6% |
| 100% of your senior management are women | 1% | 1% | 0% | 0% | 1% | 3% | 0% |
| Don’t know | 4% | 3% | 4% | 6% | 2% | 3% | 7% |
Base: All respondents
9.6 A2 – Which of the following statements best describes your understanding of the gender pay gap?
| Total | Sector: Private | Sector: Voluntary | Sector: Public | Size: 250 to 499 | Size: 500 to 999 | Size: 1,000 or more | |
| Base (unweighted) | 900 | 391 | 252 | 257 | 391 | 236 | 273 |
| Had not heard of the gender pay gap before today | 0% | 0% | 0% | 0% | 0% | 0% | 0% |
| You have heard the term but don’t know anything about it | 0% | 0% | 0% | 0% | 0% | 0% | 0% |
| You have a limited understanding of what it refers to | 2% | 2% | 0% | 0% | 3% | 1% | 0% |
| You have a reasonable understanding of it but not of how it’s calculated | 16% | 17% | 15% | 15% | 17% | 16% | 15% |
| You have a good understanding of what the gender pay gap is and how it is calculated | 82% | 81% | 85% | 85% | 80% | 83% | 85% |
Base: All respondents
9.7 A3 – Which of the following statements best describes your understanding of the difference between ‘closing the gender pay gap’ and ‘ensuring equal pay between men and women’?
| Total | Sector: Private | Sector: Voluntary | Sector: Public | Size: 250 to 499 | Size: 500 to 999 | Size: 1,000 or more | |
| Base (unweighted) | 900 | 391 | 252 | 257 | 391 | 236 | 273 |
| You didn’t know there was a difference | 2% | 2% | 1% | 0% | 2% | 2% | 1% |
| You know there’s a difference but are not sure exactly what this is | 11% | 12% | 6% | 7% | 13% | 9% | 8% |
| You have a good understanding of how they differ | 88% | 86% | 93% | 93% | 85% | 89% | 91% |
| Don’t know | 0% | 0% | 0% | 0% | 0% | 0% | 1% |
Base: All respondents
9.8 A5 – I’m now going to give you a few different scenarios, and I’d like you to tell me whether, in your opinion, each one refers to: a breach of equal pay law, or a gender pay gap issue but not a breach of equal pay law, or neither?
A company where there is a difference in the annual pay of men and women solely because more women work fewer hours
| Total | Sector: Private | Sector: Voluntary | Sector: Public | Size: 250 to 499 | Size: 500 to 999 | Size: 1,000 or more | |
| Base (unweighted) | 900 | 391 | 252 | 257 | 391 | 236 | 273 |
| Breach of equal pay law | 10% | 10% | 9% | 10% | 12% | 10% | 8% |
| Gender pay gap issue but not a breach of equal pay law | 46% | 44% | 53% | 51% | 46% | 44% | 47% |
| Neither (correct response) | 40% | 41% | 37% | 37% | 39% | 40% | 42% |
| Don’t know | 4% | 4% | 2% | 2% | 3% | 6% | 3% |
Base: All respondents
A company where there is a difference in the average hourly pay of men and women because more women work in less senior roles
| Total | Sector: Private | Sector: Voluntary | Sector: Public | Size: 250 to 499 | Size: 500 to 999 | Size: 1,000 or more | |
| Base (unweighted) | 900 | 391 | 252 | 257 | 391 | 236 | 273 |
| Breach of equal pay law | 7% | 8% | 5% | 4% | 9% | 6% | 4% |
| Gender pay gap issue but not a breach of equal pay law (correct response) | 80% | 78% | 85% | 89% | 77% | 79% | 88% |
| Neither | 11% | 12% | 9% | 7% | 12% | 14% | 6% |
| Don’t know | 2% | 2% | 2% | 1% | 2% | 2% | 1% |
Base: All respondents
A company where men and women are paid a different hourly rate for doing the same job
| Total | Sector: Private | Sector: Voluntary | Sector: Public | Size: 250 to 499 | Size: 500 to 999 | Size: 1,000 or more | |
| Base (unweighted) | 900 | 391 | 252 | 257 | 391 | 236 | 273 |
| Breach of equal pay law (correct response) | 90% | 88% | 94% | 94% | 90% | 88% | 90% |
| Gender pay gap issue but not a breach of equal pay law | 7% | 8% | 5% | 5% | 6% | 7% | 9% |
| Neither | 2% | 3% | 0% | 1% | 2% | 3% | 1% |
| Don’t know | 1% | 1% | 0% | 1% | 1% | 2% | 0% |
Base: All respondents
9.9 A4 – Thinking about your organisation’s leadership team or board, how much understanding do you think they have of the gender pay gap and the difference between this and Equal Pay?
| Total | Sector: Private | Sector: Voluntary | Sector: Public | Size: 250 to 499 | Size: 500 to 999 | Size: 1,000 or more | |
| Base (unweighted) | 900 | 391 | 252 | 257 | 391 | 236 | 273 |
| Very good understanding | 25% | 22% | 33% | 31% | 21% | 26% | 31% |
| Fairly good understanding | 63% | 63% | 61% | 61% | 65% | 60% | 60% |
| Fairly poor understanding | 11% | 12% | 6% | 7% | 12% | 12% | 7% |
| Very poor understanding | 1% | 1% | 0% | 0% | 1% | 0% | 1% |
| Don’t know | 1% | 1% | 0% | 1% | 1% | 1% | 1% |
Base: All respondents
9.10 B7 – Can I just confirm whether your organisation…?
Reported its GPG data on the official government portal
| Total | Sector: Private | Sector: Voluntary | Sector: Public | Size: 250 to 499 | Size: 500 to 999 | Size: 1,000 or more | |
| Base (unweighted) | 900 | 391 | 252 | 257 | 391 | 236 | 273 |
| Yes | 97% | 97% | 95% | 96% | 94% | 99% | 99% |
| No | 3% | 3% | 5% | 4% | 6% | 1% | 1% |
| Don’t know | 0% | 0% | 0% | 0% | 0% | 0% | 0% |
Base: All respondents
Reported its GPG data on its own website
| Total | Sector: Private | Sector: Voluntary | Sector: Public | Size: 250 to 499 | Size: 500 to 999 | Size: 1,000 or more | |
| Base (unweighted) | 900 | 391 | 252 | 257 | 391 | 236 | 273 |
| Yes | 91% | 90% | 95% | 94% | 88% | 93% | 95% |
| No | 7% | 8% | 4% | 5% | 10% | 6% | 3% |
| Don’t know | 2% | 2% | 2% | 1% | 2% | 2% | 2% |
Base: All respondents
9.11 B8 – And what was the main reason why your organisation did not report its GPG data on the official portal? (unprompted)
| Total | Sector: Private | Sector: Voluntary | Sector: Public | Size: 250 to 499 | Size: 500 to 999 | Size: 1,000 or more | |
| Base (unweighted) | 32 | 11 | 12 | 9 | 23 | 3 | 6 |
| Not required as had less than 250 employees | 69% | 83% | 33% | 48% | 83% | 0% | 0% |
| Not aware of regulations/ requirement to report on the portal | 14% | 17% | 8% | 10% | 9% | 64% | 16% |
| Not required as subject to Scottish/Welsh specific duties (for example, university) | 9% | 0% | 35% | 20% | 2% | 0% | 84% |
| Not required as was not yet a legal entity | 3% | 0% | 0% | 22% | 2% | 18% | 0% |
| Results published by different part of organisation (for example, head office, different subsidiary) | 3% | 0% | 16% | 0% | 2% | 18% | 0% |
| Waiting for 3rd party to produce GPD data/report | 1% | 0% | 8% | 0% | 2% | 0% | 0% |
Base: All who did not report GPG on government portal
9.12 B9a – When your organisation reported on the government portal, did it publish one set of GPG data for the organisation as a whole or did it publish separate data for different subsidiaries?
| Total | Sector: Private | Sector: Voluntary | Sector: Public | Size: 250 to 499 | Size: 500 to 999 | Size: 1,000 or more | |
| Base (unweighted) | 868 | 380 | 240 | 248 | 368 | 233 | 267 |
| One set of GPG data for whole organisation | 85% | 83% | 89% | 94% | 91% | 87% | 75% |
| Separate GPG data for different subsidiaries | 13% | 15% | 8% | 4% | 7% | 11% | 24% |
| Don’t know | 2% | 2% | 2% | 2% | 2% | 1% | 2% |
Base: All who reported GPG on government portal
9.13 B9b – And were you personally involved in the GPG reporting for more than one of these subsidiaries?
| Total | Sector: Private | Sector: Voluntary | Sector: Public | Size: 250 to 499 | Size: 500 to 999 | Size: 1,000 or more | |
| Base (unweighted) | 89 | 59 | 20 | 10 | 22 | 22 | 45 |
| Yes, involved in more than one | 75% | 73% | 85% | 79% | 51% | 75% | 87% |
| No, only involved in one | 25% | 27% | 15% | 21% | 49% | 25% | 13% |
Base: All who reported GPG as separate subsidiaries
9.14 B10 – Can I just check whether your organisation reported its GPG data on the official portal by the <4th April / 30th March> 2018 deadline?
| Total | Sector: Private | Sector: Voluntary | Sector: Public | Size: 250 to 499 | Size: 500 to 999 | Size: 1,000 or more | |
| Base (unweighted) | 868 | 380 | 240 | 248 | 368 | 233 | 267 |
| Yes, reported by deadline | 96% | 95% | 98% | 98% | 96% | 93% | 98% |
| No, reported after deadline | 4% | 5% | 2% | 2% | 4% | 7% | 2% |
Base: All who reported GPG on government portal
9.15 B11 – And what was the main reason why your organisation did not report its GPG data until after the deadline? (unprompted)
| Total | Sector: Private | Sector: Voluntary | Sector: Public | Size: 250 to 499 | Size: 500 to 999 | Size: 1,000 or more | |
| Base (unweighted) | 28 | 20 | 4 | 4 | 14 | 11 | 3 |
| Difficulties registering on portal (for example, didn’t receive log in details/PIN) | 32% | 31% | 50% | 48% | 39% | 34% | 0% |
| Staffing/resource issues | 14% | 14% | 0% | 26% | 3% | 21% | 33% |
| Software issues/delays | 14% | 16% | 0% | 0% | 21% | 10% | 0% |
| Time taken to collate data/ complexity of calculations | 10% | 9% | 0% | 26% | 3% | 10% | 33% |
| Other more important/ competing priorities | 10% | 10% | 25% | 0% | 11% | 3% | 33% |
| Calculation/submission errors | 10% | 9% | 0% | 26% | 3% | 21% | 0% |
| Other | 14% | 16% | 0% | 0% | 21% | 0% | 33% |
| Don’t know | 1% | 0% | 25% | 0% | 2% | 0% | 0% |
Base: All who reported GPG on government portal after deadline
9.16 B12a – Thinking about your organisation’s results, was women’s median hourly pay lower, higher or exactly the same as men’s?
| Total | Sector: Private | Sector: Voluntary | Sector: Public | Size: 250 to 499 | Size: 500 to 999 | Size: 1,000 or more | |
| Base (unweighted) | 868 | 380 | 240 | 248 | 368 | 233 | 267 |
| Lower than men’s | 66% | 65% | 54% | 81% | 63% | 67% | 68% |
| Higher than men’s | 15% | 15% | 22% | 11% | 17% | 13% | 13% |
| Exactly the same (median GPG was 0%) | 14% | 15% | 19% | 6% | 12% | 15% | 17% |
| Don’t know | 5% | 6% | 5% | 3% | 7% | 4% | 3% |
Base: All who reported GPG on government portal
9.17 B12b – What was the median gender pay gap?
| Total | Sector: Private | Sector: Voluntary | Sector: Public | Size: 250 to 499 | Size: 500 to 999 | Size: 1,000 or more | |
| Base (unweighted) | 868 | 380 | 240 | 248 | 368 | 233 | 267 |
| Has a GPG – women’s median hourly pay is lower than men’s | 66% | 65% | 54% | 81% | 63% | 67% | 68% |
| Over 25% | 11% | 11% | 6% | 16% | 11% | 11% | 11% |
| 21% to 25% | 4% | 4% | 6% | 7% | 3% | 7% | 5% |
| 16% to 20% | 7% | 7% | 7% | 12% | 5% | 7% | 11% |
| 11% to 15% | 10% | 10% | 7% | 16% | 9% | 9% | 13% |
| 6% to 10% | 9% | 8% | 11% | 14% | 8% | 11% | 10% |
| 1% to 5% | 13% | 13% | 13% | 8% | 14% | 12% | 12% |
| Don’t know median (but has GPG) | 11% | 12% | 4% | 8% | 14% | 10% | 6% |
| Does not have a GPG – women’s median hourly pay is the same as men’s | 14% | 15% | 19% | 6% | 12% | 15% | 17% |
| Has a negative GPG – women’s median hourly pay is higher than men’s | 15% | 15% | 22% | 11% | 17% | 13% | 13% |
| -1% to -5% | 6% | 6% | 9% | 5% | 6% | 6% | 8% |
| Over -5% | 6% | 6% | 8% | 4% | 7% | 6% | 4% |
| Don’t know median (but negative GPG) | 3% | 3% | 5% | 1% | 5% | 2% | 1% |
| Don’t know if has a GPG | 5% | 6% | 5% | 3% | 7% | 4% | 3% |
Base: All who reported GPG on government portal
9.18 B13a – In which month did your organisation publish its results on the official government portal?
| Total | Sector: Private | Sector: Voluntary | Sector: Public | Size: 250 to 499 | Size: 500 to 999 | Size: 1,000 or more | |
| Base (unweighted) | 868 | 380 | 240 | 248 | 368 | 233 | 267 |
| April 2017 | 0% | 0% | 0% | 0% | 0% | 1% | 0% |
| May 2017 | 0% | 0% | 0% | 1% | 0% | 0% | 1% |
| June 2017 | 0% | 0% | 0% | 0% | 0% | 0% | 0% |
| July 2017 | 0% | 0% | 0% | 0% | 0% | 0% | 0% |
| August 2017 | 0% | 0% | 0% | 0% | 1% | 0% | 0% |
| September 2017 | 0% | 0% | 0% | 0% | 0% | 1% | 0% |
| October 2017 | 0% | 0% | 1% | 1% | 1% | 0% | 0% |
| November 2017 | 1% | 1% | 0% | 1% | 0% | 0% | 2% |
| December 2017 | 1% | 0% | 1% | 2% | 1% | 0% | 0% |
| January 2018 | 3% | 3% | 4% | 5% | 3% | 5% | 3% |
| February 2018 | 5% | 3% | 9% | 11% | 6% | 4% | 3% |
| March 2018 | 45% | 41% | 45% | 67% | 41% | 45% | 51% |
| April 2018 | 35% | 41% | 33% | 4% | 40% | 30% | 32% |
| Don’t know | 4% | 5% | 4% | 5% | 3% | 6% | 6% |
| Did not report by deadline | 4% | 5% | 2% | 2% | 4% | 7% | 2% |
Base: All who reported GPG on government portal. Note: The March 2018 and April 2018 codes only include those organisations that published by their official deadline date. Public sector organisations publishing after 30th March and private/voluntary sector organisations publishing after 4th April are shown in the ‘Did not report by deadline’ code
9.19 B13b – What is the main reason why your organisation did not publish its results earlier than this? (unprompted)
| Total | Sector: Private | Sector: Voluntary | Sector: Public | Size: 250 to 499 | Size: 500 to 999 | Size: 1,000 or more | |
| Base (unweighted) | 672 | 306 | 187 | 179 | 278 | 176 | 218 |
| Time taken to collate data | 40% | 41% | 38% | 35% | 37% | 39% | 46% |
| Time taken to run analysis/ calculations | 27% | 27% | 30% | 25% | 28% | 23% | 30% |
| Other more important/ competing priorities | 12% | 11% | 17% | 11% | 11% | 16% | 10% |
| Time taken for internal approval | 11% | 10% | 12% | 12% | 8% | 9% | 17% |
| Worked towards deadline | 10% | 11% | 8% | 11% | 14% | 10% | 5% |
| Wanted to see results from other organisations first | 6% | 7% | 4% | 7% | 6% | 7% | 7% |
| Wanted to see how other organisations reported/ explained their results | 6% | 6% | 3% | 5% | 5% | 7% | 6% |
| Staffing issues / lack of resource | 6% | 6% | 7% | 4% | 6% | 6% | 5% |
| Time taken by 3rd parties to provide data/analysis | 6% | 4% | 8% | 16% | 5% | 7% | 6% |
| Wanted to get a better understanding of what/how to report | 5% | 5% | 3% | 6% | 5% | 6% | 3% |
| Part of annual reporting/ timed with other subsidiaries/ divisions | 2% | 1% | 2% | 6% | 0% | 2% | 4% |
| Wanted to ensure report was accurate/clear/meaningful | 2% | 2% | 1% | 2% | 1% | 3% | 3% |
| Late awareness of requirement | 2% | 2% | 2% | 1% | 2% | 2% | 1% |
| Wanted to communicate results internally first | 2% | 2% | 1% | 0% | 2% | 0% | 3% |
| First time reporting | 2% | 2% | 2% | 2% | 1% | 2% | 3% |
| Software issues | 1% | 1% | 2% | 2% | 1% | 2% | 2% |
| Difficulties registering on portal (for example, PIN issues) | 1% | 1% | 2% | 0% | 1% | 1% | 0% |
| Wanted to avoid negative publicity/media attention | 1% | 1% | 1% | 1% | 0% | 1% | 3% |
| No particular reason | 1% | 1% | 2% | 0% | 1% | 2% | 0% |
| Other | 4% | 4% | 6% | 5% | 6% | 1% | 4% |
| Don’t know | 4% | 5% | 4% | 3% | 5% | 5% | 3% |
Base: All who reported GPG on government portal in March/April 2018 (by the relevant deadline)
9.20 B14 – Did you do any of the following?
Get internal sign-off from your leadership team or board before publishing your results
| Total | Sector: Private | Sector: Voluntary | Sector: Public | Size: 250 to 499 | Size: 500 to 999 | Size: 1,000 or more | |
| Base (unweighted) | 868 | 380 | 240 | 248 | 368 | 233 | 267 |
| Yes | 96% | 97% | 94% | 95% | 96% | 95% | 98% |
| No | 3% | 3% | 5% | 5% | 4% | 4% | 2% |
| Don’t know | 0% | 0% | 1% | 0% | 0% | 1% | 0% |
Base: All who reported GPG on government portal
Produce an accompanying narrative commentary
| Total | Sector: Private | Sector: Voluntary | Sector: Public | Size: 250 to 499 | Size: 500 to 999 | Size: 1,000 or more | |
| Base (unweighted) | 868 | 380 | 240 | 248 | 368 | 233 | 267 |
| Yes | 83% | 81% | 92% | 90% | 77% | 86% | 93% |
| No | 14% | 16% | 6% | 9% | 20% | 11% | 7% |
| Don’t know | 3% | 3% | 2% | 1% | 4% | 4% | 1% |
Base: All who reported GPG on government portal
Use the GPG Viewing service to review results from other organisations
| Total | Sector: Private | Sector: Voluntary | Sector: Public | Size: 250 to 499 | Size: 500 to 999 | Size: 1,000 or more | |
| Base (unweighted) | 868 | 380 | 240 | 248 | 368 | 233 | 267 |
| Yes | 73% | 72% | 73% | 78% | 71% | 72% | 78% |
| No | 22% | 22% | 22% | 19% | 23% | 23% | 18% |
| Don’t know | 6% | 6% | 4% | 3% | 6% | 6% | 4% |
Base: All who reported GPG on government portal
9.21 B15 – Did the narrative commentary you provided include any of the following?
| Total | Sector: Private | Sector: Voluntary | Sector: Public | Size: 250 to 499 | Size: 500 to 999 | Size: 1,000 or more | |
| Base (unweighted) | 754 | 309 | 221 | 224 | 297 | 205 | 252 |
| An explanation of the reasons for your GPG | 90% | 90% | 90% | 90% | 89% | 90% | 91% |
| Strategies and actions to reduce your GPG | 62% | 61% | 60% | 67% | 59% | 57% | 70% |
| More detailed analysis of your data | 59% | 58% | 57% | 68% | 56% | 58% | 64% |
| Comparisons with your sector or key competitors | 31% | 29% | 38% | 35% | 35% | 28% | 28% |
| Targets for reducing your GPG | 17% | 17% | 18% | 14% | 16% | 16% | 20% |
| Other: General background information (on company, ethos, etc) | 3% | 3% | 3% | 1% | 2% | 4% | 3% |
| Other: Commitment statement/supporting statements | 2% | 2% | 3% | 2% | 1% | 3% | 2% |
| Other: Explanation of terms (for example, definitions, difference between GPG and equal pay) | 2% | 1% | 2% | 2% | 0% | 1% | 4% |
| Other: Different ways of illustrating the data (for example, charts, infographics, case studies) | 1% | 1% | 0% | 2% | 0% | 0% | 3% |
| Other: Something else | 3% | 3% | 1% | 3% | 0% | 4% | 5% |
| None of these | 2% | 2% | 1% | 2% | 2% | 3% | 1% |
| Don’t know | 2% | 2% | 1% | 2% | 2% | 0% | 3% |
Base: All who produced narrative commentary
9.22 B16 – Overall, how did you find the process of complying with the GPG reporting regulations? Please answer on a scale of 1 to 5, where 1 means it was very difficult and 5 means it was very straightforward.
| Total | Sector: Private | Sector: Voluntary | Sector: Public | Size: 250 to 499 | Size: 500 to 999 | Size: 1,000 or more | |
| Base (unweighted) | 868 | 380 | 240 | 248 | 368 | 233 | 267 |
| 1 - Very difficult | 9% | 10% | 7% | 6% | 9% | 11% | 8% |
| 2 | 21% | 22% | 19% | 18% | 18% | 24% | 24% |
| 3 | 34% | 35% | 33% | 28% | 38% | 25% | 34% |
| 4 | 24% | 22% | 28% | 35% | 23% | 29% | 22% |
| 5 - Very straightforward | 10% | 10% | 12% | 13% | 10% | 10% | 11% |
| Don’t know | 1% | 2% | 0% | 1% | 2% | 1% | 1% |
Base: All who reported GPG on government portal
9.23 B17 – And specifically, how did you find the following tasks?
Understanding what you were required to do
| Total | Sector: Private | Sector: Voluntary | Sector: Public | Size: 250 to 499 | Size: 500 to 999 | Size: 1,000 or more | |
| Base (unweighted) | 868 | 380 | 240 | 248 | 368 | 233 | 267 |
| 1 - Very difficult | 5% | 6% | 3% | 3% | 5% | 7% | 3% |
| 2 | 19% | 21% | 16% | 13% | 18% | 20% | 20% |
| 3 | 29% | 29% | 27% | 29% | 30% | 27% | 28% |
| 4 | 31% | 29% | 34% | 39% | 30% | 30% | 36% |
| 5 - Very straightforward | 15% | 14% | 20% | 16% | 16% | 16% | 13% |
| Don’t know | 1% | 1% | 0% | 0% | 1% | 1% | 0% |
Base: All who reported GPG on government portal
Gathering the necessary data
| Total | Sector: Private | Sector: Voluntary | Sector: Public | Size: 250 to 499 | Size: 500 to 999 | Size: 1,000 or more | |
| Base (unweighted) | 868 | 380 | 240 | 248 | 368 | 233 | 267 |
| 1 - Very difficult | 10% | 10% | 9% | 7% | 7% | 14% | 11% |
| 2 | 21% | 21% | 22% | 21% | 21% | 16% | 25% |
| 3 | 27% | 29% | 25% | 20% | 30% | 27% | 23% |
| 4 | 28% | 28% | 27% | 29% | 28% | 28% | 29% |
| 5 - Very straightforward | 13% | 11% | 16% | 22% | 14% | 13% | 12% |
| Don’t know | 1% | 1% | 1% | 1% | 1% | 1% | 0% |
Base: All who reported GPG on government portal
Calculating your results
| Total | Sector: Private | Sector: Voluntary | Sector: Public | Size: 250 to 499 | Size: 500 to 999 | Size: 1,000 or more | |
| Base (unweighted) | 868 | 380 | 240 | 248 | 368 | 233 | 267 |
| 1 - Very difficult | 5% | 5% | 6% | 4% | 5% | 6% | 2% |
| 2 | 14% | 15% | 10% | 13% | 12% | 15% | 17% |
| 3 | 26% | 27% | 28% | 17% | 28% | 20% | 27% |
| 4 | 34% | 33% | 34% | 42% | 34% | 36% | 33% |
| 5 - Very straightforward | 19% | 18% | 21% | 21% | 18% | 21% | 19% |
| Don’t know | 2% | 2% | 1% | 2% | 3% | 2% | 2% |
Base: All who reported GPG on government portal
Submitting your results on the government portal
| Total | Sector: Private | Sector: Voluntary | Sector: Public | Size: 250 to 499 | Size: 500 to 999 | Size: 1,000 or more | |
| Base (unweighted) | 868 | 380 | 240 | 248 | 368 | 233 | 267 |
| 1 - Very difficult | 3% | 4% | 2% | 1% | 3% | 5% | 1% |
| 2 | 3% | 3% | 4% | 3% | 4% | 1% | 4% |
| 3 | 8% | 9% | 8% | 4% | 10% | 7% | 6% |
| 4 | 31% | 32% | 25% | 31% | 31% | 35% | 28% |
| 5 - Very straightforward | 50% | 47% | 57% | 59% | 48% | 48% | 54% |
| Don’t know | 4% | 5% | 4% | 3% | 4% | 3% | 7% |
Base: All who reported GPG on government portal
Deciding and agreeing how to explain your results in the narrative commentary
| Total | Sector: Private | Sector: Voluntary | Sector: Public | Size: 250 to 499 | Size: 500 to 999 | Size: 1,000 or more | |
| Base (unweighted) | 754 | 309 | 221 | 224 | 297 | 205 | 252 |
| 1 - Very difficult | 3% | 3% | 1% | 2% | 2% | 2% | 5% |
| 2 | 14% | 16% | 11% | 10% | 15% | 12% | 16% |
| 3 | 34% | 35% | 31% | 29% | 38% | 34% | 27% |
| 4 | 36% | 35% | 40% | 40% | 34% | 36% | 40% |
| 5 - Very straightforward | 9% | 7% | 14% | 14% | 8% | 13% | 7% |
| Don’t know | 4% | 4% | 3% | 5% | 3% | 4% | 5% |
Base: All who produced narrative commentary
9.24 B19a – Is there any specific support or guidance that was not available, but would have made the process easier for you?
| Total | Sector: Private | Sector: Voluntary | Sector: Public | Size: 250 to 499 | Size: 500 to 999 | Size: 1,000 or more | |
| Base (unweighted) | 868 | 380 | 240 | 248 | 368 | 233 | 267 |
| Yes | 33% | 33% | 34% | 31% | 31% | 28% | 40% |
| No | 64% | 64% | 64% | 66% | 65% | 70% | 58% |
| Don’t know | 3% | 3% | 2% | 3% | 4% | 2% | 2% |
Base: All who reported GPG on government portal
9.25 B19b – Please can you provide details of what other support would have helped? (unprompted)
| Total | Sector: Private | Sector: Voluntary | Sector: Public | Size: 250 to 499 | Size: 500 to 999 | Size: 1,000 or more | |
| Base (unweighted) | 868 | 380 | 240 | 248 | 368 | 233 | 267 |
| More/better guidance on how to calculate GPG results (inc. salary sacrifice, commission, contract staff, etc) | 9% | 8% | 14% | 10% | 9% | 9% | 11% |
| Easier to understand/more concise information/ guidance | 8% | 8% | 8% | 7% | 7% | 5% | 10% |
| Better communication | 4% | 4% | 3% | 5% | 4% | 4% | 5% |
| Helpline/point of contact/ adviser | 3% | 4% | 2% | 2% | 2% | 3% | 5% |
| More detailed/specific information/guidance | 2% | 3% | 1% | 3% | 2% | 3% | 3% |
| Support with portal/PIN | 2% | 2% | 0% | 1% | 2% | 1% | 3% |
| Case studies/examples/ benchmarks from other organisations | 1% | 1% | 3% | 3% | 1% | 1% | 3% |
| Sector specific guidance/ comparisons | 1% | 1% | 2% | 5% | 0% | 2% | 3% |
| More/better guidance on how to report/present data | 1% | 1% | 3% | 3% | 2% | 0% | 1% |
| More/better guidance on narrative commentary | 1% | 1% | 1% | 1% | 1% | 1% | 1% |
| Software/tools to calculate results/present data | 0% | 0% | 2% | 1% | 0% | 1% | 1% |
| Training/workshops/ seminars/webinars | 0% | 0% | 2% | 0% | 1% | 0% | 0% |
| Other | 4% | 4% | 3% | 3% | 6% | 2% | 3% |
| Did not feel that other support would have made the process easier | 67% | 67% | 66% | 69% | 69% | 72% | 60% |
Base: All who reported GPG on government portal
9.26 B20 – To what extent to you agree or disagree that the requirement to measure and report your GPG data has…?
Increased awareness of gender pay issues at board level
| Total | Sector: Private | Sector: Voluntary | Sector: Public | Size: 250 to 499 | Size: 500 to 999 | Size: 1,000 or more | |
| Base (unweighted) | 868 | 380 | 240 | 248 | 368 | 233 | 267 |
| Strongly agree | 24% | 22% | 31% | 28% | 17% | 23% | 36% |
| Agree | 45% | 44% | 43% | 52% | 47% | 41% | 46% |
| Neither agree nor disagree | 19% | 21% | 18% | 13% | 23% | 22% | 10% |
| Disagree | 6% | 7% | 5% | 6% | 8% | 7% | 3% |
| Strongly disagree | 4% | 5% | 2% | 1% | 3% | 5% | 4% |
| Don’t know | 1% | 1% | 1% | 0% | 1% | 2% | 0% |
Base: All who reported GPG on government portal
Prompted board level discussion or conversation about your GPG
| Total | Sector: Private | Sector: Voluntary | Sector: Public | Size: 250 to 499 | Size: 500 to 999 | Size: 1,000 or more | |
| Base (unweighted) | 868 | 380 | 240 | 248 | 368 | 233 | 267 |
| Strongly agree | 22% | 21% | 26% | 25% | 17% | 22% | 32% |
| Agree | 45% | 43% | 46% | 54% | 48% | 39% | 44% |
| Neither agree nor disagree | 13% | 14% | 10% | 10% | 13% | 15% | 11% |
| Disagree | 12% | 13% | 10% | 8% | 13% | 14% | 6% |
| Strongly disagree | 3% | 3% | 1% | 1% | 2% | 4% | 2% |
| Don’t know | 5% | 6% | 7% | 2% | 6% | 6% | 5% |
Base: All who reported GPG on government portal
Resulted in the board taking action to address your GPG
| Total | Sector: Private | Sector: Voluntary | Sector: Public | Size: 250 to 499 | Size: 500 to 999 | Size: 1,000 or more | |
| Base (unweighted) | 868 | 380 | 240 | 248 | 368 | 233 | 267 |
| Strongly agree | 12% | 12% | 14% | 12% | 10% | 11% | 18% |
| Agree | 34% | 33% | 34% | 38% | 28% | 37% | 41% |
| Neither agree nor disagree | 23% | 22% | 24% | 24% | 26% | 15% | 25% |
| Disagree | 20% | 20% | 19% | 19% | 23% | 24% | 8% |
| Strongly disagree | 6% | 6% | 2% | 3% | 6% | 8% | 3% |
| Don’t know | 6% | 7% | 7% | 4% | 8% | 5% | 5% |
Base: All who reported GPG on government portal
9.27 B22a – Which of the following best describes how your organisation has communicated its GPG results to clients, suppliers, investors and other external stakeholders? Have you…?
| Total | Sector: Private | Sector: Voluntary | Sector: Public | Size: 250 to 499 | Size: 500 to 999 | Size: 1,000 or more | |
| Base (unweighted) | 868 | 380 | 240 | 248 | 368 | 233 | 267 |
| Adopted a comprehensive and active engagement strategy | 5% | 4% | 5% | 5% | 3% | 3% | 9% |
| Drawn their attention to it but nothing further | 31% | 30% | 37% | 34% | 28% | 37% | 31% |
| Not done any promotion or engagement activity | 60% | 61% | 56% | 58% | 65% | 56% | 54% |
| Don’t know | 4% | 5% | 2% | 3% | 4% | 4% | 5% |
Base: All who reported GPG on government portal
9.28 B22b – And how have you communicated the results to your employees? Have you…?
| Total | Sector: Private | Sector: Voluntary | Sector: Public | Size: 250 to 499 | Size: 500 to 999 | Size: 1,000 or more | |
| Base (unweighted) | 868 | 380 | 240 | 248 | 368 | 233 | 267 |
| Adopted a comprehensive and active engagement strategy | 16% | 16% | 15% | 15% | 11% | 17% | 24% |
| Drawn their attention to it but nothing further | 50% | 46% | 63% | 60% | 50% | 49% | 51% |
| Not done any promotion or engagement activity | 32% | 36% | 20% | 22% | 36% | 34% | 23% |
| Don’t know | 2% | 2% | 2% | 2% | 3% | 1% | 1% |
Base: All who reported GPG on government portal
9.29 B22c – Thinking about the reaction to your organisation’s GPG results among your employees, would you say that…?
| Total | Sector: Private | Sector: Voluntary | Sector: Public | Size: 250 to 499 | Size: 500 to 999 | Size: 1,000 or more | |
| Base (unweighted) | 868 | 380 | 240 | 248 | 368 | 233 | 267 |
| There has been widespread reaction to them | 2% | 2% | 2% | 0% | 2% | 2% | 2% |
| Or, there has been some attention paid to them but not widespread | 17% | 16% | 21% | 18% | 16% | 15% | 21% |
| Or, there has been little or no reaction from our staff | 81% | 82% | 75% | 80% | 83% | 82% | 76% |
| Don’t know | 1% | 0% | 2% | 2% | 0% | 1% | 1% |
Base: All who reported GPG on government portal
C1 – How much of a priority to your organisation is reducing your GPG? Would you say it is…?
| Total | Sector: Private | Sector: Voluntary | Sector: Public | Size: 250 to 499 | Size: 500 to 999 | Size: 1,000 or more | |
| Base (unweighted) | 900 | 391 | 252 | 257 | 391 | 236 | 273 |
| A high priority | 23% | 22% | 30% | 22% | 18% | 24% | 32% |
| A medium priority | 45% | 45% | 44% | 48% | 43% | 46% | 49% |
| A low priority | 19% | 19% | 16% | 19% | 24% | 15% | 12% |
| Not a priority at all | 11% | 11% | 9% | 9% | 13% | 13% | 4% |
| Don’t know | 2% | 2% | 1% | 3% | 2% | 2% | 2% |
Base: All respondents
9.30 C1b – Has this changed since you’ve calculated your GPG results to meet the regulations?
| Total | Sector: Private | Sector: Voluntary | Sector: Public | Size: 250 to 499 | Size: 500 to 999 | Size: 1,000 or more | |
| Base (unweighted) | 900 | 391 | 252 | 257 | 391 | 236 | 273 |
| Yes, now a higher priority | 24% | 24% | 22% | 26% | 20% | 16% | 38% |
| Yes, now a lower priority | 1% | 1% | 0% | 1% | 1% | 2% | 0% |
| Not changed | 73% | 73% | 75% | 72% | 75% | 81% | 60% |
| Don’t know | 2% | 2% | 3% | 2% | 3% | 2% | 1% |
Base: All respondents
9.31 C2 – Why is reducing the gender pay gap (or ensuring you continue to have no GPG) a high priority for your organisation? (unprompted)
| Total | Sector: Private | Sector: Voluntary | Sector: Public | Size: 250 to 499 | Size: 500 to 999 | Size: 1,000 or more | |
| Base (unweighted) | 223 | 90 | 76 | 57 | 74 | 61 | 88 |
| Right thing to do / want to be fair/non-discriminatory | 51% | 52% | 54% | 43% | 45% | 62% | 49% |
| Important to our reputation (for example, image, attracting staff) | 20% | 19% | 24% | 23% | 22% | 11% | 25% |
| Important to address our GPG / working to reduce it | 18% | 19% | 13% | 23% | 18% | 19% | 19% |
| Important for us to provide equal pay/opportunities | 16% | 16% | 13% | 17% | 22% | 6% | 16% |
| Have a GPG/gender imbalance in workforce (or certain areas) | 11% | 13% | 5% | 13% | 6% | 16% | 15% |
| Legal requirement/regulation | 5% | 6% | 3% | 4% | 11% | 1% | 3% |
| Diversity is good for business (for example, profit, productivity) | 5% | 5% | 3% | 3% | 0% | 4% | 10% |
| Want to know reasons and address any issues | 3% | 3% | 3% | 5% | 2% | 6% | 2% |
| Publicity/attention about GPG | 3% | 3% | 1% | 5% | 3% | 4% | 3% |
| Senior management aware / made it a priority | 2% | 2% | 3% | 2% | 0% | 0% | 6% |
| Have a set pay scale/structure | 1% | 1% | 1% | 0% | 1% | 3% | 0% |
| Employ/pay based on ability, not gender or other factors | 0% | 0% | 1% | 0% | 0% | 1% | 0% |
| Wider social/cultural issue | 0% | 0% | 1% | 0% | 0% | 1% | 0% |
| Long term issue / will take time to solve | 0% | 0% | 0% | 2% | 0% | 1% | 0% |
| Other | 2% | 2% | 3% | 0% | 2% | 1% | 3% |
| Don’t know | 2% | 2% | 3% | 2% | 3% | 0% | 3% |
Base: All where reducing GPG is a high priority
9.32 C2 – Why is reducing the gender pay gap (or ensuring you continue to have no GPG) a medium priority for your organisation? (unprompted)
| Total | Sector: Private | Sector: Voluntary | Sector: Public | Size: 250 to 499 | Size: 500 to 999 | Size: 1,000 or more | |
| Base (unweighted) | 412 | 177 | 111 | 124 | 168 | 108 | 136 |
| Important to address our GPG / working to reduce it | 25% | 23% | 31% | 29% | 19% | 23% | 36% |
| Nothing/little we can do (nature of sector, few female applicants, etc) | 19% | 20% | 21% | 14% | 17% | 26% | 18% |
| Other more important priorities | 16% | 15% | 13% | 19% | 16% | 12% | 18% |
| Our GPG is small/not a big issue/has reduced | 15% | 15% | 15% | 15% | 20% | 12% | 10% |
| Right thing to do / want to be fair/ non-discriminatory | 8% | 6% | 12% | 14% | 9% | 7% | 8% |
| Don’t have a GPG | 6% | 7% | 4% | 1% | 5% | 8% | 6% |
| Important for us to provide equal pay/opportunities | 5% | 4% | 3% | 6% | 4% | 2% | 8% |
| Long term issue / will take time to solve | 4% | 4% | 4% | 4% | 5% | 5% | 3% |
| Important to our reputation (for example, image, attracting staff) | 4% | 5% | 3% | 2% | 4% | 3% | 4% |
| Have a GPG/gender imbalance in workforce (or certain areas) | 3% | 2% | 2% | 8% | 4% | 4% | 2% |
| Want to know reasons and address any issues | 3% | 3% | 1% | 5% | 2% | 7% | 2% |
| Employ/pay based on ability, not gender or other factors | 3% | 4% | 2% | 2% | 2% | 4% | 5% |
| All workers are paid equally regardless of gender | 3% | 4% | 1% | 1% | 1% | 6% | 3% |
| Publicity/attention about GPG | 3% | 3% | 4% | 2% | 3% | 4% | 0% |
| Don’t think the data gives full picture | 2% | 2% | 0% | 3% | 4% | 1% | 0% |
| Wider social/cultural issue | 2% | 2% | 2% | 2% | 2% | 0% | 3% |
| Have a set pay scale/structure | 2% | 1% | 6% | 3% | 1% | 1% | 2% |
| Legal requirement/regulation | 1% | 1% | 3% | 2% | 0% | 1% | 2% |
| Senior mgt aware/made it a priority | 1% | 1% | 3% | 1% | 2% | 1% | 0% |
| Senior mgt don’t see it as priority | 1% | 1% | 1% | 0% | 1% | 0% | 2% |
| Diversity is good for business (for example, profit, productivity) | 1% | 1% | 1% | 0% | 1% | 0% | 1% |
| Limited resources/time | 0% | 0% | 1% | 0% | 0% | 0% | 0% |
| Other | 2% | 2% | 2% | 2% | 0% | 4% | 3% |
| Don’t know | 3% | 4% | 2% | 2% | 3% | 3% | 4% |
Base: All where reducing GPG is a medium priority
9.33 C2 – Why is reducing the gender pay gap (or ensuring you continue to have no GPG) a low priority for your organisation? (unprompted)
| Total | Sector: Private | Sector: Voluntary | Sector: Public | Size: 250 to 499 | Size: 500 to 999 | Size: 1,000 or more | |
| Base (unweighted) | 160 | 72 | 40 | 48 | 90 | 37 | 33 |
| Our GPG is small/not a big issue/has reduced | 29% | 30% | 30% | 21% | 33% | 15% | 27% |
| Nothing/little we can do (nature of sector, few female applicants, etc) | 25% | 27% | 15% | 23% | 28% | 20% | 21% |
| Other more important priorities | 15% | 13% | 20% | 18% | 10% | 21% | 23% |
| All workers are paid equally regardless of gender | 12% | 13% | 5% | 8% | 9% | 16% | 17% |
| Employ/pay based on ability, not gender or other factors | 9% | 10% | 5% | 11% | 10% | 10% | 7% |
| Have a set pay scale/structure | 7% | 7% | 7% | 7% | 5% | 14% | 5% |
| Long term issue / will take time to solve | 6% | 6% | 0% | 10% | 6% | 7% | 3% |
| Don’t have a GPG | 6% | 7% | 0% | 5% | 8% | 5% | 0% |
| Important to address our GPG / working to reduce it | 4% | 4% | 2% | 4% | 4% | 3% | 5% |
| Wider social/cultural issue | 3% | 4% | 0% | 2% | 4% | 5% | 2% |
| Don’t think the data gives full picture | 3% | 2% | 2% | 8% | 1% | 1% | 12% |
| Don’t see it as important/ relevant | 2% | 2% | 5% | 4% | 2% | 1% | 5% |
| Limited resources/time | 1% | 0% | 5% | 2% | 0% | 1% | 3% |
| Senior management don’t see it as priority | 1% | 0% | 2% | 2% | 0% | 0% | 2% |
| Have a GPG/gender imbalance in workforce (or certain areas) | 0% | 0% | 2% | 0% | 0% | 0% | 0% |
| Other | 6% | 6% | 10% | 2% | 7% | 0% | 7% |
| Don’t know | 0% | 0% | 2% | 0% | 0% | 0% | 0% |
Base: All where reducing GPG is a low priority
9.34 C2 – Why is reducing the gender pay gap (or ensuring you continue to have no GPG) not a priority at all for your organisation? (unprompted)
| Total | Sector: Private | Sector: Voluntary | Sector: Public | Size: 250 to 499 | Size: 500 to 999 | Size: 1,000 or more | |
| Base (unweighted) | 87 | 44 | 22 | 21 | 52 | 25 | 10 |
| Nothing/little we can do (nature of sector, few female applicants, etc) | 34% | 33% | 23% | 52% | 30% | 41% | 40% |
| Our GPG is small/not a big issue/has reduced | 21% | 23% | 32% | 0% | 24% | 22% | 5% |
| Employ/pay based on ability, not gender or other factors | 17% | 19% | 9% | 10% | 9% | 33% | 15% |
| All workers are paid equally regardless of gender | 13% | 13% | 18% | 14% | 22% | 1% | 0% |
| Don’t see it as important/ relevant | 12% | 14% | 0% | 10% | 15% | 10% | 0% |
| Other more important priorities | 8% | 9% | 9% | 4% | 4% | 12% | 20% |
| Have a set pay scale/structure | 5% | 3% | 14% | 14% | 7% | 3% | 0% |
| Don’t have a GPG | 4% | 5% | 9% | 0% | 5% | 5% | 0% |
| Don’t think the data gives full picture | 3% | 2% | 0% | 10% | 2% | 0% | 15% |
| Senior management don’t see it as a priority | 2% | 3% | 5% | 0% | 3% | 0% | 5% |
| Long term issue / will take time to solve | 1% | 0% | 9% | 0% | 2% | 0% | 0% |
| Other | 1% | 0% | 0% | 5% | 1% | 0% | 0% |
| Don’t know | 2% | 2% | 0% | 0% | 0% | 0% | 15% |
Base: All where reducing GPG is not a priority at all
9.35 C12 – Has your organisation tried to identify or diagnose the underlying causes of your gender pay gap?
| Total | Sector: Private | Sector: Voluntary | Sector: Public | Size: 250 to 499 | Size: 500 to 999 | Size: 1,000 or more | |
| Base (unweighted) | 576 | 246 | 129 | 201 | 226 | 156 | 194 |
| Yes | 76% | 74% | 86% | 79% | 73% | 77% | 82% |
| No | 23% | 25% | 14% | 18% | 27% | 23% | 17% |
| Don’t know | 1% | 0% | 0% | 2% | 0% | 1% | 2% |
Base: All with a GPG
9.36 C3 – Which of the following best describes your organisation’s current approach to reducing your GPG?
| Total | Sector: Private | Sector: Voluntary | Sector: Public | Size: 250 to 499 | Size: 500 to 999 | Size: 1,000 or more | |
| Base (unweighted) | 576 | 246 | 129 | 201 | 226 | 156 | 194 |
| You have developed a formalised plan or strategy and undertaken some or all of the specified actions | 16% | 15% | 16% | 18% | 13% | 12% | 25% |
| You have developed a formalised plan or strategy that includes specific actions, but have not yet implemented them | 18% | 17% | 20% | 24% | 15% | 17% | 26% |
| You intend to take action but have not yet developed any specific plans | 33% | 32% | 32% | 36% | 34% | 35% | 28% |
| You have no plans to take any action | 30% | 33% | 28% | 17% | 34% | 35% | 17% |
| Don’t know | 3% | 3% | 4% | 4% | 4% | 1% | 4% |
Base: All respondents
9.37 C4 – And have you or do you intend to publish an action plan for how you will try and reduce (or maintain) your GPG?
| Total | Sector: Private | Sector: Voluntary | Sector: Public | Size: 250 to 499 | Size: 500 to 999 | Size: 1,000 or more | |
| Base (unweighted) | 576 | 246 | 129 | 201 | 226 | 156 | 194 |
| Yes, publish it externally (for example, in annual report, on website, etc.) | 3% | 2% | 6% | 9% | 2% | 4% | 6% |
| Yes, publish it internally (for example, on intranet, staff newsletter, etc.) | 14% | 14% | 17% | 14% | 14% | 13% | 17% |
| Yes, both externally and internally | 13% | 10% | 14% | 24% | 9% | 10% | 21% |
| No | 26% | 27% | 24% | 20% | 26% | 27% | 23% |
| Don’t know | 11% | 11% | 7% | 11% | 11% | 9% | 11% |
| Not taken or intending to take action | 33% | 36% | 32% | 21% | 38% | 36% | 22% |
Base: All respondents
9.38 C5 – Still thinking about the formalised GPG plan or strategy that you have developed, which of the following specific actions or measures does it include?
| Total | Sector: Private | Sector: Voluntary | Sector: Public | Size: 250 to 499 | Size: 500 to 999 | Size: 1,000 or more | |
| Base (unweighted) | 328 | 126 | 91 | 111 | 107 | 78 | 143 |
| Offering/promoting flexible working arrangements | 87% | 88% | 86% | 85% | 84% | 93% | 87% |
| Promoting parental leave policies that encourage men and women to share childcare | 76% | 77% | 76% | 74% | 73% | 84% | 76% |
| Making cultural changes within your organisation | 65% | 65% | 63% | 63% | 53% | 67% | 75% |
| Gender-specific recruitment, promotion or mentoring schemes | 62% | 62% | 57% | 65% | 60% | 57% | 67% |
| Voluntary internal targets | 33% | 36% | 23% | 28% | 26% | 39% | 36% |
| Other: Auditing/reviewing pay structure, process, job roles, etc | 5% | 2% | 13% | 10% | 5% | 3% | 6% |
| Other: Other initiatives (for example, returner programmes, graduate schemes, bursaries) | 4% | 4% | 1% | 9% | 2% | 5% | 6% |
| Other: Training/education | 4% | 4% | 1% | 6% | 0% | 7% | 7% |
| Other: Improved recruitment approach | 4% | 5% | 0% | 3% | 2% | 5% | 6% |
| Other: Changes to pay structure | 4% | 3% | 3% | 8% | 4% | 2% | 4% |
| Other: Links/partnerships/ promotion with other organisations (for example, schools, STEM organisations) | 4% | 5% | 0% | 3% | 2% | 6% | 4% |
| Other: Some other actions | 7% | 7% | 6% | 5% | 8% | 5% | 6% |
| Don’t know | 3% | 2% | 2% | 4% | 3% | 4% | 2% |
Base: All that have developed a formalised GPG strategy
9.39 C7 – Will the impact of these actions be evaluated as part of a formalised process or on a more ad hoc basis?
| Total | Sector: Private | Sector: Voluntary | Sector: Public | Size: 250 to 499 | Size: 500 to 999 | Size: 1,000 or more | |
| Base (unweighted) | 149 | 60 | 41 | 48 | 51 | 35 | 63 |
| Formalised process - at least annually | 72% | 74% | 51% | 79% | 59% | 89% | 75% |
| Formalised process - less often | 1% | 0% | 2% | 2% | 0% | 2% | 1% |
| On an ad hoc/ less formal basis | 25% | 25% | 39% | 15% | 38% | 8% | 20% |
| Do not plan to evaluate their impact | 1% | 0% | 2% | 4% | 1% | 2% | 1% |
| Don’t know | 2% | 2% | 5% | 0% | 2% | 0% | 3% |
Base: All that have developed a formalised GPG strategy and undertaken some of the specified actions
9.40 C8 – And have you already evaluated the current impact of these actions?
| Total | Sector: Private | Sector: Voluntary | Sector: Public | Size: 250 to 499 | Size: 500 to 999 | Size: 1,000 or more | |
| Base (unweighted) | 149 | 60 | 41 | 48 | 51 | 35 | 63 |
| Yes | 26% | 24% | 29% | 31% | 20% | 34% | 29% |
| No | 66% | 67% | 64% | 63% | 71% | 65% | 62% |
| Don’t know | 5% | 7% | 0% | 2% | 7% | 0% | 6% |
| Do not plan to evaluate impact/ Don’t know if will | 3% | 2% | 7% | 4% | 2% | 2% | 3% |
Base: All that have developed a formalised GPG strategy and undertaken some of the specified actions
C9 – How successful do you think these actions have been to date? Would you say…?
| Total | Sector: Private | Sector: Voluntary | Sector: Public | Size: 250 to 499 | Size: 500 to 999 | Size: 1,000 or more | |
| Base (unweighted) | 149 | 60 | 41 | 48 | 51 | 35 | 63 |
| Very successful | 6% | 4% | 12% | 12% | 10% | 5% | 3% |
| Fairly successful | 52% | 57% | 37% | 44% | 41% | 56% | 61% |
| Neither successful nor unsuccessful | 24% | 23% | 37% | 20% | 34% | 18% | 18% |
| Fairly unsuccessful | 4% | 6% | 0% | 0% | 10% | 0% | 0% |
| Very unsuccessful | 0% | 0% | 0% | 0% | 0% | 0% | 0% |
| Too early to say | 13% | 11% | 12% | 23% | 4% | 19% | 18% |
| Don’t know | 0% | 0% | 2% | 0% | 0% | 2% | 0% |
Base: All that have developed a formalised GPG strategy and undertaken some of the specified actions
9.41 F1 – Are you aware that, going forwards, large employers will be required to report their GPG results every year?
| Total | Sector: Private | Sector: Voluntary | Sector: Public | Size: 250 to 499 | Size: 500 to 999 | Size: 1,000 or more | |
| Base (unweighted) | 900 | 391 | 252 | 257 | 391 | 236 | 273 |
| Yes | 99% | 98% | 100% | 99% | 98% | 100% | 99% |
| No | 1% | 2% | 0% | 1% | 2% | 0% | 1% |
Base: All respondents
9.42 F2 – The regulations will require large <private / voluntary / public> sector employers to next publish their gender pay data by the <4th April 2019 / 30th March 2019>. When does your organisation intend to publish its results on the official government portal?
| Total | Sector: Private | Sector: Voluntary | Sector: Public | Size: 250 to 499 | Size: 500 to 999 | Size: 1,000 or more | |
| Base (unweighted) | 900 | 391 | 252 | 257 | 391 | 236 | 273 |
| Already published (April to June 2018) | 1% | 1% | 1% | 1% | 1% | 0% | 2% |
| July to September 2018 | 5% | 4% | 6% | 4% | 5% | 4% | 3% |
| October to- December 2018 | 16% | 15% | 19% | 18% | 14% | 15% | 22% |
| January to April 2019 (or January to March 2019 for public sector) | 61% | 63% | 57% | 58% | 67% | 65% | 48% |
| Have not yet decided when you will publish the results | 15% | 15% | 14% | 16% | 11% | 15% | 21% |
| Don’t intend to publish results | 1% | 1% | 2% | 0% | 1% | 0% | 0% |
| Don’t know | 2% | 2% | 2% | 3% | 2% | 1% | 4% |
Base: All respondents
9.43 F3 – Why does your organisation not intend to publish its GPG data this time? (unprompted)
| Total | Sector: Private | Sector: Voluntary | Sector: Public | Size: 250 to 499 | Size: 500 to 999 | Size: 1,000 or more | |
| Base (unweighted) | 7 | 2 | 4 | 1 | 5 | 0 | 2 |
| Not required to - Had less than 250 employees at snapshot date | 78% | 100% | 24% | 100% | 92% | 0% | 0% |
| Not required to - University, etc subject to Scottish/Welsh specific duties | 22% | 0% | 76% | 0% | 8% | 0% | 100% |
Base: All not intending to publish in 2018/19
9.44 F4 – Thinking about the metrics that employers currently have to report, how useful do you think each of the following are?
Differences in mean and median hourly rate
| Total | Sector: Private | Sector: Voluntary | Sector: Public | Size: 250 to 499 | Size: 500 to 999 | Size: 1,000 or more | |
| Base (unweighted) | 900 | 391 | 252 | 257 | 391 | 236 | 273 |
| Very useful | 15% | 13% | 23% | 19% | 13% | 15% | 19% |
| Fairly useful | 51% | 51% | 48% | 55% | 50% | 50% | 54% |
| Not very useful | 23% | 24% | 20% | 21% | 25% | 27% | 17% |
| Not at all useful | 8% | 9% | 8% | 5% | 9% | 7% | 8% |
| Don’t know | 3% | 3% | 2% | 1% | 3% | 1% | 3% |
Base: All respondents
Proportion of women in each pay quartile
| Total | Sector: Private | Sector: Voluntary | Sector: Public | Size: 250 to 499 | Size: 500 to 999 | Size: 1,000 or more | |
| Base (unweighted) | 900 | 391 | 252 | 257 | 391 | 236 | 273 |
| Very useful | 33% | 29% | 43% | 45% | 30% | 28% | 44% |
| Fairly useful | 50% | 53% | 43% | 44% | 51% | 53% | 47% |
| Not very useful | 10% | 10% | 9% | 9% | 12% | 13% | 4% |
| Not at all useful | 5% | 5% | 3% | 2% | 5% | 5% | 3% |
| Don’t know | 2% | 2% | 2% | 0% | 2% | 1% | 1% |
Base: All respondents
Proportion of women and men paid bonuses
| Total | Sector: Private | Sector: Voluntary | Sector: Public | Size: 250 to 499 | Size: 500 to 999 | Size: 1,000 or more | |
| Base (unweighted) | 900 | 391 | 252 | 257 | 391 | 236 | 273 |
| Very useful | 22% | 23% | 14% | 23% | 18% | 24% | 28% |
| Fairly useful | 34% | 40% | 15% | 21% | 36% | 33% | 33% |
| Not very useful | 19% | 20% | 16% | 17% | 20% | 18% | 18% |
| Not at all useful | 19% | 13% | 41% | 32% | 20% | 20% | 17% |
| Don’t know | 6% | 4% | 14% | 8% | 7% | 5% | 4% |
Base: All respondents
Differences in mean and median bonus pay
| Total | Sector: Private | Sector: Voluntary | Sector: Public | Size: 250 to 499 | Size: 500 to 999 | Size: 1,000 or more | |
| Base (unweighted) | 900 | 391 | 252 | 257 | 391 | 236 | 273 |
| Very useful | 15% | 16% | 13% | 15% | 12% | 15% | 22% |
| Fairly useful | 36% | 41% | 18% | 27% | 36% | 38% | 35% |
| Not very useful | 22% | 24% | 15% | 18% | 21% | 21% | 24% |
| Not at all useful | 20% | 15% | 41% | 32% | 22% | 21% | 16% |
| Don’t know | 6% | 4% | 14% | 8% | 8% | 5% | 5% |
Base: All respondents
9.45 F5a – Do you think there are any other metrics that employers should be required to report, in addition to the current ones?
| Total | Sector: Private | Sector: Voluntary | Sector: Public | Size: 250 to 499 | Size: 500 to 999 | Size: 1,000 or more | |
| Base (unweighted) | 900 | 391 | 252 | 257 | 391 | 236 | 273 |
| Yes | 23% | 23% | 25% | 24% | 21% | 21% | 29% |
| No | 75% | 75% | 74% | 76% | 76% | 78% | 70% |
| Don’t know | 2% | 3% | 1% | 0% | 3% | 2% | 1% |
Base: All respondents
9.46 F5b – Which other metrics do you think would be useful? (unprompted)
| Total | Sector: Private | Sector: Voluntary | Sector: Public | Size: 250 to 499 | Size: 500 to 999 | Size: 1,000 or more | |
| Base (unweighted) | 900 | 391 | 252 | 257 | 391 | 236 | 273 |
| Comparing across job roles (for example, dept, seniority, contract/permanent) | 7% | 7% | 6% | 7% | 6% | 6% | 7% |
| Full and part time split between men and women | 4% | 4% | 7% | 6% | 4% | 4% | 6% |
| Overall number or proportion of men and women employed | 4% | 4% | 3% | 4% | 4% | 3% | 4% |
| Equal pay data | 2% | 2% | 2% | 3% | 3% | 3% | 1% |
| Other protected characteristics (for example, ethnicity, disability, age) | 2% | 1% | 3% | 5% | 1% | 2% | 4% |
| Staff profile information (for example, gender split at board level/by % promoted etc) | 1% | 1% | 4% | 2% | 1% | 2% | 2% |
| Sector/industry (with benchmark comparisons) | 1% | 2% | 1% | 1% | 2% | 2% | 0% |
| More detail on bonuses/benefits | 1% | 1% | 1% | 0% | 1% | 1% | 2% |
| Differences in total/basic pay (as opposed to hourly pay) | 1% | 1% | 0% | 1% | 0% | 0% | 2% |
| More detail on hourly rates (comparisons) | 0% | 0% | 2% | 0% | 0% | 1% | 0% |
| Trend/longer term data (for example, comparisons with previous years, longer snapshots) | 0% | 0% | 2% | 0% | 0% | 0% | 1% |
| Other | 3% | 3% | 3% | 2% | 3% | 2% | 4% |
| Don’t know | 1% | 1% | 0% | 0% | 1% | 1% | 1% |
| Did not feel employers should be required to report other metrics | 77% | 77% | 75% | 76% | 79% | 79% | 71% |
Base: All respondents
9.47 SIC classification (IDBR data) - Private sector only
| Total | Size: 250 to 499 | Size: 500 to 999 | Size: 1,000 and above | |
| Base (unweighted) | 391 | 178 | 112 | 101 |
| A - Agriculture, forestry and fishing | 1% | 1% | 1% | 2% |
| B - Mining and quarrying | 1% | 1% | 1% | 0% |
| C - Manufacturing | 18% | 20% | 14% | 18% |
| D - Electricity, gas and air conditioning supply | 1% | 1% | 0% | 1% |
| E - Water supply, sewerage, waste management and remediation activities | 1% | 1% | 2% | 1% |
| F - Construction | 4% | 5% | 4% | 3% |
| G - Wholesale and retail trade, repair of motor vehicles and motorcycles | 15% | 13% | 15% | 19% |
| H - Transportation and storage | 5% | 6% | 4% | 5% |
| I - Accommodation and food service activities | 9% | 11% | 8% | 5% |
| J - Information and communication | 5% | 4% | 5% | 5% |
| K - Financial and insurance activities | 5% | 4% | 4% | 7% |
| L - Real estate activities | 2% | 2% | 3% | 0% |
| M - Professional, scientific and technical activities | 8% | 9% | 7% | 5% |
| N - Administrative and support service activities | 15% | 11% | 18% | 19% |
| P - Education | 2% | 2% | 4% | 0% |
| Q - Human health and social work activities | 6% | 6% | 5% | 8% |
| R - Arts, entertainment and recreation | 3% | 3% | 4% | 3% |
| S - Other service actitivities | 1% | 1% | 2% | 0% |
Base: All private sector organisations
9.48 Government Office Region (IDBR data)
| Total | Sector: Private | Sector: Voluntary | Sector: Public | Size: 250 to 499 | Size: 500 to 999 | Size: 1,000 or more | |
| Base (unweighted) | 900 | 391 | 252 | 257 | 391 | 236 | 273 |
| East Midlands | 5% | 4% | 3% | 8% | 6% | 3% | 4% |
| East of England | 9% | 8% | 6% | 12% | 8% | 8% | 9% |
| London | 17% | 17% | 19% | 11% | 18% | 13% | 18% |
| North East | 4% | 4% | 4% | 7% | 4% | 6% | 3% |
| North West | 11% | 11% | 10% | 12% | 12% | 9% | 10% |
| South East | 17% | 17% | 19% | 16% | 15% | 20% | 17% |
| South West | 12% | 12% | 10% | 11% | 13% | 15% | 7% |
| West Midlands | 9% | 9% | 6% | 11% | 8% | 7% | 12% |
| Yorkshire and Humberside | 7% | 6% | 8% | 11% | 5% | 9% | 8% |
| Scotland | 8% | 8% | 11% | 1%[footnote 28] | 7% | 7% | 9% |
| Wales | 3% | 4% | 4% | 0% | 3% | 3% | 3% |
Base: All respondents
-
‘The Equality Act 2010 (Gender Pay Gap Information) Regulations 2017’ for the private/voluntary sector and ‘The Equality Act 2010 (Specific Duties and Public Authorities) Regulations 2017’ for the public sector. ↩
-
Gender pay gap: employers’ action and understanding - GOV.UK ↩
-
The snapshot date for public sector organisations was 31 March 2017. ↩
-
Although GEO data shows 100% compliance, 4 survey respondents indicated that they had not published their data because they were unaware of the requirement to do so. This group was likely to either have been out of scope at the snapshot date or to have subsequently published after the date they were interviewed (the survey started in July whereas GEO reported 100% compliance on 1st August). ↩
-
Gender Pay Gap Information Regulations: summary of 2017/18 data - GOV.UK ↩
-
This is self-reported survey data on the content of employers’ narrative commentaries, but there was no verification of the quality of these commentaries or the actions they included. ↩
-
The survey asked respondents to provide details of their median GPG. However, this data is self-reported and respondents were not asked to look up the exa.ct figure during the telephone interview. As such, it may not always match the figure published on the GPG portal. ↩
-
The 1% that were unaware of the future reporting requirements were typically smaller, in the private sector, and had lower than average understanding of the GPG. ↩
-
The 2018 survey was conducted after the ‘snapshot’ date on which employers are required to base their calculations for the second year of GPG reporting. ↩
-
The median is used for the headline GPG figure, although the mean is also used in some cases. The median is the mid-point value and hence represents the typical GPG, whereas the mean represents the average value. The mean can be skewed by small numbers of very high values, so the median is used for the headline figure. ↩
-
Based on Office for National Statistics analysis of median earnings for all employees (full and part time): Gender pay gap in the UK: 2018 ↩
-
Employers must publish their data on their own public-facing website and on the government portal: Gender pay gap reporting: guidance for employers - GOV.UK ↩
-
Gender pay gap: employers’ action and understanding - GOV.UK ↩
-
However, the sample did include voluntary sector organisations in Scotland and Wales and a small number of these (for example, universities) explained in the interviews that they were subject to Scottish/Welsh specific duties and therefore not subject to these regulations. ↩
-
Calculated at the 95% level of confidence and showing the ‘worst case’ scenario of 50% of the sample answering in the same way. ↩
-
Employers were allocated to an engagement band based on their responses to the following 2 questions in the quantitative survey: “Which of the following best describes your organisation’s current approach to reducing your GPG?” and “How much of a priority to your organisation is reducing your GPG?” ↩
-
Strictly speaking, calculations of statistical significance apply only to samples that have been selected using a probability sampling design. However, in practice it is reasonable to assume that these calculations provide a good indication of significant differences for quota sampling (as used for this research). ↩
-
The Year 1 GPG snapshot date was 5th April 2017 for private/voluntary sector employers and 31st March 2017 for public sector employers. The survey sample consisted of employers identified by the ONS as having 250+ employees as of June 2018 (with this confirmed at the start of the interview). As a result, the ONS data included some organisations that reached the 250 employee threshold after the snapshot date. Furthermore, there may be differences in how employer size is defined by ONS and how it is defined for the purposes of ascertaining whether an employer is subject to the GPG regulations. ↩
-
While public sector organisations in Scotland and Wales were excluded from the sample as they are not subject to the GPG transparency regulations, the sample did include voluntary sector organisations in Scotland and Wales. A small number of these (for example, universities) explained that they were governed by different Scottish/Welsh specific duties and therefore not subject to these regulations. ↩
-
Gender Pay Gap Information Regulations: summary of 2017/18 data - GOV.UK ↩
-
The survey also collected data on each employer’s median GPG to allow comparative analysis of the other survey questions by size of GPG (self-reported). ↩
-
Those employers that did not have a GPG were asked to rate the priority of ensuring they continued to have no GPG in future. ↩
-
The Year 2 GPG snapshot date was 5th April 2018 for private/voluntary sector employers and 31st March 2018 for public sector employers. The survey sample consisted of employers identified by the ONS as having 250+ employees as of June 2018 (with this confirmed at the start of the interview). As a result, the ONS data could have included some employers that reached the 250 employee threshold after the snapshot date. Furthermore, there may be differences in how employer size is defined by ONS and how it is defined for the purposes of ascertaining whether an employer is subject to the GPG regulations. ↩
-
Refer to Chapter 2.2, Table 1 ↩
-
All public sector organisations in Scotland and Wales were excluded from the initial sample. However, 4 organisations based in Scotland self-classified themselves as public sector during the interview. ↩