Claimant experience of telephone-based health assessments for PIP, ESA and UC
Updated 8 February 2022
Applies to England, Scotland and Wales

© Crown copyright 2022
This publication is licensed under the terms of the Open Government Licence v3.0 except where otherwise stated. To view this licence, visit nationalarchives.gov.uk/doc/open-government-licence/version/3 or write to the Information Policy Team, The National Archives, Kew, London TW9 4DU, or email: psi@nationalarchives.gov.uk.
Where we have identified any third party copyright information you will need to obtain permission from the copyright holders concerned.
This publication is available at https://www.gov.uk/government/publications/claimant-experience-of-telephone-based-health-assessments-for-pip-esa-and-uc/claimant-experience-of-telephone-based-health-assessments-for-pip-esa-and-uc
DWP research report no. 999
A report of research carried out by NatCen Social Research on behalf of the Department for Work and Pensions.
Anna Marcinkiewicz
Georgia Lucey
Crescenzo Pinto
Isabel Taylor
Bea Taylor
Sarah Cheesbrough
Crown copyright 2021.
You may re-use this information (not including logos) free of charge in any format or medium, under the terms of the Open Government Licence or write to:
Information Policy Team
The National Archives
Kew
London
TW9 4DU
Email: psi@nationalarchives.gov.uk
This document/publication is also available on our website.
If you would like to know more about DWP research, email socialresearch@dwp.gov.uk
First published July 2021.
ISBN 978-1-78659-333-7
Views expressed in this report are not necessarily those of the Department for Work and Pensions or any other government department.
Executive summary
Following the restrictions required due to the COVID-19 pandemic, the usual face-to-face health and disability benefit assessments were suspended and replaced with telephone assessments. The Department for Work and Pensions (DWP) commissioned NatCen Social Research to conduct two surveys to examine the claimant experience of telephone assessments and to gauge preferences for using telephone, face-to-face or video for assessment on an ongoing basis.
This report presents the key findings from the surveys of claimants who took part in a telephone health assessment as part of their benefit claim for Personal Independence Payment, Universal Credit (UC) or Employment Support Allowance (ESA). The first survey comprised Personal Independence Payment (PIP) claimants who underwent a telephone assessment to determine their eligibility for the benefit. The second survey was of Universal Credit (UC) or Employment Support Allowance (ESA) claimants who underwent a telephone Work Capability Assessment to assess whether they should be considered able to undergo any work-related activity. Telephone interviews were conducted with 837 claimants of PIP and 1146 ESA or UC claimants between April and October 2020.
PIP telephone assessments
Nearly two thirds (64 per cent) of PIP claimants were making a new claim for PIP with the remainder undergoing a claim reassessment (where the claimant has migrated from DLA), a planned intervention (where DWP has scheduled a review of the claim) or unplanned intervention (as a result of a change of circumstances such as change in health). Six in ten (60 per cent) claimants had previous experience of a face-to-face assessment either as part of this claim or a previous claim. At the time of extracting the survey sample, just over half (51 per cent) had been awarded PIP, 34 per cent had been disallowed and a further 16 per cent had no outcome to date, although some of this latter group may have been informed of a decision by the time of their survey interview. We refer to this group as the “unknown outcome” group within the rest of the report.
Communication and support before the assessment
Nearly all (90 per cent of) claimants recalled receiving a communication before the appointment giving details of the assessment, typically in a letter or phone call. Over four out of five (83 per cent) of these claimants found it helpful. Over half (58 per cent) did not think any more information was necessary but over one in four (28 per cent) said they would have liked more information about what would be covered. Those who had no previous experience of a face-to-face assessment or who had been disallowed PIP were more likely to say they would have liked more information.
Nearly half (47 per cent) of claimants drew on additional support or information before the assessment beyond DWP or the assessment provider. Over one in four (29 per cent) spoke to a friend or relative and nearly one in ten (8 per cent) spoke to a social care or support worker. Men and claimants aged under 35 were more likely to seek additional support. Claimants who had been disallowed PIP were slightly less likely to have sought support.
Experience of the assessment
Over four in five (83 per cent of) claimants experienced no technical difficulties during the call. Those that did tended to report difficulties hearing or being heard over bad lines or the lines cutting out. Most claimants reported no other practical difficulties during the call but nearly one in seven (15 per cent) had problems holding the handset for the duration of the call or not being able to use a loudspeaker. These tended to be older claimants and those with mobility issues. Seven per cent of claimants said they found the assessment tiring or needed to take breaks.
Nearly two thirds of claimants (63 per cent) were aware that they could have a third person present on the call for support. Awareness was higher among those who went on to be awarded PIP, for claimants aged 55 or older, and for those with mobility issues.
Nearly one third of claimants (31 per cent) were joined by someone to support them on the call, most commonly a family member (24 per cent). Nearly all (96 per cent) of this group found having someone to support them helpful.
Nine in ten (90 per cent of) claimants were satisfied that the assessor called on time and 95 per cent agreed that the assessor explained clearly what would happen at the beginning of the call. Over three out of four (78 per cent) also agreed that the assessor listened to them and made sure they understood what the claimant was saying. Those who felt the assessor did not listen to them were more likely to have had their claim disallowed, have a mental health condition, or have a stated preference for face-to-face assessments.
Explaining and discussing condition
Just over three quarters (76 per cent) of claimants agreed that they were able to explain to the assessor how their condition affected their daily life. Claimants who had their claim awarded or said they preferred telephone health assessments were most likely to agree with this statement. Of those who did not feel they were able to explain the impact of their condition fully, nearly half (45 per cent) felt that the assessor was not listening, seemed uninterested or was not showing understanding of their condition.
Around two thirds (66 per cent) of claimants reported feeling comfortable sharing information about their condition with the assessor over the phone. Claimants with mental health conditions and those whose claim was disallowed were less likely to feel comfortable. Discussing mental and physical health were the most commonly reported difficult topics of the assessment.
Overall satisfaction
In total, three quarters of PIP claimants (75 per cent) were satisfied with how the telephone assessment was conducted. Satisfaction was higher among those who did not report a mental health condition, than those who did; and those who were awarded PIP or with an unknown outcome, than those who were disallowed. Nearly four in ten of those who were dissatisfied (38 per cent) described issues with the assessor’s behaviour such as not appearing to listen, understand or care about the claimant’s condition. Other reasons included wanting face-to-face contact (24 per cent), questions not being tailored to claimants’ circumstances (21 per cent) or general discomfort or emotional difficulties undergoing the assessment (19 per cent).
Preference for assessment channels – telephone or face-to-face
Claimants were first asked, if given a choice and assuming government advice allowed, they would prefer a telephone or face-to-face assessment in the future. In total, 45 per cent of claimants said they would prefer telephone and 42 per cent face-to-face. Others had no strong preference. Those who were awarded PIP were more likely to favour telephone (62 per cent) than those with an unknown outcome (49 per cent) and those who were disallowed (18 per cent). Those undergoing a reassessment were most likely to prefer a telephone assessment (62 per cent) than those submitting a new claim (41 per cent). Reasons for preferring a telephone assessment included finding it easier/more comfortable, not needing to travel and it feeling less stressful.
Those who preferred a face-to-face assessment reported a range of reasons, the most common being that they would be better able to explain their condition, would find it easier/more comfortable to speak to someone in person, could communicate more easily and build rapport with the assessor.
Above we describe how claimants with certain characteristics were more or less likely to prefer a particular assessment channel, for example those disallowed PIP were less likely to prefer telephone assessments. However, this type of analysis does not let us take into account how this relationship might be influenced by other, covarying factors. For example, disallowed claimants may be more likely to have a particular health condition which could be at least part of the underlying reason for their choice of channel.
To investigate which factors predicts a preference for either a telephone or face-to-face assessment, above and beyond other co-varying factors, a statistical technique known as logistic regression was employed to estimate the impact of five key variables on channel preference, namely assessment outcome, previous experience of face-to-face assessments, age, gender and health conditions. This approach allows us to estimate the relationship between each of these five variables on channel preference, while controlling for the other four factors. Here, only the PIP assessment outcome was a statistically significant predictor of channel preference. Namely, claimants with a PIP award were more likely to prefer telephone over a face-to-face assessment even after controlling for other factors likely to influence choice.
Preference for assessment channels – video
The survey then went on to discuss video calls as an option. Almost two thirds (63 per cent) of claimants had experience of a video call with rates higher among younger claimants. Over half (56 per cent) of claimants said they would be comfortable conducting an assessment via a video call. The most common reasons for feeling comfortable with this assessment mode included being able to see the assessor whilst staying at home and being able to give visual evidence of health conditions. Reasons given for not being comfortable with a video assessment included:
- a dislike of video calls
- not wanting to be on camera
- feeling nervous or anxious
- not knowing how to use the technology
Those with mental health conditions who were not comfortable with a video call were more likely to say it would make them nervous or anxious.
When then asked which of the three channels they would prefer for an assessment, 15 per cent of claimants changed their preference to a video call. Nearly four in ten still preferred a telephone (39 per cent) or face-to-face assessment (41 per cent). Those who changed their preference to video call tended to have previously opted for telephone assessments or had no preference. Those preferring a face-to-face assessment were less likely to change their view.
Logistic regression was also conducted to model claimants’ preference when choosing across the three assessment channels, using the same key variables as above. As with the regression analysis for claimant preference between two channels, only the assessment outcome was a significant predictor of claimants’ preference from a choice of three channels. Namely, claimants with an assessment award were more likely to prefer telephone over face-to-face assessments. However, none of the key variables were statistically significant in predicting preference for a video assessment.
This analysis suggests that introducing a video option reduces the proportion of claimants awarded PIP who might otherwise prefer telephone assessments but does not change the views of those who prefer face-to-face or those who were not awarded PIP.
Suggestions for improvement
When asked if anything could have improved their experience of the assessment, around half of claimants (51 per cent) did not feel any changes were necessary. Of those who made suggestions one in ten (10 per cent of) claimants stated that the assessment needed to be face-to-face and 8 per cent asked for more information prior to the call. Others mentioned improvements in the assessor’s behaviour, needing to talk to someone who understood their condition or having someone to support them on the call.
Work capability telephone assessments
Two thirds (66 per cent) of claimants undergoing work capability telephone assessments were making a new claim while the remainder were taking part in a reassessment. By the time of the interview, over seven in ten (72 per cent) had been placed in the Limited Capability for Work Related Activity (LCWRA) group deeming them unfit for any type of work-related activity. The remainder were placed in a group awaiting a further assessment via face-to-face (to take place once the COVID-19 easements allowed) to confirm whether they were able to undertake some work-related activities. This group are referred to as “awaiting further assessment” throughout the report. Eight in ten (80 per cent) of claimants recalled previously experiencing a face-to-face assessment, particularly if they were taking part in a reassessment (96 per cent), but also those submitting a new claim (64 per cent).
Communication and support before the assessment
Most claimants (89 per cent) recalled receiving a communication before the assessment giving them details of what to expect, most commonly a letter or phone call. Nearly all (90 per cent) who recalled a communication found it helpful and 70 per cent of all claimants felt that no further information was necessary prior to the assessment. However, about one in five (21 per cent) said they would have liked more information about what would be covered. New claimants were more likely to say they would have liked more information. Also, those who had been awaiting further assessment were more likely to say they would like more information than those who had been placed in the LCWRA group.
Nearly one in three (32 per cent) of claimants drew on additional support or information before the assessment beyond DWP or the assessment provider. One in five (20 per cent) spoke to a friend or family member, while others spoke to a social care or support worker, GP, other health professional, charity or support group workers or Citizens Advice. Claimants who had gone on to be placed in the LCWRA group and those undergoing a reassessment were more likely to have sought support.
Experience of the assessment
Just over one in ten of claimants (11 per cent) made at least one adjustment request before the interview, such as planning breaks, spreading the assessment over a number of calls or receiving information in large text or braille. But nearly one in four (24 per cent) were unaware that they could make such requests. For the most commonly requested adjustment of having breaks, the assessment provider was able to make the adjustment in 93 per cent of cases.
Most claimants (87 per cent) experienced no technical difficulties during the call. Those that did tended to have problems hearing the assessor or being heard due to bad lines or lines cutting out. Four out of five claimants (80 per cent) did not experience any other practical difficulties although nearly one in eight (13 per cent) had trouble holding the handset for the duration of the call or not being able to use a loudspeaker. Claimants more likely to report this problem included those who were placed in the LCWRA group, than those who were awaiting further assessment; and those with mobility issues, than those without.
Third person support
Nearly two thirds of claimants (65 per cent) were aware that they could have a third person present on the call for support. Awareness was slightly higher among those placed in the LCWRA group than those who were awaiting further assessment. Additionally, claimants who reported mobility conditions were more likely to know they could have support in this way than those without mobility conditions.
Around one in five (22 per cent) of claimants were joined by someone to support them on the call, most commonly a family member (18 per cent). Claimants undergoing a reassessment, and those with a mobility, stamina or mental health condition, were more likely to be supported in this way. Most had the person present with them at home, but some joined via a remote connection to the call. Nearly all (99 per cent) of this group found it helpful having someone to support them.
Over nine in ten (93 per cent of) claimants were satisfied that the assessor called on time and 98 per cent agreed that the assessor explained clearly what would happen at the beginning of the call. Similarly, 97 per cent agreed that the assessor listened to them and made sure they understood what the claimant was saying.
Explaining and discussing condition
Most (95 per cent) claimants agreed that they were able to explain to the assessor how their condition affected their daily life. Those who were awaiting further assessment or had a stated preference for face-to-face assessments were less likely to feel they were able to explain (91 per cent and 86 per cent respectively). The small number who felt they were not able to explain their condition were most likely to say they felt that the assessor was not listening, that the questions were not appropriate, or they needed to be face-to-face with the assessor to explain their condition properly.
Claimants were generally comfortable (79 per cent) sharing information about their condition with the assessor over the phone. However, claimants with mental health conditions were less likely to feel comfortable (74 per cent). Older claimants were more comfortable (82 per cent of those aged 55 or older) than younger claimants (72 per cent of those aged under 35).
Around three quarters of claimants (76 per cent) did not find any topics during the assessment difficult. Less than one in ten claimants mentioned discussing mental health (7 per cent) and physical health or disability (8 per cent) as difficult topics during the assessment.
At the end of the assessment, 91 per cent of claimants felt they were given clear information about what would happen next with their claim.
Overall satisfaction
In total, 94 per cent of claimants were satisfied with how the telephone assessment was conducted. Satisfaction was highest among those placed in the LCWRA group, those with mobility conditions, and those who said they preferred telephone assessments over face-to-face. The small group who were not satisfied tended to have complaints about the assessor’s behaviour, having insufficient time to answer the questions or not feeling that the questions were tailored to their condition.
Preference for assessment channels
When asked initially for their choice between telephone or face-to-face assessments in the future, over six in ten (62 per cent of) claimants would prefer a telephone assessment, with nearly one in four (23 per cent) wanting face-to-face. The remainder had no preference. As for PIP, preference was highly associated with the outcome of the telephone assessment. Seventy per cent of those placed in the LCWRA group stated a preference for telephone compared to 42 per cent of those awaiting further assessment. Those undergoing a reassessment, women, and those with mental health conditions were also more likely to favour telephone assessments.
Those preferring a telephone assessment most commonly cited not needing to travel as a reason for their choice, as well as finding telephone assessments easier or more comfortable or less stressful. The most common reasons among those who preferred a face-to-face assessment included feeling that they would be better able to explain their condition, finding it easier or more comfortable to speak to someone in person, communicating more easily and being able to build rapport with the assessor.
Above we describe how claimants with certain characteristics were more or less likely to prefer a particular assessment channel. However, as described above, this type of analysis does not let us take into account how this relationship might be influenced by other, co-varying factors. For example, LCWRA claimants may be more likely to have a particular health condition which could be the underlying reason for their choice of channel.
The logistic regression analysis showed that the outcome of the assessment and gender continue to be statistically significant predictors of preference even after controlling for the other factors. In particular, claimants placed in the LCWRA group had a strong preference for telephone (over face-to-face) after taking their other characteristics into account.
Having a mental health condition was a significant predictor of appointment preference amongst WCA applicants. Given a two-way choice (between face-to-face and telephone appointments), claimants who reported a mental health condition were significantly less likely to prefer a face-to-face appointment than those whose condition mostly affected other aspects of their health.
Women had a strong preference for telephone assessments over face-to-face even after controlling for other characteristics. Men were also more likely to prefer a telephone assessment, but not to the same extent as women.
Preference for assessment channels – video
Over six in ten claimants (62 per cent) had experience of a video call. Rates were higher among younger claimants. Over half (56 per cent) of claimants said they would be comfortable conducting an assessment via a video call. Reasons given for feeling comfortable with a video call included being able to see the assessor whilst staying at home and being able to give visual evidence of health conditions. Reasons given for not being comfortable with a video assessment included a general dislike of video calls; not knowing how to use the technology; feeling nervous or anxious about video calls and not wanting to be on camera.
When then asked which of the three channels a claimant would prefer for an assessment, 13 per cent of claimants selected a video call. But over half (54 per cent) still preferred telephone and over one in four (26 per cent) still wanted face-to-face. Claimants who had initially opted for face-to-face over telephone were least likely to change their view at this stage.
Again, logistic regression was used to understand better the factors that explain claimants’ preference for each of the three assessment channels over the other channels or having no preference. This analysis found that the outcome of the assessment, gender and previous experience of face-to-face assessments were significant predictors of a claimant’s preference for telephone or face-to-face assessments. Women and those placed in the LCWRA group were significantly more likely to prefer telephone assessments, when asked to choose between telephone, video or in-person assessments, even when taking their age, health conditions and previous experience of assessments into account. When all other relevant variables were controlled for, those awaiting an assessment were equally likely to prefer either telephone or face-to-face assessments. Those with previous experience of a face-to-face assessment were also slightly more likely to prefer telephone than face-to-face. Only one variable – whether or not the claimant reported a mental health condition – was significantly associated with a claimant preferring a video assessment in this model. Those with a mental health condition were significantly less likely to state a preference for video.
Suggestions for improvement
When asked if anything could have improved their experience of the assessment nearly three quarters (72 per cent) of claimants did not feel any changes were necessary. Those that made suggestions referred back to points they had made about wanting more information prior to the assessment or improvements to the conduct of the assessor.
List of abbreviations
| Term | Definition |
|---|---|
| AP | Assessment provider |
| CAB | Citizens Advice Bureau |
| DWP | Department for Work and Pensions |
| ESA | Employment and Support Allowance |
| JCP | Jobcentre Plus |
| LCW | Limited Capability for Work Group |
| LCWRA | Limited Capability for Work and Work-Related Activity Group |
| PIP | Personal Independence Payment |
| UC | Universal Credit |
| WCA | Work Capability Assessment |
| WRAG | Work-Related Activity Group |
1. Introduction
Prior to the COVID-19 pandemic, individuals in the UK claiming Personal Independence Payment (PIP), Universal Credit (UC) or Employment Support Allowance (ESA), due to their health condition or disability were required to undergo a face-to-face assessment to provide evidence towards their claim if a benefit decision could not be made via a paper-based assessment (where a benefit decision is made based on information provided on-line and via the post only). The PIP assessment considers the claimant’s ability to carry out activities and how their condition affects their daily life. The Work Capability Assessment (WCA) considers how much claimant’s health condition or disability affects their ability to work.
Since the introduction of the COVID-19 lockdown measures in March 2020, the usual face-to-face assessments were temporarily suspended and replaced with telephone assessments. The Department for Work and Pensions (DWP) commissioned the National Centre for Social Research (NatCen) to explore how the new format of telephone assessments were experienced by claimants. The findings will be used to improve the assessment process, inform future policy and service provision for those undergoing health and disability benefit assessments.
Research aims
The aims of the research were to explore claimants’:
- views of the telephone assessment process
- preferences in relation to the mode of assessment
- suggestions for improvements to the telephone assessment process
1.1. Overview of the benefit processes
PIP medical assessment
PIP is a benefit for people with a long-term health condition or disability. It is paid to make a contribution to the extra costs that people may face because of their condition or disability to help them lead independent lives. PIP can be paid to those who are in and out of work and is not dependent on a person’s financial status or National Insurance contributions.
PIP has two components - daily living (contribution to the extra costs disabled people face in their day to day lives that do not relate to mobility) and mobility (contribution to the extra costs disabled people face in their day to day lives that relate to mobility).
When making a claim for PIP, individuals make an initial call to provide DWP with initial information and complete a questionnaire detailing how their condition affects them. Once the questionnaire is returned to DWP, the claimant is referred for an assessment with an assessment provider (AP) if a decision cannot be made via a paper-based review. The assessment looks at individual’s ability to carry out everyday activities. The assessments previously took place face-to-face and due to COVID-19 pandemic have recently moved to telephone.
Work capability assessment
Individuals who are out of work or on a low income can claim financial support from DWP. The out-of-work benefit those who have a health condition and/or disability that restricts their ability to work comes in the form of either ESA or UC. ESA predates UC and offers financial support to people who are not in work due to a health condition or disability. UC was introduced in 2013 in an attempt to simplify the welfare system, gradually replacing six previous means-tested benefits and tax credits, including ESA.
All individuals who apply for either ESA or UC due to a health condition and/or disability complete a capability for work questionnaire and provide medical evidence as part of their claim. Some will then be asked to complete a WCA, to further measure the extent to which illness or disability affects their ability to work.
Following the assessment, claimants are placed in one of three benefit groups depending on their condition impact severity, who receive differing benefit amounts and level of support accordingly:
- Work-Related Activity Group (WRAG) for ESA claimants; Limited Capability for Work group (LCW) for UC claimants – when the claimant’s ability to work is reduced by their health condition and/or disability to an extent where it is not a reasonable requirement for them to work, but they are able to undertake work-related activities and required to attend regular interviews with a work coach.
- Support Group (SG) for ESA claimants; Limited Capability for Work Related Activity (LCWRA) for UC claimants – claimants are placed in this group when their ability to work is severely limited, to the point where they are not required to work or to undertake any work-related activities.
Fit for Work – claimants placed in this group are required to look for work that is suitable for their health condition and be prepared to work to retain their access to benefit. The work coach will take into account the claimant’s health condition or disability when considering what work-related activities and availability for work are included in the Claimant Commitment.
1.2. Methods
This report is based on data from two telephone surveys conducted between July and October 2020.
The PIP survey was conducted between 14th July – 2nd August 2020 with new and repeat claimants who had taken part in a telephone assessment for PIP between April and May 2020. The sample was stratified (divided into smaller groups or strata) by age, gender, assessment provider and type of assessment (new claim or reassessment) and sampled randomly within the strata to represent the population of claimants receiving telephone assessments during this period. All interviews were conducted via telephone and lasted around 25 minutes. The survey used quotas to meet required number of interviews by key variables (age, gender and assessment provider). The final achieved number of interviews was 837. The data was weighted to be representative of age, gender, type of assessment and assessment provider.
The WCA survey was conducted in two waves between 18th August –11th October 2020, with new and repeat claimants who had a WCA telephone assessment between May and July 2020. The sample was again stratified by age, gender and assessment outcome drawn randomly within strata to represent the population of claimants receiving telephone assessments during this period. All interviews were conducted via telephone and lasted around 25 minutes. The number of achieved interviews was 1146. The survey also set quotas for the number of interviews required by key variables (age, gender and the outcome of the assessment). The data was weighted to be representative of age, gender, type of assessment and assessment outcome.
Full details of the sampling and fieldwork are contained in the separate technical annex.
Interpreting quantitative findings
The findings are based on frequencies and cross-tabulations of questions included in both surveys. This report explores if, and how, experiences and views of claimants differ by a range of factors including age, gender, type of assessment, as well as self-reported health status and previous experience of face-to-face assessments. All percentages cited in this report are based on the weighted data and are rounded to the nearest whole number. Weighting refers to statistical adjustments that are made to survey data after they have been collected in order to improve the accuracy of the survey estimates.
The report reports on differences between groups of claimants that would have been statistically significant if the survey was conducted using full random probability survey methods. The threshold was set at the 95 per cent level of statistical significance, meaning we can be 95 per cent sure that any difference we find in the survey data represents a difference in the claimant population. All figures presented in the report include valid percentages excluding ‘don’t know’ and ‘refused’ responses.
Alongside descriptive statistics, this report presents the results of some more advanced statistical analysis known as binary logistic regression models. This analysis was used to explore how individual characteristics impact claimants’ likelihood of preferring different assessment channels. Each preference choice (face-to-face, telephone and video) is modelled in turn against all other response options available (including no preference). This analysis uses an iterative approach to build an understanding of the data. Adding variables relating to a claimants’ assessment experience, demographics and health conditions in different stages allows us to observe the influence of each variable independent of the other variables- on our outcome of interest, namely their choice of assessment channels.
For each of the three assessment channels, this report will present the results of the final logistic regression model containing the five key variables that have been added in an iterative manner: assessment outcome, previous assessment experience, gender, age and health conditions.
Models were also estimated where the relationship between claimants’ gender and claimants’ previous assessment experience were allowed to vary between different age groups. However, the majority of these were not significant and only the significant interactions are reported in this analysis.
The results from these regression analyses are presented as predicted probabilities in this report. A predicted probability is the average estimated likelihood of claimants preferring an assessment channel (over all other available options) based on the variables included in these models. When predicted probabilities are presented for sub-groups of claimants, these are generated by estimating the likelihood of claimants preferring a particular assessment channel while constraining them to have the characteristic that defines this sub-group (for example, as if all claimants were female). This allows us to compare how likely individuals are to favour each assessment channel depending on differences in one particular variable of interest, while holding the other factors in the model constant.
2. Personal Independence Payment (PIP) telephone assessments
The survey sample comprised 837 claimants who had recently undergone a telephone health assessment as part of their claim for PIP. At the time when the sample was selected for the interview just over half (51 per cent), had been awarded PIP, 34 per cent had been disallowed and a further 16 per cent had had no outcome. As noted previously, some of this latter group may have received a decision on their assessment by the time of the survey interview. This group is referred to as the unknown outcome group.
Clearly the outcome of the claim may affect a participant’s retrospective views on the experience and the type of assessment they would prefer. Any reported differences in opinion by claim outcome should therefore be interpreted with this in mind. A multivariate analysis of the key drivers of preference for either a telephone, face-to-face or video assessment are presented in the Section on Preference for Assessment Channels.
2.1. Communication and support before the assessment
Preparation for the telephone health assessment
According to DWP records, nearly two thirds (64 per cent) of claimants surveyed were making a new claim for PIP. For 18 per cent this was a planned intervention (review of an on-going claim scheduled by DWP), for 12 per cent an unplanned intervention (because of a change in circumstances in an on-going claim) and for 6 per cent a reassessment of cases that were being migrated from DLA to PIP
Figure 1: Type of assessment
| Assessment type | Percentage |
|---|---|
| First PIP claim | 64% |
| Planned intervention | 18% |
| Unplanned intervention | 12% |
| Reassessment | 6% |
Unweighted base: Claimant sample records (n=837).
The most common way new claimants had first heard about PIP was from a friend or a relative (39 per cent), as well as from a health worker (19 per cent) or JobCentre Plus (14 per cent).
Figure 2: How new claimants first heard about PIP
| Source | Percentage |
|---|---|
| Friend or relative | 39% |
| Health worker | 19% |
| JCP | 14% |
| Care worker | 8% |
| Other | 7% |
| Charity or support group | 7% |
| CAB | 7% |
| DWP or GOV.UK | 5% |
| Work | 4% |
| PIP letter | 3% |
| Social media | 3% |
| Local authority | 2% |
Unweighted base: All first time PIP claimants (n=438).
Note: Some claimants provided multiple responses.
Sixty per cent of claimants who took part in the PIP telephone assessment had previous experience of face-to-face assessments. Notably, two fifths (41 per cent) of new PIP claimants reported to have had face-to-face assessments for health-related benefits in the past. Claimants who were awarded PIP were more likely to have previously attended a face-to-face assessment for a previous claim (57 per cent) than those who were disallowed PIP (47 per cent).
Figure 3: Whether previous experience of a face-to-face assessment by claim status
| Claim status | Percentage |
|---|---|
| Unplanned intervention | 99% |
| Planned intervention | 93% |
| Reassessment | 74% |
| New claim | 41% |
Unweighted base: All claimants with an unplanned intervention (n=124), planned intervention (n=129), reassessment (n=44) or making a new claim (n=539).
Information received prior to the assessment
In preparation for the assessment, 90 per cent of claimants recalled receiving information telling them what to expect. Most commonly this was in a letter (71 per cent), and nearly one in four claimants (24 per cent) reported receiving a telephone call.
Figure 4: Type of communication received prior to the assessment
| Communication type | Percentage |
|---|---|
| Letter | 71% |
| Telephone call | 24% |
| Text message | 13% |
| None/Don’t know/Can’t remember | 10% |
| Leaflet | 4% |
| Other | 3% |
| 2% |
Unweighted base: All claimants (n=837).
Note: Some claimants provided multiple responses.
Over four out of five (83 per cent) of claimants who recalled receiving information prior to their assessment found it ‘somewhat’ or ‘very’ helpful. Men were more likely to report that they found the information helpful (87 per cent) than women (81 per cent). Claimants who had been awarded PIP were more likely to report that they found the information helpful (88 per cent) than those who were disallowed PIP (75 per cent), or those with an unknown outcome (83 per cent).
Claimants who recalled receiving communication were asked whether any other information would have been helpful prior to the assessment. Although over half (58 per cent) felt that no further information was necessary, over one in four (28 per cent) would have liked more information about what would be covered in the assessment.
Figure 5: Other information that would have been helpful prior to the assessment
| Information type | Percentage |
|---|---|
| No other information necessary | 58% |
| More information about what would be covered | 28% |
| Other | 11% |
| How long the assessment would take | 4% |
| That a third person could be present | 2% |
Unweighted base: All claimants who recalled receiving information prior to their assessment (n=728).
Note: Some claimants provided multiple responses.
Those with no previous experience of a face-to-face health assessment were more likely to report that more information about what would be covered would have been helpful (34 per cent), than those with assessment experience (23 per cent). Similarly, those who had been disallowed PIP were more likely to say that they would have liked more information about what to expect (40 per cent) than those who were awarded PIP (22 per cent), or those with an unknown outcome (20 per cent).
Other support ahead of the assessment
In addition to information from DWP or the assessment provider, over one in four (29 per cent) claimants spoke to a friend or relative. Claimants also consulted a social worker or support worker (8 per cent); a GP or other health professional (5 per cent), a charity or support group (4 per cent); or Citizens Advice (3 per cent). However, over half (53 per cent) did not seek any additional support.
Figure 6: Other support received before the assessment
| Support type | Percentage |
|---|---|
| No support received | 53% |
| Friend or relative | 29% |
| Social care or support worker | 8% |
| Someone else | 6% |
| GP or other health professional | 5% |
| Charity or support group | 4% |
| CAB | 3% |
Unweighted base: All claimants (n=834).
Note: Some claimants provided multiple responses.
Claimants in older age groups were less likely to seek additional support than younger groups (40 per cent of those aged 55 or older, compared to 61 per cent of those aged under 35). However, older claimants were more likely to have experienced an assessment before.
Furthermore, men were more likely to seek additional support (52 per cent) than women (44 per cent). Those who had PIP awarded or had an unknown outcome at the time of the survey were more likely to have received additional support (50 and 48 per cent respectively) than those who were disallowed PIP (44 per cent). Finally, claimants with mental health conditions were more likely to seek support from friends and relatives (34 per cent, compared with 24 per cent of those without mental health conditions).
2.2. Experience of the assessment
Difficulties during the call
Eighty-three per cent of claimants experienced no technical issues during the call. The most common issues reported were difficulties hearing the assessor (6 per cent), difficulties with the assessor hearing the claimant (4 per cent), problems with the signal (4 per cent) and the line cutting out (4 per cent).
Figure 7: Whether experienced any technical issues during the call
| Technical issue | Percentage |
|---|---|
| None | 83% |
| Hearing issues: Claimant hearing assessor | 6% |
| Disconnection/Line cut | 4% |
| Hearing issues: Assessor hearing claimant | 4% |
| Signal problems | 4% |
| General issues with hearing | 1% |
| Other | 1% |
| Background noise from assessor | 1% |
Unweighted base: All claimants (n=832).
Note: Some claimants provided multiple responses.
Claimants were also asked whether they experienced any other practical difficulties during the call. Over two thirds (68 per cent) did not report any other difficulties. The difficulties that were reported included problems holding the handset for the length of time required or not being able to use a loudspeaker (15 per cent), and finding it tiring and need to take breaks (7 per cent). Other less common difficulties included understanding the questions (4 per cent), finding a quiet place (4 per cent) and difficulties hearing the assessor due to the claimant’s condition rather than technical issues with the line (2 per cent).
Figure 8: Whether experienced other difficulties
| Difficulty experienced | Percentage |
|---|---|
| No other difficulties | 68% |
| Holding phone/No loudspeaker | 15% |
| It was tiring/Needed to take a break | 7% |
| Understanding and answering the questions | 4% |
| Other difficulties but not related to taking the call | 4% |
| No quiet place | 4% |
| Hearing due to condition | 2% |
| Other | 2% |
Unweighted base: All claimants (n=833).
Note: Some claimants provided multiple responses.
Older claimants were more likely to report difficulties holding a handset or using a loudspeaker (19 per cent of those 55 years and over, compared to 10 per cent of those aged under 35), and those with mobility issues (20 per cent compared, with 8 per cent of those with no mobility issues). Women were also more likely to report practical difficulties (36 per cent, compared to 26 per cent of men).
Third person support
Claimants taking part in PIP assessments had the option to have someone else join the call to provide them with support. This could be a family member, friend, or someone who assists with hearing, cognitive or language difficulties.
Around two thirds of claimants (63 per cent) were aware they could be joined by another person. Claimants who were awarded PIP were more likely to be aware (70 per cent) than those who were disallowed PIP (51 per cent). Similarly, awareness was higher among older claimants (69 per cent of those aged 55 and over, compared to 57 per cent of under 35-year-olds), and for those with mobility issues (65 per cent, compared 57 per cent of those with no mobility issues).
Nearly one third (31 per cent) of claimants were joined by another person during the assessment, most commonly by a family member (24 per cent). Eighty-nine per cent had the other person join from the same location, for 11 per cent the person joined the call remotely from a different location.
Figure 9: Whether claimants received third person support
| Support type | Percentage |
|---|---|
| No assistance on call | 69% |
| Family member | 24% |
| Other | 2% |
| Support worker | 2% |
| Friend | 2% |
| Language interpreter | 1% |
Unweighted base: All claimants (n=837).
Ninety-six per cent of those who had a third person on the call with them found their presence ‘somewhat helpful’ or ‘very helpful’.
Figure 10: Whether claimants found the third person helpful
| Was support helpful | Percentage |
|---|---|
| Very helpful | 79% |
| Somewhat helpful | 17% |
| Not helpful | 4% |
Unweighted base: Claimants who had third person support during the call (n=257).
Feedback on the assessor
Nine in ten claimants (90 per cent) reported that ‘the assessor called on time’.
Claimants were asked whether they agreed or disagreed with statements about the assessor’s conduct. Ninety-five per cent agreed that ‘the assessor explained clearly at the beginning what would happen during the call’ and 78 per cent agreed that ‘the assessor listened to me and made sure they understood what I was saying’.
Figure 11: Whether claimants agreed that the assessor provided a clear explanation and listened to/understood the claimant
| Assessor feedback | Strongly agree | Agree | Disagree | Strongly disagree |
|---|---|---|---|---|
| Assessor provided a clear explanation | 48% | 47% | 4% | 1% |
| Assessor listened to and understood claimant | 41% | 37% | 12% | 10% |
Unweighted base: All claimants (Whether the assessor provided clear explanation n=822) (Whether assessor listened and understood claimant n=823).
Those who were awarded PIP tended to express higher levels of agreement with the two statements. For example, those awarded the benefit or with an unknown outcome were more likely to agree that the assessor listened to them and understood them (90 per cent and 83 per cent respectively), compared to those who were disallowed PIP (59 per cent). Additionally, claimants who did not report mental health conditions were more likely to agree that the assessor listened to them and understood them (81 per cent) than those with mental health conditions (74 per cent).
Views on the assessor were also highly associated with the claimants’ stated preference for assessment mode. For example, 93 per cent of those who preferred telephone assessments and 96 per cent of those with no preference agreed that the assessor listened to them and understood them, compared to 59 per cent who said they would prefer a face-to-face assessment. However, as we examine later, preferences for the mode of assessment were also highly associated with the outcome of the claim.
Explaining and discussing condition
Just over three quarters of claimants (76 per cent) ‘agreed’ or ‘strongly agreed’ with the statement that they were able to explain during the assessment how their health condition or disability affects their daily life.
Figure 12: Whether claimants agreed that they were able to explain how their condition or disability affects their daily life
| Claimant able to explain how condition affects daily life | Percentage |
|---|---|
| Strongly agree | 39% |
| Agree | 37% |
| Disagree | 16% |
| Strongly disagree | 8% |
Unweighted base: All claimants (n=819).
Those who had their PIP claim awarded and those with an unknown outcome were more likely to agree that they were able to explain how their condition affects them than those who had their claim disallowed (87 per cent and 81 per cent respectively, compared to 58 per cent). Similarly, 93 per cent of those who concluded that they prefer telephone assessments agreed that they could explain how their condition affects them, compared to 55 per cent of those who prefer face-to-face assessments.
Of those who did not feel able to explain how their health condition affects their daily life, 45 per cent felt that the assessor did not listen, seemed uninterested or was not understanding of the claimant’s condition or situation. Nearly one third of this sub-group (31 per cent) felt they were just unable to fully explain the impact over the telephone and needed face-to-face contact. About one in eight (16 per cent) had issues with the type of questions or how they were asked.
Figure 13: Reasons for not being able to explain condition affects
| Reason | Percentage |
|---|---|
| Issues with assessor | 45% |
| Could not explain condition over the phone | 31% |
| Issues with questions | 16% |
| Other | 15% |
| Time limitations | 5% |
| Health condition prevented them from doing so | 5% |
| Technical issues during the call | 3% |
Unweighted base: Claimants who felt they could not explain their condition only (n=186).
Note: Some claimants provided multiple responses. Coded open text question.
Around two thirds of claimants (66 per cent) reported feeling ‘comfortable’ or ‘very comfortable’ sharing information about their health condition or disability over the telephone.
Figure 14: Whether claimants felt comfortable sharing information over the telephone
| Sharing information over telephone | Percentage |
|---|---|
| Very comfortable | 24% |
| Comfortable | 42% |
| Uncomfortable | 23% |
| Very uncomfortable | 11% |
Unweighted base: All claimants (n=830).
Claimants who did not report mental health conditions were more likely to feel comfortable sharing information about their condition (76 per cent) than those with mental health conditions (55 per cent). Additionally, individuals who had their PIP claim awarded reported feeling more comfortable sharing information (73 per cent), than those who were awaiting their claim outcome or had their claim disallowed (66 per cent and 57 per cent respectively).
Claimants were asked whether there were any topics in relation to their condition that they found difficult to talk about over the telephone. Around six in ten claimants (59 per cent) reported no difficult topics. The most common topic that claimants felt was difficult to discuss was their mental health (14 per cent), followed by claimants’ physical health or disability (11 per cent). Nine per cent of claimants also reported having a general discomfort discussing information over the telephone but identified no specific topic.
Figure 15: Issues claimants found difficult to explain on the telephone
| Topic | Percentage |
|---|---|
| No difficult topics | 59% |
| Mental health | 14% |
| Physical health/Disability | 11% |
| Generally uncomfortable discussing over phone | 9% |
| Other | 7% |
| Toileting | 6% |
| Washing and dressing | 3% |
| Childcare and family | 2% |
| Mobility | 1% |
| Effects on concentration | 1% |
Unweighted base: All claimants (n=823)
Note: Some claimants provided multiple responses.
2.3. Overall satisfaction
Three quarters of claimants (75 per cent) reported being ‘satisfied’ or ‘very satisfied’ with their experience of how the telephone assessment was conducted.
Figure 16: Whether satisfied with how the telephone assessment was conducted
| Satisfaction with telephone assessment | Percentage |
|---|---|
| Very satisfied | 37% |
| Satisfied | 38% |
| Dissatisfied | 14% |
| Very dissatisfied | 12% |
Unweighted base: All claimants (n=831).
Claimants whose PIP claim had been awarded and those awaiting their claim outcome were more satisfied with the assessment than those whose claim was disallowed (88 per cent and 79 per cent respectively, compared to 51 per cent). Those who said they prefer telephone assessments were also more likely to be satisfied with the assessment (94 per cent, compared to 49 per cent of those who prefer face-to-face assessments). Furthermore, claimants who did not report mental health conditions were more likely to be satisfied with their assessment (78 per cent), than those with mental health conditions (69 per cent).
Of the 25 per cent of claimants who said they were dissatisfied with the assessment, the most commonly reported feedback was dissatisfaction with the assessor’s behaviour (38 per cent), including the assessor not appearing to listen, understand or was perceived to be unhelpful or uncaring. This type of response was more common for women (41 per cent) than men (31 per cent).
Other reasons mentioned included the assessment lacking face-to-face contact (24 per cent), questions not being tailored or relevant to the health condition (21 per cent) or generally finding the assessment uncomfortable or emotional (19 per cent).
Figure 17: Reasons for dissatisfaction with telephone assessment
| Reason for dissatisfaction | Percentage |
|---|---|
| Issues with assessors behaviour | 38% |
| Needed face-to-face contact | 24% |
| Questions were not relevant | 21% |
| General discomfort/Emotional difficulties | 19% |
| Insufficient time | 13% |
| Assessor should understand the condition | 12% |
| Other | 9% |
| Length of assessment | 7% |
| Supporting evidence not used or considered | 4% |
| Technical issues | 3% |
| Would prefer a medical professional | 2% |
Unweighted base: Claimants who were not satisfied with the assessment (n=183).
Note: Some claimants provided multiple responses. Coded open text question.
2.4. Preference for assessment channels
Preference for telephone or face-to-face assessments
Claimants were asked whether they would prefer a telephone or face-to-face assessment in the future, assuming that the government advice would allow them to do so. A similar proportion of claimants expressed a preference for telephone assessments (45 per cent) as face-to-face assessments (42 per cent). Around one in ten (13 per cent) said they had no preference.
Figure 18: Preference for telephone or face-to-face assessment
| Preference | Percentage |
|---|---|
| Telephone | 45% |
| Face-to-face | 42% |
| No preference | 13% |
Unweighted base: All claimants (n=827).
Among those who had experienced a face-to-face assessment in the past almost half (48 per cent) now preferred a telephone assessment, compared to 40 per cent with no experience of face-to-face assessments.
Six in ten (62 per cent) of those who were undergoing a reassessment expressed a preference for telephone assessments compared to around four in ten (41 per cent) of those with a new claim. Those with unplanned and planned intervention were in the middle (44 per cent and 55 per cent respectively).
Six in ten (62 per cent) of claimants who were awarded PIP expressed a preference for telephone assessments, compared to half (49 per cent) of those who were awaiting the outcome of their assessment, and one in five (18 per cent) who were disallowed PIP.
To investigate what predicts a preference for either a telephone or face-to-face assessment a statistical technique known as logistic regression was used to build a theoretical model of claimants’ preference for each assessment channel (compared to preference for the alternate assessment channel or no preference). These models focussed on five key claimant characteristics, namely the assessment outcome, their previous experience of face-to-face assessments, age, gender and health conditions as predictor variables. This analysis provides an estimate of the relationship between each of these variables and a claimant’s assessment preference, while controlling for the other variables included in these models.
This allows us to adjust our estimate of the relationship between our variable of interest and a respondent’s channel preference to ensure that this relationship is not driven by differences in the other variables included in the model. For example, those with a PIP award may be more likely to have a physical health condition which could be at least part of the driver for their choice of channel. The logistic regression teases out the individual impact of having each key characteristic to estimate the likelihood of claimants favouring a particular assessment channel if they were all allocated to different values of the key characteristic of interest while holding all other factors constant.
For example, we can estimate the average likelihood of all claimants preferring telephone assessments firstly as if all claimants were male and then estimate this again as if all claimants are female, while keeping all the other variables in the model at the values reported by respondents in the survey. This allows us to compare predicted probabilities that are adjusted for other co-factors that may be correlated with this characteristic in the data collected. So for example we can estimate the impact of PIP award on channel choice independent of co-factors such as age and health. These predicted probabilities may therefore differ from the percentages presented in the section above, depending on the extent to which the co-varying factors influence the relationship between the key characteristic of interest and a claimant’s channel preference.
In these models, the claimant’s PIP assessment outcome remained a significant predictor of channel preference even after controlling for all the other variables in the model. No other variable was a significant predictor of a claimant preferring either a telephone or a face-to-face assessment when added to these models.
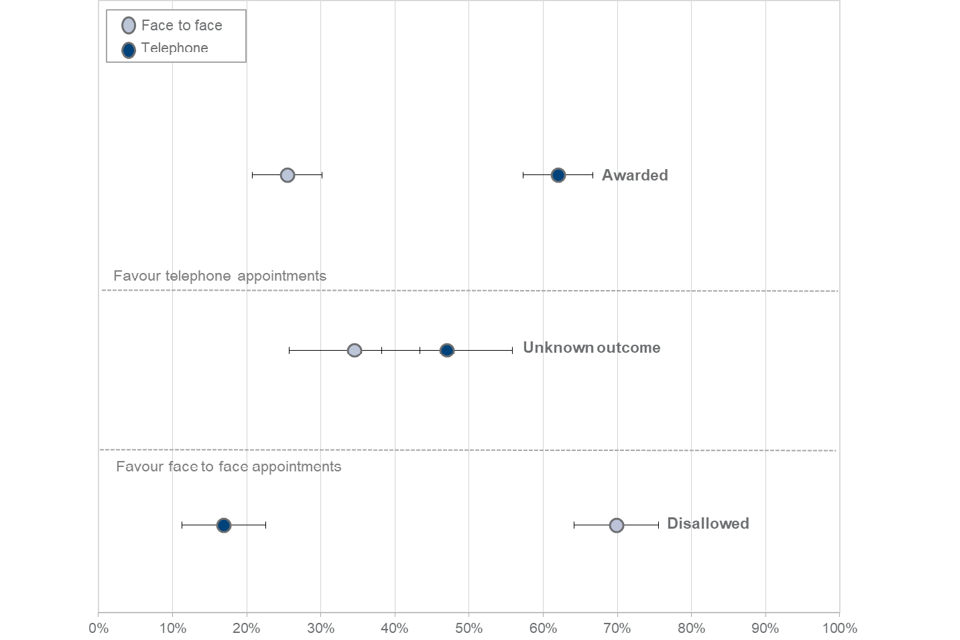
As figure 19 shows, the estimated probability of a claimant who was awarded PIP preferring a telephone assessment was 61 per cent compared to a 26 per cent probability or preferring face-to-face after controlling for other variables in the model.
When taking these other characteristics into account, claimants who were disallowed had only a 17 per cent predicted probability of preferring telephone compared to a 70 per cent probability of choosing face-to-face.
Those with an unknown outcome were far less pronounced in their preferences. They had 45 per cent predicted probability of preferring telephone and 35 per cent face-to-face but this difference was not statistically significant. This suggests that, when controlling for the factors used in this model, claimants within an unknown outcome, were no more likely to favour either telephone or face-to-face assessments.
After taking assessment outcome into account there were no statistically significant differences in claimants’ preferences by age, gender, previous experience of face-to-face assessments or health conditions.
Figure 19: Predicted probabilities of assessment preference – PIP claimants by assessment outcome
The claimants who expressed a preference for telephone assessments were also asked to describe the reasons for their choice. Two thirds (65 per cent) of these claimants found a telephone assessment easier or more comfortable, half (50 per cent) did not want to travel, and four in ten (44 per cent) found it less stressful.
Figure 20: Reasons for preferring telephone assessments
| Reason for preference | Percentage |
|---|---|
| Easier/More comfortable | 65% |
| No travel | 50% |
| Less stressful | 44% |
| Less tiring | 8% |
| Other | 7% |
| Feeling safer | 2% |
| Third person can assist better | 2% |
| Better shows condition effects | 2% |
| Shorter assessment | 2% |
| More time to discuss condition | 1% |
Unweighted base: Claimants who said they preferred telephone assessments only (n=368).
Note: Some claimants provided multiple responses. Coded open text question.
Women were more likely than men to say that telephone assessments are easier and more comfortable (69 per cent, compared to 58 per cent respectively). Those with mental health conditions were more likely to say they found telephone assessments less stressful (54 per cent, compared with 36 per cent of those without mental health conditions).
Claimants who said they preferred face-to-face assessments were also asked to give reasons for their choice. The most common reasons given were feeling better able to show their condition during a face-to-face assessment (69 per cent); finding it easier or more comfortable to speak to someone in person (47 per cent); easier to communicate with the assessor (43 per cent) and easier to build rapport with the assessor (20 per cent).
Figure 21: Reasons for preferring face-to-face assessments
| Reason for preference | Percentage |
|---|---|
| Better shows condition effects | 69% |
| Easier/More comfortable | 47% |
| Better communication | 43% |
| Better rapport | 20% |
| Third person can assist better | 13% |
| Less stressful | 6% |
| Other | 4% |
| No information security issues | 2% |
Unweighted base: Claimants who prefer face-to-face assessments only (n=347).
Note: Some claimants provided multiple responses. Asked as an open question in the survey. Answers were coded afterwards.
Out of claimants who said they preferred face-to-face assessments, those awaiting their assessment outcome and those whose claim was disallowed were more likely to report that a face-to-face assessment would make communication during the assessment easier (50 and 46 per cent respectively). About a third (36 per cent) of claimants who were awarded PIP gave the same response.
Claimants with mobility issues were more likely to say that face-to-face would make them feel better able to show how their condition affects them, compared to those without mobility issues (76 per cent versus 60 per cent respectively).
Previous experience and comfort with video calls
Claimants were asked if they had previously participated in video calls via laptop, tablet or telephone. Almost two thirds (63 per cent) said that they had used video calls at least once. Younger claimants were more likely to have used video calls (83 per cent of those aged 35 or younger) than older claimants (47 per cent of those aged 55 or older).
Figure 22: Whether claimants had previous experience of video calls by age
| Previous experience | Under 35 | 35 to 44 | 45 to 54 | 55 and over |
|---|---|---|---|---|
| Yes | 83% | 73% | 60% | 47% |
| No | 17% | 27% | 40% | 53% |
Unweighted base: All claimants (n=836).
When asked, more than half (56 per cent) of claimants said they would feel ‘comfortable’ or ‘very comfortable’ having a video assessment should these be available in the future.
Figure 23: Whether claimants would feel comfortable with a video assessment
| Claimant comfort | Percentage |
|---|---|
| Very comfortable | 10% |
| Comfortable | 46% |
| Uncomfortable | 28% |
| Very uncomfortable | 15% |
Unweighted base: All claimants (n=795).
Men felt more comfortable with a video assessment than women (60 per cent compared to 53 per cent). Those reporting no mental health conditions would feel more comfortable having a video assessment (61 per cent) than those with mental health conditions (52 per cent).
Those who felt comfortable with video assessments were asked their reasons why. Almost half (46 per cent) felt that video calls would allow them to see the assessor and build rapport. A fifth (21 per cent) said they would be comfortable with a video call as it would allow them to complete the assessment at home. Over one in eight felt it would help them show the effects of their condition (15 per cent) or simply felt they were used to video calls (13 per cent).
Figure 24: Reasons for feeling comfortable with video assessments
| Reason | Percentage |
|---|---|
| Ability to see the assessor | 46% |
| Can be at home | 21% |
| Other | 17% |
| Can display the condition | 15% |
| Used to video calls/Previous experience | 13% |
| Time efficient | 6% |
| Can lip read the assessor | 1% |
| Financially efficient | 1% |
Unweighted base: Claimants who were comfortable with video assessments only (n=406).
Note: Some claimants provided multiple responses. Coded open text question.
Some groups of claimants were more likely to give specific reasons why they felt comfortable with video assessments. Claimants whose claim had been disallowed were more likely to say that video allows them to see the assessor and build rapport with them (60 per cent, compared to 37 per cent of those whose claim had been awarded). Those with mental health conditions were also more likely to select these reasons (55 per cent, compared to 40 per cent of claimants without mental health conditions).
Those who previously said to prefer telephone assessments (versus face-to-face) were more likely to say that they felt comfortable with video assessments because they were comfortable at home (38 per cent, compared to 7 per cent of those who preferred face-to-face assessments). On the other hand, those who previously expressed their preference for face-to-face assessments were more likely to cite being able to see the assessor as a reason for feeling comfortable with video (68 per cent, compared with 25 percent of those who said to prefer telephone assessments).
Claimants who said that they would feel uncomfortable with having a video assessment were asked why they held this view. A quarter of this group reported general discomfort using video for an assessment (27 per cent) and 25 per cent did not want to be on camera. A fifth said that video would make them too nervous or anxious (20 per cent) and/or that they would not know how to use the technology (19 per cent).
Figure 25: Reasons for feeling uncomfortable with video assessments
| Reason | Percentage |
|---|---|
| General discomfort/dislike for video | 27% |
| Does not want to be on camera or face-to-face | 25% |
| Too nervous or anxious | 20% |
| Unsure how to use it | 19% |
| Would rather talk in person/face-to-face | 15% |
| Other | 10% |
| Would not be able to fully show or explain condition | 7% |
| No/limited access to video | 6% |
| Due to past use/negative experiences | 4% |
| Worried about privacy | 3% |
| Indifferent | 1% |
Unweighted base: Claimants who were uncomfortable with video assessments only (n=342).
Note: Some claimants provided multiple responses. Coded open text question.
Given the small sample size of the group that said they felt uncomfortable with video, fewer differences between subgroups were observed. Those more likely to say they were ‘unsure how to use it’, include males (24 per cent, compared to 15 per cent of females), and older claimants (36 per cent of those 55 years and over, compared to 7 per cent of those age under 35).
Preferences across telephone, video or face-to-face assessment
Claimants were then asked whether, if they had a choice of all three channels, they would prefer a video, face-to-face or telephone assessment. Four in ten claimants (41 per cent) preferred face-to-face assessments and similarly 39 per cent preferred telephone assessments. Fifteen per cent expressed a preference for video assessments, while 5 per cent said they had no preference.
Figure 26: Preference for telephone, video or face-to-face assessment
| Preference | Percentage |
|---|---|
| Video | 15% |
| Telephone | 39% |
| Face-to-face | 41% |
| No preference | 5% |
Unweighted base: All claimants (n=832).
Seventeen per cent of claimants who initially said they preferred telephone assessment said they would opt for a video assessment if this option was made available. This is in comparison to 21 per cent of claimants who expressed no initial preference between a telephone or face-to-face, and ten per cent who initially preferred a face-to-face assessment.
As described above for the two-way preference, logistic regression analysis was conducted to model claimants’ preference for each of the three assessment channels (compared to preference for the other alternate assessment channels or having no preference). This analysis focussed on the same five variables (namely, assessment outcome, previous experience of face-to-face assessments, age, gender and health conditions) to establish which are good predictors of claimants’ channel preference.
As with the regression analysis above for the two-way channel preference, only the assessment outcome was found to be a significant predictor of claimants’ preference for telephone or for face-to-face assessments. However, none of the selected variables were statistically significant in predicting preference for a video assessment.
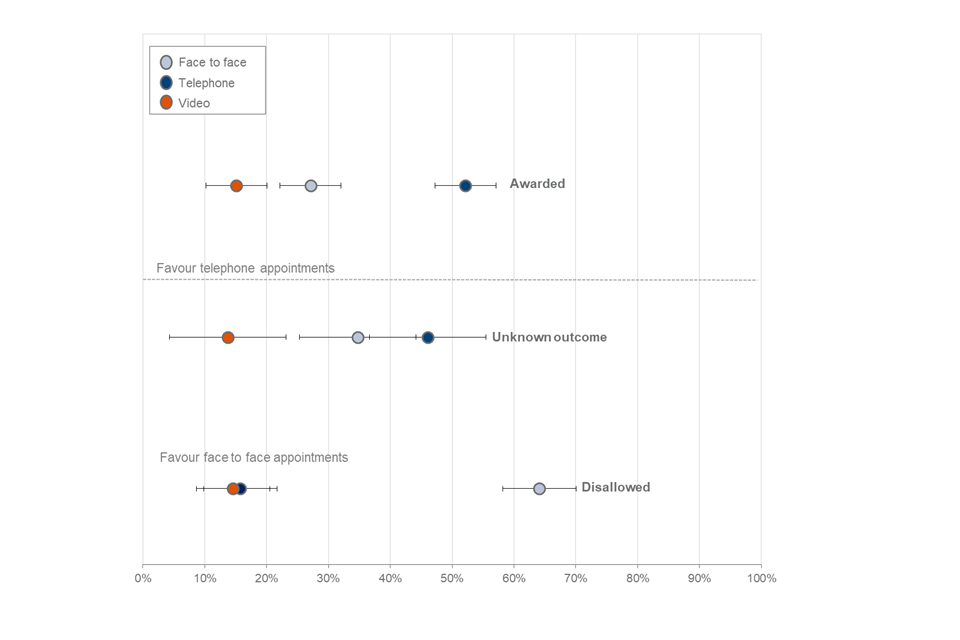
Those awarded PIP had a 51 per cent predicted probability of choosing a telephone assessment when given this three-way choice, a fall from 61 per cent when choosing between just telephone and face-to-face. Only 28 per cent were predicted to still prefer face-to-face, compared to 26 per cent given a two-way choice.
Those not awarded had only a 16 per cent probability of preferring telephone given a three-way choice, almost unchanged from the two-way choice model prediction of 17 per cent. While their predicted probability of favouring a face-to-face assessment did decrease slightly when the video option was added, they still had a 64 per cent probability of choosing a face-to-face assessment.
This suggests that introducing a video option reduces the proportion of claimants awarded PIP who might prefer telephone assessments from a two-way choice but does not change the views of those who prefer face-to-face or those who were not awarded PIP.
Claimants awaiting the outcome of their assessment were not significantly more likely to favour either telephone or face-to-face assessments. As a claimant’s assessment outcome appears to be the largest driver of telephone or face-to-face preference, the preference of these claimants may change once a decision has been made but when controlling for their previous assessment experience, gender, age and health conditions, the difference between their likelihood to favour telephone (44 per cent) or face-to-face (36 per cent) assessments is not significant.
Figure 27: Predicted probabilities of favouring assessment mode by assessment outcome
2.5. Suggestions for improvement
When asked what would have improved their experience of the telephone assessment, around half (51 per cent) of claimants said that no further improvements were necessary. This was higher among those awarded PIP (62 per cent) than those who were still awaiting their assessment outcome (55 per cent) or those who had been disallowed PIP (32 per cent). Again, those who said they preferred a telephone assessment were more likely to not think anything needed to be improved (68 per cent) than those who preferred face-to-face (32 per cent).
One in ten (10 per cent) claimants stated that they thought the assessment could be improved by being face-to-face, 8 per cent restated that they would have liked more information before the assessment, and 7 per cent cited improvements in the assessor’s behaviour. Remaining answers covered a wide range of preferences about the length and conduct of the assessment as well as the mode of conducting the assessment (see Figure 28 below).
Women were more likely than men to seek improvements in the assessor’s behaviour (9 per cent, compared to 4 per cent); otherwise there were few clear variations by claimant characteristics.
Figure 28: Suggested improvements to assessment process
| Suggestion | Percentage |
|---|---|
| No improvements necessary | 51% |
| Having it face-to-face | 10% |
| Other | 9% |
| More information before the call | 8% |
| Improvements in the assessors behaviour | 7% |
| Having a friend or relative present | 6% |
| General improvements in assessment conduct/service provision | 6% |
| Someone who understands the condition | 6% |
| More suitable questions | 5% |
| Having a longer assessment/more time to explain condition | 4% |
| Using video | 4% |
| Better technology | 2% |
| Having a shorter assessment | 2% |
| Medical professional | 1% |
| More information on the next stages/support following the call | 1% |
| Having a support worker present | 1% |
| Having a break during the call | 1% |
Unweighted base: All claimants (n=788).
Note: Some claimants provided multiple responses. Coded open text question.
3. Work capability telephone assessments
The WCA survey comprised 1146 claimants of ESA or UC undergoing a telephone assessment. According to DWP records, two thirds (66 per cent) were making a new claim while the remainder were undergoing a reassessment.
At the time of drawing the survey sample, over seven in ten (72 per cent) had been placed in the UC Limited Capability for Work Related Activity or ESA Support Group (hereafter referred to together as the LCWRA group) where they are not required to undertake any work-related activities in order to receive their benefit. The remainder were added to a group awaiting a face-to-face assessment (once COVID-19 restrictions allowed) rather than be deemed fit for work or fit for work-related activity on the basis of a telephone assessment (hereafter referred to together as ‘claimants awaiting further assessment).
Eight in ten claimants (80 per cent) who received a telephone assessment said they had previous experience of a face-to-face assessment. Not surprisingly, those undergoing a reassessment were more likely to have face-to-face experience (96 per cent), but also nearly two thirds (64 per cent) of new claimants had experience as part of a previous claim.
Those claimants who went on to be placed in the LCWRA group were more likely to have previously experienced a face-to-face assessment (84 per cent) than those who were awaiting further assessment (68 per cent).
Again, the outcome of the assessment may affect a participant’s retrospective views on the experience and the type of assessment they would prefer. Any reported differences in opinion by assessment outcome should therefore be interpreted with this in mind. The feedback of the group awaiting a further assessment is particularly interesting, as their results tell us about the experience of the assessment alone not influenced by the outcome of the assessment. A multivariate analysis of the key drivers of preference for either a telephone, face-to-face or video assessment are presented in the Section on Preference for Assessment Channels.
3.1. Communication and support before the assessment
Information received prior to the assessment
In preparation for the assessment, nearly all (89 per cent) of claimants recalled receiving information telling them what to expect. Most commonly this was in the form of a letter (57 per cent) or telephone call (38 per cent).
Figure 29: Type of communication received prior to the assessment
| Type of communication | Percentage |
|---|---|
| Letter | 57% |
| Telephone call | 38% |
| None/do not know/ cannot remember | 11% |
| Text message | 5% |
| Contact through UC journal account | 4% |
| 2% | |
| Other | 2% |
| Leaflet | 2% |
Unweighted base: All claimants (n=1146).
Note: Some claimants provided multiple responses.
Nine out of ten (90 per cent) of those who recalled receiving information prior to their assessment found it ‘somewhat’ or ‘very’ helpful. Claimants who went on to say that they preferred face-to-face over telephone assessments were less likely to report the information as helpful (84 per cent) than those who preferred telephone (92 per cent) or expressed no preference (93 per cent).
Claimants who recalled receiving a communication were asked whether any other information would have been helpful prior to the assessment. Seventy per cent felt that no further information was necessary, although one in five (21 per cent) would have liked more information about what was going to be covered in the assessment.
Figure 30: Other information that would have been helpful prior to the assessment
| Type of information | Percentage |
|---|---|
| No other information necessary | 70% |
| More information about what would be covered | 21% |
| An alternative/additional method of providing information | 6% |
| An assessment reminder (date/time) | 4% |
| Other | 3% |
| Information on length of assessment | 2% |
| That a third person could have been present | 1% |
Unweighted base: All claimants who recalled receiving information prior to their assessment (n=1008).
Note: Some claimants provided multiple responses. Coded open text question.
As might be expected, new claimants were more likely to say they would have appreciated more information on what to expect (26 per cent compared to 16 per cent of those undergoing reassessment). Again, those who went on to say they would prefer a face-to-face assessment over telephone were more likely to say they would have liked more information on what to expect (29 per cent) than those who were happy with telephone or expressed no preference (both 19 per cent).
Other support ahead of the assessment
In addition to information from DWP or the assessment provider, nearly one in three (32 per cent) claimants sought advice and information from other sources. One in five (20 per cent of) claimants spoke to a friend or relative. Some also consulted a social worker or support worker (4 per cent), a charity or support group (2 per cent), JCP (2 per cent) or Citizens Advice (2 per cent).
Figure 31: Other support received before the assessment
| Support recieved | Percentage |
|---|---|
| No support received | 68% |
| Friend or relative | 20% |
| Someone else | 4% |
| Social, care or support worker | 4% |
| GP or other health professional | 2% |
| Charity/support group | 2% |
| CAB | 2% |
| JCP | 2% |
Unweighted base: All claimants (n=1142).
Note: Some claimants provided multiple responses. Coded open text question.
Claimants who went on to be placed in the LCRWA group were more likely to have sought additional support (35 per cent) than those who were awaiting further assessment (23 per cent). Those undergoing a reassessment were also more likely to seek help (35 per cent) than those making a new claim (28 per cent).
3.2. Experience of the assessment
Adjustments
Claimants were asked whether they had requested any additional adjustments to the assessment process. Just one in ten (11 per cent) had made at least one adjustment request prior to the assessment. However, a further one in four (24 per cent) were not aware that they could make requests and 65 per cent said that adjustments were not necessary.
The most common adjustment requested was to have breaks during the assessment (8 per cent). A small number of claimants also requested to spread the assessment over multiple calls or receive information in large text or braille.
Figure 32: Whether claimants requested additional adjustments for the assessment process
| Adjustment requested | Percentage |
|---|---|
| Adjustments were not needed | 65% |
| Unaware could have adjustment | 24% |
| Having breaks during the call | 8% |
| Information in large text | 3% |
| Having multiple phone calls | 1% |
| Information in braille | 1% |
Unweighted base: All claimants (n=1122).
Note: Some claimants provided multiple responses.
Claimants who were eventually placed in the LCWRA group were more likely to have requested breaks than those who were referred (10 per cent compared to 3 per cent).
The assessment provider was able to incorporate breaks in 93 per cent of cases where it had been requested. The frequency of the other requests was too small to report on the outcome quantitatively.
Difficulties during the call
Claimants were asked whether they experienced any technical issues during the call. The majority (87 per cent) did not experience any issues, while some reported problems with sound quality (claimant hearing the assessor) and signal problems (both 5 per cent). Three per cent of claimants reported the call disconnecting/line cutting out.
Figure 33: Whether claimants experienced technical issues
| Technical issue | Percentage |
|---|---|
| No issues experienced | 87% |
| Poor sound quality: Claimant hearing assessor | 5% |
| Signal problems | 5% |
| Call disconnection/line cut | 3% |
| Poor sound quality: Assessor hearing claimant | 1% |
| Other | 1% |
| General issues with hearing | 1% |
| Background noise from assessor | 1% |
Unweighted base: All claimants (n=1132).
Note: Some claimants provided multiple responses.
One in five (20 per cent of) claimants reported experiencing other difficulties during the assessment. Most commonly this was problems with holding the telephone or using a loudspeaker (13 per cent).
Figure 34: Whether claimants experienced other difficulties
| Issue | Percentage |
|---|---|
| No other difficulties | 80% |
| Holding phone/no loudspeaker | 13% |
| It was tiring/needed to take breaks | 3% |
| Other difficulties but not related to taking the call | 3% |
| No quiet place | 2% |
| Understanding and answering the questions | 1% |
| Hearing due to condition | 1% |
| Other | 1% |
Unweighted base: All claimants (n=1136).
Note: Some claimants provided multiple responses.
Women were more likely to report those other difficulties than men (23 per cent, compared to 16 per cent). Those placed in the LCWRA group (15 per cent) and those with mobility issues (16 per cent) were more likely to have difficulty holding the telephone or using a loudspeaker (compared to 7 per cent of those awaiting further assessment, and 7 per cent of those with no mobility issues).
Third person support
Claimants were asked about their experience of having someone on the call to support them or provide assistance during the assessment. Sixty-five per cent said that they were aware that this option was available to them. Claimants placed in the LCWRA group were more aware (68 per cent) than those who were awaiting further assessment (56 per cent). Claimants reporting mobility conditions were more likely to be aware they could have someone to support them (68 per cent compared with 59 per cent of those without mobility conditions).
Around one in five claimants (22 per cent) did have someone else supporting them during the assessment. This was most commonly a family member (18 per cent). Nearly all of these people were at home with the claimant during the call, but some were able to dial in remotely.
Figure 35: Whether claimants received third person support
| Support | Percentage |
|---|---|
| No assistance on call | 78% |
| Family member | 18% |
| Friend | 2% |
| Carer | 1% |
| Other | 1% |
Unweighted base: All claimants (n=1146).
Claimants more likely to receive support included those having a benefit reassessment (28 per cent, compared to 17 per cent of those making a new claim), and those placed in the LCWRA group (27 per cent, compared to 9 per cent of those who were referred). Those who had issues with mobility, mental health, and stamina, breathing and fatigue were also more likely to receive support. For example, 24 per cent of those with a mobility condition, and 27 per cent of those with a mental health condition, had someone supporting them during the assessment (compared to 18 per cent of those without mobility and 20 per cent of those without mental health conditions).
Nearly all claimants (99 per cent) who were joined by someone else for the call said they found their support either ‘very’ or ‘somewhat’ helpful.
Figure 36: Third person helpfulness
| Helpfulness | Percentage |
|---|---|
| Very helpful | 87% |
| Somewhat helpful | 11% |
| Not helpful | 1% |
Unweighted base: Claimants who had third person support only (n=240).
Feedback on the assessor
Ninety-three per cent of claimants confirmed that the assessor called on time. Claimants were then asked if they agreed or disagreed with statements about the assessor’s conduct of the call. Nearly all (98 per cent) either ‘agreed’ or ‘strongly agreed’ that ‘the assessor explained clearly at the beginning what would happen during the call’, and 97 per cent ‘agreed’ or ‘strongly agreed’ that ‘the assessor listened to me and made sure they understood what I was saying’.
Figure 37: Level of agreement with statements about the assessor
| Statement | Strongly agree | Agree | Disagree | Strongly disagree |
|---|---|---|---|---|
| Whether assessor provided a clear explanation | 63% | 36% | 1% | 1% |
| Whether assessor listened to and understood claimant | 63% | 34% | 2% | 1% |
Unweighted base: All claimants (Whether the assessor provided clear explanation, n=1128) (Whether assessor listened and understood claimant n=1134).
Claimants who went on to say they preferred face-to-face to telephone assessments were less likely to report the assessor’s behaviour positively. For example, 91 per cent ‘agreed’ or ‘strongly agreed’ that the assessor listened to and understood the assessor, compared to 99 per cent who went on to say they preferred a telephone assessment.
Explaining and discussing condition
Ninety-five per cent of claimants ‘agreed’ or ‘strongly agreed’ that they were able to explain how their health condition or disability affects their daily life.
Figure 38: Whether claimants agreed that they were able to explain how their condition or disability affects their daily life
| Able to explain | Percentage |
|---|---|
| Strongly agree | 61% |
| Agree | 34% |
| Disagree | 3% |
| Strongly disagree | 1% |
Unweighted base: All claimants (n=1134).
Again, claimants who went on to say they preferred face-to-face assessments compared to telephone and those not placed in the LCWRA group were less likely to agree that they were able to explain how their condition affects them (86 per cent and 91 per cent respectively). In contrast nearly all of those who said they preferred telephone assessments or were placed in the LCWRA group said they felt able (98 per cent and 97 per cent respectively).
Of the small number who did not feel able to explain their condition clearly, nearly four in ten (38 per cent) cited issues with the assessor not listening, seeming uninterested, or not understanding them. Nearly one in three (32 per cent) reported issues with the questions (the way they were asked, type, focus and coverage). Around one in four felt that it was not possible to explain their condition over the telephone (28 per cent) or were too time limited (23 per cent). However, these figures should be taken as indicative given the small number of claimants involved.
Figure 39: Reasons for not being able to explain condition affects
| Why claimant unable to explain | Percentage |
|---|---|
| Issues with assessor | 38% |
| Issues with questions | 32% |
| Could not fully explain condition over the phone | 28% |
| Time limitations | 23% |
| Health condition made it difficult | 12% |
| Other | 3% |
Unweighted base: Claimants who felt they could not explain their condition only (n=51).
Note: Some claimants provided multiple responses. Coded open text question.
Claimants were asked to rate how comfortable they felt sharing information about their health condition or disability over the telephone. Around eight in ten (79 per cent) reported they were ‘comfortable’ or ‘very comfortable’.
Figure 40: Whether claimants felt comfortable sharing information over the telephone
| Sharing information over telephone | Percentage |
|---|---|
| Very comfortable | 33% |
| Comfortable | 46% |
| Uncomfortable | 16% |
| Very uncomfortable | 5% |
Unweighted base: All claimants (n=1145).
Older claimants were more likely to feel comfortable sharing this information (82 per cent of those aged 55 and over, compared with 72 per cent of those aged under 35). Claimants reporting mental health conditions were slightly less likely to feel comfortable (74 per cent) than those who did not report mental health conditions (82 per cent).
In addition, claimants were asked to identify any topics in relation to their condition that they found difficult to talk about over the telephone. Around three quarters (76 per cent) of claimants reported no difficult topics. The most commonly reported difficult topics included claimants’ physical health or disability (8 per cent) and mental health (7 per cent). Five per cent of claimants felt generally uncomfortable discussing information over the telephone but identified no specific topics.
Figure 41: Issues claimants found difficult to explain on the telephone
| Topic | Percentage |
|---|---|
| No difficult topics | 76% |
| Physical health/Disability | 8% |
| Mental health | 7% |
| Generally uncomfortable | 5% |
| Toileting | 4% |
| Other | 3% |
| Childcare and family | 2% |
| Washing and dressing | 1% |
| Mobility | 1% |
Unweighted base: All claimants (n=1129).
Note: Some claimants provided multiple responses.
Twenty-six per cent of women reported finding some topics difficult, compared to 19 per cent of men. Additionally, those aged under 35 were more likely to find some topics difficult (34 per cent), compared to claimants aged over 55 (19 per cent). Those reporting mental health conditions were also more likely to report difficulties (32 per cent) than those who did not report mental health conditions (19 per cent).
Follow up information
Claimants were asked whether they were given clear information on what would happen next with their claim – i.e. whether they were told to expect a letter from DWP. Nine in ten (91 per cent of) claimants said they received this information. Those placed in the LCWRA group were more likely to report doing so (94 per cent) than those who were awaiting further assessment (82 per cent).
3.3. Overall satisfaction
Claimants were asked to rate their overall satisfaction with how the telephone assessment was conducted. Overall, 94 per cent reported they were ‘satisfied’ or ‘very satisfied’ with the assessment.
Figure 42: Whether satisfied with how the telephone assessment was conducted
| Satisfaction with telephone assessment | Percentage |
|---|---|
| Very satisfied | 58% |
| Satisfied | 36% |
| Dissatisfied | 5% |
| Very dissatisfied | 1% |
Unweighted base: All claimants (n=1139).
Higher satisfaction levels were expressed by those who were placed in the LCWRA group (97 per cent compared to 86 per cent of those awaiting further assessment), those who preferred to have telephone assessments (97 per cent) and those who said they had mobility issues (96 per cent).
Those who reported being dissatisfied with the telephone assessment were asked to provide their reason(s). The most common reasons reported were issues with the assessor’s behaviour (29 per cent) and having insufficient or limited time to understand and/or provide answers to the questions (21 per cent). Fifteen per cent of claimants felt that the questions were not tailored or relevant to their health condition; 14 per cent felt the assessment needed face-to-face contact, and 13 per cent reported dissatisfaction due to generally finding the assessment uncomfortable or emotional.
Figure 43: Reasons for dissatisfaction with telephone assessment
| Reason for dissatisfaction | Percentage |
|---|---|
| Assessors behaviour | 29% |
| Insufficient time | 21% |
| Other | 18% |
| Questions were not relevant | 15% |
| Needed face-to-face contact | 14% |
| General discomfort/emotional difficulties | 13% |
| Issues with length of assessment | 9% |
| Assessor should understand the condition | 5% |
| Technical issues | 3% |
| Would prefer a medical professional | 2% |
Unweighted base: Claimants who were not satisfied with the assessment only (n=59).
Note: Some claimants provided multiple responses. Coded open text question.
3.4 Preference for assessment channels
Preference for telephone or face-to-face assessments
Claimants were asked whether, given a choice and if assumed safe under government advice, they would prefer face-to-face or telephone assessments.
Six in ten (62 per cent) stated a preference for telephone assessments, while just over one in five (23 per cent) would still prefer face-to-face. Nearly one in seven (15 per cent) said they had no preference.
Figure 44: Preference for telephone or face-to-face assessment
| Preference | Percentage |
|---|---|
| Telephone | 62% |
| Face-to-face | 23% |
| No preference | 15% |
Unweighted base: all respondents (n=1133).
Preference was, however, highly associated with the outcome of the assessment. Seven in ten (70 per cent) of those placed in the LCWRA group said they would prefer a telephone assessment compared to just over four in ten (42 per cent) of those who had been awaiting further assessment. Those undergoing a reassessment were also more likely to choose a telephone assessment (68 per cent) than those submitting a new claim (57 per cent). Women were also more likely to opt for telephone (68 per cent) than men (54 per cent). Those with mental health conditions were more likely to prefer telephone than those without mental health conditions (67% compared with 60%).
Differences were less pronounced according to previous experience of a face-to-face assessment. Those with previous experience of a face-to-face assessment were more likely to choose a telephone assessment when presented with this choice (64 per cent) than those for whom it was a new claim (56 per cent).
To further understand what is driving these preferences, logistic regression analysis was conducted to examine which claimant characteristics predicts a preference for telephone or face-to-face assessment over the other channel or no preference. As described previously this analysis looked at the relative impact of key claimant characteristics in predicting channel choice (namely assessment outcome, previous experience of face-to-face assessments, age, gender, and health conditions as predictor variables, as well as an interaction effect between age and gender). This analysis provides an estimate of the relationship between each of these variables and a claimant’s assessment preference, while controlling for the other variables included in these models.
Figure 45 shows that, after holding all of the other model variables constant, the estimated probability of a claimant placed in the LCWRA group preferring a telephone assessment was 70 per cent compared to only a 15 per cent probability of still preferring a face-to-face assessment. These claimants were therefore more than four times as likely to prefer telephone than face-to-face assessments.
Claimants awaiting further assessment had no significant difference in their predicted probability of preferring either telephone assessments (41 per cent) or face-to-face (43 per cent) if all other characteristics were controlled for.
Women had a strong preference for telephone assessments over face-to-face even after controlling for other characteristics (66 per cent), three and a half times their predicted probability of face-to-face assessments (19 per cent).
Men were also more likely to prefer a telephone assessment over face-to-face (54 per cent) but this was only twice as high as their predicted probability of preferring face-to-face (28 per cent).
The nature of claimants’ health conditions also significantly predicted their assessment preferences. Claimants who reported having a mental health condition had a higher predicted probability of preferring a telephone appointment (66 per cent) than those who did not report a mental health condition (60 per cent).
Figure 45: Predicted probabilities of assessment preference by outcome, gender and mental health condition
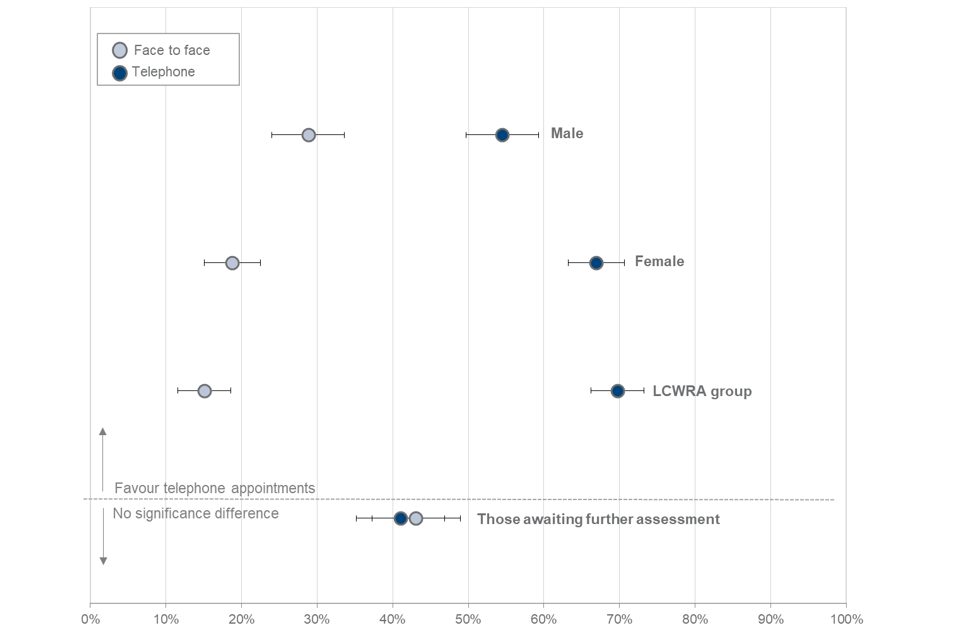
Unlike the regression analysis for PIP claimants, there was evidence from our final models for WCA respondents that the relationship between a respondent’s age and their channel preference varied by their gender. There was no significant variation in preferences across the age groups for women, amongst whom claimants of all age groups preferred telephone assessments by a large margin.
However, as figure 46 shows, this was not the case for male claimants. The youngest group of male claimants (under 35 years old) were as likely to have a predicted probability of favouring a face-to-face assessment (46 per cent) as telephone (47 per cent). In every other age group, but particularly for those aged 35-44, male claimants were more likely to prefer telephone assessments.
Figure 46: Predicted probabilities of assessment preference amongst male claimants by age
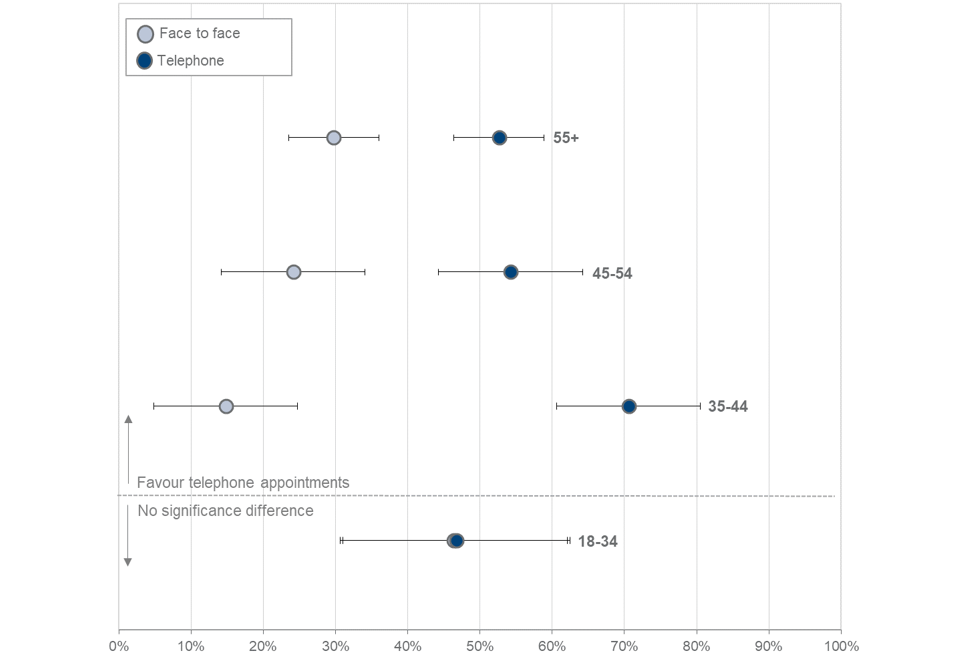
Claimants who reported a preference for telephone assessments were also asked to explain the reasons of their choice. More than two thirds (68 per cent) of this group mentioned not needing to travel and 59 per cent of them found telephone assessments easier or more comfortable. Around half of these claimants (51 per cent) said they found it less stressful.
Figure 47: Reasons for preferring phone assessments
| Reason for preference | Percentage |
|---|---|
| No travel | 68% |
| Easier/more comfortable | 59% |
| Less stressful | 51% |
| Less tiring | 13% |
| Shorter assessment | 3% |
| Feeling safer at home | 3% |
| Better shows condition effects | 3% |
| Third person can assist better | 3% |
| Other | 2% |
| More time to discuss condition | 1% |
Unweighted base: only claimants who prefer telephone assessments (n=693).
Note: Some claimants provided multiple responses. Coded open text question.
Of those who preferred a telephone assessment:
- women were most likely to cite they would find it less stressful (57 per cent) alongside those undergoing a reassessment; those placed in the LCWRA group and those who had previous experience of a face-to-face assessment were all more likely than other groups to cite finding this mode less stressful (56 per cent, 54 per cent and 54 per cent respectively).
- claimants reporting mobility conditions were most likely to point to the advantages of not having to travel (75 per cent) alongside older claimants, those undergoing a reassessment and those placed in the LCWRA group (74 per cent, 74 per cent and 70 per cent respectively).
- new claimants were more likely to say they generally that they found it easier and more comfortable than attending a face-to-face assessment (70 per cent).
Similarly, claimants who said they preferred face-to-face were also asked to explain why. Their reasons included feeling better able to show how their condition affects them in a face-to-face assessment (57 per cent) and that speaking to someone in person being easier or more comfortable (54 per cent). Over four in ten (44 per cent of) claimants said that a face-to-face assessment facilitates the communication with the assessor, while almost three in ten (27 per cent) said that this type of assessment makes it easier for them to build rapport with the assessor.
Figure 48: Reasons for preferring face-to-face assessments
| Reason for preference | Percentage |
|---|---|
| Easier to show condition effects | 57% |
| Easier/more comfortable in person | 54% |
| Better communication | 44% |
| Better rapport | 27% |
| Less stressful | 10% |
| Third person can assist better | 7% |
| Other | 7% |
| No information security issues | 5% |
| No connection issues | 2% |
| Shorter assessment | 2% |
| Less tiring | 1% |
Unweighted base: only claimants who preferred face-to-face assessments (n=259).
Note: Some claimants provided multiple responses. Coded open text question.
Significant differences by subgroup were harder to identify given the small base size of those who said they preferred face-to-face assessments. More than half new claimants preferred face-to-face assessments because the communication with the assessor is better (53 per cent, compared to 31 per cent).
Previous experience and comfort with video calls
Claimants were asked if they had previous experience of video calls via laptop, tablet or phone. Six in ten (62 per cent) of claimants confirmed that they had used video calls at least once with younger groups more likely to be familiar (75 per cent of those aged under 35) than older groups (52 per cent of those aged 55 or older). Women were also more likely (66 per cent) than men (56 per cent) to report using video calls in the past.
Figure 49: Whether claimants had previous experiences with video calls by age
| Previous experience | Under 35 | 35 to 44 | 45 to 54 | 55 and over |
|---|---|---|---|---|
| Yes | 75% | 74% | 64% | 52% |
| No | 25% | 26% | 36% | 48% |
Unweighted base: all claimants (n=1144)
Comfort with video assessment
When asked, 56 per cent of claimants said they would feel comfortable with having a video assessment in the future.
Figure 50: Whether claimants were comfortable with a video assessment
| Comfort with video assessment | Percentage |
|---|---|
| Very comfortable | 13% |
| Comfortable | 43% |
| Uncomfortable | 28% |
| Very uncomfortable | 16% |
Unweighted base: all claimants (n=1085).
Claimants with mental health conditions were more likely to feel uncomfortable about video (53 per cent, compared with 40 per cent of those with no mental health conditions).
When asked why they would feel comfortable with a video assessment, 45 per cent of those expressing this view said it was because of the ability to see the assessor and find it easier to build rapport. Three in ten (29 per cent) said that they are used to video calls and they are in general comfortable with this type of communication, while one in five (21 per cent) reported that they would feel comfortable with a video assessment because this allows them to remain at home.
Figure 51: Reasons for feeling comfortable with video assessments
| Reason | Percentage |
|---|---|
| Ability to see the assessor | 45% |
| Used to video calls/previous experience | 29% |
| Can be at home | 21% |
| Time efficient | 12% |
| Can show the condition | 9% |
| Other | 2% |
Unweighted base: only claimants who are comfortable with video assessments (n=492)
Note: Some claimants provided multiple responses. Coded open text question.
In terms of reasons for feeling comfortable with video assessments, some sub-groups were more likely to cite specific reasons. Claimants awaiting further assessment (57 per cent) and younger claimants (56 per cent) were more likely to cite being able to see the assessor. Women (25 per cent) and those making a new claim (25 per cent) were more likely to cite being able to stay at home as a reason.
Claimants who said that they would feel uncomfortable or very uncomfortable with having a video assessment were also asked for their reasons. A third of these claimants (33 per cent) reported general discomfort using a video call for an assessment, one in five (20 per cent) said they would feel unsure on how to use the technology, and a further nearly one in five said that they would feel too nervous or that they do not want to be on camera (both 18 per cent).
Figure 52: Reasons for feeling uncomfortable with video assessments
| Reason | Percentage |
|---|---|
| General discomfort/dislike for video | 33% |
| Unsure how to use it | 20% |
| Does not want to be on camera | 18% |
| Too nervous or anxious | 18% |
| Would rather talk in person | 11% |
| Not able to fully explain condition | 7% |
| Negative previous experiences | 4% |
| No/limited access to video | 4% |
| Worried about privacy | 4% |
| Other | 3% |
| Indifferent | 1% |
Unweighted base: only claimants who are uncomfortable with video assessments (n=454).
Note: Some claimants provided multiple responses. Coded open text question.
The type of reason given for feeling uncomfortable with video assessments varied somewhat by claimants sub-group. Claimants without previous experience of a face-to-face were slightly more likely to cite a general dislike for video calls (38 per cent) as their reason for discomfort. Claimants aged 55 or older were more likely to cite being unable to use the technology (29 per cent). Also, although as a group, younger claimants tended to be more comfortable with video calls, the small group that were not comfortable were more likely to say it would make them anxious or nervous (37 per cent of under 35s). Women were also more likely than men to say they would feel nervous (22 per cent compared to 12 per cent).
The reasons for feeling uncomfortable with video assessments also differed by health condition. Claimants with mental health conditions were more likely to say they would be nervous or anxious (32 per cent) and that they did not want to be on camera (24 per cent). Claimants with mobility issues who did not feel comfortable with video were less likely to report it would make them nervous or anxious (14 per cent) but were concerned about explaining their condition fully (9 per cent).
Preferred assessment channel (telephone, video or face-to-face)
Claimants were then asked which option for the assessment they would prefer if they had three choices: video, face-to-face and telephone assessments. More than half of the claimants (54 per cent) chose telephone assessments at this question, while a quarter (26 per cent) preferred face-to-face assessments. Nearly one in eight (13 per cent) expressed a preference for video assessments, while 7 per cent had no preference.
Figure 53: Preference for phone, video or face-to-face assessment
| Preference | Percentage |
|---|---|
| Video | 13% |
| Telephone | 54% |
| Face-to-face | 26% |
| No preference | 7% |
Unweighted base: All claimants (n=1136).
With this choice of video introduced, claimants who had originally expressed a preference for a face-to-face compared to telephone assessment were most likely to stick to their view (83 per cent of this group continuing to say that was their preference) whilst those previously preferring a telephone assessment were more likely to shift view with 77 per cent continuing to choose a telephone assessment and 16 per cent switching to choosing a video assessment. Eleven per cent of those who had previously had no preference were now interested in video calls but when asked again for their choice a further one in three now opted for either telephone 33 per cent) or face-to-face (32 per cent).
Again, logistic regression analysis was conducted to model claimants’ preference for each of the three assessment channels over the other channels or having no preference. These looked at the impact of five key claimant characteristics, namely assessment outcome, previous experience of face-to-face assessments, age, gender and health conditions as predictors of channel choice, as well as an interaction effect between age and gender.
The assessment outcome, gender, any previous experience of face-to-face assessments and presence of a mental health condition were significant predictors of a claimant’s channel preference. Most of these variables only predicted preference for telephone or face-to-face appointments, and not for video appointments, in a three-way choice model. In this model, only reporting a mental health condition was associated with a slightly decreased preference for a video assessment. Nonetheless, predicted probabilities suggest that telephone assessments remained the most popular for applicants both with and without a mental health condition.
Figure 54 shows that a claimant placed in the LCWRA group had a 61 per cent predicted probability of preferring a telephone assessment over face-to-face/video or no preference after controlling for all other characteristics. Only 19 per cent would be predicted to still opt for face-to-face.
Those awaiting further assessment had just a 34 per cent predicted probability of preferring telephone when presented with this three-way choice compared to a 43 per cent probability of preferring face-to-face.
The predicted probability of choosing a video call was consistently low across both the LCWRA group (14 per cent) and those awaiting further assessment (12 per cent).
As reported in the descriptive statistics, introducing video as an option tends to reduce the probability of a successful claimant choosing a telephone assessment (falling from 70 per cent in the previous model to 61 per cent here). In comparison, the probability of applicants preferring face-to-face assessments remained stable when they were asked to choose between all three options (43 per cent) compared to when they were asked to choose between only telephone and face-to-face appointments (44 per cent).
Women were again most likely to prefer a telephone assessment (58 per cent probability) and have much lower predicted probability of a preference for face-to-face (21 per cent).
Men were less likely to be predicted choosing telephone (47 per cent probability) and more likely to choose face-to-face (33 per cent probability)
For both genders, predicted probabilities of preference for video assessments were very low, at 14 per cent for women and 12 per cent for men.
Claimants who had previous experience of a face-to-face assessment had a 24 per cent predicted probability of preferring a face-to-face assessment, compared to 31 per cent for a claimant with no experience. Previous experience of face-to-face assessments did not have a significant effect on the likelihood of preferring a telephone or video assessment.
Claimants who reported a mental health condition were significantly less likely to prefer video assessments, with a 10 per cent likelihood of preferring video appointments compared to 15 per cent for those who did not report a mental health condition. This was the only variable included in the logistic regression models that significantly predicted claimants’ preference for video assessments.
Figure 54: Predicted probabilities of assessment preference – WCA claimants by assessment outcome, previous assessment experience, gender and mental health condition.
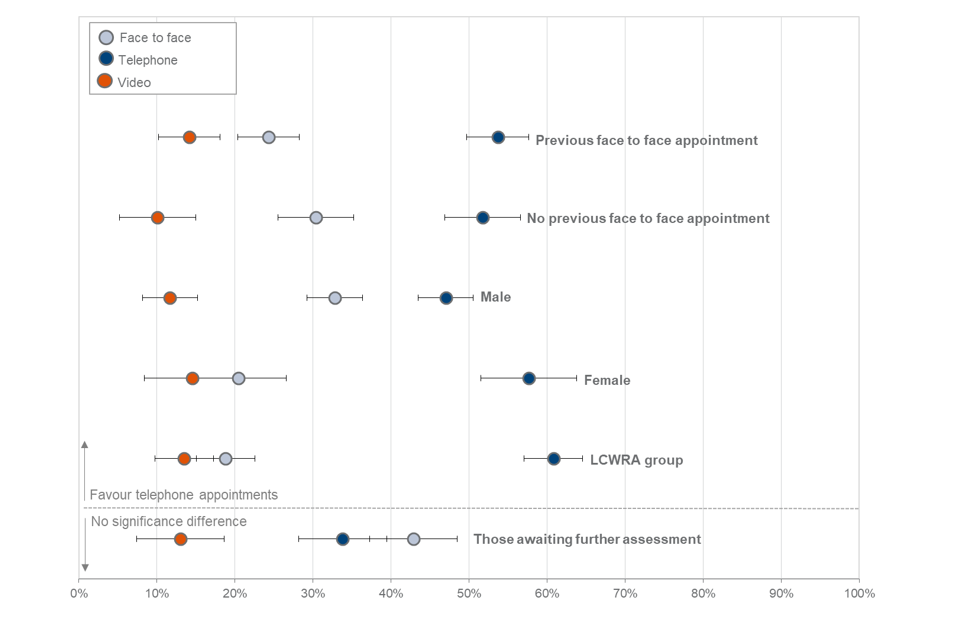
Unlike in the models predicting channel preference when only telephone and face-to-face assessments were included as options, there was no evidence that the relationship between a respondent’s age and channel preference varied by gender in these models.
3.5. Suggestions for improvement
When asked what would have improved their experience of the telephone assessment, almost three quarters (72 per cent) of claimants said that no further improvements were necessary.
Older claimants were more likely to say that no improvements were necessary (76 per cent of those 55 or older compared with 60 per cent of those under 35 years old)
Seventy-seven per cent of claimants with placed in the LCWRA group said that the telephone assessment did not require any improvements compared with 57 per cent of those who had been awaiting further assessment.
Notably, nearly eight in ten (79 per cent) of those who said they preferred a telephone to a face-to-face assessment also said that there was no need for further improvements, compared to half (51 per cent) of those who preferred face-to-face assessments.
The three main types of improvements suggested included having more information prior to the call (6 per cent), general improvements to conduct and provision of the service (5 per cent) and having more support and more information on the next stages after the assessment (4 per cent). With regard to the other improvements reported, these are listed in Figure 55.
Figure 55: Suggested improvements to assessment process
| Suggestion | Percentage |
|---|---|
| No improvements necessary | 72% |
| More information prior to the call | 6% |
| General improvements in assessment conduct/service provision | 5% |
| More information on the next stages/support following the call | 4% |
| Having it face-to-face | 3% |
| Improvements in the assessors behaviour | 2% |
| Having a friend or relative present | 2% |
| Having someone who understands the condition | 2% |
| More suitable questions (for example, tailored/non-tick box) | 2% |
| Having a longer assessment/more time to explain condition | 1% |
| Using video | 1% |
| Better technology | 1% |
| Using video | 1% |
| Other | 1% |
| Having a shorter assessment | 1% |
Base: All respondents who answered this question (n=1072).
Note: Some respondents provided multiple responses. Coded open text question.
4. Conclusions
Communication before the assessment
Nearly all claimants across both surveys (PIP – 90 per cent, WCA – 89 per cent) recalled receiving a communication before the appointment giving details of the assessment, typically in a letter or phone call. While the majority of claimants found the information helpful, over one in five (28 per cent for PIP claimants and 21 per cent undergoing WCA) said they would have liked more information about what would be covered.
Nearly half (47 per cent) of PIP claimants and one in three (32 per cent) of those undergoing WCA drew on additional support or information before the assessment beyond DWP or the assessment provider, most commonly a friend or relative.
WCA survey respondents were also asked about adjustment requests. Just over one in ten of claimants (11 per cent) made at least one adjustment request before the interview, such as planning breaks, spreading the assessment over a number of calls or receiving information in large text or braille. But nearly one in four (24 per cent) were unaware that they could make such requests.
Experience of the assessment
Most claimants across both surveys (PIP- 83 per cent, WCA - 87 per cent) experienced no technical difficulties during the call. Those that did tended to report difficulties hearing or being heard over bad lines or the lines cutting out. Most claimants reported no other practical difficulties during the call but more than one in 10 (PIP - 15 per cent, WCA - 13 per cent) had problems holding the handset for the duration of the call or not being able to use a loudspeaker.
Third person support
Nearly two thirds of claimants across both surveys (PIP- 63 per cent, WCA - 65 per cent) were aware that they could have a third person present on the call for support. Those who were joined by someone to support them (PIP- 31 per cent, WCA - 22 per cent) on the call were most commonly joined by a family member.
Nine in ten (PIP - 90 per cent, WCA – 93 per cent) claimants were satisfied that the assessor called on time. Ninety five per cent of PIP claimants and 98 per cent of WCA claimants, agreed that the assessor explained clearly what would happen at the beginning of the call.
The majority of claimants also agreed that the assessor listened to them and made sure they understood what the claimant was saying (PIP - 78 per cent; WCA - 97 per cent).
Explaining and discussing condition
Just over three quarters (76 per cent) of PIP claimants and 95 per cent of those undergoing WCA assessment agreed that they were able to explain to the assessor how their condition affected their daily life. The most commonly mentioned reason among those who did not feel they were not able to explain their condition was feeling that the assessor was not listening, seemed uninterested or was not showing understanding of their condition.
Around two thirds (66 per cent) of PIP claimants and 79 per cent of those undergoing WCA reported feeling comfortable sharing information about their condition with the assessor over the phone.
Overall satisfaction
In total, three quarters of PIP claimants (75 per cent) and 94 per cent of those undergoing WCA were satisfied with how the telephone assessment was conducted. Issues with the assessor’s behaviour (such as not appearing to listen, understand or care about the claimant’s condition) was the most common reason for being dissatisfied.
Preference for assessment channels – telephone or face-to-face
Claimants were first asked, if given a choice and assuming government advice allowed, whether they would prefer a telephone or face-to-face assessment in the future. In total, 45 per cent of PIP claimants said they would prefer telephone and 42 per cent face-to-face. For those undergoing WCA, over six in ten (62 per cent of) claimants would prefer a telephone assessment, with nearly one in four (23 per cent) wanting face-to-face.
Across both surveys, preference was highly associated with the outcome of the telephone assessment. Logistic regression analysis found that PIP assessment claimants awarded PIP were more likely to prefer telephone over a face-to-face assessment even after controlling for other factors likely to influence choice. Similarly, claimants placed in the LCWRA group had a strong preference for telephone (over face-to-face) after taking their other characteristics into account.
Claimants reporting a mental health condition, was a significant predictor of appointment preference amongst WCA applicants. Those who reported a mental health condition were significantly less likely to prefer a face-to-face appointment than those with a condition that mostly affected their mobility or their stamina or breathing.
For those undergoing WCA gender was also a predictor of preference. Women had a strong preference for telephone assessments over face-to-face even after controlling for other characteristics. Men were also more likely to prefer a telephone assessment, but not to the same extent as women.
Reasons for preferring a telephone assessment included finding it easier/more comfortable, not needing to travel and it feeling less stressful. Those who preferred a face-to-face assessment reported a range of reasons, the most common being that they would be better able to explain their condition, finding it easier/more comfortable to speak to someone in person, could communicate more easily and build rapport with the assessor.
Preference for assessment channels – video
Almost two thirds of claimants (PIP- 63 per cent, WCA- 62 per cent) had experience of a video call. Over half (56 per cent) of claimants across both surveys said they would be comfortable conducting an assessment via a video call. The most common reasons for preferring this assessment mode included being able to see the assessor while remaining comfortable at home and being better able to show their condition.
Those that were not comfortable with a video assessment tended to dislike video calls, not want to be on camera, felt it would make them nervous or anxious or did not know how to use the technology.
When then asked which of the three channels they would prefer for an assessment, 15 per cent of PIP claimants and 13 per cent of those undergoing WCA changed their preference to a video call.
Again, logistic regression was used to understand better the factors that explain claimants’ preference for each of the three assessment channels over the other channels or having no preference. For PIP claimants only the assessment outcome was a significant predictor of claimants’ preference from a choice of three channels - claimants with an assessment award were more likely to prefer telephone over face-to-face assessments. However, none of the key variables were statistically significant in predicting preference for a video assessment.
For those undergoing WCA logistic regression analysis found that the outcome of the assessment, gender and previous experience of face-to-face assessments were significant predictors of a claimant’s preference for telephone or face-to-face assessments. Women and those placed in the LCWRA group were significantly more likely to prefer telephone assessments, given a three-way choice, even when taking their age, health conditions and previous experience of assessments into account. When all other relevant variables were controlled for, those awaiting an assessment outcome were equally likely to prefer either telephone or face-to-face assessments. Those with previous experience of a face-to-face assessment were also slightly more likely to prefer telephone than face-to-face.
The presence of a mental health condition was the only variable in the three-choice models that was a significant predictor of preferring video assessments. Claimants who reported a mental health condition were significantly less likely to prefer video assessments than those who did not report a mental health condition.
Suggestions for improvement
When asked if anything could have improved their experience of the assessment, around half of PIP claimants (51 per cent) and three quarters (72 per cent) of those undergoing WCA did not feel any changes were necessary. For PIP claimants one in ten (10 per cent) stated that the assessment needed to be face-to-face and 8 per cent asked for more information prior to the call. Others mentioned improvements in the assessor’s behaviour, needing to talk to someone who understood their condition or having someone to support them on the call. WCA claimants also wanted more information prior to the assessment or improvements to the conduct of the assessor.