Fraud and error in the benefit system, Financial Year Ending (FYE) 2024
Published 16 May 2024
Applies to England, Scotland and Wales

© Crown copyright 2024
This publication is licensed under the terms of the Open Government Licence v3.0 except where otherwise stated. To view this licence, visit nationalarchives.gov.uk/doc/open-government-licence/version/3 or write to the Information Policy Team, The National Archives, Kew, London TW9 4DU, or email: psi@nationalarchives.gov.uk.
Where we have identified any third party copyright information you will need to obtain permission from the copyright holders concerned.
This publication is available at https://www.gov.uk/government/statistics/fraud-and-error-in-the-benefit-system-financial-year-2023-to-2024-estimates/fraud-and-error-in-the-benefit-system-financial-year-ending-fye-2024
1. Introduction
The Department for Work and Pensions (DWP) pays welfare benefits to around 22.7 million people. ‘Fraud and error in the benefit system’ estimates how much money the department incorrectly pays, either by paying people too much benefit – overpayments – or by not paying enough benefit – underpayments. This is calculated as a percentage of the total amount of benefit paid by the department – expenditure. These percentages are referred to as overpayment or underpayment rates throughout this publication. The proportion of benefit claims that are overpaid or underpaid is also reported.
The rates found are then applied to the benefit expenditure for the Financial Year Ending (FYE) 2024 to estimate the monetary amount of fraud and error. The benefit expenditure figures used are consistent with Spring Budget 2024.
Overpayments happen because of Fraud, Claimant Error and Official Error (processing errors or delays by DWP, a local authority, or His Majesty’s Revenue and Customs (HMRC)). Underpayments happen because of Official Error.
Estimates in this publication relate to benefit claims sampled between November 2022 and October 2023. See Appendix 1 or Appendix 2 for specific time periods relating to each reviewed benefit.
Analysis is undertaken to provide assurance that the sampling period is representative of the financial year. However, actions taken by the department within the financial year may not always be fully reflected within the statistics.
The next edition of these statistics will be published in May 2025.
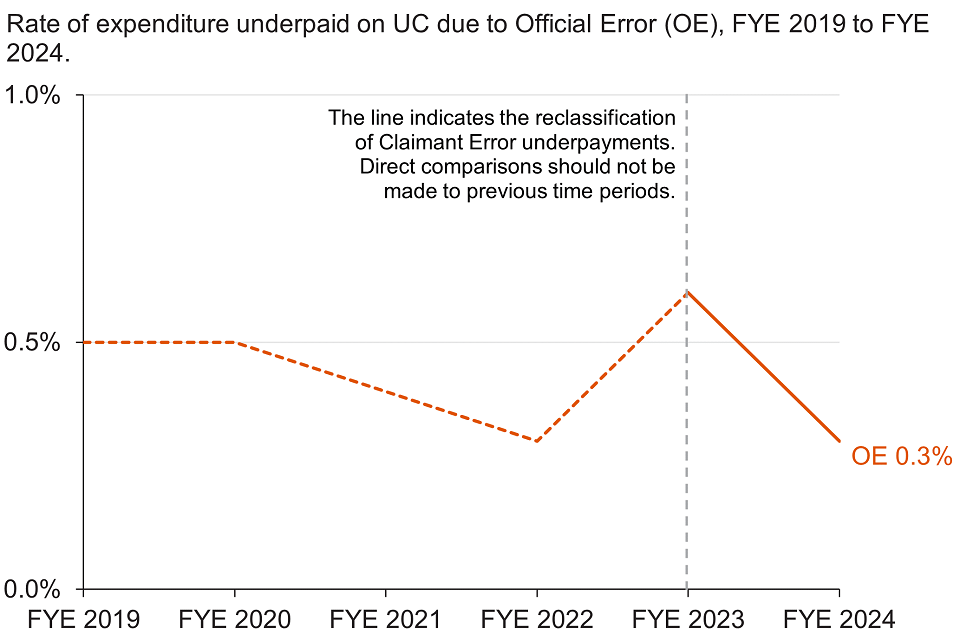
From FYE 2024 onward, estimates that were previously reported as Claimant Error underpayments have been removed from the ‘Fraud and error in the benefit system’ publication and are reported separately in a new Unfulfilled eligibility in the benefit system publication. Further details are available in section 3 of this publication. This means that references to underpayment estimates are now for Official Error only. To allow for a comparison, the FYE 2023 figures have been revised using the updated methodology.
2. Main stories
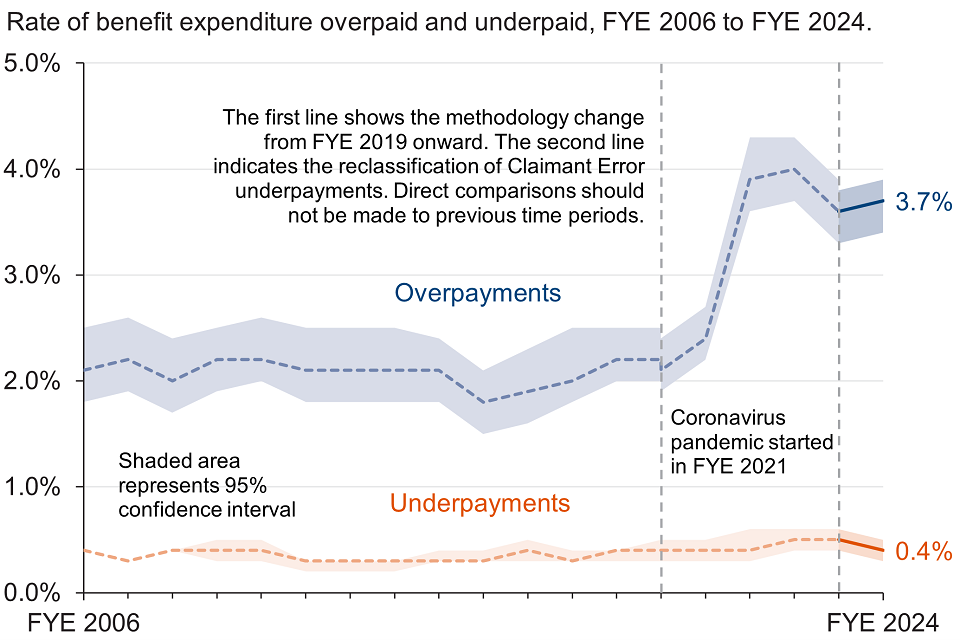
The total rate of benefit expenditure overpaid in FYE 2024 was 3.7% (£9.7bn), compared with 3.6% (£8.3bn) in FYE 2023.
The total rate of benefit expenditure underpaid in FYE 2024 was 0.4% (£1.1bn), compared with 0.5% (£1.2bn) in FYE 2023.
3. What you need to know
About this publication
This publication contains estimates of the levels of fraud and error in the benefit system. The main measure is the percentage of benefit expenditure that is overpaid or underpaid, referred to as overpayment or underpayment rates. This is also expressed as a monetary value in pounds.
DWP measures fraud and error to understand the levels, trends and reasons behind it. This understanding supports decision making on what actions DWP can take to reduce the level of fraud and error in the benefit system. The National Audit Office considers the amount of fraud and error when they audit DWP’s accounts each year.
These estimates relate to the levels of fraud and error in the benefit system in Great Britain. They are underpinned by reviews of benefit claimants in England, Wales and Scotland. The benefit expenditure figures used in this publication also include overseas residents who are receiving United Kingdom benefits, except Financial Assistance Scheme payments which also cover Northern Ireland. All other benefit expenditure on residents of Northern Ireland is the responsibility of the Northern Ireland Executive. The benefit expenditure figures do not include amounts devolved to the Scottish Government (which totalled £4.4 billion in FYE 2023).
Published tables and data
The figures in this publication are a selection from the accompanying Reference tables The tables contain further breakdowns of the estimates presented in this publication by different characteristics, with time series data going back to FYE 2006 for some benefits.
How fraud and error is measured
A sample of benefit claims is randomly selected from DWP’s administrative systems (around 13,300 were sampled for FYE 2024, or 0.06% of all benefit claims). DWP’s Performance Measurement team look at the data held on the administrative systems and then contact claimants to arrange a review.
Claimants are asked to provide evidence such as tenancy agreements, bank account details and other information that could affect their benefit claim, as part of the review.
The claim is assessed to determine whether the benefit award is correct or not. If the claim is incorrect, the amount of money the claim is wrong by is calculated. Errors on the claim are classified as one of the following:
-
Fraud
-
Claimant Error
-
Official Error
Read more about the definitions of Fraud, Claimant Error and Official Error later in this section.
Any errors identified are classified further into error reasons, which explain why the claim is incorrect. Simplified descriptions of the error reasons are given in this publication. A more detailed glossary of the error reasons can be found in Appendix 3 of the background information document.
Fraud and error measures – rates and monetary values
The monetary value of fraud and error is calculated using the rate of expenditure overpaid or underpaid that was found in the sample for benefits measured this year:
Monetary value overpaid or underpaid = (rate of expenditure overpaid or underpaid) x (benefit expenditure)
It is possible for the rate of expenditure overpaid or underpaid to decrease whilst the monetary value increases and vice versa. This happens because of changes in benefit expenditure between the years compared.
For example: The total rate of overpayments on Universal Credit (UC) was 12.4% in FYE 2024, compared with 12.7% in FYE 2023. The associated monetary value of overpayments was £6,500m in FYE 2024, compared with £5,500m in FYE 2023. The rate of overpayments was higher in FYE 2023, whilst the monetary value was lower. This is because of the higher expenditure on UC in FYE 2024.
The monetary values are not adjusted for inflation.
It is recommended that the rates are used when comparing over time for these reasons, rather than the monetary amounts.
Fraud and error measures – proportion of claims with fraud or an error
In this publication, we report the proportion of claims paid the incorrect amount, including whether they are overall overpaid or underpaid (reference table 11), as well as the proportion of claims with an overpayment error or an underpayment error (reference tables 12 and 13).
These measures are different because a claim can have both an overpayment error or Fraud and an underpayment error for different error reasons. For example: a claimant is receiving a benefit payment of £100. Two errors are found on the claim. The first is an overpayment error totalling £50. The second is an underpayment error totalling £20. The correct benefit payment for the claimant is £70 (£100 original payment minus £50 overpaid plus £20 underpaid). The claimant is overpaid by £30 after considering all errors.
Such claims are included in both the proportion of claims with an overpayment error or Fraud (reference table 12) and the proportion of claims with an underpayment error (reference table 13). Claims are reported as either overpaid or underpaid within reference table 11, depending on the outcome of their combined overpayment and underpayment errors. In the example above, the claim would be reported as having been overpaid in reference table 11.
The measures are calculated as follows:
Proportion of claims with an overpayment or underpayment (reference tables 12 and 13):
Proportion of claims with Fraud or an overpayment error = (number of claims in the sample with at least one Fraud or at least one overpayment error) / (number of claims in the sample)
Proportion of claims with an underpayment error = (number of claims in the sample with at least one underpayment error) / (number of claims in the sample)
Since the same claim can be included in both the proportion of claims with an overpayment error or Fraud and the proportion of claims with an underpayment error, these figures cannot be summed together to obtain the total proportion of claims paid incorrectly.
Proportion of claims paid the incorrect amount (reference table 11):
Proportion of claims overpaid = (number of claims in the sample ultimately overpaid) / (number of claims in the sample)
Proportion of claims underpaid = (number of claims in the sample ultimately underpaid) / (number of claims in the sample)
These figures can be summed together to obtain the total proportion of claims paid incorrectly.
De Minimis reporting
For all measures relating to the proportion of claims with Fraud or an error, we have introduced a de minimis approach across all benefits since FYE 2023. This means that all errors of 10p or less are reported separately to the headline measures of the proportion of claims with Fraud or an error. The State Pension section in this publication and section 2 of the background information document provide further information.
Methodology changes and revisions
Two changes have been made to the methodology used to produce estimates of fraud and error this year. Estimates for FYE 2023 have been revised using the updated methodology and are included in this publication to allow for comparison with FYE 2024.
A planned review of the ‘Fraud and error in the benefit system’ statistics determined that the estimates previously published as Claimant Error underpayments should not be defined as underpayments. In the benefit legislation, claimants are not eligible for increases in their benefit until they accurately report their circumstances and provide evidence to the department. As these statistics feed directly into the department’s accounts, we have decided that our methodology should measure in line with the legislation. Due to this, estimates that were previously reported as Claimant Error underpayments have been removed from the ‘Fraud and error in the benefit system’ publication and are reported separately in a new Unfulfilled eligibility in the benefit system publication. These new estimates are calculated using very similar methodology to that used previously for Claimant Error underpayments, with one difference relating to the netting adjustment that has minimal impact on the estimates. Further details are available in section 2 of the background information document.
Claims where the claimant has participated in the benefit review but has then failed to provide the requested evidence, subsequently having their claim terminated, and there was no previous suspicion around the area the evidence was requested for, are categorised as fraud due to ‘Failure to Provide Evidence’. There is already an adjustment made where we look four months after their claim was terminated to see if we can find any evidence that would allow us to reclassify the fraud to a known reason. This year we expanded this adjustment to see if we can find any evidence that would allow us to remove the fraud entirely (for example if we can see evidence of earnings coming through in the month after the benefit was terminated, which would result in a nil award). Although this change impacts all benefits, for FYE 2023 it was only Universal Credit that needed to be revised, where around £100m was removed from the Failure to provide Evidence Fraud. Further details are available in section 2 of the background information document.
Statistical significance and confidence intervals
These estimates are based on a sample of benefit claims receiving a monetary payment. Choosing another sample may have given different estimates. The figures quoted in this publication are the central estimates, which are calculated from the sample. A range around the central estimates, called a confidence interval, is also calculated. This expresses the uncertainty associated with the central estimate. A simplified view is that the confidence interval provides a range of plausible values within which the true value for the population lies. See section 5 of the background information document for further detail.
Changes between years are noted as being statistically significant when the difference observed is likely to reflect a true change at the population level, rather than random variation between the samples. Any statistically significant changes between the years being compared are specified in this publication.
Definitions of Fraud, Claimant Error and Official Error
In this publication incorrect claims are classified as follows:
Fraud
Claims where all three of the following conditions apply:
-
the conditions for receipt of benefit, or the rate of benefit in payment, are not being met
-
the claimant can reasonably be expected to be aware of the effect on their entitlement
-
benefit payment stops or reduces as a result of the claim review
Claimant Error
The claimant has provided inaccurate or incomplete information, or failed to report a change in their circumstances, but there is no evidence of fraudulent intent on the claimant’s part.
Official Error
The benefit has been paid incorrectly due to a failure to act, a delay or a mistaken assessment by DWP, a local authority or HMRC, to which no one outside of that department has materially contributed.
4. Total estimates of fraud and error across all benefit expenditure
Total benefit expenditure increased from £233.8bn in FYE 2023 to £266.2bn in FYE 2024. This was an increase of £32.4bn (13.9%) which was mainly due to:
-
State Pension expenditure increasing by £14.2bn (12.9%), from £109.7bn in FYE 2023 to £123.9bn in FYE 2024
-
Universal Credit expenditure increasing by £8.5bn (19.6%), from £43.4bn in FYE 2023 to £51.9bn in FYE 2024
-
Personal Independence Payment expenditure increasing by £3.9bn (22.0%), from £17.7bn in FYE 2023 to £21.6bn in FYE 2024
-
Cost of Living Payments expenditure increasing by £1.8bn (21.4%), from £8.4bn in FYE 2023 to £10.2bn in FYE 2024
The estimates in this section are for fraud and error across all benefit expenditure.
Overpayments
The total rate of benefit expenditure overpaid in FYE 2024 was 3.7% (£9.7bn), compared with 3.6% (£8.3bn) in FYE 2023.
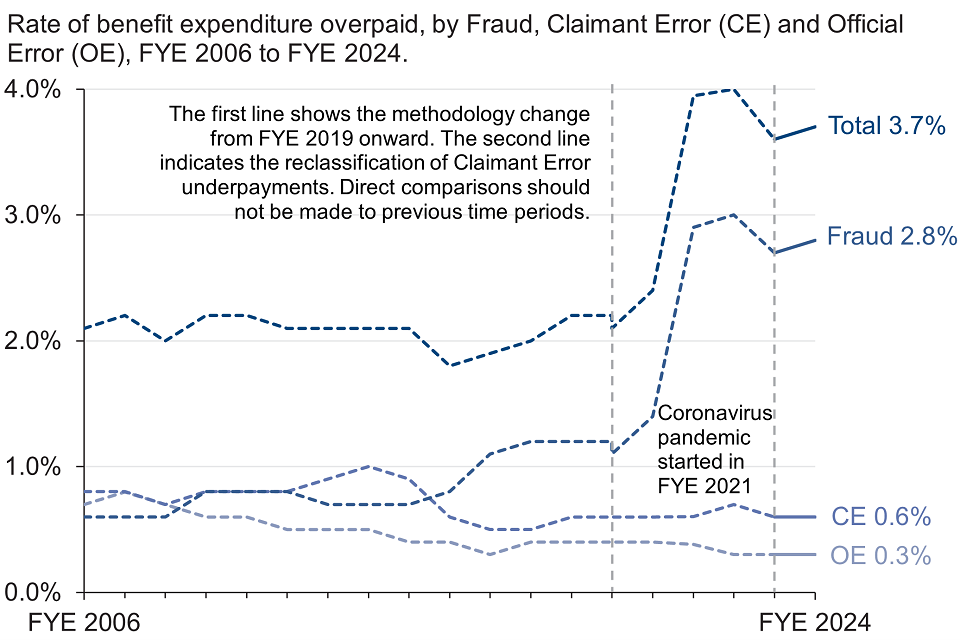
Overpayments due to Fraud were 2.8% (£7.4bn) in FYE 2024, compared with 2.7% (£6.3bn) in FYE 2023.
Overpayments due to Claimant Error remained at 0.6% in FYE 2024 (£1.6bn), the same as in FYE 2023 (£1.4bn).
Overpayments due to Official Error remained at 0.3% in FYE 2024 (£0.8bn), the same as in FYE 2023 (£0.7bn).
Underpayments
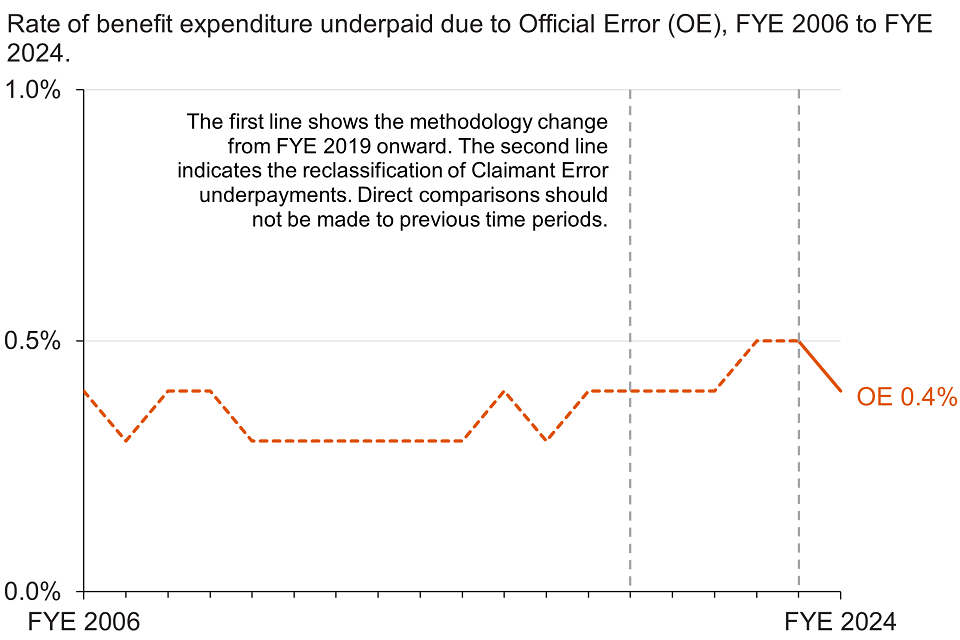
The total rate of benefit expenditure underpaid in FYE 2024 was 0.4% (£1.1bn), compared with 0.5% (£1.2bn) in FYE 2023.
Net loss from overpayments
DWP can recover overpayments from people – this means not all of the £9.7bn is lost, and we can describe a net loss figure which deducts recoveries from total overpayments. In FYE 2024, we recovered £1.1bn of overpayments (£0.4bn Housing Benefit and £0.7bn other DWP benefits). This compares to £1.0bn recovered in FYE 2023 (£0.4bn Housing Benefit and £0.6bn other DWP benefits).
Note that some recoveries made by DWP are not included in our net loss estimate as they do not relate to our fraud and error reporting (mainly recoveries of tax credits and of benefit advances).
The net rate of loss from overpayments in FYE 2024 was 3.2% (£8.6bn) compared with 3.1% (£7.3bn) in FYE 2023.
5. Universal Credit overpayments and underpayments
Universal Credit (UC) is a payment to help with living costs for people who are in work on a low income, or for those who are out of work. Eligibility for UC depends on individual circumstances and location.
The expenditure on UC increased to £51.9bn in FYE 2024, compared with £43.4bn in FYE 2023.
Advance payments of UC are not part of the benefit payment itself and consequently are not reviewed for fraud and error. See section 3 of the background information document for further information.
Overpayments
The Universal Credit overpayment rate was 12.4% (£6,460m) in FYE 2024, compared with 12.7% (£5,500m) in FYE 2023.
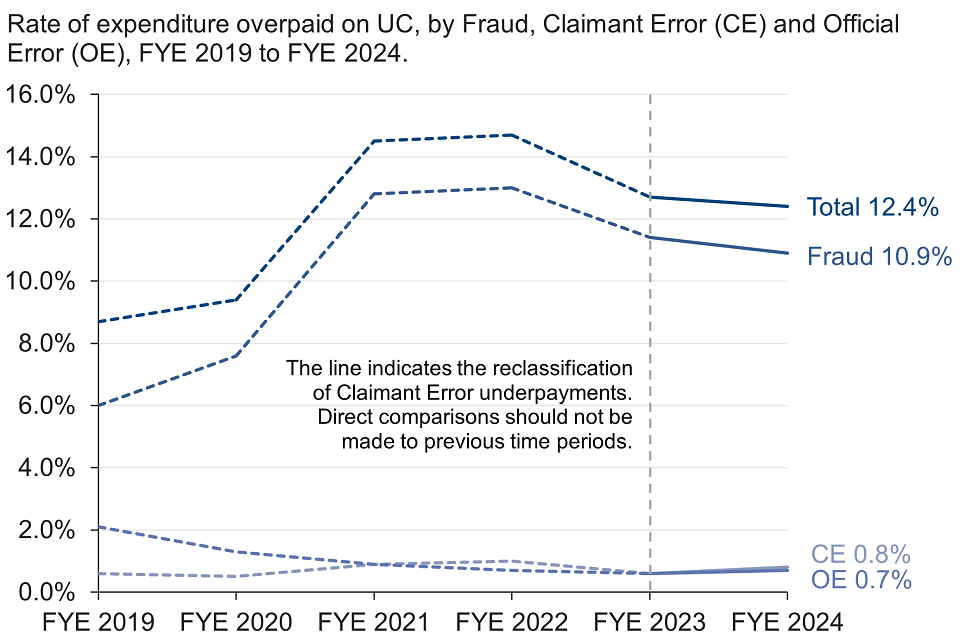
Overpayments due to Fraud were 10.9% (£5,660m) in FYE 2024, compared with 11.4% (£4,930m) in FYE 2023.
The largest decrease in Fraud overpayments was in the Living Together category which decreased to 1.6% in FYE 2024 from 2.2% in FYE 2023. This change was statistically significant.
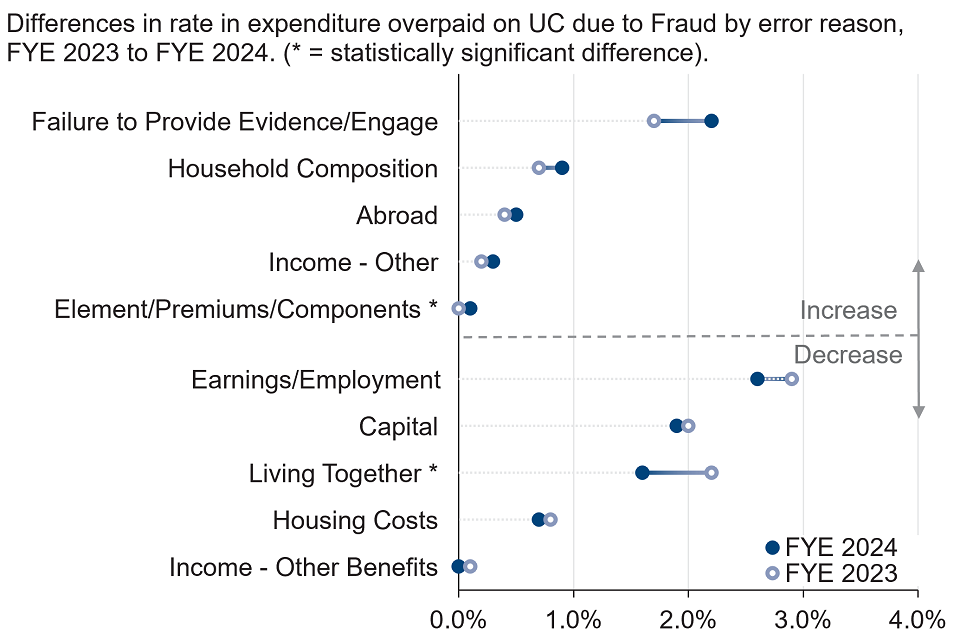
Under-declaration of income from work undertaken (Earnings/Employment) remained the largest error reason for Fraud overpayments in FYE 2024. It was measured at 2.6% in FYE 2024, compared with 2.9% in FYE 2023.
Failure to Provide Evidence/Engage was the second largest error reason for overpayments in FYE 2024. It was measured at 2.2% in FYE 2024, compared with 1.7% in FYE 2023.
Under-declaration of financial assets (Capital) was the third largest source of Fraud overpayments. It was measured at 1.9% in FYE 2024, compared with 2.0% in FYE 2023.
The award of UC can include several extra elements besides the standard allowance. Fraud relating to these elements (Element/Premiums/Components) saw an increase to 0.1% in FYE 2024 from 0.0% in FYE 2023. This change was due to an increase in the number of incorrect Carer Element claims and was statistically significant.
Overpayments due to Claimant Error were 0.8% (£410m) in FYE 2024, compared with 0.7% (£290m) in FYE 2023.
Overpayments due to Official Error were 0.7% (£380m) in FYE 2024, compared with 0.6% (£270m) in FYE 2023.
The proportion of Universal Credit claims overpaid was 22 in 100 claims in FYE 2024, compared with 24 in 100 claims in FYE 2023. This was a statistically significant decrease.
Underpayments
The Universal Credit underpayment rate was 0.3% (£180m) in FYE 2024, compared with 0.6% (£240m) in FYE 2023.
Official Error related to the calculation of housing costs (Housing Costs) remained one of the largest sources of underpayments. It was measured at 0.1% in FYE 2024, compared with 0.2% in FYE 2023.
The proportion of Universal Credit claims underpaid was 1 in 100 claims in FYE 2024, compared with 2 in 100 claims in FYE 2023. This was a statistically significant decrease.
6. State Pension overpayments and underpayments
State Pension (SP) is paid to those who have reached the minimum age to claim (currently 66 years old) and have enough qualifying years on their National Insurance record. SP is the benefit with the highest expenditure, accounting for a little under half of total benefit expenditure. SP expenditure increased to £123.9bn in FYE 2024, compared with £109.7bn in FYE 2023.
Claimants who live overseas and have reported a non-GB address are not part of the SP review. An adjustment is made to the calculation on overseas Fraud and Claimant Error, concerning the late/non-notification of death, and is applied to the overpayment rates. Further information on this can be found in the background information document.
Overpayments
The State Pension overpayment rate remained at 0.1% in FYE 2024 (£170m), the same as in FYE 2023 (£100m).
Overpayments due to Official Error remained at 0.0% in FYE 2024 (£20m), the same as in FYE 2023 (£40m).
Overpayments due to Claimant Error remained at 0.1% in FYE 2024 (£70m), the same as in FYE 2023 (£60m).
Overpayments due to Fraud were 0.1% (£80m) in FYE 2024, compared with 0.0% (£0m) in FYE 2023.
The proportion of State Pension claims overpaid was 1 in 100 in FYE 2024, compared with 2 in 100 in FYE 2023.
Underpayments
The State Pension underpayment rate was 0.4% (£470m) in FYE 2024, compared with 0.5% (£580m) in FYE 2023.
The largest reason for underpayments were errors relating to incorrect recording of claimants’ national insurance contributions (Contributions), where the rate was 0.2% in FYE 2024, compared with 0.1% in FYE 2023. The main error within this category continued to be around the historic recording of Home Responsibilities Protection (HRP), administered by HMRC. HRP was a scheme existing from 1978 to 2010 to protect the State Pension entitlement of people with domestic caring responsibilities. HRP reduced the number of qualifying years needed to get a full basic State Pension. Some people have not had all eligible years of HRP recorded on their National Insurance records, and so have an incomplete record affecting their State Pension entitlement.
Errors relating to the department failing to act on reported changes to marital status or at age related trigger points (Control activities) was the second largest source of underpayments at 0.1% in FYE 2024, compared with 0.3% in FYE 2023. The main type of underpayments found within this category for FYE 2024 were on those who have been widowed and their SP was not uplifted to include amounts they are entitled to inherit from their late husband, wife, or civil partner.
Errors that occurred on the additional components of SP that people might have received on top of their basic state pension (Element/Premium/Components) decreased to 0.0% in FYE 2024 from 0.1% in FYE 2023. This decrease was statistically significant.
The proportion of State Pension claims underpaid was 5 in 100 claims in FYE 2024, compared with 6 in 100 claims in FYE 2023.
7. Personal Independence Payment overpayments and underpayments
Personal Independence Payment (PIP) helps with extra costs caused by long-term disability or ill-health. From April 2013, PIP started to replace Disability Living Allowance (DLA) for people of working age.
The expenditure on PIP increased to £21.6bn in FYE 2024 from £17.7bn in FYE 2023.
Overpayments
The Personal Independence Payment overpayment rate was at the lowest recorded level of 0.4% (£90m) in FYE 2024, compared with 1.1% (£200m) in FYE 2023, which was a statistically significant decrease.
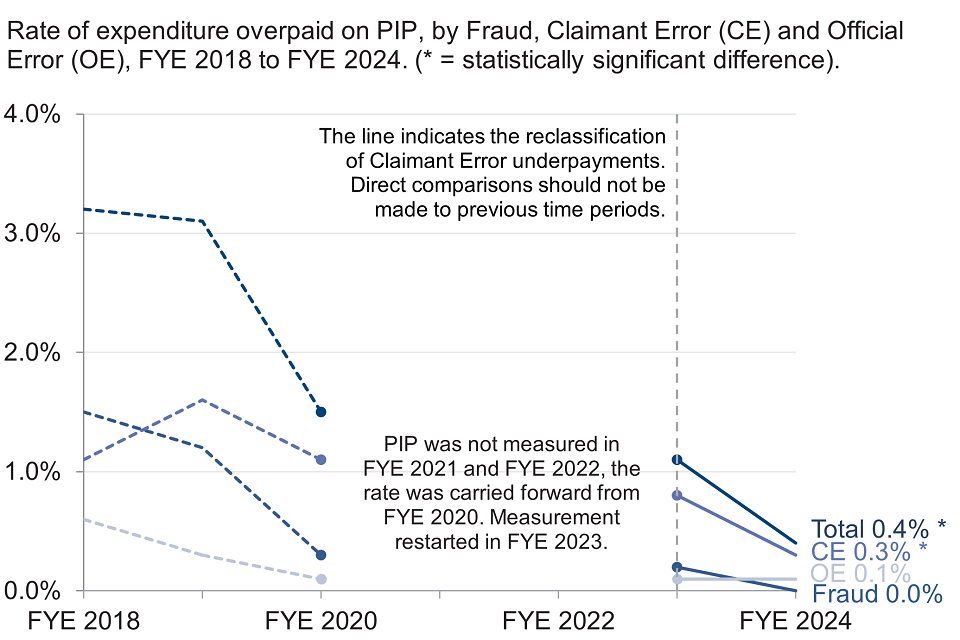
The statistically significant decrease in the total overpayment rate was driven by a statistically significant decrease in Claimant Error overpayment rate to 0.3% in FYE 2024 from 0.8% in FYE 2023.
The majority of overpayments in FYE 2024 happened because the claimants failed to report an improvement in their needs (Functional Needs). This accounted for £6 in every £10 overpaid. Functional Needs decreased to 0.3% in FYE 2024, compared with 0.9% in FYE 2023. This was a statistically significant decrease and the lowest rate since FYE 2018. Functional Needs were the main reason for all Claimant Error overpayments reported in FYE 2024.
The rate of cases excluded from the headline overpayment estimates due to a categorisation of Not Reasonably Expected to Know (Not RETK) was 2.0% in FYE 2024, compared to 1.4% in FYE 2023. This is where the claimant was incorrectly overpaid, but we would not reasonably expect them to know to report the change. Not RETK cases are all Claimant Error cases with error reason Functional Needs. Further information can be found in the background information document.
The proportion of Personal Independence Payment claims overpaid in FYE 2024 was 1 in 100 claims, remaining the same as in FYE 2023. These proportions do not include the Not RETK cases.
Underpayments
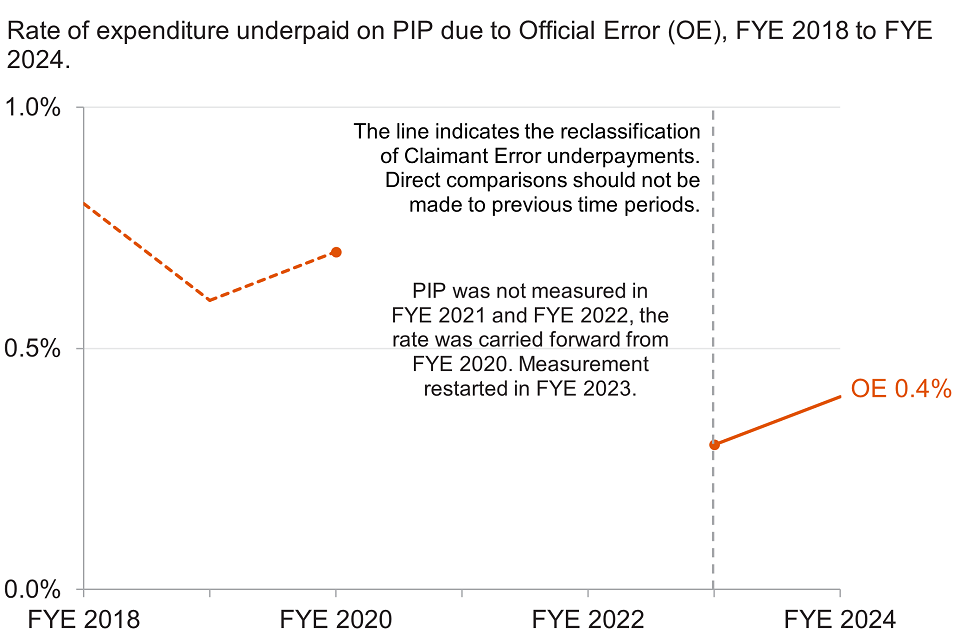
The Personal Independence Payment underpayment rate was 0.4% (£80m) in FYE 2024, compared with 0.3% (£60m) in FYE 2023.
Underpayments were mainly caused by the department making errors when determining the appropriate award levels (Award Determination). This error category accounted for 75% of the underpayment rate.
The proportion of Personal Independence Payment claims underpaid in FYE 2024 was 1 in 100 claims, remaining the same as in FYE 2023.
8. Housing Benefit overpayments and underpayments
Housing Benefit (HB) can help pay rent for people who are unemployed, on a low income, or claiming benefits. How much the claimant can get depends on their income and circumstances. For working age people, HB is being replaced by Universal Credit (UC), so this group will gradually move onto UC. Working age people cannot make new claims for HB unless they are in supported, sheltered, or temporary housing. Pension age people can continue to make new claims for HB.
The expenditure on Housing Benefit increased to £15.5bn in FYE 2024, compared with £15.0bn in FYE 2023.
These estimates relate to all of Housing Benefit, but estimates are also published separately for working age and pension age claimants (see reference tables). These two groups are made up of “passported” claims (who get HB because they receive another qualifying income-related benefit) and “non-passported” claims (who get HB without one of these qualifying benefits). This means that HB is made up of four groups: passported working age, non-passported working age, passported pension age, and non-passported pension age. The four groups are combined for the total HB estimates.
In FYE 2024, DWP reviewed passported and non-passported pension age claims. The estimates for the other groups relate to reviews undertaken in previous years. Non-passported working age was last reviewed in FYE 2023 and passported working age in FYE 2019. The rates of fraud and error found when each group was last measured have been applied to the FYE 2024 expenditure.
Overpayments
The Housing Benefit overpayment rate was 6.3% (£980m) in FYE 2024, compared with 5.7% (£860m) in FYE 2023.
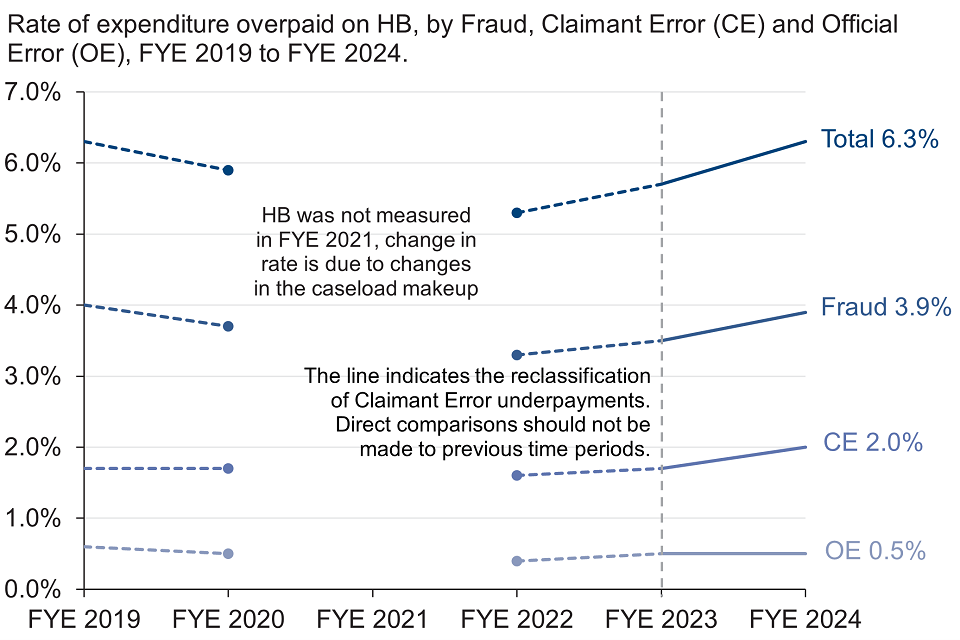
The change in the total overpayment rate for HB was recorded mainly due to a statistically significant increase in Pension Age Housing Benefit expenditure overpaid, increasing to 7.1% (£440m) in FYE 2024 from 5.0% (£280m) in FYE 2023.
Overpayments due to Fraud were 3.9% (£600m) in FYE 2024, compared with 3.5% (£530m) in FYE 2023. This was mainly driven by a statistically significant increase in Pension Age Housing Benefit Fraud, increasing to 4.0% (£240m) in FYE 2024 from 2.6% (£150m) in FYE 2023.
Overpayments due to Claimant Error were 2.0% (£300m) in FYE 2024, compared with 1.7% (£260m) in FYE 2023. This was mainly driven by a statistically significant increase in Pension Age Housing Benefit Claimant Error, increasing to 2.7% (£160m) in FYE 2024 from 1.9% (£110m) in FYE 2023.
Overpayments due to Official Error remained at 0.5% in FYE 2024 (£70m), the same as in FYE 2023 (£70m).
Under-declaration of financial assets (Capital) was the main reason for the changes across total Housing Benefit overpayments. At a total level, Capital increased to 2.2% in FYE 2024, compared with 1.3% in FYE 2023. This increase was statistically significant.
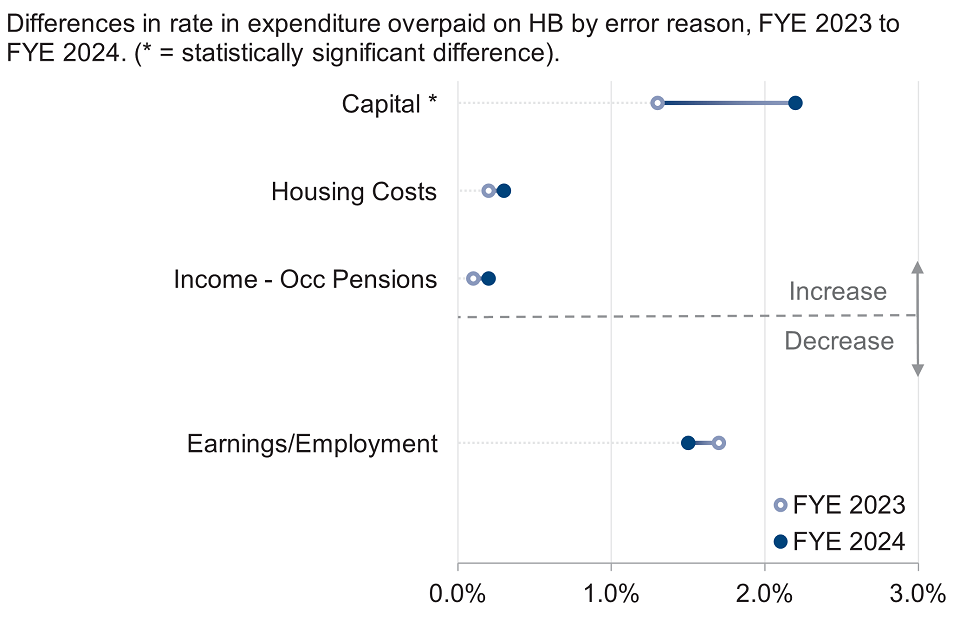
Capital is now the largest cause of total HB Fraud overpayments, increasing to 1.3% in FYE 2024, compared with 0.7% in FYE 2023. This increase was statistically significant.
Claimant Error overpayments due to Capital increased to 0.8% in FYE 2024, compared with 0.5% in FYE 2023. This increase was statistically significant.
The proportion of Housing Benefit claims overpaid was 17 in 100 claims in FYE 2024, remaining the same as in FYE 2023.
Underpayments
The Housing Benefit underpayment rate remained at 0.4% in FYE 2024 (£50m), the same as in FYE 2023 (£60m).
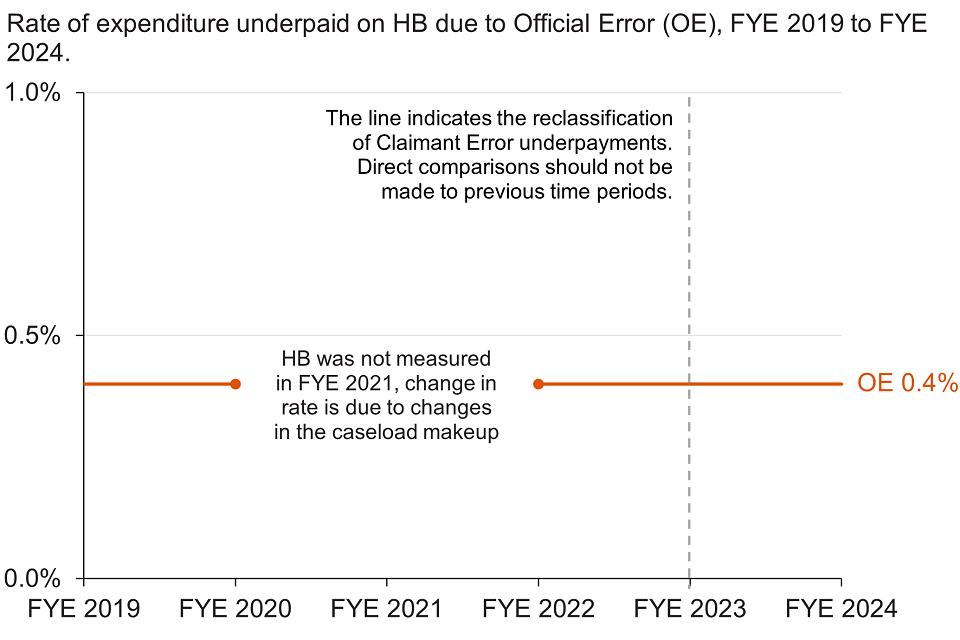
There was a statistically significant decrease in underpayments due to the Local Authority recording the income from other benefits incorrectly (Income – Other Benefits). This error reason was recorded at 0.0% in FYE 2024, compared with 0.1% in FYE 2023. The decrease in Income – Other Benefits was due to a statistically significant fall in measured pension age client groups, to 0.0% in FYE 2024, compared with 0.2% in FYE 2023.
The proportion of Housing Benefit claims underpaid was 2 in 100 claims in FYE 2024, compared with 4 in 100 claims in FYE 2023.
9. Disability Living Allowance overpayments and underpayments
Disability Living Allowance (DLA) helps with extra costs caused by long-term disability or ill-health. From April 2013, Personal Independence Payment (PIP) started to replace DLA for people of working age. Adults are still in receipt of DLA, however new claims can only be made for children.
DLA has not been measured for fraud and error since FYE 2005. In FYE 2024, working age (WA) group has been excluded from the review as any changes in the benefit would mean that the claimant would need to switch to PIP, their DLA claim would end and therefore no over/underpayment could be recorded against DLA. More information on how working age rates have been estimated can be found in the background information document.
Due to the difference in methodology used to measure DLA in FYE 2005 and FYE 2024, the change to the benefit between the two years and the exclusion of working age group in FYE 2024, a direct comparison of current and previous rates is not appropriate.
The expenditure on DLA was £6.8bn in FYE 2024.
Overpayments
The Disability Living Allowance overpayment rate was 0.5% (£30m) in FYE 2024.
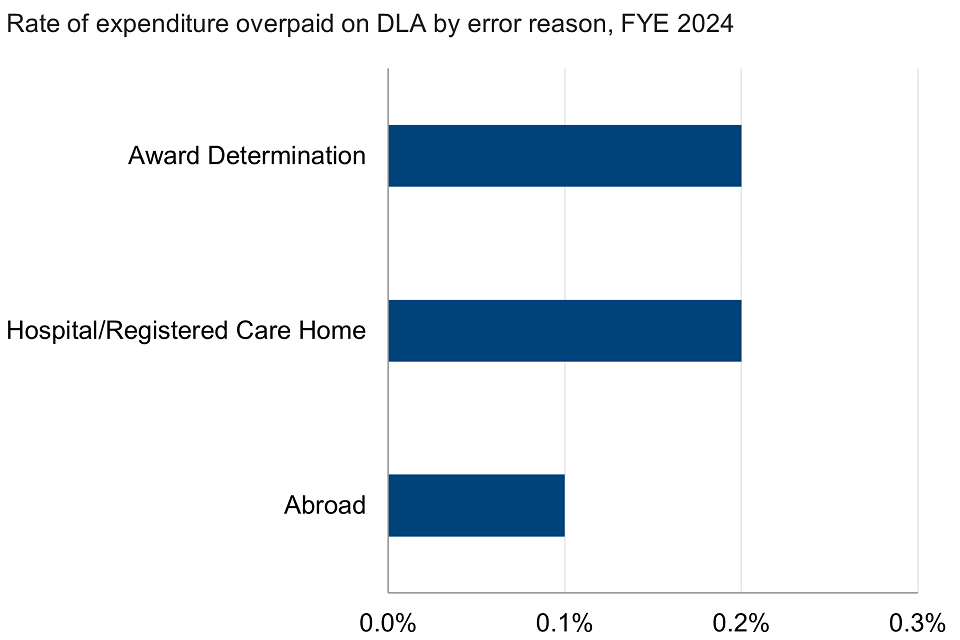
Overpayments due to Claimant Error were 0.2% (£10m) in FYE 2024, mainly due to the claimants failing to report extended stays in hospitals and care homes (Hospital/Registered Care Home).
The rate of cases excluded from the headline overpayment estimates due to a categorisation of Not Reasonably Expected to Know (Not RETK) was 1.1% in FYE 2024. This is where the claimant was incorrectly overpaid, but we would not reasonably expect them to know to report the change. Not RETK cases are all Claimant Error cases with error reason Functional Needs. Further information can be found in the background information document.
Overpayments due to Fraud were 0.1% rounded to £0m) in FYE 2024, attributed to claimants remaining abroad longer than is allowed (Abroad).
Overpayments due to Official Error were 0.2% (£10m) in FYE 2024, mainly attributed to the department making errors when allocating the appropriate award levels (Award Determination). The main error within this category was Incorrect Determination of Care Needs, where the care component was not awarded at the appropriate level.
The proportion of Disability Living Allowance claims overpaid in FYE 2024 was 4 in 100 claims. These proportions do not include the Not RETK cases.
Underpayments
The Disability Living Allowance underpayment rate Error was 1.0% (£70m) in FYE 2024.
All underpayments were caused by the department making errors when allocating the appropriate award levels (Award Determination). The main error within this category was Incorrect Determination of Care Needs, where the care component was not awarded at the appropriate level.
The proportion of Disability Living Allowance claims underpaid in FYE 2024 was 3 in 100 claims.
10. Pension Credit overpayments and underpayments
Pension Credit (PC) provides support to people who have reached State Pension age and reside in Great Britain. Guarantee Credit tops up any other income to a ‘standard minimum guarantee’ amount and additional amounts may be payable in certain circumstances, for example, severe disability. Savings Credit is an extra payment for those who have made some additional provision for their retirement through, for example, an occupational pension or savings. Those reaching State Pension age from 6 April 2016 are not eligible for Savings Credit.
The expenditure on PC increased to £5.4bn in FYE 2024, compared with £4.9bn in FYE 2023.
Overpayments
The Pension Credit overpayment rate was 9.7% (£520m) in FYE 2024, compared with 6.8% (£330m) in FYE 2023. This increase was statistically significant.
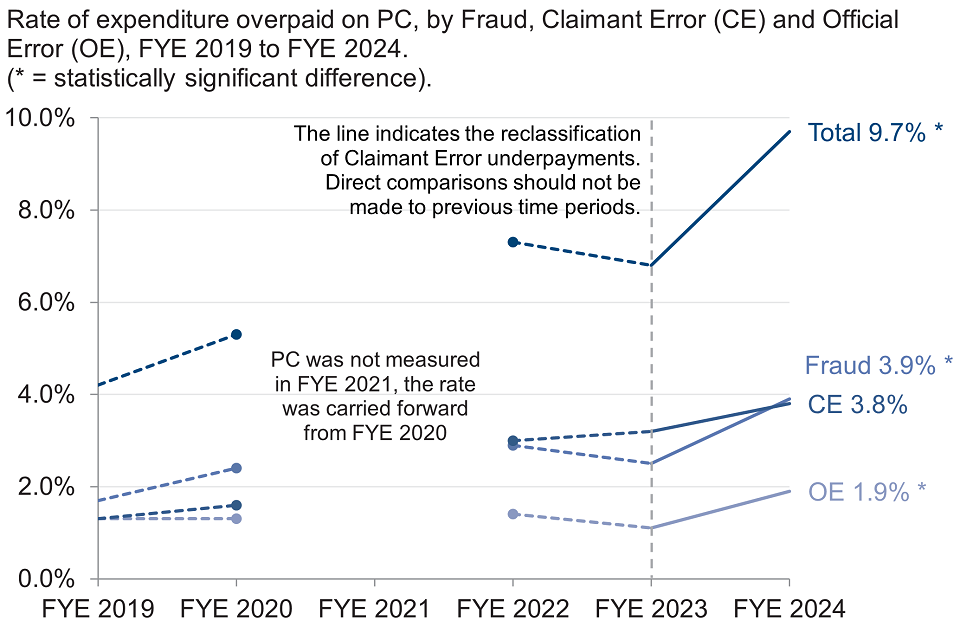
Under-declaration of financial assets (Capital) and claimants remaining abroad for a longer period than is allowed (Abroad) remained the two main causes of overpayments and accounted for over £5 in every £10 overpaid on PC in FYE 2024.
Overpayments due to Fraud increased to 3.9% (£210m) in FYE 2024, compared with 2.5% (£120m) in FYE 2023. This was a statistically significant increase.
There has been a statistically significant increase in Fraud overpayments due to single claimants who failed to declare living with a partner (Living Together). It has increased to 0.3% in FYE 2024, compared with 0.0% in FYE 2023.
Overpayments due to Official Error increased to 1.9% (£100m) in FYE 2024, compared with 1.1% (£60m) in FYE 2023. This was a statistically significant increase.
There has been a statistically significant increase in Official Error overpayments due to Income – Occupational and Personal Pensions. It has increased to 0.1% in FYE 2024, compared with 0.0% in FYE 2023.
Overpayments due to Claimant Error were 3.8% (£210m) in FYE 2024, compared with 3.2% (£160m) in FYE 2023. This was the highest recorded level to date.
The proportion of Pension Credit claims overpaid was 28 in 100 claims in FYE 2024, compared with 24 in 100 claims in FYE 2023. This was a statistically significant increase.
Underpayments
The Pension Credit underpayment rate remained at 1.0% in FYE 2024 (£50m), the same as in FYE 2023 (£50m).
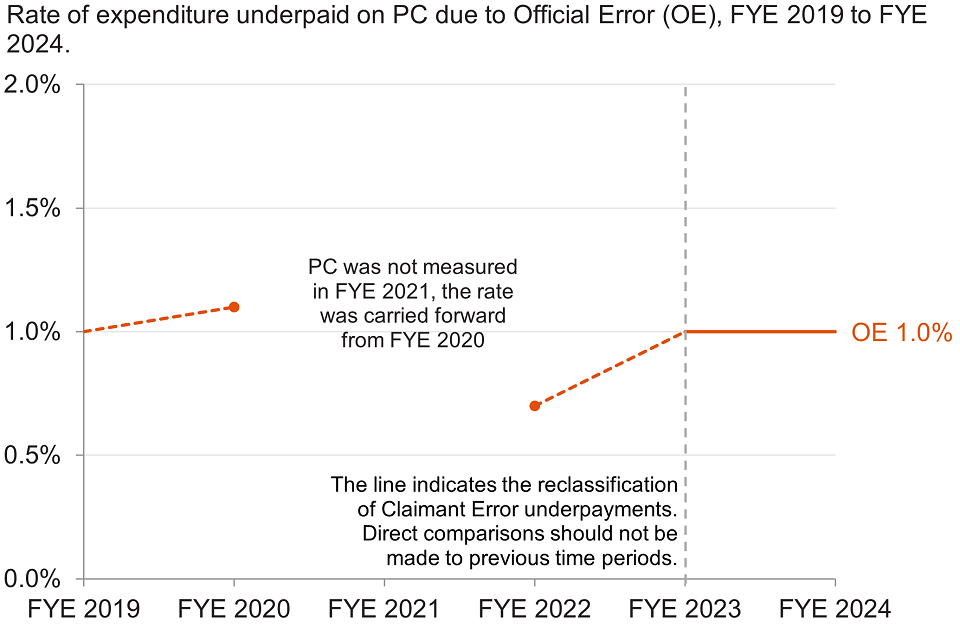
Additional amounts of PC can be paid if a claimant meets certain conditions, they are often called premiums. Official Error where the department has incorrectly underpaid any additional amounts (Element/Premium/Components) remained the main cause of underpayments and accounted for over £6 in every £10 underpaid in FYE 2024. These errors mostly related to an unpaid additional amount for severe disability.
There has been a statistically significant decrease in underpayments due to Income – Occupational and Personal Pensions. It has decreased to 0.0% in FYE 2024, compared with 0.1% in FYE 2023.
The proportion of Pension Credit claims underpaid remained at 4 in 100 claims in FYE 2024, the same as in FYE 2023.
11. Cost of Living Payments overpayments and underpayments
The department made extra payments to recipients of certain benefits, called Cost of Living Payments, for the first time in FYE 2023, and these continued into FYE 2024. These payments were made to help claimants with the increased cost of living. The table below shows the benefits that qualified the claimants for a Cost of Living Payment paid by DWP.
| Benefit Type | Qualifying benefit |
|---|---|
| Low-income | Universal Credit |
| Low-income | Pension Credit |
| Low-income | Income-Based Jobseeker’s Allowance |
| Low-income | Income Support |
| Low-income | Income-Related Employment and Support Allowance |
| Disability | Personal Independence Payment |
| Disability | Armed Forces Independence Payment |
| Disability | Attendance Allowance |
| Disability | Disability Living Allowance |
| Pensioner | Winter Fuel Payments |
The expenditure on Cost of Living Payments increased to £10.2bn in FYE 2024, compared with £8.4bn in FYE 2023.
Fraud and error on Cost of Living Payments was not directly measured in FYE 2024. Estimates were produced by assuming that fraud and error could only occur when claimants were incorrectly receiving the qualifying benefit. In this situation, the claimant does not have entitlement to the qualifying benefit, and they are overpaid the full amount of the Cost of Living Payments.
Most of the benefits that qualify the claimant to this additional payment have been measured either in FYE 2024 or in recent years. The loss of entitlement rates from when each qualifying benefit was last measured were applied to the Cost of Living Payments expenditure relating to that benefit. The amount of Cost of Living Payments overpaid from each qualifying benefit was then summed to give monetary estimates. These were divided by the Cost of Living Payments expenditure to give the overpayment rate estimates.
This methodology means that no underpayments were estimated on Cost of Living Payments for FYE 2024.
The background information document provides more information on Cost of Living Payments, how the estimates were calculated and omissions relating to the estimates.
The Cost of Living Payments overpayment rate was 5.4% (£550m) in FYE 2024, compared to 4.8% (£400m) in FYE 2023.
Similar to FYE 2023, Cost of Living Payments had the sixth highest expenditure in FYE 2024, and the associated overpayment monetary value of fraud and error was the third highest across all benefits.
In FYE 2024, Cost of Living Payments made to Universal Credit claimants accounts for more of the Cost of Living Payment expenditure than in FYE 2023, although the loss of entitlement rate of Universal Credit in FYE 2024 is lower than in FYE 2023.
| Qualifying benefit | Loss of entitlement rate, FYE 2024 | Loss of entitlement rate, FYE 2023 | % of CoLP expenditure, FYE 2024 | % of CoLP expenditure, FYE 2023 |
|---|---|---|---|---|
| Universal Credit | 10.2% | 11.1% | 42.3% | 34.5% |
| Pension Credit | 4.7% | 3.5% | 12.4% | 11.4% |
| Jobseeker’s Allowance | 3.3% | 3.3% | 0.3% | 0.4% |
| Income Support | 3.3% | 3.3% | 1.2% | 1.5% |
| Attendance Allowance | 2.3% | 2.3% | 2.3% | 2.7% |
| Personal Independence Payment | 2.1% | 1.9% | 5.4% | 6.0% |
| Armed Forces Independence Payment | 2.1% | 1.9% | 0.0% | 0.0% |
| Employment and Support Allowance | 1.7% | 1.7% | 9.5% | 9.8% |
| Disability Living Allowance | 0.5% | 1.9% | 2.2% | 2.5% |
| Winter Fuel Payments | 0.5% | 0.5% | 24.5% | 31.2% |
The main reason for the change in the Cost of Living Payment fraud and error rate between FYE 2023 and FYE 2024 is due to the increase in the proportion of Cost of Living Payment expenditure that is paid to Universal Credit claimants. This increase is due to the continued migration of cases onto Universal Credit. In FYE 2024 DWP were paying a higher proportion of Cost of Living Payments as claimants migrated from HMRC Tax Credits onto Universal Credit. Although the Universal Credit loss of entitlement rate went from 11.1% in FYE 2023 to 10.2% in FYE 2024, it is still more than double the next highest benefit’s loss of entitlement rate so applying this higher rate to more expenditure led to the change.
There was 4.6% (£470m) of Cost of Living Payments expenditure overpaid due to Fraud in FYE 2024, this compared to 3.8% (£310m) in FYE 2023. In both years this accounted for more than £4 in every £5 overpaid on Cost of Living Payments. Overpayments on Cost of Living Payments relating to Official Error and Claimant Error were estimated to be 0.4% (£40m) and 0.5% (£50m) in FYE 2024, compared to 0.5% (£40m) and 0.6% (£50m) in FYE 2023.
In both FYE 2024 and FYE 2023, overpayments relating to incorrectly paid low-Income benefits accounted for around £9 in every £10 overpaid on Cost of Living Payments. This was driven by the Cost of Living Payments expenditure paid to incorrectly awarded Universal Credit claims.
Within our supplementary tables the amount of fraud and error relating to Cost of Living Payments are included within the FYE 2024“Unreviewed” line on tables 1, 2, 6 and 7.
12. About these statistics
All the information underlying the charts and figures featured in this publication is included in the accompanying reference tables.
The tables show the rates and monetary values of overpayments and underpayments for each benefit, split by Fraud, Claimant Error and Official Error. The tables also show the net loss of overpayments measure, with a time series and a breakdown by benefit.
More detail about the cause of the error (for example: income, savings and who lives in the household), and the demographics of the claimants, is provided for benefits measured this year. The proportion of claims that are overpaid or underpaid and the amount of money that is incorrectly paid are also estimated.
The background information document provides further information on how the ‘Fraud and error in the benefit system’ statistics are calculated and gives a glossary of the causes of fraud and error used in this publication and the reference tables. It also contains further details on any methodological changes which have been introduced.
The publication strategy document provides further information on upcoming plans for future releases of these statistics.
User comments are welcomed and should be sent to:
National Statistics status
National Statistics are accredited official statistics. National Statistics status means that these statistics meet the highest standards of trustworthiness, quality and public value, and there is a responsibility to maintain compliance with these standards.
These official statistics were independently reviewed by the Office for Statistics Regulation in December 2017. They comply with the standards of trustworthiness, quality and value in the Code of Practice for Statistics and should be labelled ‘accredited official statistics’.
Our statistical practice is regulated by the Office for Statistics Regulation (OSR).
OSR sets the standards of trustworthiness, quality and value in the Code of Practice for Statistics that all producers of official statistics should adhere to.
You are welcome to contact us directly at enquiries.fema@dwp.gov.uk with any comments about how we meet these standards.
Alternatively, you can contact OSR by emailing regulation@statistics.gov.uk or via the OSR website.
Other National and Official Statistics
Details of other National and Official Statistics produced by DWP can be found through the following link: Statistics at DWP.
13. Contact information
Lead Statistician: Adam Pearce
Feedback or enquiries about these statistics should be directed by email to:
DWP Press Office: 0115 965 8781
Report Benefit Fraud: 0800 854 4400
Appendix 1: FYE 2024 overpayment rates and monetary values by benefit
| Expenditure (£m) | Total Rate (%) | Total Value (£m) | Fraud Rate (%) | Fraud Value (£m) | Claimant Error Rate (%) | Claimant Error Value (£m) | Official Error Rate (%) | Official Error Value (£m) | Last measured | |
|---|---|---|---|---|---|---|---|---|---|---|
| Universal Credit | 51,900 | 12.4 | 6,460 | 10.9 | 5,660 | 0.8 | 410 | 0.7 | 390 | Nov 2022 to Oct 2023 |
| State Pension | 123,900 | 0.1 | 170 | 0.1 | 80 | 0.1 | 70 | 0.0 | 20 | Nov 2022 to Oct 2023 |
| Personal Independence Payment | 21,600 | 0.4 | 90 | 0.0 | 0 | 0.3 | 60 | 0.1 | 30 | Nov 2022 to Aug 2023 |
| Housing Benefit | 15,500 | 6.3 | 980 | 3.9 | 600 | 2.0 | 300 | 0.5 | 70 | Nov 2022 to Oct 2023 |
| Employment and Support Allowance | 12,700 | 3.4 | 430 | 1.5 | 190 | 1.6 | 200 | 0.4 | 50 | Sep 2021 to Aug 2022 |
| Disability Living Allowance | 6,800 | 0.5 | 30 | 0.1 | 0 | 0.2 | 10 | 0.2 | 10 | Mar 2023 to Oct 2023 |
| Attendance Allowance | 6,700 | 2.2 | 150 | 0.0 | 0 | 1.9 | 130 | 0.3 | 20 | Oct 2020 to Aug 2021 |
| Pension Credit | 5,400 | 9.7 | 520 | 3.9 | 210 | 3.8 | 210 | 1.9 | 100 | Nov 2022 to Oct 2023 |
| Carer’s Allowance | 3,700 | 5.2 | 190 | 3.0 | 110 | 2.0 | 80 | 0.1 | 10 | May 2019 to Dec 2019 |
| Income Support | 600 | 3.9 | 20 | 2.4 | 20 | 1.0 | 10 | 0.4 | 0 | Oct 2013 to Sep 2014 |
| Jobseeker’s Allowance | 300 | 4.6 | 10 | 3.1 | 10 | 0.3 | 0 | 1.2 | 0 | Oct 2017 to Sep 2018 |
| Incapacity Benefit | 0 | 2.4 | 0 | 0.3 | 0 | 0.9 | 0 | 1.2 | 0 | Oct 2009 to Sep 2010 |
| Interdependencies | 80 | 10 | 30 | 40 | ||||||
| Never Reviewed | 17,000 | 3.4 | 570 | 2.8 | 470 | 0.3 | 50 | 0.3 | 50 | |
| Total | 266,200 | 3.7 | 9,700 | 2.8 | 7,400 | 0.6 | 1,600 | 0.3 | 800 | |
| Range | (3.4 to 3.9) | (9,000 to 10,500) | (2.5 to 3.0) | (6,700 to 8,100) | (0.5 to 0.7) | (1,400 to 1,800) | (0.2 to 0.4) | (600 to 1,000) |
Notes to Appendix 1
-
Rows and columns may not sum to totals due to rounding.
-
Approximate 95% confidence interval ranges are given for the totals in the row below them. These also allow for non-sample error in occasionally reviewed benefits and the additional uncertainty that comes from the use of older measurement periods.
-
A number of claims are removed from the headline overpayment estimates due to a review not being completed and categorised as ‘Inconclusive’. In Financial Year Ending (FYE) 2024, these claims are estimated to have a total monetary value of £1,440m (Universal Credit £830m, State Pension £160m, Housing Benefit £120m, Carer’s Allowance £40m, Personal Independence Payment £140m, Employment and Support Allowance £70m, Pension Credit £30m, Attendance Allowance £40m and Disability Living Allowance £20m).
-
Certain claims are removed from the headline overpayment estimates for Disability Living Allowance (DLA), Personal Independence Payment (PIP) and Attendance Allowance (AA) due to a categorisation of Not Reasonably Expected to Know (Not RETK). Based on Financial Year Ending (FYE) 2024 expenditure, the excluded AA figure is estimated to be £40m (£0m, £120m). The excluded PIP figure is estimated to be £430m (£300m, £570m) for FYE 2024 and the excluded DLA figure is estimated to be £70m (£50m, £100m). The numbers in brackets are 95% confidence intervals. See the “Benefit-specific adjustments” in section 5 of the background information document for more information.
-
Monetary values associated with Incapacity Benefit are displayed as zeros due to rounding.
-
Interdependencies is the knock-on effect of Disability Living Allowance (DLA) or Personal Independence Payment (PIP) fraud and error on other benefits, where receipt of DLA or PIP is a qualifying condition. It is only included for overpayments.
-
The ‘Never reviewed’ category includes benefits which were not previously reviewed and have not been historically reviewed in a particular year. This includes Cost of Living Payments.
Appendix 2: FYE 2024 underpayment rates and monetary values by benefit
| Expenditure (£m) | Official Error Rate (%) | Official Error Value (£m) | Last measured | |
|---|---|---|---|---|
| Universal Credit | 51,900 | 0.3 | 180 | Nov 2022 to Oct 2023 |
| State Pension | 123,900 | 0.4 | 470 | Nov 2022 to Oct 2023 |
| Personal Independence Payment | 21,600 | 0.4 | 80 | Nov 2022 to Aug 2023 |
| Housing Benefit | 15,500 | 0.4 | 50 | Nov 2022 to Oct 2023 |
| Employment and Support Allowance | 12,700 | 1.1 | 140 | Sep 2021 to Aug 2022 |
| Disability Living Allowance | 6,800 | 1.0 | 70 | Feb 2023 to Sep 2023 |
| Attendance Allowance | 6,700 | 0.1 | 10 | Oct 2020 to Aug 2021 |
| Pension Credit | 5,400 | 1.0 | 50 | Nov 2022 to Oct 2023 |
| Carer’s Allowance | 3,700 | 0.0 | 0 | May 2019 to Dec 2019 |
| Income Support | 600 | 0.3 | 0 | Oct 2013 to Sep 2014 |
| Jobseeker’s Allowance | 300 | 1.2 | 0 | Oct 2017 to Sep 2018 |
| Incapacity Benefit | 0 | 0.7 | 0 | Oct 2009 to Sep 2010 |
| Never Reviewed | 17,000 | 0.1 | 20 | |
| Total | 266,200 | 0.4 | 1,100 | |
| Range | (0.3 to 0.5) | (900 to 1,300) |
Notes to Appendix 2
-
Rows and columns may not sum to totals due to rounding.
-
Approximate 95% confidence interval ranges are given for the totals in the row below them. These also allow for non-sample error in occasionally reviewed benefits and the additional uncertainty that comes from the use of older measurement periods.
-
Some estimates are displayed as zero due to rounding.
-
The ‘Never Reviewed’ category includes benefits which were not previously reviewed and have not been historically reviewed in a particular year. This includes Cost of Living Payments.
Appendix 3: Cannot Review adjustment
Please see section 5 of the background information document for more information on this adjustment.
The primary reason for an ineffective review is the claimant not engaging in a review, resulting in their benefit claim being suspended and then later terminated. This includes instances where the claimant withdrew their claim to the benefit after they received a review notification.
These ineffective reviews are referred to as ‘Cannot Review’ and, for most claimants, the department holds very little evidence of their current circumstances and their reasons for failing to engage.
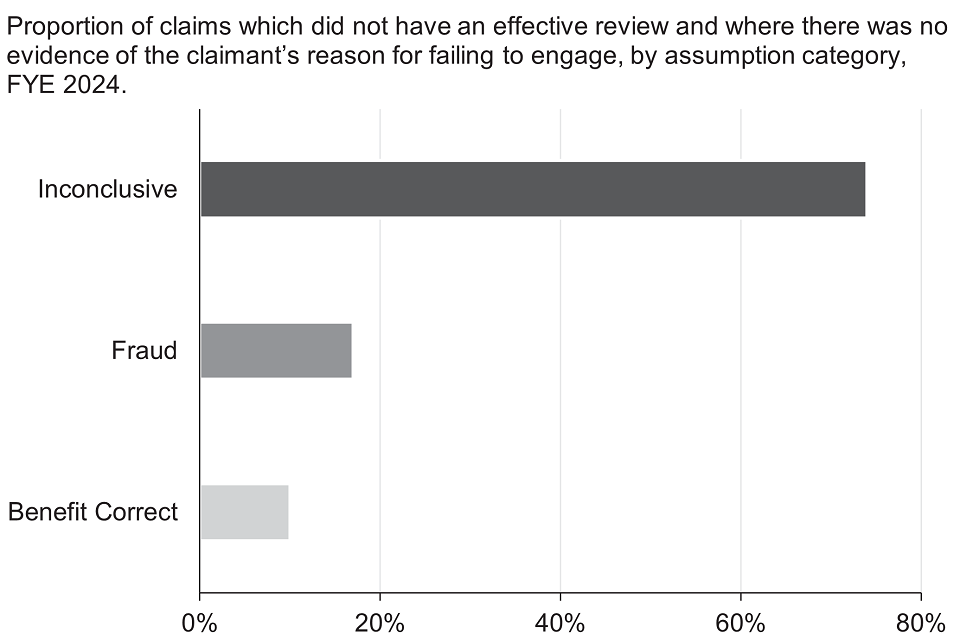
For those claims where there is a lack of evidence available, a set of assumptions are applied to categorise them for reporting purposes as follows:
-
Fraud – where a claim has a suspicion of Fraud raised during the initial data gathering prior to review. These claims are assumed to be Fraud in the reported estimates.
-
Not Fraud – where there is no information to suggest a suspicion of Fraud and the claimant reclaims the benefit at a similar rate within four months of their original award being terminated. These claims are assumed not to be Fraud. Any other errors such as Official Error would remain on the claim, so they may still not be entirely correct.
-
Inconclusive – where there is no information to suggest a suspicion of Fraud or that the claimant has reclaimed the benefit. These claims are recorded as inconclusive, and no assumptions are made. These claims are taken out of the headline reported estimates, since there is insufficient evidence to categorise as Fraud or not. The expenditure for these claims is estimated and reported separately within the publication and reference tables.
Cannot Review claims, where there was no evidence of the claimant’s reason for failing to engage, accounted for around £1,900m (0.8% of all FYE 2024 expenditure on benefits that have been reviewed since FYE 2020).
FYE 2024 estimates of the breakdown of claims that did not have an effective review, and where there was no evidence of the claimant’s reason for failing to engage, by benefit and assumption categorisation.
| Fraud Rate (%) | Fraud Value (£m) | Not Fraud Rate (%) | Not Fraud Value (£m) | Inconclusive Rate (%) | Inconclusive Value (£m) | |
|---|---|---|---|---|---|---|
| Attendance Allowance | 0.0 | 0 | 0.1 | 10 | 0.8 | 40 |
| Carer’s Allowance | 0.7 | 20 | 0.7 | 20 | 1.2 | 40 |
| Disability Living Allowance | 0.1 | 0 | 0.0 | 0 | 0.3 | 20 |
| Employment and Support Allowance | 0.0 | 0 | 0.0 | 0 | 0.6 | 70 |
| Housing Benefit | 0.4 | 60 | 0.5 | 80 | 0.8 | 120 |
| Pension Credit | 0.5 | 30 | 0.0 | 0 | 0.5 | 30 |
| Personal Independence Payment | 0.0 | 0 | 0.0 | 0 | 0.6 | 140 |
| State Pension | 0.0 | 0 | 0.0 | 0 | 0.1 | 160 |
| Universal Credit | 0.3 | 140 | 0.2 | 90 | 1.6 | 830 |
| Total | 0.1 | 260 | 0.1 | 190 | 0.6 | 1,440 |
Notes to Appendix 3
- For Employment and Support Allowance, Attendance Allowance and Carer’s Allowance, the last measured Cannot Review rates were applied to the expenditure for FYE 2024.
Nearly 3 in 4 of the Cannot Review claims, where there was no evidence of the claimant’s reason for failing to engage, were categorised as Inconclusive.
ISBN: 978-1-78659-669-7