Use of Intellectual Property rights across UK industries 2017 to 2019
Updated 9 June 2022

© Crown copyright 2022
This publication is licensed under the terms of the Open Government Licence v3.0 except where otherwise stated. To view this licence, visit nationalarchives.gov.uk/doc/open-government-licence/version/3 or write to the Information Policy Team, The National Archives, Kew, London TW9 4DU, or email: psi@nationalarchives.gov.uk.
Where we have identified any third party copyright information you will need to obtain permission from the copyright holders concerned.
This publication is available at https://www.gov.uk/government/publications/use-of-intellectual-property-rights-across-uk-industries/use-of-intellectual-property-rights-across-uk-industries-2017-to-2019
Executive summary
This paper identifies the UK industries that make the greatest use of intellectual property rights, with patents, trade marks, registered designs and copyright being considered. It assesses the contribution these industries make to the UK economy, in terms of employment, output and exported goods. The analysis in this paper covers the years 2017-2019.
The approach builds on the methodology used by previous studies from the European Union Intellectual Property Office (EUIPO) and the European Patent Office (EPO) [footnote 1], and by the United States Patent and Trade mark Office (USPTO) [footnote 2]. Both papers categorise industries as intellectual property (hereafter, IP) intensive if the IP use per 1,000 employees is above the industry average.
Applying the above methodology to registered IP rights (patents, trade marks and registered designs) granted to UK companies only and identifying a smaller subset of industries with noticeably high IP use, allows for an enhanced understanding of IP use within UK industries for domestic policy making. The economic contribution of sectors associated with copyright, an unregistered IP right, has also been included and follows a methodology established by EUIPO/EPO.
Between 2017 and 2019, industries with an above average use in any of the three registered IP rights (i.e. excluding copyright [footnote 3]) accounted for 33.2% (£414.7 billion, an increase of £166.2 billion compared to 2014-2016) of UK non-financial value-added output, [footnote 4] 19.2% (5.8 million, an increase of 1.3 million) of total UK employment and 58.2% (£16.4 billion, a 6.1% increase) of total goods export value (Table 1).
Industries with an above average use in IP rights [footnote 3] accounted for 26.9% (£298.5 billion) of UK non-financial value-added output, [footnote 4] 15.5% (4.5 million) of total UK employment and 52.1% (£159.7 billion) of goods exported.
Industries with a high [footnote 5] use of IP rights [footnote 6] accounted for 14.9% (£185.5 billion, an increase of £19.0 billion compared to 2014-2016) of non-financial value-added output in 2017-2019, 7.5% (2.3 million, an increase of 0.8 million) of total UK employment and 16.2% (£4.6 billion, a 4.1% increase) of total goods export value (Table 1).
Table 1: Summary of registered IP rights and their economic contribution in £ billion and as a percentage of all 616 industries
| Patents | Trade Marks | Designs | Copyright | |
|---|---|---|---|---|
| Number and percentage of UK industries with at least one IP right [footnote 7] | 339 55.0% |
590 95.8% |
370 60.1% |
- - |
| Number and percentage of UK industries classified ‘above average’ use of IP | 61 9.9% |
123 20.0% |
50 8.1% |
83 [footnote 8] 13.5% |
| Number and percentage of UK industries classified ‘high’ use of IP | 13 2.1% |
34 5.5% |
15 2.4% |
49 [footnote 9] 8.0% |
| UK non-financial value-added output by ‘above average’ (£billion) [footnote 10] | 101.9 8.2% |
174.6 14.0% |
70.4 5.6% |
2313.6 18.7% |
| Total UK employment by ‘above average’ (000s) [footnote 11] | 1,416 4.7% |
2,473 8.2% |
1,096 3.6% |
3,100 10.3% |
| Total goods export value by ‘above average’ (£billion) [footnote 12] | 12.7 45.1% |
6.47 22.9% |
2.22 7.9% |
2.80 9.9% |
In the time period of study, 35.4% of UK industries (218 out of 616 UK industries [footnote 13]) were found to have above average IP usage in any of the four IP rights considered with 15.1% of UK industries (93) having high IP usage. With respect to registered IP rights only (i.e. excluding copyright) 27.1% of UK industries (167) were found to be intensive, and 8% (19) were found to be highly intensive.
Two industries were found to have high IP use by UK companies in all three registered IP rights, both being in the manufacturing sector. A further nine are intensive across at least two of the registered IP rights, as shown in Table 2.
Table 2: Industries classified as having high IP use across multiple registered IP rights (IP per 1,000 employees)
| Standard Industrial Classification (SIC) | Description | Patent high | Trade mark high | Design high |
|---|---|---|---|---|
| 3099 | Manufacture of other transport equipment not elsewhere classified (n.e.c.) | x | x | x |
| 3299 | Other manufacturing n.e.c. [footnote 14] | x | x | x |
| 1200 | Manufacture of tobacco products | - | x | x |
| 1395 | Manufacture of non-wovens and articles made from non-wovens, except apparel | x | x | - |
| 1411 | Manufacture of leather clothes | - | x | x |
| 1414 | Manufacture of under wear | - | x | x |
| 1419 | Manufacture of other wearing apparel and accessories | - | x | x |
| 2110 | Manufacture of basic pharmaceutical products | x | x | - |
| 2344 | Manufacture of other technical ceramic products | x | - | x |
| 4799 | Other retail sale not in stores, stalls or markets | - | x | x |
| 6420 | Activities of holding companies [footnote 15] | x | x | - |
No industries were found to be highly intensive across all four IP rights considered, but two industries [footnote 16] were found to be at least above average in IP intensity in all four IP rights [footnote 17].
Some IP management may be dealt with by industries relating to ‘head office’ type activities rather than the actual industry that a company primarily operates in. An example of this is 6420: Activities of holding companies [footnote 18]. We have not redistributed these entries to the head offices’ subsidiaries as we cannot be sure of the company structure and lack of data.
Industry contributions towards output, employment and exports listed by IP right should not be added, since some have above average use in more than one IP right.
Across the 616 UK industries, trade marks were the most widely used IP right, occurring across over 95% of industries and having the highest number of industries with above average IP use. Compared to patents, registered designs were used more widely and were found to have higher number of industries with above average use. Consistent with the findings for industries with high IP use across all three registered IP rights, the manufacturing sector accounted for the majority of high or above average IP use industries in each of the IP rights.
1. Introduction
Intellectual property (IP) is an important part of the innovation ecosystem, playing a vital role in enabling innovators to realise the returns from their research and development. This paper follows on from previous IPO analysis which identified the UK industries make relatively the greatest use of patents, trade marks, registered designs and copyright, and the contribution these industries make to the UK economy, in terms of employment, output, and exported goods between 2014 and 2016 [footnote 19].
This paper uses the same methodology from the previous analysis [footnote 19] which was built from methods used in previous international studies of IP use across industries: one conducted jointly by the European Union Intellectual Property Office (EUIPO) and the European Patent Office (EPO) [footnote 1], and another by the United States Patent and Trade mark Office (USPTO) [footnote 2].
The IPO have adopted and adapted this methodology and applied it to IP rights granted to UK companies. By identifying above average IP use industries in the UK, we obtain the distribution of registered IP rights and identify industries of interest from an IP perspective. These yield different results to similar studies with a broader geographic basis, but this allows for an enhanced understanding of IP use for domestic policy making. Building on the EUIPO/EPO methodology, the IPO have identified a smaller subset of industries with noticeably higher registered IP use.
This report is focused on UK national economic measures and registered IP rights held by UK companies. As with the EUIPO/EPO study, this results in the analysis being affected by cross-border ownership and use of IP. For example, a UK company may be the owner of an IP right but base its manufacturing in a different country. The employment resulting from this manufacturing will not be captured in UK employment statistics and therefore is not considered when calculating industry IP use per 1,000 employees. Similarly, the IP owned by foreign companies with a workforce in the UK is not captured in the analysis.
The analysis in this paper covers the time period between 2017-2019 due to it being the most recent time period prior to the Covid-19 pandemic, and uses IP data from the same time period in order to attribute the registered IP rights on a company level and where possible compares the change in the use of IP rights in UK industries.
The economic contributions made by copyright intensive industries to the UK economy are again included in this report. As before, since copyright is an unregistered IP right, a detailed analysis of the distribution and usage of copyright across UK industries is not possible in the same way as the three registered IP rights examined in this report.
2. IPO methodology
This section sets out the methodology used, data limitations to be aware of and guidance on how to interpret the results.
As mentioned in the introduction, the EPO, in collaboration with the EUIPO, have produced papers on IP intensive industries [footnote 1], [footnote 20], as has the USPTO [footnote 2]. While there are some differences in methodology between the papers, they are largely similar. Both papers define an industry as ‘intensive’ if its IP use per 1,000 employees is above the average across all industries. The papers consider industry use of patents, trade marks and, in terms of the contribution it makes to the UK economy only, copyright. The EUIPO/EPO additionally incorporates registered designs, plant variety rights and geographical indicators in their analysis.
The EUIPO/EPO paper uses IP and economic data from across the EU, and as such incorporates IP use in the UK and UK industry data in its analysis. However, it identifies industries at the EU level and assumes that if an industry is IP intensive in one member state, it is also IP intensive in every other member state including the UK. This aggregation of EU-wide IP filings neglects differences between national economies meaning features specific to the UK economy might be masked by data from other countries. IPO have built on the EUIPO/EPO methodology and applied it to IP rights granted and registered to UK companies. This approach has increased the accuracy in identifying which UK industries make relatively the greatest use of patents, trade marks and registered designs.
Given the dispersion of IP intensive industries in the UK identified, the IPO has introduced an additional ‘cut-off’ point to try to examine the industries appearing in the steepest part of the distribution that we consider having ‘high’ IP usage.
2.1 Data coverage
Patents, trade marks and registered designs which provide protection that were granted between 2017 and 2019 in the UK have been considered in this paper. We have included:
- GB patents granted by the IPO.
- EP(UK) patents from the EPO [footnote 21] .
- UK trade mark classes registered by the IPO [footnote 22].
- European trade mark classes registered by the EUIPO [footnote 23].
- UK registered designs issued by the IPO.
- Registered Community designs issued by the EUIPO [footnote 24].
The applicants for these IP rights have been matched to UK company data taken from the Bureau van Dijk Orbis database [footnote 25], an extract of which was taken in 2019 for this analysis and matched in April 2022 with IP data.
2.2 Data matching
Identifying industry use of IP requires a link to be made between IP applications and industries. Industry classification information was obtained by matching IP rights to UK company data in the Orbis [footnote 25] database. Applicant names and addresses provided in IP filings have been matched against company names and addresses in the Orbis database. Obtaining this link allows identification of an IP applicant’s primary Standard Industrial Classification (SIC) code [footnote 26] (their main business activity).
Not all IP applicants could be matched to company data in Orbis and there are various reasons why. This exercise focused on UK companies and matching was only attempted for IP applicants with UK addresses. Orbis does not provide information on private individuals or unincorporated businesses so where the named applicant is not a company, industries are not identified. Some matched companies have no associated industry information in Orbis so cannot be included in the analysis. Furthermore, changes in business name/address and IP applications using inconsistent names can also complicate the matching process. To ensure the best possible match rate all names and addresses were cleaned consistently across the IP and Orbis datasets and a stage of manual matching took place to ensure companies with high IP counts were successfully matched. Table 3 shows a summary of the match rates for each IP right.
Table 3: Summary of IP data matching to SIC codes
| Patents | Trade marks (class count) |
Registered designs | |
|---|---|---|---|
| UK applicants | 27,414 | 533,559 | 69,408 |
| Matched to firm data with valid SIC | 18,682 | 411,442 | 50,872 |
| % match | 68.1% | 77.1% | 73.3% |
It should be noted that the data covering registered community designs did not include applications from individuals. As the analysis in this report relies on matching IP applications to companies (and not individuals) there is no effect on the results, however, the reported match rate for designs will be inflated consequently.
2.3 Head office redistribution
Organisational structures of large companies mean it is common practice for IP to be centrally handled for all parts of a business. This leads to IP applications being linked to non-specific industry codes.
Head office activities under the SIC classifications fall under three industries: 6420: Activities of holding companies, 7010: Activities of head offices and 8299: Other business support service activities n.e.c.
A method was applied to redistribute the IP rights of these ‘head office’ companies to reflect the industrial activity of one of their subsidiaries. Very few IP rights were successfully reallocated, so this method was not used.
2.4 Fractional allocation of IP
Each application for an IP right can have multiple applicants associated with it. IP rights have been allocated fractionally to industries. Each matched applicant for a given application is given an equal share of the IP right, e.g. If there are three applicants matched to three different SIC codes, each industry classification is assigned 1/3 of the IP [footnote 27].
2.5 Time period
Analysis in this paper considers IP applications filed in the time period 2017-2019 and subsequently granted by end of December 2019.
2.6 Economic data
The matched dataset allowed IP rights to be aggregated by SIC classification. These IP counts by industry are then combined with national economic statistics (employment, gross value added (GVA), value of exports) which are available by SIC classification.
Export data was gathered from HMRC trade statistics [footnote 28], in which products are assigned codes. The product codes have been matched to SIC codes at the 4-digit level through using Eurostat tables. It must be noted that the sources for export values differ between this report and the IPO’s corresponding report in September 2020, therefore the results are not comparable in value terms, although the shares are comparable. The previous report used HMRC’s sum of value of exports plus value of dispatch, whereas this update uses only value of exports.
It should be noted that this report is focused on IP rights held by UK companies and UK national economic measures. As with the EUIPO/EPO study [footnote 1], the results in this analysis will be affected by cross-border ownership and use of IP. For example, a UK company may be the owner of an IP right but base its manufacturing in a different country. The employment and GVA resulting from this manufacturing will not be captured in UK national accounts and therefore is not considered when calculating industry IP use per 1,000 employees. Similarly, the IP owned by foreign companies with a workforce in the UK is not captured in the analysis.
Several economic variables have been used throughout this analysis. A table of sources and caveats can be found in Appendix 1.
2.7 Measuring IP intensity: IP rights per 1,000 employees
The methodology used in both EUIPO/EPO [footnote 1] and USPTO [footnote 2] studies, which we have also applied, calculates how many granted IP rights there are per 1,000 employees in each industry (i) in Equation 1 below.
Where,
(a): The number of patents, trade marks or registered designs granted to the 4-digit industry in the time period explained in Section 2.5.
Granted IP rights are matched to industry by matching applications to businesses and determining their primary SIC code as reported to Companies House [footnote 29].
(b): The number of employees for each industry is defined as the average number of employees over the time periods explained in Section 2.5 [footnote 30].
For this measure to be calculated for an industry with granted IP rights, available employment data is required. Table 4 shows the number of industries that are excluded from the analysis due to lack of employee data available across this time period. An industry was excluded only if there was no employment data for any year between 2017 and 2019. In cases where some or all data was available, the number of employee’s was averaged between the number of years the employment data was available.
Table 4: Research limitations caused by data coverage issues
| IP right | Number of industries with IP rights | Number of industries not measured by employees | Percentage of industries not included due to lack of data coverage |
|---|---|---|---|
| Patents | 339 | 25 | 7.4% |
| Trade marks | 590 | 57 | 9.7% |
| Registered designs | 370 | 17 | 4.6% |
2.8 Classification of usage
To determine how much use an industry makes of IP, we have three main classifications used in this analysis: high, medium and low. We also refer to an above average classification. The descriptions of these classifications are explained in Table 5.
Table 5: Classifications of IP usage
| Classification of usage of IP | Description |
|---|---|
| Above average | The industry has an above average use of IP when all industries with that IP are considered |
| High | The industry has an above average use of IP out of the industries in the “Above Average” subset |
| Medium | The industry has a below average use of IP out of the industries in the “Above Average” subset |
| Low | The industry has a below average used of IP when all industries with that IP are considered |
| Unclassified | The industry either has no IP or is excluded due to lack of economic or employment data |
The above defined classifications have been used instead of labelling industries as intensive to reflect the shape of the distribution of IP use. The density plots shown throughout this report show the distribution of IP rights per thousand employees across all UK industries that have both the IP right data and available employee data [footnote 31], ranked from highest to lowest; solid lines show where the average value lies, and the dotted lines indicate the average of all industries in Sections high and medium. As distributions of IP intensity will change over time, it is difficult to make a direct comparison in the high intensity group between with the 2014-2016 analysis and this one, therefore in this analysis comparisons have been made by either ranking or percentiles in this classification.
Appendix 3, 4 and 5 contains a list of all industries, their classification description, the number of IP rights within each (separated out by patents, trade marks and registered designs), and IP per 1,000 employees.
3. Use of copyright across the UK industries: methodology
Copyright intensive industries have been identified using a WIPO methodology that classifies industries by the percentage of their value that can be attributed to copyright-related activities [footnote 32]. WIPO groups industries into four categories depending to the degree to which their activity depends on copyright. These are: core [footnote 33], interdependent [footnote 34], partial [footnote 35] and non-dedicated support [footnote 36] industries.
While the entire output of the core copyright industries’ activities can be attributed to copyright works, to capture the fact that only a portion of the industries’ activity is related to copyright, each industry has been assigned a factor intensity that represents the economic output from that industry that is related to copyright-related activity. The copyright factors assigned to each industry in the interdependent, partial and non-dedicated support classifications have been adopted directly from the EUIPO/EPO [footnote 1] paper.
All core, interdependent and partial copyright industries (with a factor intensity of over 20%) have been included in this paper. Industries identified as “core” are considered as high IP use sectors. All non-dedicated support industries have been excluded as all of them have a factor of just 6%. Table 6 lists the number of industries classified under each category [footnote 37].
Table 6: Copyright intensive industries by WIPO grouping
| IP usage | Number of industries |
|---|---|
| Number of industries classified as copyright intensive | 83 |
| Interdependent | 22 |
| Core | 49 |
| Partial | 12 |
4. Use of registered IP rights across UK industries
Table 7 provides a summary of the number of industries that fall into each category for each registered IP right. 590 (95.77%) of 616 UK industries had a registered trade mark, the highest of the three registered IP rights, this is an increase from 586 (95.13%) in the previous study. As trade marks offer brand protection, the majority of industries contain at least one trade mark registered to a UK business. Between the periods of 2014-2016 and 2017-2019, the number of industries with at least one patent (from 360 to 339, a decrease of 5.82%) or design (from 388 to 370, a decrease of 4.64%) right has decreased.
Table 7: Summary of IP industry usage by registered IP right
| IP usage | Patents | Trade marks | Designs |
|---|---|---|---|
| Number and percentage of industries with at least one registered IP right (of 616 industries) | 339 55.0% |
590 95.8% |
370 60.1% |
| Number and percentage of industries classed as above average (high and medium) | 61 9.9% |
123 20.0% |
50 8.1% |
| Number and percentage of industries classed as high | 13 2.1% |
34 5.5% |
15 2.4% |
| Number and percentage of industries classed as medium | 48 7.8% |
89 14.5% |
35 5.7% |
| Number and percentage of industries classed as low | 253 41.1% |
410 66.6% |
303 49.2% |
| Number and percentage of industries classed as unclassified (no employee data) | 25 4.1% |
57 9.3% |
17 2.8% |
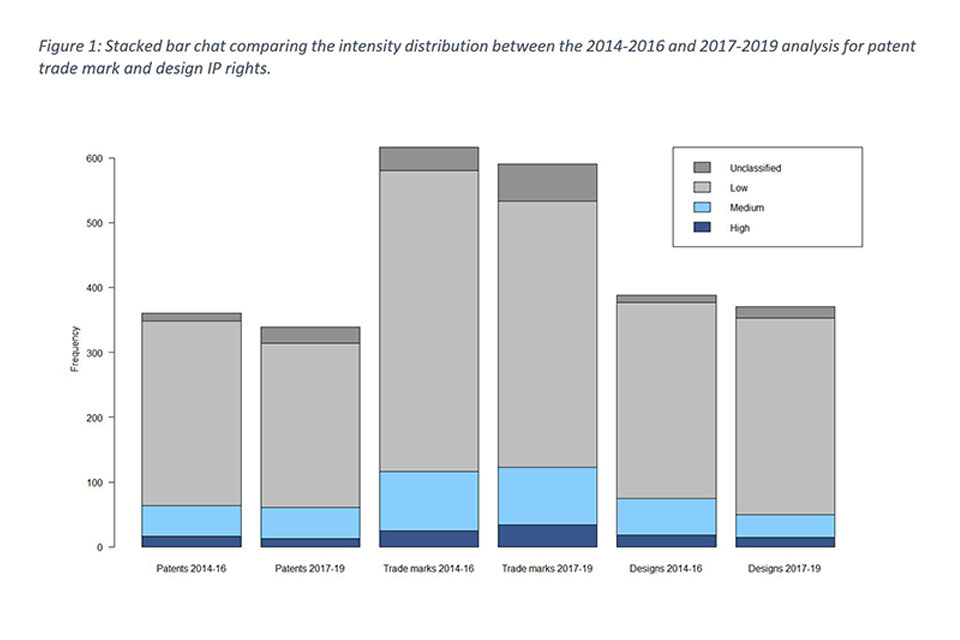
Figure 1 shows a compares distribution of intensity for each IP right between this analysis and the 2014-2016 analysis, while the table in Appendix 2 shows a comparison between percentiles for each intensity category. The results show that there is little change in these distributions apart from the designs distribution where the number of industries in the above average (high and medium combined) category has decreased significantly from 57 (9.25%) in 2014-16 to 35 (5.68%).
The following sections show more detailed findings for each registered IP right with distribution charts showing IP right usage across UK industries and tables summarising the high IP usage industries.
The average number of patent rights across all measured industries has decreased from 3.55 patents per 1,000 employees to 2.8, which is an average decrease of 21.1%. Figure 2 shows the distribution of patent use in UK industries. The industries that are categorised as high in patent use are listed in Table 8 with 76.9% of the industries classified with a high patent usage were in the manufacturing sector. Manufacture of other transport equipment n.e.c. industry is ranked as the highest with 70.6 patents per 1,000 employees, an increase from 55.31 in the 2014-2016 analysis. Despite the decrease in the average number of patents across all measured industries, the top four ranked industries have all increased in patent IP intensity. Activities of holding companies has increased from 61.26 to patents per 1,000 employees to 66.7, Manufacture of engines and turbines, except aircraft, vehicle and cycle engines from 48.82 patents per 1,000 employees to 57.3, and Manufacture of flat glass from 44.44 patents per 1,000 employees to 52.8.
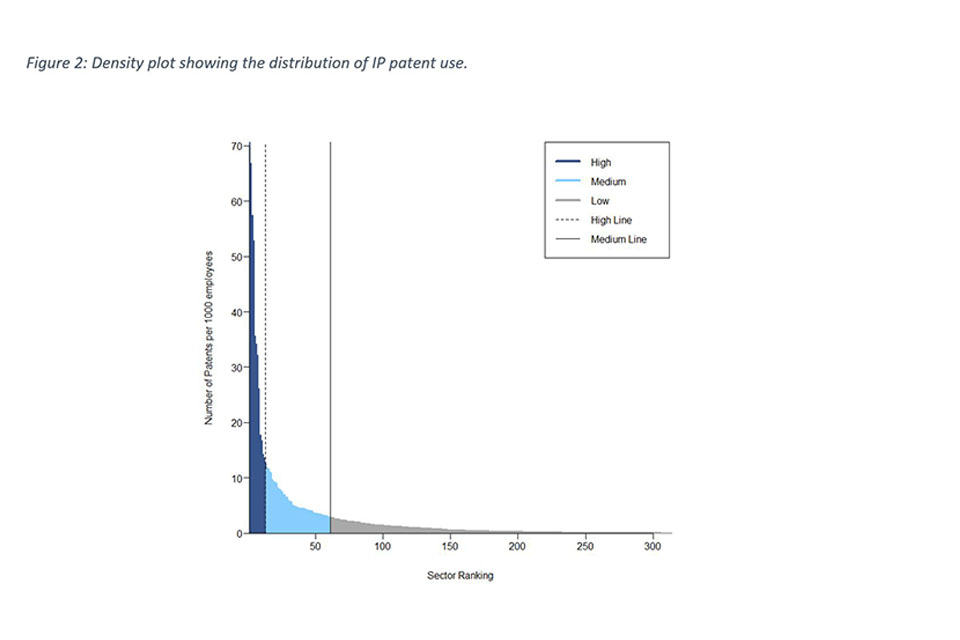
Table 8: List of industries with high patent use per 1,000 employees
| SIC | SIC description | Patents per 1,000 employees | Number of employees |
|---|---|---|---|
| 3099 | Manufacture of other transport equipment nec | 70.6 | 1,033 |
| 6420 | Activities of holding companies | 66.7 | 3,267 |
| 2811 | Manufacture of engines and turbines, except aircraft, vehicle and cycle engines | 57.3 | 16,367 |
| 2311 | Manufacture of flat glass | 52.8 | 967 |
| 7211 | Research and experimental development on biotechnology | 35.6 | 11,167 |
| 3299 | Other manufacturing n.e.c | 34.1 | 20,333 |
| 2899 | Manufacture of other special-purpose machinery n.e.c | 32.1 | 9,467 |
| 2110 | Manufacture of basic pharmaceutical products | 26.1 | 6,100 |
| 2344 | Manufacture of other technical ceramic products | 17.6 | 567 |
| 1395 | Manufacture of non-wovens and articles made from non-wovens, except apparel | 16.7 | 900 |
| 2790 | Manufacture of other electrical equipment | 14.1 | 10,467 |
| 2342 | Manufacture of ceramic sanitary fixtures | 13.5 | 667 |
| 7219 | Other research and experimental development on natural sciences and engineering | 12.5 | 122,733 |
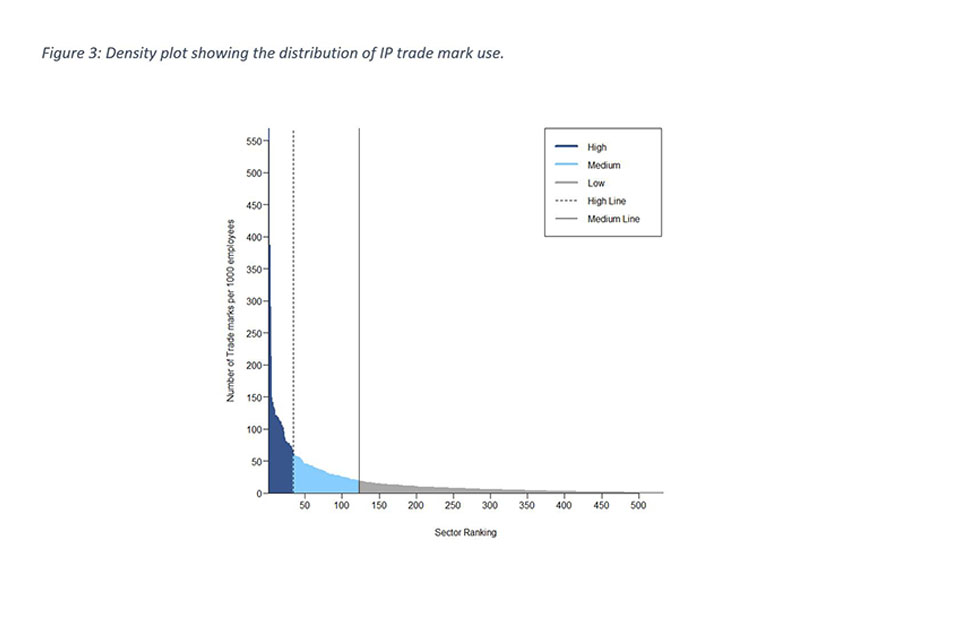
The average number of trade marks rights across all measured industries has decreased significantly from 37.3 patents per 1,000 employees to 18.1, which is an average decrease of 51.5%. The distribution of trade mark use across industries, shown in Figure 3, is characterised by a small number of industries that have high usage and a large number with low usage that tails off very gradually. When looking closer to the results, we noticed that many of the industries categorised as high or medium have less trade marks per 1,000 employees compared to the 2014-2016 analysis. In fact, all the industries categorised as high in the 2014-2016 analysis have seen a decrease in intensity in this analysis with the exception of Distilling, rectifying and blending of spirits which has increased from 90.55 to 133.4 (an increase of 47.3%).
The highest ranked industry is Activities of holding companies, which has 568.8 trade marks per 1,000 employees, has decreased from 840.63 (a decrease of 47.8%). Manufacture of wine from grape was the highest rank industry in our previous analysis and with 3,330 and was considered an extreme outlier at the time. This industry has now decreased 148.6 trade marks per 1,000 employees partly due to the increase in the number of employees in the industry (from 100 to 733).
Table 9: Industries with high trade mark use per 1,000 employees
| SIC | SIC description | TMs per 1,000 employees | Number of employees |
|---|---|---|---|
| 6420 | Activities of holding companies | 568.8 | 3,267 |
| 1200 | Manufacture of tobacco products | 385.7 | 233 |
| 9900 | Activities of extraterritorial organisation and bodies | 289.4 | 567 |
| 3299 | Other manufacturing n.e.c. | 211.9 | 20,333 |
| 1102 | Manufacture of wine from grape | 148.6 | 733 |
| 4619 | Agents involved in the sale of a variety of goods | 141.3 | 4,500 |
| 1101 | Distilling, rectifying and blending of spirits | 133.4 | 10,500 |
| 1419 | Manufacture of other wearing apparel and accessories | 132.2 | 4,833 |
| 2110 | Manufacture of basic pharmaceutical products | 129.7 | 6,100 |
| 3240 | Manufacture of games and toys | 120.2 | 4,467 |
| 1411 | Manufacture of leather clothes | 120.0 | 200 |
| 5030 | Inland passenger water transport | 118.7 | 1,533 |
| 2652 | Manufacture of watches and clocks | 117.7 | 433 |
| 2640 | Manufacture of consumer electronics | 114.7 | 4,367 |
| 4675 | Wholesale of chemical products | 112.2 | 18,233 |
| 4799 | Other retail sale not in stores, stalls or markets | 111.8 | 22,567 |
| 5821 | Publishing of computer games | 110.8 | 2,167 |
| 2060 | Manufacture of man-made fibres | 105.0 | 467 |
| 7740 | Leasing of intellectual property and similar products, except copyrighted works | 104.6 | 3,700 |
| 4782 | Retail sale via stalls and markets of textiles, clothing and footwear | 101.8 | 933 |
| 4617 | Agents involved in the sale of food, beverages and tobacco | 95.2 | 4,767 |
| 6399 | Other information service activities n.e.c. | 87.0 | 12,633 |
| 3099 | Manufacture of other transport equipment n.e.c. | 84.2 | 1,033 |
| 1395 | Manufacture of non-wovens and articles made from non-wovens, except apparel | 80.0 | 900 |
| 5829 | Other software publishing | 79.0 | 12,467 |
| 1399 | Manufacture of other textiles n.e.c. | 77.2 | 2,267 |
| 1414 | Manufacture of underwear | 77.1 | 4,500 |
| 4637 | Wholesale of coffee, tea, cocoa and spices | 77.1 | 4,500 |
| 4616 | Agents involved in the sale of textiles, clothing, fur, footwear and leather goods | 74.0 | 6,433 |
| 5812 | Publishing of directories and mailing lists | 72.6 | 1,033 |
| 1105 | Manufacture of beer | 72.5 | 16,733 |
| 3280 | Manufacture of sports goods | 69.2 | 5,633 |
| 5920 | Sound recording and music publishing activities | 65.0 | 9,433 |
| 1086 | Manufacture of homogenised food preparations and dietetic food | 61.1 | 933 |
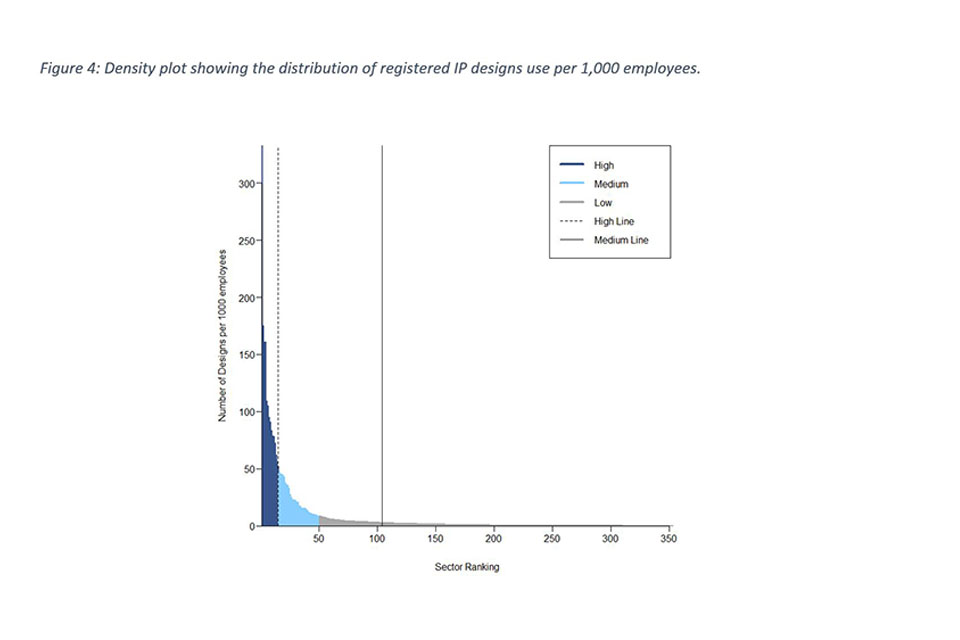
The average number of design rights across all measured industries has increased from 5.96 designs per 1,000 employees to 8.1, which is an average increase of 35.9%. At first glance, the distribution of registered design use in UK industries shown in Figure 4 is consistent with the other plots for patents and trade marks, with the distribution showing a small number of industries with a disproportionately high use of registered designs, and a large number with medium to low use. However, compared to the 2014-2016 analysis, the number of designs per 1,000 employees in the high intensity group had increased substantially. Table 10 lists the 15 industries that are classified as having high registered design use; nine of these are classified as manufacturing industries. Overall, the mean number of registered designs per 1,000 employees has increased from 62.66 in 2014-2016 to 113.8 in 2017-2019. This significant increase in registered designs in several industries explains the significant difference in distributions shown in Figure 1. Manufacture of cutlery remains the highest rank industry for design rights with 332.7 design per 1,000 employees, a decrease from 365 in 2014-2016. As with both patents and trade marks, the manufacturing sector account for the majority of IP usage.
Table 10: List of industries with high designs use per 1,000 employees
| SIC | SIC classification | Registered designs per 1,000 employees | Number of employees |
|---|---|---|---|
| 2571 | Manufacture of cutlery | 332.7 | 367 |
| 1411 | Manufacture of leather clothes | 175.0 | 200 |
| 2344 | Manufacture of other technical ceramic products | 160.6 | 567 |
| 4789 | Retail sale via stalls and markets of other goods | 160.4 | 3,067 |
| 4799 | Other retail sale not in stores, stalls or markets | 108.8 | 22,567 |
| 7410 | Specialised design activities | 104.4 | 57,833 |
| 3299 | Other manufacturing n.e.c. | 94.8 | 20,333 |
| 3212 | Manufacture of jewellery and related articles | 90.2 | 5,133 |
| 1414 | Manufacture of underwear | 82.9 | 700 |
| 3099 | Manufacture of other transport equipment n.e.c. | 78.4 | 1,033 |
| 1724 | Manufacture of wallpaper | 77.6 | 967 |
| 1419 | Manufacture of other wearing apparel and accessories | 71.8 | 4,833 |
| 1512 | Manufacture of luggage, handbags and the like, saddlery and harness | 61.6 | 3,733 |
| 1200 | Manufacture of tobacco products | 55.7 | 233 |
| 2443 | Lead, zinc and tin production | 51.6 | 833 |
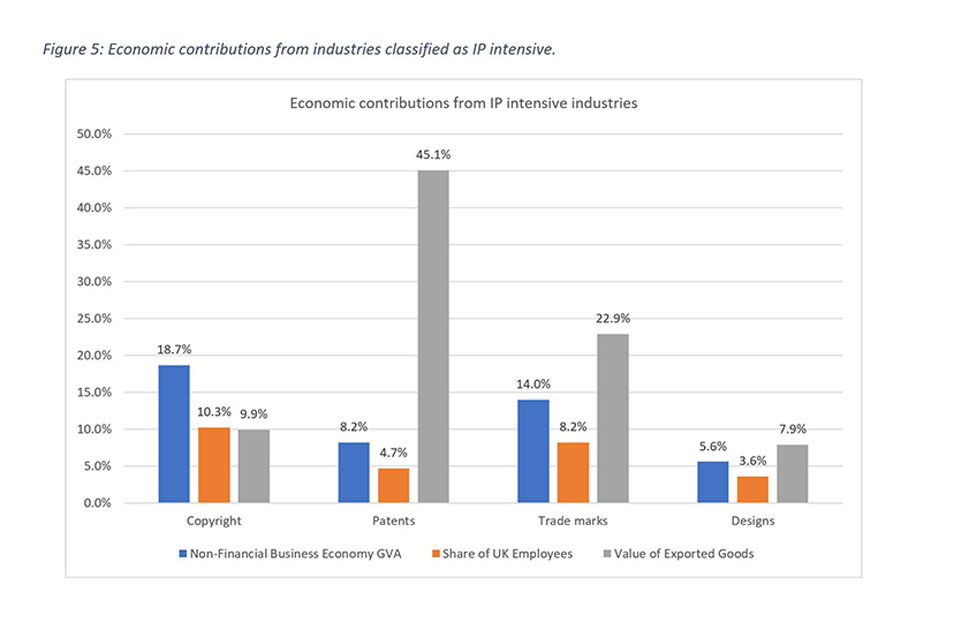
5. IP intensive industries and the economy
The analysis below outlines the contribution that industries with high or above average (as shown in Figure 5) registered IP use, or those classified as copyright intensive [footnote 38], make to the UK economy in terms of non-financial GVA [footnote 39], employment and exports. It is based on IP rights held by UK companies and the economic contributions are calculated from UK national accounts. As with the EUIPO/EPO study, this results in the analysis being affected by cross-border ownership and use of IP although, as noted before, the EUIPO/EPO did not explore the pattern of IP right usage within individual countries but instead calculated for each country the share of gross domestic product (GDP) and employment of industries found to be IP intensive at the EU level. For example, a UK company may be the owner of an IP right but base its manufacturing in a different country. The employment and GVA which result from this manufacturing will not be captured in UK national accounts and therefore won’t form part of the contributions associated with the company/industry’s use of IP.
5.1 Employment
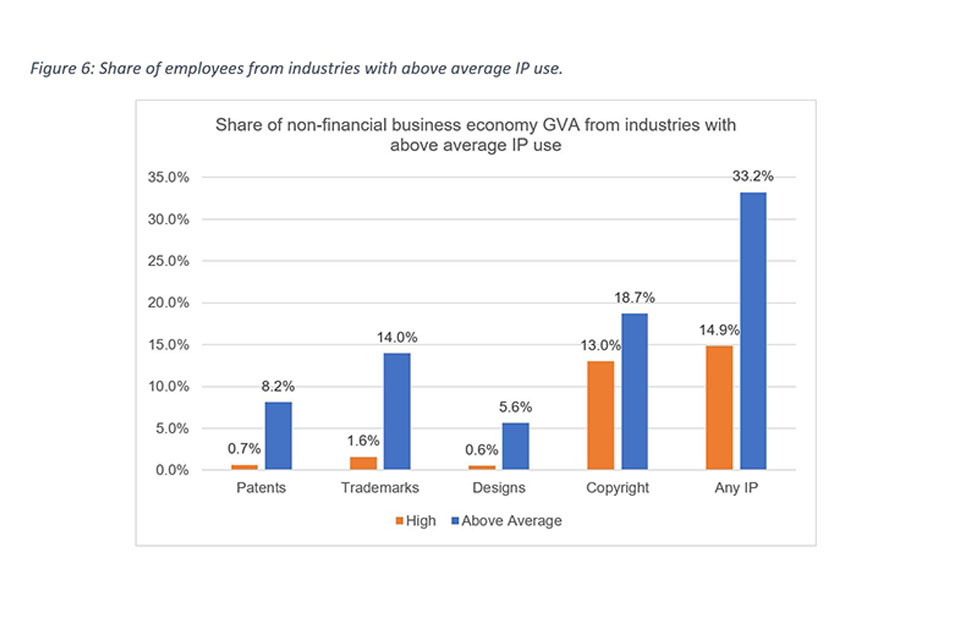
19.2% (5.8 million) of total UK employment is attributable to industries with an above average IP use, an increase from 4.5 million (3.7% increase) from 2014-2016. It is difficult to read too much into this proportion as IP intensive industries vary greatly in size, from 100 employees to 405,000 employees. Between the two time periods the total UK employment has increase by approximately 1.1 million [footnote 40]. 7.5% (2.3 million) of the total UK employment is attributable to industries with high use which is an increase of 0.8 million (2.4%). Table 11 compares the total UK employment for each IP right compared to the 2014-2016 analysis and shows that the employment has either stayed approximately the same or increased for every right, both in the above average and high category industries.
Figure 6 shows the proportion of UK employment attributable to those industries with a high or above average (high or medium) use of IP. [footnote 41]
Table 11: Share of employee’s comparison between 2014-2016 and 2017-2019 [footnote 41]
| Share of employees from industries with above average IP use | Above Average | High | ||||
|---|---|---|---|---|---|---|
| 2014-2016 | 2017-2019 | Change | 2014-2016 | 2017-2019 | Change | |
| Patents | 3.90% | 4.70% | 0.80% | 0.70% | 0.70% | 0.00% |
| 1.1 million | 1.4 million | 0.3 million | 0.2 million | 0.2 million | 0 | |
| Trade marks | 7.80% | 8.20% | 0.40% | 0.40% | 0.60% | 0.20% |
| 2.3 million | 2.5 million | 0.2 million | 0.12 million | 0.19 million | 0.07 million | |
| Designs | 3.90% | 3.60% | -0.30% | 0.40% | 0.40% | 0.00% |
| 1.1 million | 1.1 million | 0 | 0.11 million | 0.12 million | 0.01 million | |
| Copyright | 7.00% | 10.30% | 3.30% | 6.30% | 6.40% | 0.10% |
| 2.0 million | 3.1 million | 1.1 million | 1.8 million | 1.9 million | 0.1 million | |
| Any IP | 15.50% | 19.20% | 3.70% | 5.10% | 7.50% | 2.40% |
| 4.5 million | 5.8 million | 1.3 million | 1.5 million | 2.3 million | 0.8 million |
Industries that WIPO classifies as copyright intensive contribute the most of the four IP rights to total employment in the UK. Overall, such industries account for 10.3% (3.1 million) of total employment with Engineering activities and related technical consultancy employing the most people (405,100). Industries for which copyright is core to their business activities, make up 6.4% of employment (1.9 million).
Industries that are intensive in trade marks account for 8.2% of total employment (2.5 million). This is the highest of the three registered IP rights, on account of the high use of trade marks across the economy (95.8% of industries). Industries that are highly intensive users of trade marks, employed 189,600 employees (0.6%) between 2017 and 2019. The industry that employed the most people was 8299: Other business support service activities n.e.c. (328,100 employees).
4.7% of employment (1.4 million) can be attributed to industries that were intensive in patents, while highly intensive industries contributed 0.7% (204,000). Like trade marks, 8299: other business support service activities n.e.c. is the largest employer. During the time period of this study, design intensive industries accounted for 3.6% of employees (1.1 million), and highly intensive industries accounted for 0.4% (122,000) of employees.
5.2 Non-financial business economy gross value added
This Section refers only to the gross value added (GVA) of the non-financial business economy in the UK (which accounts for 84% of all industries at the 4-digit SIC level and approximately two thirds of the UK economy). Sufficient data is not available at this level of disaggregation for the financial industries.
Industries with an above average use in at least one of the IP rights accounted for 33.2% of UK value-added output (£414.7 billion) as measured by the Annual Business Survey [footnote 42]. Employees in IP intensive industries were also much more productive than those in non-IP intensive industries, with GVA per employee of £71,500 in the former, and £34,200 in the latter. Industries with high use of IP rights contributed 14.9% (£185.5 billion) to GVA.
Table 12 shows a share of GVA comparison between 2014-2016 and 2017-2019. Overall, £414.7 billion (33.2%) of the total GVA share is attributed to industries with an above average IP use and increase from £298.5 billion (26.9%) in the period between 2014-2016 (an increase of 166.2 billion, 6.3%). 15.0% (166.5 billion) of the GVA share is attributable to industries with high use which is 0.1% decrease compared to 2014-2016 in terms of proportions but is still an increase in monetary value (19.0 billion). When comparing individual IP rights, we can see that the GVA has increased for trade marks (£28.1 billion increase in above average and £10.2 billion increase in high) and copyright (£76.8 billion increase in above average and £13.6 billion increase in high) but decreased for designs (£9.3 billion decrease in above average and £0.9 billion decrease in high) in both above average and high categories. The GVA share in patents increased from £79.7 billion to £101.9 billion (a 1% increase) for industries with above average IP use but decreased for industries with high IP use by £0.6 billion which is a 0.1% decrease.
Table 12: Non-financial business economy GVA comparison between 2014-2016 and 2017 and 2019 [footnote 41]
| Share of non-financial business economy GVA from industries with above average IP use | Above Average | High | ||||||
|---|---|---|---|---|---|---|---|---|
| 2014-2016 | 2017-2019 | Change | 2014-2016 | 2017-2019 | Change | |||
| Patents | 7.20% | 8.20% | 1.00% | 0.80% | 0.70% | -0.10% | ||
| £79.7 billion | £101.9 billion | £22.2 billion | £8.8 billion | £8.2 billion | - £0.6 billion | |||
| Trade marks | 13.20% | 14.00% | 0.80% | 0.90% | 1.60% | 0.70% | ||
| £146.5 billion | £174.6 billion | £28.1 billion | £9.8 billion | £20 billion | £10.2 billion | |||
| Designs | 7.20% | 5.60% | -1.60% | 0.70% | 0.60% | -0.10% | ||
| £79.7 billion | £70.4 billion | - £9.3 billion | £8.1 billion | £7 billion | - £0.9 billion | |||
| Copyright | 14.10% | 18.70% | 4.60% | 13.40% | 13.00% | -0.40% | ||
| £156.8 billion | £233.6 billion | £76.8 billion | £149 billion | £162.6 billion | £13.6 billion | |||
| Any IP | 26.90% | 33.20% | 6.30% | 15.00% | 14.90% | -0.10% | ||
| £298.5 billion | £414.7 billion | £166.2 billion | £166.5 billion | £185.5 billion | £19.0 billion |
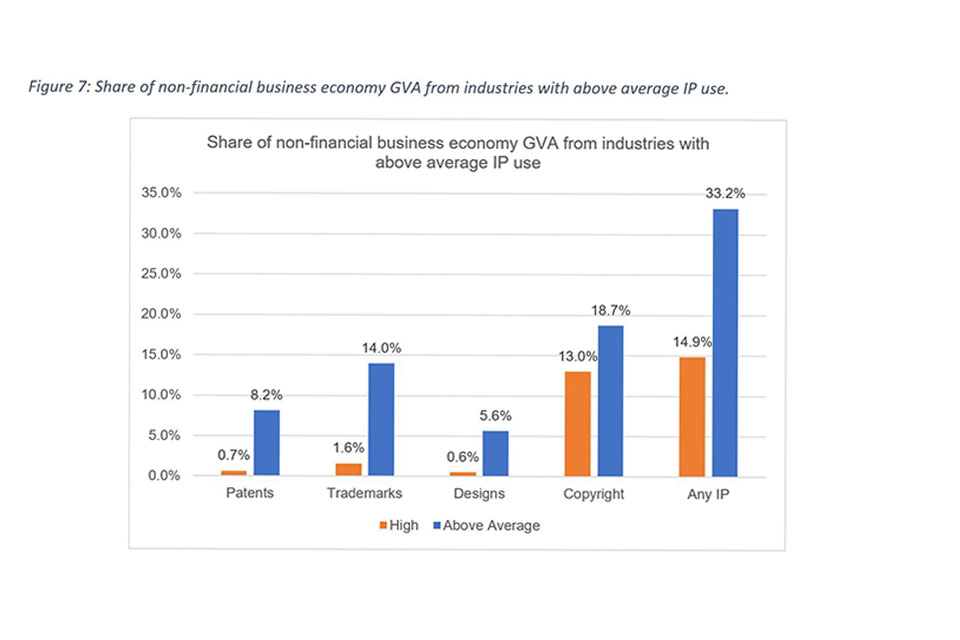
Figure 7 shows the proportion of UK GVA is attributable to those industries with a high or above average (high or medium) use of IP
As with employment, copyright intensive industries contribute the most to non-financial GVA. Those industries’ cumulative share of GVA was 18.7% (£233.6 billion). The largest industry in terms of GVA that is intensive in copyright is Computer consultancy activities (£30.8 billion). Trade mark intensive industries accounted for 14% (£174.6 billion) of GVA between 2017 and 2019, while patent intensive and design intensive industries accounted for 8.2% (£101.9 billion) and 5.6% (£70.4 billion) respectively. Table 12 outlines the contributions in absolute terms to economic output by each IP right.
5.3 Export value
Between 2017-2019, IP intensive industries contributed 58.2% of export value (£16.4 billion) [footnote 43], an increase of 6.1% compared 2014-2016 (Table 13). Whereas industries that were highly intensive in any IP right accounted for 16.2% of export value (£4.7 billion, Figure 8), an increase of 4.1%. Patent intensive industries such as Manufacture of motor vehicles (£4.7 billion), and Manufacture of air and spacecraft and related machinery (£2.2 billion), accounted for 45.1% (£12.7 billion) collectively. Similarly to non-financial GVA, IP intensive industries have much higher export value per employee too, exporting £2,800 per employee versus £500 for non-IP intensive industries.
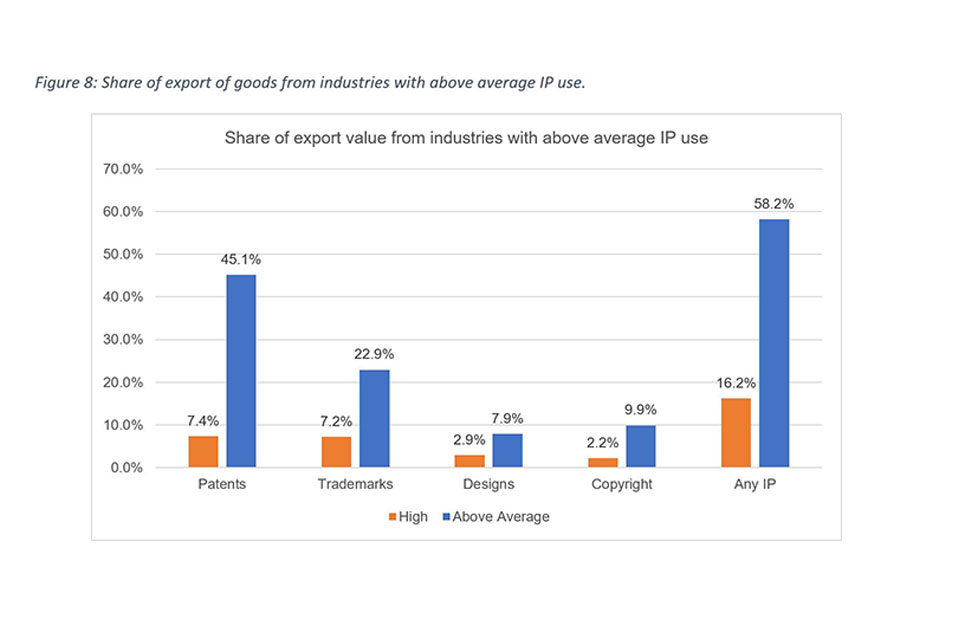
Table 13: Comparison of share of export value between 2014-2016 and 2017-2019
| Share of export value from industries with above average IP use | Above Average | High | ||||
|---|---|---|---|---|---|---|
| 2014-2016 | 2017-2019 | Change | 2014-2016 | 2017-2019 | Change | |
| Patents | 39.30% | 45.10% | 5.80% | 7.40% | 7.40% | 0.00% |
| £120.6 billion | £12.7 billion | N/C | £22.8 billion | £2.1 billion | N/C | |
| Trade marks | 17.20% | 22.90% | 5.70% | 3.40% | 7.20% | 3.80% |
| £52.9 billion | £6.5 billion | N/C | £10.5 billion | £2 billion | N/C | |
| Designs | 23.80% | 7.90% | -15.90% | 3.40% | 2.90% | -0.50% |
| £72.9 billion | £2.2 billion | N/C | £10.5 billion | £0.8 billion | N/C | |
| Copyright | 4.80% | 9.90% | 5.10% | 2.50% | 2.20% | -0.30% |
| £14.7 billion | £2.8 billion | N/C | £7.6 billion | £0.6 billion | N/C | |
| Any IP | 52.10% | 58.20% | 6.10% | 12.10% | 16.20% | 4.10% |
| £159.7 billion | £16.4 billion | N/C | £37.1 billion | £4.6 billion | N/C |
High use trade mark industries contributed 22.9% (£6.5 billion) of export value, rising to 7.2% (£2 billion) for above average users of trade marks. Industries that were above average users of copyright accounted for 9.9% (£2.8 billion) of export value, while design intensive industries accounted for 7.9% (£2.2 billion). In general, the export value in above average intensity IP rights between 2014-2016 and 2017-19 but decreased by 15.9% in designs (Table 13).
As previously mentioned, the sources for export value differ between this report and the IPO’s corresponding report in September 2020, therefore the results are not comparable in value terms, although the shares are comparable.
5.4 The economic contribution of the copyright intensive industries
The estimates below outline the contribution that industries classified as copyright intensive make to the UK economy as a percentage of non-financial business GVA, employment and export value.
Table 14: Comparison of economic contributions from copyright intensive industries between 2014-2016 and 2017-2019 [footnote 41]
| Economic contributions from industries classified as copyright intensive | Core | Interdependent | Partial | Total | ||||||||
|---|---|---|---|---|---|---|---|---|---|---|---|---|
| 2014-2016 | 2017-2019 | Change | 2014-2016 | 2017-2019 | Change | 2014-2016 | 2017-2019 | Change | 2014-2016 | 2017-2019 | Change | |
| Non-Financial Business Economy GVA | 13.30% | 13.00% | -0.30% | 0.60% | 2.40% | 1.80% | 0.10% | 3.30% | 3.20% | 14.00% | 18.70% | 4.70% |
| £149.0 billion | £162.6 billion | £13.6 billion | £6.7 billion | £29.5 billion | £22.8 billion | £1.2 billion | £41.6 billion | £40.4 billion | £156.8 billion | £233.6 billion | £76.8 billion | |
| Share of UK employees | 6.30% | 6.40% | 1.00% | 0.40% | 1.40% | 1.00% | 0.20% | 2.50% | 2.30% | 7.00% | 10.30% | 3.30% |
| 1.8 million | 1.9 million | 0.1 million | 0.12 million | 0.42 million | 0.3 million | 0.07 million | 0.76 million | 0.69 million | 2.0 million | 3.1 million | 1.1 million | |
| Value of exported goods | 2.50% | 2.20% | -0.30% | 1.60% | 5.60% | 4.00% | 0.30% | 2.10% | 1.80% | 4.30% | 9.90% | 5.60% |
| £7.6 billion | £0.63 billion | N/C | £4.9 billion | £1.6 billion | N/C | £2.3 billion | £0.59 billion | N/C | £14.7 billion | £2.8 billion | N/C |
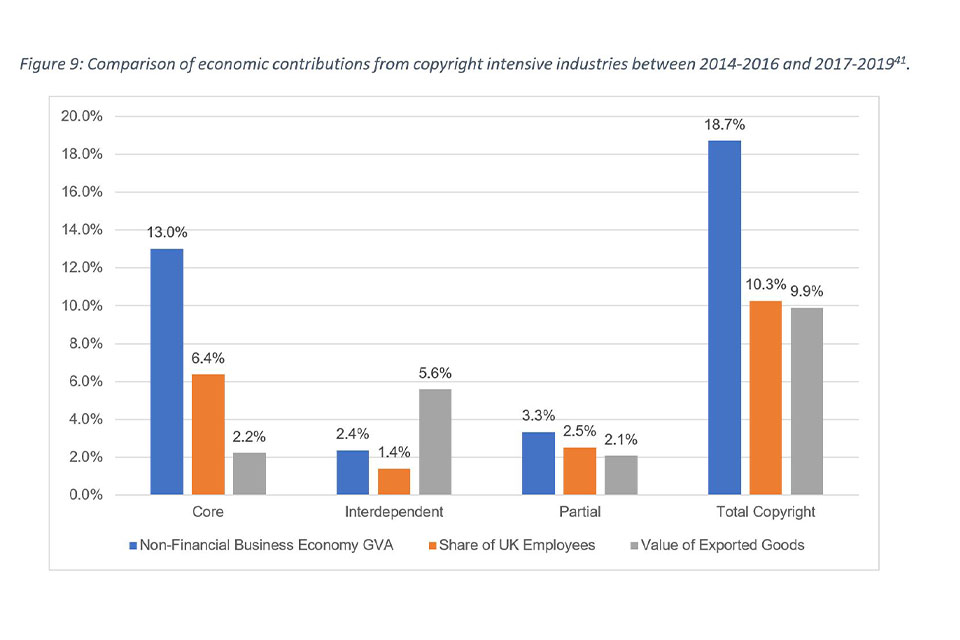
Figure 9 shows that 10.3% (3.1 million) of total UK employment in the UK is attributable to industries that fall under WIPO’s classification of copyright intensive, an increase of 1.1 million compared to 2014-2016 (Table 15). Core industries made up a large proportion of this total, with 6.4% (1.9 million) coming from these industries. Interdependent industries accounted for 1.4% (420,000) of total employment and partial industries 2.5% (757,000).
As with the three registered IP rights, data is not available for the financial industries, and so this section refers only to the GVA of the non-financial business economy in the UK. Industries classified as copyright intensive accounted for 18.7% (£233.6 billion) of UK value-added output. Core industries accounted for 13% (£162.6 billion, an increase by £13.6 billion), interdependent industries for 2.4% (£29.5 billion, an increase by £22.8 billion) and partial for 3.3% (£41.6 billion, an increase by £40.4 billion).
Copyright intensive industries accounted for 9.9% (£2.8 billion) of total goods export value came from industries that were classified as copyright intensive. 2.2% (£630.1 million) from core, 5.6% (£1.6 billion) from interdependent, and 2.1% (£588 million) from partial copyright industries.
Conclusion
Figure 9 shows that 10.3% (3.1 million) of total UK employment in the UK is attributable to industries that fall under WIPO’s classification of copyright intensive, an increase of 1.1 million compared to 2014-2016 (Table 15). Core industries made up a large proportion of this total, with 6.4% (1.9 million) coming from these industries. Interdependent industries accounted for 1.4% (420,000) of total employment and partial industries 2.5% (757,000).
As with the three registered IP rights, data is not available for the financial industries, and so this section refers only to the GVA of the non-financial business economy in the UK. Industries classified as copyright intensive accounted for 18.7% (£233.6 billion) of UK value-added output. Core industries accounted for 13% (£162.6 billion, an increase by £13.6 billion), interdependent industries for 2.4% (£29.5 billion, an increase by £22.8 billion) and partial for 3.3% (£41.6 billion, an increase by £40.4 billion).
Copyright intensive industries accounted for 9.9% (£2.8 billion) of total goods export value came from industries that were classified as copyright intensive. 2.2% (£630.1 million) from core, 5.6% (£1.6 billion) from interdependent, and 2.1% (£588 million) from partial copyright industries.
Appendices
Appendix 1: Data sources
Company data
Company level data from FAME, a commercially available database from Bureau Van Dijk [footnote 25] of UK companies containing industry and financial information. An extract of company data was taken in September 2019. This was matched to IP applicants to identify their primary area of activity (4 digit SIC code).
List of Economic data and sources
| Variable | Source | Limitations |
|---|---|---|
| Employees per 4-digit SIC | Business Register and Employment Survey (BRES) [footnote 30] | 5% of industries supressed |
| GVA of non-financial business economy | Annual Business Survey (ABS)[footnote 44] | The financial sector is not covered in this data |
| Export Value per 4-digit SIC | HMRC Trade Tables [footnote 28] | Covers only commodities |
Appendix 2: Comparison of numbers of industries in each intensity category between to 2014-2016 and 2017-2019 analysis
| IP Usage | Patents | Trade marks | Designs | |||
|---|---|---|---|---|---|---|
| 2014 - 2016 | 2017 - 2019 | 2014 - 2016 | 2017 - 2019 | 2014 - 2016 | 2017 - 2019 | |
| Number of industries with at least one registered right of 616 industries | 339 (55.03%) | 360 (58.44%) | 590 (95.77%) | 586 (95.13%) | 370 (60.06%) | 388 (62.99%) |
| Above average (Percentile) | 61 (9.90) | 64 (10.39) | 123 (19.97) | 116 (18.83) | 50 (8.11) | 75 (12.18) |
| High (Percentile) | 13 (2.11) | 17 (2.76) | 34 (5.52) | 25 (4.06) | 15 (2.43) | 18 (2.92) |
| Medium (Percentile) | 48 (7.79) | 47 (7.62) | 89 (14.45) | 91 (14.77) | 35 (5.68) | 57 (25) |
| Low (Percentile) | 253 (41.07) | 284 (46.10) | 410 (66.56) | 464 (75.32) | 303 (49.19) | 302 (49.03) |
| Unclassified (Percentile) | 25 (4.06) | 12 (1.95) | 57 (9.25) | 36 (5.84) | 17 (2.76) | 11 (1.78) |
Appendix 3: Categories - Patents
The following table lists those industries identifies as patent intensive (both under the High and medium classifications):
| Average | Number above Average | 2nd Average (for High Classification) |
|---|---|---|
| 2.8 | 61 | 11.8 |
| Sector | Description | IP Use | Value |
|---|---|---|---|
| 3099 | Manufacture of other transport equipment n.e.c. | High | 70.6 |
| 6420 | Activities of holding companies | High | 66.7 |
| 2811 | Manufacture of engines and turbines, except aircraft, vehicle and cycle engines | High | 57.3 |
| 2311 | Manufacture of flat glass | High | 52.8 |
| 7211 | Research and experimental development on biotechnology | High | 35.6 |
| 3299 | Other manufacturing n.e.c. | High | 34.1 |
| 2899 | Manufacture of other special purpose machinery n.e.c | High | 32.1 |
| 2110 | Manufacture of basic pharmaceutical products | High | 26.1 |
| 2344 | Manufacture of other technical ceramic products | High | 17.6 |
| 1395 | Manufacture of non-wovens and articles made from non-wovens, except apparel | High | 16.7 |
| 2790 | Manufacture of other electrical equipment | High | 14.1 |
| 2342 | Manufacture of ceramic sanitary fixtures | High | 13.5 |
| 7219 | Other research and experimental development on natural sciences and engineering | High | 12.5 |
| 2751 | Manufacture of electric domestic appliances | Medium | 11.7 |
| 2670 | Manufacture of optical instruments and photographic equipment | Medium | 11.6 |
| 2611 | Manufacture of electronic components | Medium | 11.0 |
| 2014 | Manufacture of other organic basic chemicals | Medium | 10.8 |
| 3250 | Manufacture of medical and dental instruments and supplies | Medium | 9.6 |
| 2891 | Manufacture of machinery for metallurgy | Medium | 9.2 |
| 2059 | Manufacture of other chemical products n.e.c. | Medium | 9.1 |
| 7740 | Leasing of intellectual property and similar products, except copyrighted works | Medium | 8.9 |
| 2910 | Manufacture of motor vehicles | Medium | 8.1 |
| 2572 | Manufacture of locks and hinges | Medium | 7.9 |
| 2651 | Manufacture of instruments and appliances for measuring, testing and navigation | Medium | 7.8 |
| 2813 | Manufacture of other pumps and compressors | Medium | 7.5 |
| 2896 | Manufacture of plastics and rubber machinery | Medium | 6.8 |
| 3030 | Manufacture of air and spacecraft and related machinery | Medium | 6.8 |
| 2640 | Manufacture of consumer electronics | Medium | 6.4 |
| 3530 | Steam and air conditioning supply | Medium | 6.4 |
| 2599 | Manufacture of other fabricated metal products n.e.c. | Medium | 5.9 |
| 2013 | Manufacture of other inorganic basic chemicals | Medium | 5.7 |
| 3092 | Manufacture of bicycles and invalid carriages | Medium | 5.5 |
| 2630 | Manufacture of communication equipment | Medium | 5.0 |
| 2892 | Manufacture of machinery for mining, quarrying and construction | Medium | 4.8 |
| 2740 | Manufacture of electric lighting equipment | Medium | 4.7 |
| 7220 | Research and experimental development on social sciences and humanities | Medium | 4.6 |
| 6120 | Wireless telecommunications activities | Medium | 4.5 |
| 2016 | Manufacture of plastics in primary forms | Medium | 4.4 |
| 2814 | Manufacture of other taps and valves | Medium | 4.4 |
| 2931 | Manufacture of electrical and electronic equipment for motor vehicles | Medium | 4.4 |
| 3230 | Manufacture of sports goods | Medium | 4.4 |
| 2365 | Manufacture of fibre cement | Medium | 4.3 |
| 2229 | Manufacture of other plastic products | Medium | 4.2 |
| 2711 | Manufacture of electric motors, generators and transformers | Medium | 4.1 |
| 2821 | Manufacture of ovens, furnaces and furnace burners | Medium | 4.1 |
| 2893 | Manufacture of machinery for food, beverage and tobacco processing | Medium | 4.0 |
| 4799 | Other retail sale not in stores, stalls or markets | Medium | 4.0 |
| 2812 | Manufacture of fluid power equipment | Medium | 3.8 |
| 2612 | Manufacture of loaded electronic boards | Medium | 3.6 |
| 1399 | Manufacture of other textiles n.e.c. | Medium | 3.5 |
| 9900 | Activities of extraterritorial organisations and bodies | Medium | 3.5 |
| 2369 | Manufacture of other articles of concrete, plaster and cement | Medium | 3.4 |
| 2660 | Manufacture of irradiation, electromedical and electrotherapeutic equipment | Medium | 3.4 |
| 7490 | Other professional, scientific and technical activities n.e.c. | Medium | 3.3 |
| 1086 | Manufacture of homogenised food preparations and dietetic food | Medium | 3.2 |
| 8299 | Other business support service activities n.e.c. | Medium | 3.2 |
| 2815 | Manufacture of bearings, gears, gearing and driving elements | Medium | 3.1 |
| 2620 | Manufacture of computers and peripheral equipment | Medium | 3.0 |
| 1414 | Manufacture of underwear | Medium | 2.9 |
| 3240 | Manufacture of games and toys | Medium | 2.9 |
| 6209 | Other information technology and computer service activities | Medium | 2.9 |
Appendix 4: Categories – Trade marks
| Average | Number above average | 2nd average (for high classification) |
| 18.1 | 123 | 60.6 |
| Sector | Description | IP Use | Value |
|---|---|---|---|
| 6420 | Activities of holding companies | High | 568.8 |
| 1200 | Manufacture of tobacco products | High | 385.7 |
| 9900 | Activities of extraterritorial organisations and bodies | High | 289.4 |
| 3299 | Other manufacturing n.e.c. | High | 211.9 |
| 1102 | Manufacture of wine from grape | High | 148.6 |
| 4619 | Agents involved in the sale of a variety of goods | High | 141.3 |
| 1101 | Distilling, rectifying and blending of spirits | High | 133.4 |
| 1419 | Manufacture of other wearing apparel and accessories | High | 132.2 |
| 2110 | Manufacture of basic pharmaceutical products | High | 129.7 |
| 3240 | Manufacture of games and toys | High | 120.2 |
| 1411 | Manufacture of leather clothes | High | 120.0 |
| 5030 | Inland passenger water transport | High | 118.7 |
| 2652 | Manufacture of watches and clocks | High | 117.7 |
| 2640 | Manufacture of consumer electronics | High | 114.7 |
| 4675 | Wholesale of chemical products | High | 112.2 |
| 4799 | Other retail sale not in stores, stalls or markets | High | 111.8 |
| 5821 | Publishing of computer games | High | 110.8 |
| 2060 | Manufacture of man-made fibres | High | 105.0 |
| 7740 | Leasing of intellectual property and similar products, except copyrighted works | High | 104.6 |
| 4782 | Retail sale via stalls and markets of textiles, clothing and footwear | High | 101.8 |
| 4617 | Agents involved in the sale of food, beverages and tobacco | High | 95.2 |
| 6399 | Other information service activities n.e.c. | High | 87.0 |
| 3099 | Manufacture of other transport equipment n.e.c. | High | 84.2 |
| 1395 | Manufacture of non-wovens and articles made from non-wovens, except apparel | High | 80.0 |
| 5829 | Other software publishing | High | 79.0 |
| 1399 | Manufacture of other textiles n.e.c. | High | 77.2 |
| 1414 | Manufacture of underwear | High | 77.1 |
| 4637 | Wholesale of coffee, tea, cocoa and spices | High | 77.1 |
| 4616 | Agents involved in the sale of textiles, clothing, fur, footwear and leather goods | High | 74.0 |
| 5812 | Publishing of directories and mailing lists | High | 72.6 |
| 1105 | Manufacture of beer | High | 72.5 |
| 3230 | Manufacture of sports goods | High | 69.2 |
| 5920 | Sound recording and music publishing activities | High | 65.0 |
| 1086 | Manufacture of homogenised food preparations and dietetic food | High | 61.1 |
| 4540 | Sale, maintenance and repair of motorcycles and related parts and accessories | Medium | 60.2 |
| 1032 | Manufacture of fruit and vegetable juice | Medium | 59.2 |
| 2790 | Manufacture of other electrical equipment | Medium | 56.8 |
| 2899 | Manufacture of other special-purpose machinery n.e.c. | Medium | 56.3 |
| 4791 | Retail sale via mail order houses or via Internet | Medium | 56.0 |
| 6203 | Computer facilities management activities | Medium | 55.3 |
| 2059 | Manufacture of other chemical products n.e.c. | Medium | 55.2 |
| 1103 | Manufacture of cider and other fruit wines | Medium | 54.2 |
| 1512 | Manufacture of luggage, handbags and the like, saddlery and harness | Medium | 53.6 |
| 1511 | Tanning and dressing of leather; dressing and dyeing of fur | Medium | 53.2 |
| 1413 | Manufacture of other outerwear | Medium | 50.7 |
| 4642 | Wholesale of clothing and footwear | Medium | 49.6 |
| 6810 | Buying and selling of own real estate | Medium | 47.3 |
| 3212 | Manufacture of jewellery and related articles | Medium | 46.0 |
| 4634 | Wholesale of beverages | Medium | 45.0 |
| 6209 | Other information technology and computer service activities | Medium | 45.0 |
| 7211 | Research and experimental development on biotechnology | Medium | 44.9 |
| 9609 | Other personal service activities n.e.c. | Medium | 44.3 |
| 2599 | Manufacture of other fabricated metal products n.e.c. | Medium | 43.8 |
| 4615 | Agents involved in the sale of furniture, household goods, hardware and ironmongery | Medium | 43.7 |
| 4676 | Wholesale of other intermediate products | Medium | 42.8 |
| 1083 | Processing of tea and coffee | Medium | 41.8 |
| 4789 | Retail sale via stalls and markets of other goods | Medium | 41.7 |
| 5819 | Other publishing activities | Medium | 41.7 |
| 4618 | Agents specialised in the sale of other particular products | Medium | 41.6 |
| 2670 | Manufacture of optical instruments and photographic equipment | Medium | 40.7 |
| 1107 | Manufacture of soft drinks; production of mineral waters and other bottled waters | Medium | 39.5 |
| 4648 | Wholesale of watches and jewellery | Medium | 38.9 |
| 6312 | Web portals | Medium | 38.6 |
| 5811 | Book publishing | Medium | 38.5 |
| 1431 | Manufacture of knitted and crocheted hosiery | Medium | 37.5 |
| 4690 | Non-specialised wholesale trade | Medium | 37.2 |
| 4613 | Agents involved in the sale of timber and building materials | Medium | 36.6 |
| 8299 | Other business support service activities n.e.c. | Medium | 36.3 |
| 9003 | Artistic creation | Medium | 35.9 |
| 4774 | Retail sale of medical and orthopaedic goods in specialised stores | Medium | 35.8 |
| 9002 | Support activities to performing arts | Medium | 35.4 |
| 3092 | Manufacture of bicycles and invalid carriages | Medium | 35.0 |
| 1092 | Manufacture of prepared pet foods | Medium | 34.8 |
| 1820 | Reproduction of recorded media | Medium | 34.3 |
| 9604 | Physical well-being activities | Medium | 33.9 |
| 2311 | Manufacture of flat glass | Medium | 33.1 |
| 4635 | Wholesale of tobacco products | Medium | 32.9 |
| 6499 | Other financial service activities, except insurance and pension funding, n.e.c. | Medium | 31.5 |
| 7490 | Other professional, scientific and technical activities n.e.c. | Medium | 30.1 |
| 2571 | Manufacture of cutlery | Medium | 30.0 |
| 6110 | Wired telecommunications activities | Medium | 29.8 |
| 9319 | Other sports activities | Medium | 28.7 |
| 4645 | Wholesale of perfume and cosmetics | Medium | 28.6 |
| 3319 | Repair of other equipment | Medium | 28.5 |
| 4723 | Retail sale of fish, crustaceans and molluscs in specialised stores | Medium | 28.5 |
| 1392 | Manufacture of made-up textile articles, except apparel | Medium | 28.3 |
| 2344 | Manufacture of other technical ceramic products | Medium | 28.2 |
| 1052 | Manufacture of ice cream | Medium | 27.7 |
| 8622 | Specialist medical practice activities | Medium | 27.2 |
| 1089 | Manufacture of other food products n.e.c. | Medium | 27.1 |
| 4641 | Wholesale of textiles | Medium | 27.1 |
| 2042 | Manufacture of perfumes and toilet preparations | Medium | 26.9 |
| 1041 | Manufacture of oils and fats | Medium | 26.8 |
| 8560 | Educational support activities | Medium | 26.4 |
| 7990 | Other reservation service and related activities | Medium | 26.2 |
| 1061 | Manufacture of grain mill products | Medium | 25.4 |
| 4614 | Agents involved in the sale of machinery, industrial equipment, ships and aircraft | Medium | 25.3 |
| 3220 | Manufacture of musical instruments | Medium | 25.1 |
| 3291 | Manufacture of brooms and brushes | Medium | 24.7 |
| 6201 | Computer programming activities | Medium | 24.1 |
| 7911 | Travel agency activities | Medium | 24.1 |
| 4743 | Retail sale of audio and video equipment in specialised stores | Medium | 23.6 |
| 1412 | Manufacture of workwear | Medium | 23.5 |
| 1082 | Manufacture of cocoa, chocolate and sugar confectionery | Medium | 23.4 |
| 4649 | Wholesale of other household goods | Medium | 22.9 |
| 9411 | Activities of business and employers membership organisations | Medium | 22.9 |
| 2041 | Manufacture of soap and detergents, cleaning and polishing preparations | Medium | 22.8 |
| 2015 | Manufacture of fertilisers and nitrogen compounds | Medium | 22.4 |
| 5911 | Motion picture, video and television programme production activities | Medium | 22.1 |
| 1106 | Manufacture of malt | Medium | 21.2 |
| 2349 | Manufacture of other ceramic products | Medium | 20.5 |
| 2740 | Manufacture of electric lighting equipment | Medium | 20.4 |
| 1723 | Manufacture of paper stationery | Medium | 20.3 |
| 7312 | Media representation | Medium | 20.2 |
| 1622 | Manufacture of assembled parquet floors | Medium | 20.0 |
| 2620 | Manufacture of computers and peripheral equipment | Medium | 20.0 |
| 8552 | Cultural education | Medium | 19.7 |
| 1520 | Manufacture of footwear | Medium | 19.6 |
| 2651 | Manufacture of instruments and appliances for measuring, testing and navigation | Medium | 19.6 |
| 7410 | Specialised design activities | Medium | 19.5 |
| 5814 | Publishing of journals and periodicals | Medium | 18.4 |
| 7021 | Public relations and communication activities | Medium | 18.2 |
| 8553 | Driving school activities | Medium | 18.2 |
Appendix 5: Categories - Registered designs
| Average | Number above average | 2nd average (for high classification) |
|---|---|---|
| 8.1 | 50 | 49.4 |
| Sector | Description | IP Use | Value |
|---|---|---|---|
| 2571 | Manufacture of cutlery | High | 332.7 |
| 1411 | Manufacture of leather clothes | High | 175.0 |
| 2344 | Manufacture of other technical ceramic products | High | 160.6 |
| 4789 | Retail sale via stalls and markets of other goods | High | 160.4 |
| 4799 | Other retail sale not in stores, stalls or markets | High | 108.8 |
| 7410 | Specialised design activities | High | 104.4 |
| 3299 | Other manufacturing n.e.c. | High | 94.8 |
| 3212 | Manufacture of jewellery and related articles | High | 90.2 |
| 1414 | Manufacture of underwear | High | 82.9 |
| 3099 | Manufacture of other transport equipment n.e.c. | High | 78.4 |
| 1724 | Manufacture of wallpaper | High | 77.6 |
| 1419 | Manufacture of other wearing apparel and accessories | High | 71.8 |
| 1512 | Manufacture of luggage, handbags and the like, saddlery and harness | High | 61.6 |
| 1200 | Manufacture of tobacco products | High | 55.7 |
| 2443 | Lead, zinc and tin production | High | 51.6 |
| 9900 | Activities of extraterritorial organisations and bodies | Medium | 47.6 |
| 3240 | Manufacture of games and toys | Medium | 45.0 |
| 6420 | Activities of holding companies | Medium | 44.7 |
| 4616 | Agents involved in the sale of textiles, clothing, fur, footwear and leather goods | Medium | 44.0 |
| 3230 | Manufacture of sports goods | Medium | 42.6 |
| 4647 | Wholesale of furniture, carpets and lighting equipment | Medium | 37.1 |
| 7740 | Leasing of intellectual property and similar products, except copyrighted works | Medium | 35.7 |
| 2331 | Manufacture of ceramic tiles and flags | Medium | 35.0 |
| 4791 | Retail sale via mail order houses or via Internet | Medium | 32.2 |
| 4619 | Agents involved in the sale of a variety of goods | Medium | 27.3 |
| 4649 | Wholesale of other household goods | Medium | 24.7 |
| 6910 | Legal activities | Medium | 22.7 |
| 4615 | Agents involved in the sale of furniture, household goods, hardware and ironmongery | Medium | 22.4 |
| 1399 | Manufacture of other textiles n.e.c. | Medium | 22.1 |
| 4642 | Wholesale of clothing and footwear | Medium | 21.7 |
| 4690 | Non-specialised wholesale trade | Medium | 20.5 |
| 4532 | Retail trade of motor vehicle parts and accessories | Medium | 20.2 |
| 3109 | Manufacture of other furniture | Medium | 17.3 |
| 4641 | Wholesale of textiles | Medium | 16.9 |
| 2640 | Manufacture of consumer electronics | Medium | 15.1 |
| 2444 | Copper production | Medium | 15.0 |
| 4782 | Retail sale via stalls and markets of textiles, clothing and footwear | Medium | 15.0 |
| 2751 | Manufacture of electric domestic appliances | Medium | 14.8 |
| 5819 | Other publishing activities | Medium | 14.1 |
| 2313 | Manufacture of hollow glass | Medium | 12.8 |
| 2229 | Manufacture of other plastic products | Medium | 11.2 |
| 2740 | Manufacture of electric lighting equipment | Medium | 10.7 |
| 2599 | Manufacture of other fabricated metal products n.e.c. | Medium | 10.4 |
| 2790 | Manufacture of other electrical equipment | Medium | 9.6 |
| 4613 | Agents involved in the sale of timber and building materials | Medium | 9.6 |
| 4648 | Wholesale of watches and jewellery | Medium | 9.5 |
| 2899 | Manufacture of other special-purpose machinery n.e.c. | Medium | 9.4 |
| 4644 | Wholesale of china and glassware and cleaning materials | Medium | 8.8 |
| 4665 | Wholesale of office furniture | Medium | 8.3 |
| 2521 | Manufacture of central heating radiators and boilers | Medium | 8.1 |
Appendix 6: Industries list with above average IP use across multiple IP rights
The following table lists all industries that have a high or medium classification in at least one IPR.
| SIC | Description | Patent | Trade mark | Designs | Copyright |
|---|---|---|---|---|---|
| 1032 | Manufacture of fruit and vegetable juice | - | x | - | - |
| 1041 | Manufacture of oils and fats | - | x | - | - |
| 1052 | Manufacture of ice cream | - | x | - | - |
| 1061 | Manufacture of grain mill products | - | x | - | - |
| 1082 | Manufacture of cocoa, chocolate and sugar confectionery | - | x | - | - |
| 1083 | Processing of tea and coffee | - | x | - | - |
| 1086 | Manufacture of homogenised food preparations and dietetic food | x | x | - | - |
| 1089 | Manufacture of other food products n.e.c. | - | x | - | - |
| 1092 | Manufacture of prepared pet foods | - | x | - | - |
| 1101 | Distilling, rectifying and blending of spirits | - | x | - | - |
| 1102 | Manufacture of wine from grape | - | x | - | - |
| 1103 | Manufacture of cider and other fruit wines | - | x | - | - |
| 1105 | Manufacture of beer | - | x | - | - |
| 1106 | Manufacture of malt | - | x | - | - |
| 1107 | Manufacture of soft drinks; production of mineral waters and other bottled waters | - | x | - | - |
| 1200 | Manufacture of tobacco products | - | x | x | - |
| 1392 | Manufacture of made-up textile articles, except apparel | - | x | - | - |
| 1395 | Manufacture of non-wovens and articles made from non-wovens, except apparel | x | x | - | - |
| 1399 | Manufacture of other textiles n.e.c. | x | x | x | - |
| 1411 | Manufacture of leather clothes | - | x | x | - |
| 1412 | Manufacture of workwear | - | x | - | - |
| 1413 | Manufacture of other outerwear | - | x | - | - |
| 1414 | Manufacture of underwear | x | x | x | - |
| 1419 | Manufacture of other wearing apparel and accessories | - | x | x | - |
| 1431 | Manufacture of knitted and crocheted hosiery | - | x | - | - |
| 1511 | Tanning and dressing of leather; dressing and dyeing of fur | - | x | - | - |
| 1512 | Manufacture of luggage, handbags and the like, saddlery and harness | - | x | x | - |
| 1520 | Manufacture of footwear | - | x | - | - |
| 1622 | Manufacture of assembled parquet floors | - | x | - | - |
| 1711 | Manufacture of pulp | - | - | - | x |
| 1712 | Manufacture of paper and paperboard | - | - | - | x |
| 1723 | Manufacture of paper stationery | - | x | - | - |
| 1724 | Manufacture of wallpaper | - | - | x | - |
| 1811 | Printing of newspapers | - | - | - | x |
| 1812 | Other printing | - | - | - | x |
| 1813 | Pre-press and pre-media services | - | - | - | x |
| 1814 | Binding and related services | - | - | - | x |
| 1820 | Reproduction of recorded media | - | x | - | x |
| 2013 | Manufacture of other inorganic basic chemicals | x | - | - | - |
| 2014 | Manufacture of other organic basic chemicals | x | - | - | - |
| 2015 | Manufacture of fertilisers and nitrogen compounds | - | x | - | - |
| 2016 | Manufacture of plastics in primary forms | x | - | - | - |
| 2041 | Manufacture of soap and detergents, cleaning and polishing preparations | - | x | - | - |
| 2042 | Manufacture of perfumes and toilet preparations | - | x | - | - |
| 2059 | Manufacture of other chemical products n.e.c. | x | x | - | x |
| 2060 | Manufacture of man-made fibres | - | x | - | - |
| 2110 | Manufacture of basic pharmaceutical products | x | x | - | - |
| 2229 | Manufacture of other plastic products | x | - | x | - |
| 2311 | Manufacture of flat glass | x | x | - | - |
| 2313 | Manufacture of hollow glass | - | - | x | - |
| 2331 | Manufacture of ceramic tiles and flags | - | - | x | - |
| 2342 | Manufacture of ceramic sanitary fixtures | x | - | - | - |
| 2344 | Manufacture of other technical ceramic products | x | x | x | - |
| 2349 | Manufacture of other ceramic products | - | x | - | - |
| 2365 | Manufacture of fibre cement | x | - | - | - |
| 2369 | Manufacture of other articles of concrete, plaster and cement | x | - | - | - |
| 2443 | Lead, zinc and tin production | - | - | x | - |
| 2444 | Copper production | - | - | x | - |
| 2521 | Manufacture of central heating radiators and boilers | - | - | x | - |
| 2571 | Manufacture of cutlery | - | x | x | - |
| 2572 | Manufacture of locks and hinges | x | - | - | - |
| 2599 | Manufacture of other fabricated metal products n.e.c. | x | x | x | - |
| 2611 | Manufacture of electronic components | x | - | - | - |
| 2612 | Manufacture of loaded electronic boards | x | - | - | - |
| 2620 | Manufacture of computers and peripheral equipment | x | x | - | x |
| 2630 | Manufacture of communication equipment | x | - | - | x |
| 2640 | Manufacture of consumer electronics | x | x | x | x |
| 2651 | Manufacture of instruments and appliances for measuring, testing and navigation | x | x | - | - |
| 2652 | Manufacture of watches and clocks | - | x | - | - |
| 2660 | Manufacture of irradiation, electromedical and electrotherapeutic equipment | x | - | - | - |
| 2670 | Manufacture of optical instruments and photographic equipment | x | x | - | x |
| 2711 | Manufacture of electric motors, generators and transformers | x | - | - | - |
| 2731 | Manufacture of fibre optic cables | - | - | - | x |
| 2740 | Manufacture of electric lighting equipment | x | x | x | - |
| 2751 | Manufacture of electric domestic appliances | x | - | x | - |
| 2790 | Manufacture of other electrical equipment | x | x | x | - |
| 2811 | Manufacture of engines and turbines, except aircraft, vehicle and cycle engines | x | - | - | - |
| 2812 | Manufacture of fluid power equipment | x | - | - | - |
| 2813 | Manufacture of other pumps and compressors | x | - | - | - |
| 2814 | Manufacture of other taps and valves | x | - | - | - |
| 2815 | Manufacture of bearings, gears, gearing and driving elements | x | - | - | - |
| 2821 | Manufacture of ovens, furnaces and furnace burners | x | - | - | - |
| 2823 | Manufacture of office machinery and equipment (except computers and peripheral equipment) | - | - | - | x |
| 2891 | Manufacture of machinery for metallurgy | x | - | - | - |
| 2892 | Manufacture of machinery for mining, quarrying and construction | x | - | - | - |
| 2893 | Manufacture of machinery for food, beverage and tobacco processing | x | - | - | - |
| 2896 | Manufacture of plastics and rubber machinery | x | - | - | - |
| 2899 | Manufacture of other special-purpose machinery n.e.c. | x | x | x | - |
| 2910 | Manufacture of motor vehicles | x | - | - | - |
| 2931 | Manufacture of electrical and electronic equipment for motor vehicles | x | - | - | - |
| 3030 | Manufacture of air and spacecraft and related machinery | x | - | - | - |
| 3092 | Manufacture of bicycles and invalid carriages | x | x | - | - |
| 3099 | Manufacture of other transport equipment n.e.c. | x | x | x | - |
| 3101 | Manufacture of office and shop furniture | - | - | - | x |
| 3102 | Manufacture of kitchen furniture | - | - | - | x |
| 3103 | Manufacture of mattresses | - | - | - | x |
| 3109 | Manufacture of other furniture | - | - | x | x |
| 3211 | Striking of coins | - | - | - | x |
| 3212 | Manufacture of jewellery and related articles | - | x | x | x |
| 3220 | Manufacture of musical instruments | - | x | - | x |
| 3230 | Manufacture of sports goods | x | x | x | - |
| 3240 | Manufacture of games and toys | x | x | x | x |
| 3250 | Manufacture of medical and dental instruments and supplies | x | - | - | - |
| 3291 | Manufacture of brooms and brushes | - | x | - | - |
| 3299 | Other manufacturing n.e.c. | x | x | x | - |
| 3319 | Repair of other equipment | - | x | - | - |
| 3530 | Steam and air conditioning supply | x | - | - | - |
| 4532 | Retail trade of motor vehicle parts and accessories | - | - | x | - |
| 4540 | Sale, maintenance and repair of motorcycles and related parts and accessories | - | x | - | - |
| 4613 | Agents involved in the sale of timber and building materials | - | x | x | - |
| 4614 | Agents involved in the sale of machinery, industrial equipment, ships and aircraft | - | x | - | - |
| 4615 | Agents involved in the sale of furniture, household goods, hardware and ironmongery | - | x | x | - |
| 4616 | Agents involved in the sale of textiles, clothing, fur, footwear and leather goods | - | x | x | - |
| 4617 | Agents involved in the sale of food, beverages and tobacco | - | x | - | - |
| 4618 | Agents specialised in the sale of other particular products | - | x | - | - |
| 4619 | Agents involved in the sale of a variety of goods | - | x | x | - |
| 4634 | Wholesale of beverages | - | x | - | - |
| 4635 | Wholesale of tobacco products | - | x | - | - |
| 4637 | Wholesale of coffee, tea, cocoa and spices | - | x | - | - |
| 4641 | Wholesale of textiles | - | x | x | - |
| 4642 | Wholesale of clothing and footwear | - | x | x | - |
| 4643 | Wholesale of electrical household appliances | - | - | - | x |
| 4644 | Wholesale of china and glassware and cleaning materials | - | - | x | - |
| 4645 | Wholesale of perfume and cosmetics | - | x | - | - |
| 4647 | Wholesale of furniture, carpets and lighting equipment | - | - | x | - |
| 4648 | Wholesale of watches and jewellery | - | x | x | - |
| 4649 | Wholesale of other household goods | - | x | x | - |
| 4651 | Wholesale of computers, computer peripheral equipment and software | - | - | - | x |
| 4652 | Wholesale of electronic and telecommunications equipment and parts | - | - | - | x |
| 4665 | Wholesale of office furniture | - | - | x | - |
| 4666 | Wholesale of other office machinery and equipment | - | - | - | x |
| 4675 | Wholesale of chemical products | - | x | - | - |
| 4676 | Wholesale of other intermediate products | - | x | - | x |
| 4690 | Non-specialised wholesale trade | - | x | x | - |
| 4723 | Retail sale of fish, crustaceans and molluscs in specialised stores | - | x | - | - |
| 4741 | Retail sale of computers, peripheral units and software in specialised stores | - | - | - | x |
| 4743 | Retail sale of audio and video equipment in specialised stores | - | x | - | x |
| 4761 | Retail sale of books in specialised stores | - | - | - | x |
| 4762 | Retail sale of newspapers and stationery in specialised stores | - | - | - | x |
| 4763 | Retail sale of music and video recordings in specialised stores | - | - | - | x |
| 4774 | Retail sale of medical and orthopaedic goods in specialised stores | - | x | - | - |
| 4778 | Other retail sale of new goods in specialised stores | - | - | - | x |
| 4782 | Retail sale via stalls and markets of textiles, clothing and footwear | - | x | x | - |
| 4789 | Retail sale via stalls and markets of other goods | - | x | x | - |
| 4791 | Retail sale via mail order houses or via Internet | - | x | x | - |
| 4799 | Other retail sale not in stores, stalls or markets | x | x | x | - |
| 5030 | Inland passenger water transport | - | x | - | - |
| 5811 | Book publishing | - | x | - | x |
| 5812 | Publishing of directories and mailing lists | - | x | - | - |
| 5813 | Publishing of newspapers | - | - | - | x |
| 5814 | Publishing of journals and periodicals | - | x | - | x |
| 5819 | Other publishing activities | - | x | x | x |
| 5821 | Publishing of computer games | - | x | - | x |
| 5829 | Other software publishing | - | x | - | x |
| 5911 | Motion picture, video and television programme production activities | - | x | - | x |
| 5912 | Motion picture, video and television programme post-production activities | - | - | - | x |
| 5913 | Motion picture, video and television programme distribution activities | - | - | - | x |
| 5914 | Motion picture projection activities | - | - | - | x |
| 5920 | Sound recording and music publishing activities | - | x | - | x |
| 6010 | Radio broadcasting | - | - | - | x |
| 6020 | Television programming and broadcasting activities | - | - | - | x |
| 6110 | Wired telecommunications activities | - | x | - | x |
| 6120 | Wireless telecommunications activities | x | - | - | x |
| 6130 | Satellite telecommunications activities | - | - | - | x |
| 6190 | Other telecommunications activities | - | - | - | x |
| 6201 | Computer programming activities | - | x | - | x |
| 6202 | Computer consultancy activities | - | - | - | x |
| 6203 | Computer facilities management activities | - | x | - | x |
| 6209 | Other information technology and computer service activities | x | x | - | x |
| 6311 | Data processing, hosting and related activities | - | - | - | x |
| 6312 | Web portals | - | x | - | x |
| 6391 | News agency activities | - | - | - | x |
| 6399 | Other information service activities n.e.c. | - | x | - | x |
| 6420 | Activities of holding companies | x | x | x | - |
| 6499 | Other financial service activities, except insurance and pension funding, n.e.c. | - | x | - | - |
| 6810 | Buying and selling of own real estate | - | x | - | - |
| 6910 | Legal activities | - | - | x | - |
| 7021 | Public relations and communication activities | - | x | - | - |
| 7111 | Architectural activities | - | - | - | x |
| 7112 | Engineering activities and related technical consultancy | - | - | - | x |
| 7211 | Research and experimental development on biotechnology | x | x | - | - |
| 7219 | Other research and experimental development on natural sciences and engineering | x | - | - | - |
| 7220 | Research and experimental development on social sciences and humanities | x | - | - | - |
| 7311 | Advertising agencies | - | - | - | x |
| 7312 | Media representation | - | x | - | x |
| 7410 | Specialised design activities | - | x | x | x |
| 7420 | Photographic activities | - | - | - | x |
| 7430 | Translation and interpretation activities | - | - | - | x |
| 7490 | Other professional, scientific and technical activities n.e.c. | x | x | - | - |
| 7722 | Renting of video tapes and disks | - | - | - | x |
| 7729 | Renting and leasing of other personal and household goods | - | - | - | x |
| 7733 | Renting and leasing of office machinery and equipment (including computers) | - | - | - | x |
| 7739 | Renting and leasing of other machinery, equipment and tangible goods n.e.c. | - | - | - | x |
| 7740 | Leasing of intellectual property and similar products, except copyrighted works | x | x | x | - |
| 7911 | Travel agency activities | - | x | - | - |
| 7990 | Other reservation service and related activities | - | x | - | x |
| 8219 | Photocopying, document preparation and other specialised office support activities | - | - | - | x |
| 8299 | Other business support service activities n.e.c. | x | x | - | - |
| 8552 | Cultural education | - | x | - | x |
| 8553 | Driving school activities | - | x | - | - |
| 8560 | Educational support activities | - | x | - | - |
| 8622 | Specialist medical practice activities | - | x | - | - |
| 9001 | Performing arts | - | - | - | x |
| 9002 | Support activities to performing arts | - | x | - | x |
| 9003 | Artistic creation | - | x | - | x |
| 9004 | Operation of arts facilities | - | - | - | x |
| 9101 | Library and archive activities | - | - | - | x |
| 9102 | Museum activities | - | - | - | x |
| 9103 | Operation of historical sites and buildings and similar visitor attractions | - | - | - | x |
| 9319 | Other sports activities | - | x | - | - |
| 9321 | Activities of amusement parks and theme parks | - | - | - | x |
| 9329 | Other amusement and recreation activities | - | - | - | x |
| 9411 | Activities of business and employers membership organisations | - | x | - | - |
| 9412 | Activities of professional membership organisations | - | - | - | x |
| 9499 | Activities of other membership organisations n.e.c. | - | - | - | x |
| 9604 | Physical well-being activities | - | x | - | - |
| 9609 | Other personal service activities n.e.c. | - | x | - | - |
| 9900 | Activities of extraterritorial organisations and bodies | x | x | x | - |
Appendix 6: Classification groupings of copyright industries
Below is a list of all copyright intensive industries used in this paper to estimate the economic contribution these industries make to the UK economy. This is based on industries that are identified by WIPO as copyright intensive and for this paper we only consider those that are thought to have at least 20% of their activity contributable to copyright related activities.
According to WIPO, these industries “as a category would not exist or would be significantly different without copyright in works or other subject matter.” Therefore, their entire economic contribution in terms of non-financial business economy GVA, employment and export value has been considered.
Core
| SIC | Industry description | Factor |
|---|---|---|
| 5811 | Book publishing | 100% |
| 5813 | Publishing of newspapers | 100% |
| 5814 | Publishing of journals and periodicals | 100% |
| 5819 | Other publishing activities | 100% |
| 5821 | Publishing of computer games | 100% |
| 5829 | Other software publishing | 100% |
| 5911 | Motion picture, video and television programme production activities | 100% |
| 5912 | Motion picture, video and television programme post-production activities | 100% |
| 5913 | Motion picture, video and television programme distribution activities | 100% |
| 5914 | Motion picture projection activities | 100% |
| 5920 | Sound recording and music publishing activities | 100% |
| 6010 | Radio broadcasting | 100% |
| 6020 | Television programming and broadcasting activities | 100% |
| 6120 | Wireless telecommunications activities | 100% |
| 6201 | Computer programming activities | 100% |
| 6202 | Computer consultancy activities | 100% |
| 6203 | Computer facilities management activities | 100% |
| 6209 | Other information technology and computer service activities | 100% |
| 6312 | Web portals | 100% |
| 6391 | News agency activities | 100% |
| 6399 | Other information service activities n.e.c. | 100% |
| 7311 | Advertising agencies | 100% |
| 7312 | Media representation | 100% |
| 7410 | Specialised design activities | 100% |
| 7420 | Photographic activities | 100% |
| 7430 | Translation and interpretation activities | 100% |
| 9001 | Performing arts | 100% |
| 9002 | Support activities to performing arts | 100% |
| 9003 | Artistic creation | 100% |
| 9101 | Library and archive activities | 100% |
| 9329 | Other amusement and recreation activities | 100% |
| 1811 | Printing of newspapers | 100% |
| 1812 | Other printing | 100% |
| 1813 | Pre-press and pre-media services | 100% |
| 1814 | Binding and related services | 100% |
| 1820 | Reproduction of recorded media | 100% |
| 4761 | Retail sale of books in specialised stores | 100% |
| 4762 | Retail sale of newspapers and stationery in specialised stores | 100% |
| 4763 | Retail sale of music and video recordings in specialised stores | 100% |
| 6110 | Wired telecommunications activities | 100% |
| 6130 | Satellite telecommunications activities | 100% |
| 6190 | Other telecommunications activities | 100% |
| 6311 | Data processing, hosting and related activities | 100% |
| 7990 | Other reservation service and related activities | 100% |
| 8219 | Photocopying, document preparation and other specialised office support activities | 100% |
| 8552 | Cultural education | 100% |
| 9004 | Operation of arts facilities | 100% |
| 9321 | Activities of amusement parks and theme parks | 100% |
| 9412 | Activities of professional membership organisations | 100% |
Interdependent copyright industries are those engaged in the production, manufacture and sale of equipment whose function is wholly or primarily to facilitate the creation, production or use of works and other protected subject matter.
All interdependent copyright industries have been included in the estimates of copyright intensive industries’ contribution to the UK economy. Even though SIC 4643: Wholesale of electrical household appliances registers a factor intensity below 20%, it is included in the analysis as the EUIPO/EPO included all interdependent copyright industries, regardless of their factor intensity.
Interdependent
| SIC | Industry description | Factor |
|---|---|---|
| 1711 | Manufacture of pulp | 25% |
| 1712 | Manufacture of paper and paperboard | 25% |
| 2059 | Manufacture of other chemical products n.e.c. | 25% |
| 2620 | Manufacture of computers and peripheral equipment | 30% |
| 2630 | Manufacture of communication equipment | 30% |
| 2640 | Manufacture of consumer electronics | 30% |
| 2670 | Manufacture of optical instruments and photographic equipment | 30% |
| 2731 | Manufacture of fibre optic cables | 30% |
| 2823 | Manufacture of office machinery and equipment (except computers and peripheral equipment) | 30% |
| 3220 | Manufacture of musical instruments | 35% |
| 4643 | Wholesale of electrical household appliances | 19% |
| 4651 | Wholesale of computers, computer peripheral equipment and software | 30% |
| 4652 | Wholesale of electronic and telecommunications equipment and parts | 25% |
| 4666 | Wholesale of other office machinery and equipment | 30% |
| 4676 | Wholesale of other intermediate products | 25% |
| 4741 | Retail sale of computers, peripheral units and software in specialised stores | 33% |
| 4743 | Retail sale of audio and video equipment in specialised stores | 33% |
| 4778 | Other retail sale of new goods in specialised stores | 33% |
| 7722 | Renting of video tapes and disks | 20% |
| 7729 | Renting and leasing of other personal and household goods | 20% |
| 7733 | Renting and leasing of office machinery and equipment (including computers) | 35% |
| 7739 | Renting and leasing of other machinery, equipment and tangible goods n.e.c. | 20% |
Partial copyright industries are industries in which some activities are related to works and other protected subject matter and may involve creation, production and manufacturing, performance, broadcast, communication and exhibition or distribution and sales.
Partial
| SIC | Industry description | Factor |
|---|---|---|
| 9102 | Museum activities | 50.00% |
| 9103 | Operation of historical sites and buildings and similar visitor attractions | 50.00% |
| 3240 | Manufacture of games and toys | 46.00% |
| 9499 | Activities of other membership organisations n.e.c. | 41.00% |
| 3211 | Striking of coins | 33.50% |
| 3212 | Manufacture of jewellery and related articles | 33.50% |
| 7111 | Architectural activities | 9.00% |
| 7112 | Engineering activities and related technical consultancy | 9.00% |
| 3101 | Manufacture of office and shop furniture | 6.70% |
| 3102 | Manufacture of kitchen furniture | 6.70% |
| 3103 | Manufacture of mattresses | 6.70% |
| 3109 | Manufacture of other furniture | 6.70% |
-
https://euipo.europa.eu/tunnel-web/secure/webdav/guest/document_library/observatory/documents/IPContributionStudy/IPR-intensive_industries_and_economicin_EU/WEB_IPR_intensive_Report_2019.PDF 1,282KB ↩ ↩2 ↩3 ↩4 ↩5 ↩6
-
https://www.uspto.gov/sites/default/files/documents/IPandtheUSEconomySept2016.PDF 4.8MB ↩ ↩2 ↩3 ↩4
-
In the case of copyright those industries that have been attributed at least 20 per cent of activity to Copyright usage by the World Intellectual Property Organisation (WIPO), PDF 1,693KB - ↩ ↩2
-
As measured by the Annual Business Survey which covers the non-financial business economy approximately two thirds of the UK economy. ↩ ↩2
-
Industries which have an above average use of IP out of the industries in the ‘above average’ subset. ↩
-
In the case of copyright those classified as ‘core’ by the World Intellectual Property Organisation (WIPO), PDF 1,693KB ↩
-
Of the 616 UK industries. ↩
-
Figures for industries for which at least 20% of their value can be attributed to copyright-related activities, using the methodology set out by WIPO. This includes industries classified as ‘core copyright industries’ alongside a number of other industries classified as ‘interdependent’ and ‘partial’. The respective list of industries can be found in Section 6, all of which attribute at least 20% of their value to copyright-related activities. ↩
-
Industries classified as “core” by WIPO. ↩
-
For industries ranked as above average, % of non-financial value-added output. ↩
-
For industries ranked as above average, % of total UK employment. ↩
-
For industries ranked as above average, % of total goods export value. ↩
-
As classified by Standard Industrial Classification (SIC) ↩
-
Other manufacturing not elsewhere classified. This class is mixed, including but not limited to: the manufacture of protective safety equipment, the manufacture of pens and pencils, floral items, buttons and fasteners. For a full list see SIC 2007 - Office for National Statistics explanatory notes, PDF 1,294KB pages 137 and 138. ↩
-
Holding companies control assets of other companies to form a corporate group. ↩
-
Respective industries are: 2640 - Manufacture of consumer electronics, 3240 - Manufacture of games and toys. ↩
-
Appendix 5 lists the industries classified as above average across at least one of the IP rights considered in this paper. ↩
-
6420 Activities of holding companies, 7010 Activities of head offices and 8299 Other business support service activities n.e.c. all relate to non-specific ‘head office’ type activities. ↩
-
Use of Intellectual Property rights across UK industries ↩ ↩2
-
100% Word template for report-studies_2021.docm (europa.eu), PDF 640KB ↩
-
The IPO receives data from the European Patent Office covering granted European patents which designate the UK for protection, EP(UK) patents. ↩
-
Trade mark applications can specify multiple classes. The registered classifications specify which goods and/or services a trade mark will be used on. Trade mark classes are the unit of analysis in this paper. ↩
-
Trade marks registered at the EUIPO provide protection in all member states. ↩
-
Designs registered at the EUIPO provide protection in all member states. ↩
-
[Orbis Compare Private Company Data Bureau van Dijk (bvdinfo.com)](https://www.bvdinfo.com/en-gb/our-products/data/international/orbis?gclid=EAIaIQobChMI29r0i7mv9wIVSNTtCh1TdQAkEAAYASAAEgLb3_D_BwE) -
Standard Industrial Classification of economic activity (SIC). Primary SIC codes as reported to Companies House were used to allocate IP filings to industries Further information can be found here: https://www.ons.gov.uk/methodology/classificationsandstandards/ukstandardindustrialclassificationofeconomicactivities/uksic2007 ↩
-
Unmatched applicants or those with no industry data are ignored and the whole IP right is distributed between the applicants with available industry data. ↩
-
https://www.uktradeinfo.com/trade-data/ots-custom-table/ ↩ ↩2
-
Employee numbers have been taken from the ONS – Business Register and Employment Survey (BRES) . ↩ ↩2
-
Industries are not ranked when there is no available employee data. ↩
-
https://www.wipo.int/edocs/pubdocs/en/copyright/893/wipo_pub_893.PDF 1,693KB ↩
-
Core copyright industries are industries wholly engaged in the creation, production and manufacturing, performance, broadcast, communication and exhibition, or distribution and sales of works or other protected subject matter. ↩
-
Interdependent copyright industries are industries that are engaged in the production, manufacture and sale of equipment whose function is wholly or primarily to facilitate the creation, production or use of works and other protected subject matter. ↩
-
Partial copyright industries are industries in which some activities are related to works and other protected subject matter and may involve creation, production and manufacturing. ↩
-
Non-dedicated support industries are those in which some activities are related to facilitating broadcast, communication, distribution or sales of works and other protected subject matter, but whose activities have not been included in the core copyright industries. ↩
-
A full list of the copyright industries included in this paper can be found at: https://euipo.europa.eu/tunnel-web/secure/webdav/guest/document_library/observatory/documents/IPContributionStudy/IPR-intensive_industries_and_economicin_EU/WEB_IPR_intensive_Report_2019.PDF 1,282KB ↩
-
Industries for which at least 20% of their value can be attributed to copyright-related activities, using the methodology set out by WIPO, are considered “above average”. Industries that are considered to have 100% of their value attributed to copyright-related activities, are considered “high-use”. ↩
-
These measures should not be compared in terms of their share of the economy as the coverage of each measure varies due to data availability for each of the measures. ↩
-
The sum of the estimates for individual IP-intensive industries exceeds the total estimate for any IP intensive industries, due to overlapping use of IP rights across industries. ↩ ↩2 ↩3 ↩4
-
Non-financial business economy, UK (Annual Business Survey) - Office for National Statistics ↩
-
Goods exports by industry are considered in this report, in line with previous studies. Service exports have not been included as the data is unavailable at the 4-digit SIC level – see overseas trade statistics . ↩
-
https://www.ons.gov.uk/businessindustryandtrade/business/businessservices/datasets/uknonfinancialbusinesseconomyannualbusinesssurveysectionsas ↩