Market Data Insights - May 2021
Published 14 July 2021

© Crown copyright 2021
This publication is licensed under the terms of the Open Government Licence v3.0 except where otherwise stated. To view this licence, visit nationalarchives.gov.uk/doc/open-government-licence/version/3 or write to the Information Policy Team, The National Archives, Kew, London TW9 4DU, or email: psi@nationalarchives.gov.uk.
Where we have identified any third party copyright information you will need to obtain permission from the copyright holders concerned.
This publication is available at https://www.gov.uk/government/publications/market-data-insights-may-2021/market-data-insights-may-2021
Economic Summary
May saw the continued easing of lockdown restrictions with the UK entering Step 3 of the “roadmap out of lockdown”. This has meant that many businesses have been able to begin trading again, particularly in the hospitality, entertainment, and accommodation sectors. The increased opportunities for consumer spending and paid employment can be expected to have a positive impact on the nation’s economy. However, business sentiment at this time could best be described as “cautious optimism”.
Equity prices in the UK have consolidated during May offering investors stability. However, UK equity price levels remain significantly below the levels reached prior to the COVID-19 pandemic. Meanwhile American equity prices continued to climb to new all-time highs in early May but closed the month close to where they opened.
The pound has continued to strengthen relative to the US dollar, but has met resistance at the 1.42 (GBP/USD) level.
Gold prices have continued the upward trajectory that began in earnest at the beginning of April.
The major financial news for the month of May has been the major sell off in Bitcoin and other cryptocurrencies, with price levels of most coins dropping around 40% in a matter of days. More details below.
Credit Spreads as at 31 May 2021
| AAA | AA | A | BBB | ||||||
|---|---|---|---|---|---|---|---|---|---|
| 25 bps | 50 bps | 90bps | 138 bps | ||||||
| ▲ 1bps MoM | 0 bps MoM | ▲1 bps MoM | ▲ 2 bps MoM |
An asset’s ‘credit spread’ is the difference between its yield and that of a government-issued bond of similar maturity. It is an indicator of the perceived riskiness of the asset. It represents how much investors want to be rewarded for investing in it instead of a lower risk government bond.
Over the month of May, credit spreads have increased for most grades of bonds. However, the increase has only been slight and may be seen as consolidation rather than an upward trend.
Equities as at 31 May 2021
The graph below shows how the end-of-month positions have varied for the FTSE 100 between May 2019 and May 2021. The Financial Times Stock Exchange 100 Index (also referred to as the FTSE 100) is an index composed of the 100 largest companies listed on the London Stock Exchange.
The graph also compares against the North American and European MSCI indices which measures stock market performances in those areas. The graph is based on a base index of 100 for all 3 indices as at 31 May 2019.
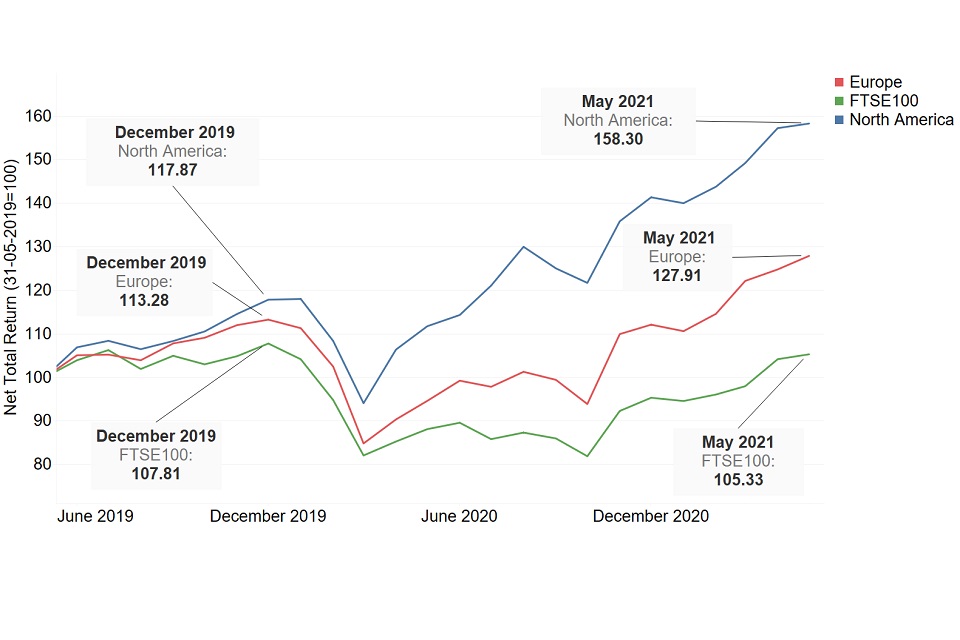
UK markets experienced some volatility during the month of May, with the FTSE100 making a gain of 3% from the opening price on May 5 to the closing price on May 7 followed by a sharp 4.75% drop from the high of day on May 10 to the low of day on May 13. The index then oscillated for the remainder of the month before resuming its upward trend and closing the month having made modest gains. The FTSE SmallCap index, an index that tracks smaller companies, also experienced high levels of volatility early in the month, but made significant gains in the last week and closed the month at a new all-time high. The FTSE TechMARK 100, an index comprised of technology companies quoted on the London Stock Exchange, also experienced a substantial dip early in the month before rallying and closing the month just short of the all-time high that was achieved during the previous month.
American markets followed a similar pattern, with the S&P500, the Dow Jones Industrial Average and the Russell 2000 all experienced volatility early in the month before finishing the month near new all-time highs. However, the NASDAQ Composite Index, and index that is heavily weighted towards technology companies, finished down for the month but with no sign of the long-term upward trend abating.
The European indices showed the largest increases and finished the month near the all-time highs.
House Prices
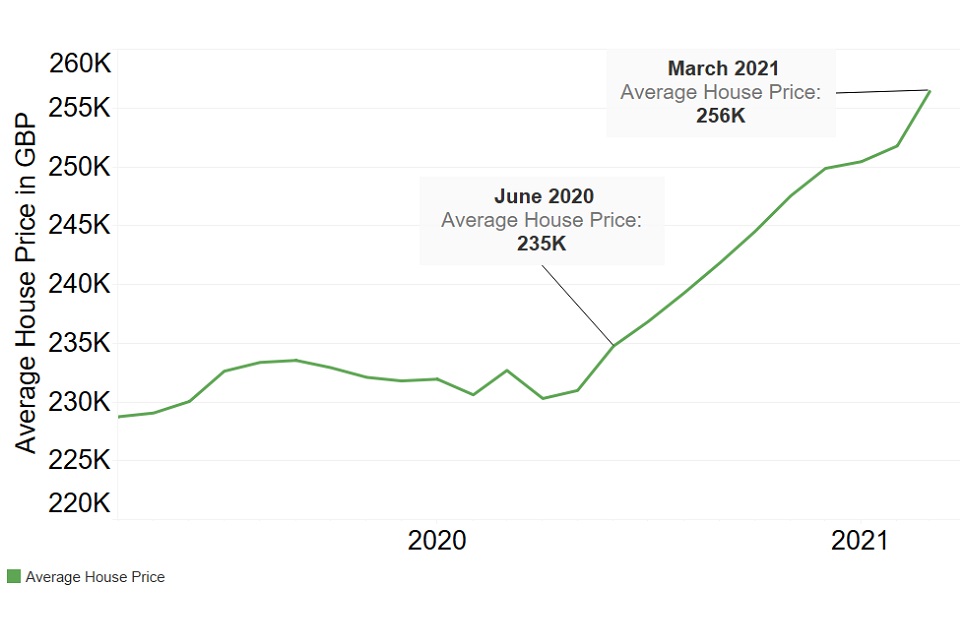
House prices in the UK continue the steep upward trend that started in mid-2020 when the stamp duty holiday was first announced on 8 July 2020. The latest UK House Price Index released by HM Land Registry on 19 May 2021 shows that the average house price in the UK had reached a new high of £256k by the end of March 2021. There are currently many factors at play in the property markets. In the domestic property market prospective buyers have the incentive to purchase properties sooner rather than later by the current stamp duty holiday that suspends property purchase tax on the first £500k on all sales in England and Northern Ireland. The stamp duty holiday has now been extended to 30 June 2021 before it is tapered back to a £250k threshold until 30 September 2021.
Judging from the upward trend in house prices, it would appear that the stamp duty holiday has been successful in stimulating activity in the housing markets despite lockdown restrictions making it more difficult to buy and sell houses. However, there is a serious question as to whether the first-time home buyer has been made better off by this arrangement, or whether the financial benefits from the reduction in stamp duty have been cancelled out by the increase in house prices.
Changing working patterns and the increased prevalence of working-from-home could result in significant numbers of people deciding to move out of inner-city areas which would provide some relief on the upward pressure on house prices. However, we are yet to evidence of this occurring on a scale that influences prices.
Bitcoin
There has been a lot of interest in cryptocurrencies over the past year with the price of Bitcoin souring from £8K in mid-September of 2020 to an all-time high of £46K in mid-April 2021, an increase of about 475%. However, May has been a very turbulent month in the crypto-space with Bitcoin dropping in price to £25K by mid-May, a drop of over 45% from the all-time high. The question on many investors’ minds is whether this massive drop in price signifies an end to the current bull run and the beginning of a new bear market phase, or whether this is merely a price correction and “shake out operation” before the next move up.
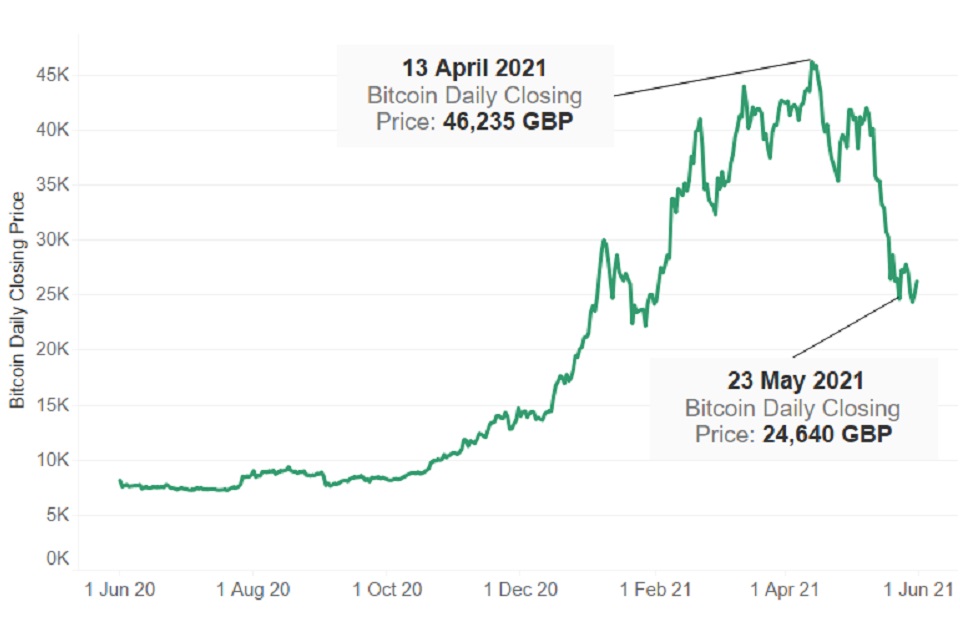
The drop in prices in May 2021 occurred in reaction to news coming out of China that tighter restrictions would be put in place to prevent banks and other financial institutions from providing services relating to cryptocurrencies. However, the question remains open as to whether this is a real game-changer, or yet another example of an extreme movement in price following an announcement (or tweet) from a key player in the markets.
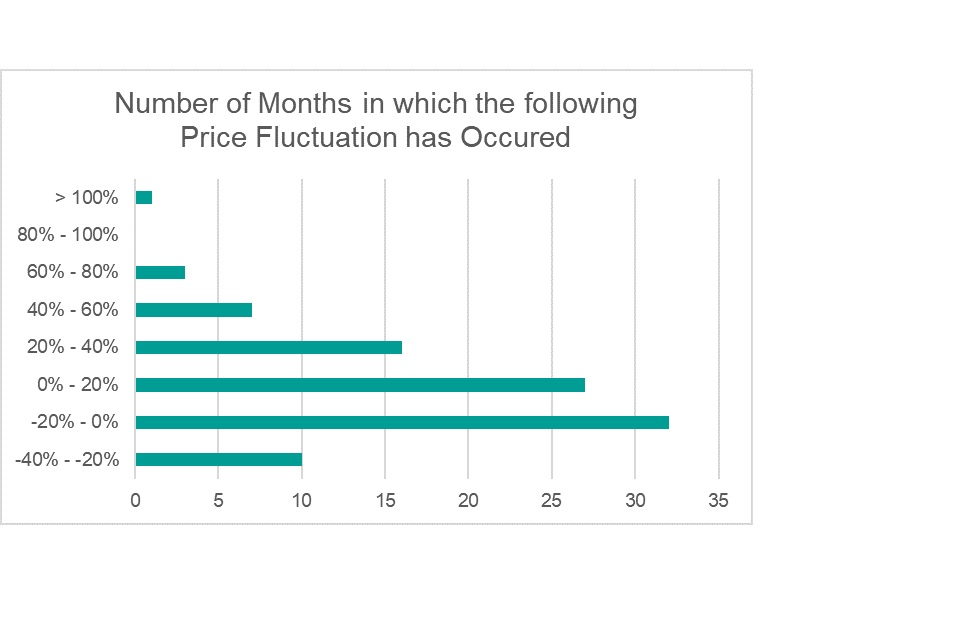
Bitcoin is a highly volatile asset class and monthly price fluctuations of between 20% and 40% are relatively common. The following chart shows the number of months since May 2013 in which the following monthly price fluctuations have occurred. The frequency of extreme movements in price remain a strong deterrent for mainstream asset managers from incorporating cryptocurrencies into their asset portfolios, however, the upside potential can be very appealing.
Disclaimer
The information in this publication is not intended to provide specific advice. For our full disclaimer, please see the GAD publications page.
The Government Actuary’s Department is proud to be accredited under the Institute and Faculty of Actuaries’ Quality Assurance Scheme.