Down’s syndrome screening quality assurance support service report types
Updated 18 May 2022
Applies to England

© Crown copyright 2022
This publication is licensed under the terms of the Open Government Licence v3.0 except where otherwise stated. To view this licence, visit nationalarchives.gov.uk/doc/open-government-licence/version/3 or write to the Information Policy Team, The National Archives, Kew, London TW9 4DU, or email: psi@nationalarchives.gov.uk.
Where we have identified any third party copyright information you will need to obtain permission from the copyright holders concerned.
This publication is available at https://www.gov.uk/government/publications/downs-syndrome-screening-quality-assurance-support-service-report-types/downs-syndrome-screening-quality-assurance-support-service-report-types
This guidance should be read in conjunction with the Down’s syndrome screening quality assurance support service guidance.
The Down’s syndrome screening quality assurance support service (DQASS) undertakes a range of statistical analyses on the data provided and produces 6 reports summarising activity and performance.
Four reports are produced for each 6-monthly data submission (reports 1 to 4 below). Two national cycle reports are produced at the end of each 6-month cycle, one for laboratory data and another for ultrasound data (reports 5 and 6, below).
1. Detailed laboratory report for each screening laboratory/network
This report contains information on all aspects of the screening data submitted by the laboratory, including:
- summary statistics on the demographic information of the population screened
- estimated standardised screen positive rates (SPR) for each test provided
- details of each biochemical marker used by the laboratory
- a summary of the ultrasound data from the ultrasound department(s) that the laboratory provides a service for
- DQASS parameter estimates for log MoM values from routine samples
Laboratories that are part of a network will have one pooled DQASS report for the screening strategy that is part of the network. This report is sent to the named laboratory lead for the network.
2. Summary laboratory/network report
The content of this report is agreed on a follow-up phone call between the laboratory lead and the lead statistician. This document outlines information such as:
- screening test(s) provided with associated software and equipment used
- estimated annual number of pregnancies screened with each test
- estimated standardised SPR for each test
- agreed list of recommendations and actions
- providers served for each screening test
3. Feedback plot (NT/CRL) for individual ultrasound practitioner
The feedback plot (NT/CRL) for individual ultrasound practitioner (from here on known as the feedback plot) gives feedback on measurements of nuchal translucency (NT) and crown rump length (CRL), over a 6-month DQASS reporting cycle.
All ultrasound practitioners, including trainees, should receive their feedback plot from their screening support sonographer (SSS) every 6 months.
If any data set suggests an ultrasound practitioner requires further support or training, through a red flag for throughput, bias or spread, the associated plots are also shared with the national and regional screening quality assurance service (SQAS).
The feedback plot below shows an example of a data set with adequate throughput and the measurements are consistent for bias and spread with the fetal medicine foundation (FMF) reference curve.

The plot shows NT on the vertical axis, against CRL on the horizontal axis. Each point is a paired NT and CRL measurement and the blue curve is the FMF reference curve. At the top ID shows the practitioner’s DQASS code and the number of measurements in the data set.
The grey band shown in the feedback plot helps with the interpretation of bias and spread.
When measurements are consistent with the FMF reference, approximately:
- 50% of all measurements are expected to lie within the grey band
- 25% of all measurements are expected to lie above the grey band
- 25% of all measurements are expected to lie below the grey band
The plot provides further feedback on:
- throughput: the number of paired NT and CRL measurements performed in a DQASS 6-month reporting cycle
- bias: the average deviation in NT measurements from the FMF reference curve
- spread: the scatter of points around the FMF reference curve
A diagnostic plot self-assessment tool is provided to assist monitoring of NT and CRL measurements. We recommend using weekly or monthly depending on the number of scans performed. The tool is not designed to be used at the time of the scan to compare measurements to the FMF reference curve.
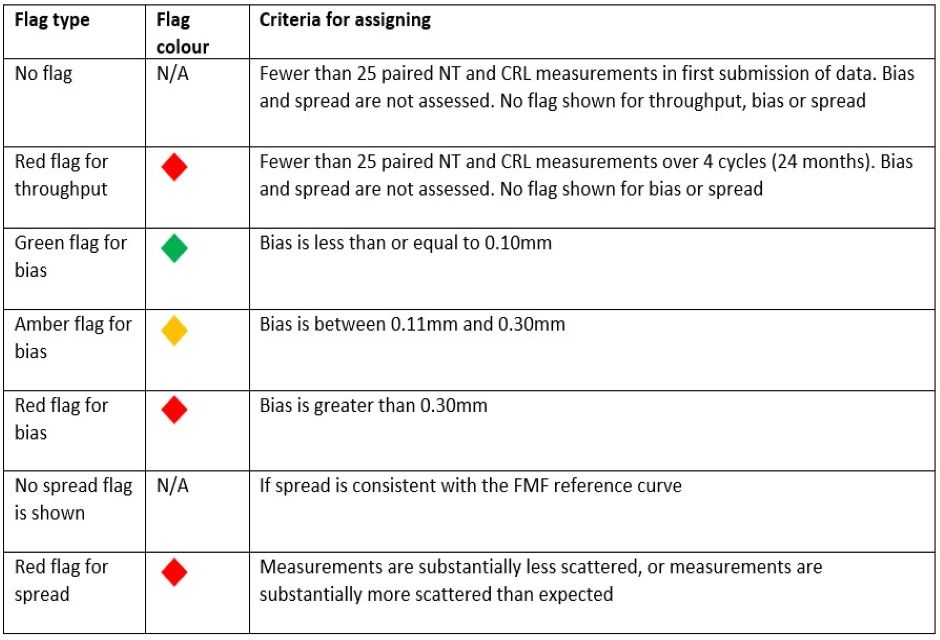
3.1 Criteria for assigning flags to a data set
Flags can be assigned for throughput, bias and spread. The table below shows how flags are assigned.
3.2 Throughput
Throughput is the number of paired NT and CRL measurements performed in a DQASS 6-month reporting cycle.
To reliably assess bias and spread, a minimum throughput of 25 paired NT and CRL measurements is required.
The SSS should maintain a log of reasons for low throughput.
If there are fewer than 25 paired NT and CRL measurements in an ultrasound practitioner’s first data submission, no flag is assigned.
If the minimum throughput in one cycle is not met, the most recent 25 paired measurements from the last 4 cycles (24 months) are combined.
If a data set contains fewer than 25 paired measurements over 4 cycles (24 months), a red flag for throughput is assigned.
Bias and spread will not be reported for this data set. The SSS and ultrasound practitioner use the process following a red flag for throughput to develop a supportive action plan.
The table below shows examples of how DQASS assigns flags when the ultrasound practitioner has not met the minimum requirement of 25 paired measurements in one cycle.
| DQASS/FMF identity code | Number of paired NT and CRL measurements in current cycle | Number of paired NT and CRL measurements used over most recent 4 cycles to provide feedback | Bias (mm) | Spread | Flag |
|---|---|---|---|---|---|
| 9898989 | 8 | 8 + 17 = 25 | 0.08 | No spread flag shown | Green flag for bias |
| 7676767 | 4 | 4 + 12 + 9 = 25 | -0.36 | No spread flag shown | Red flag for bias |
| 5454545 | 2 | 2 + 5 + 6 + 3 = 16 | Unable to report | Unable to report | Red flag for throughput |
Example 1
Ultrasound practitioner 9898989 was on long-term sick leave and only has 8 paired NT and CRL measurements in the current cycle.
DQASS combines those 8 with the most recent 17 measurements from the previous cycle. This adds up to 25 measurements and the bias and spread can be estimated. The following flags are assigned:
- green flag for bias (estimated bias is 0.08mm)
- no spread flag is shown (spread is consistent with FMF reference curve)
Practice continues as bias and spread are consistent with the FMF reference curve.
Example 2
Ultrasound practitioner 7676767 has returned from maternity leave and only has 4 paired NT and CRL measurements in the current cycle.
DQASS combines those 4 with measurements from the previous 2 cycles (12 + 9). This adds up to 25 measurements and bias and spread can be estimated. The following flags are assigned:
- red flag for bias (estimated bias is -0.36mm)
- no spread flag is shown (spread is consistent with the FMF reference curve)
The SSS and practitioner develop a supportive action plan for bias.
Example 3
Ultrasound practitioner 5454545 only has 2 paired NT and CRL measurements in the current cycle.
DQASS combines those 2 with measurements from the previous 3 cycles (5 + 6 + 3). The data set still has fewer than 25 measurements and bias and spread cannot be reliably estimated. The following flag will be assigned:
- red flag for throughput
The SSS and practitioner develop a supportive action plan for throughput.
3.3 Bias on feedback plots
Bias is the average deviation in NT measurements from the FMF reference curve.
Bias is negative when NT measurements, overall, are smaller than expected and positive when, overall, they are larger than expected.
A negative bias reduces the screen positive rate (SPR) and detection rate (DR). This can result in a higher proportion of false negative results.
A positive bias increases the SPR and the DR. This can lead to more prenatal diagnostic tests.
The table below shows the effect of bias on SPR and DR.
| Bias (mm) | Screen positive rate (%) | Detection rate (%) |
|---|---|---|
| -0.5 | 1.7 | 78 |
| -0.4 | 1.8 | 79 |
| -0.3 | 1.9 | 80 |
| -0.2 | 2.0 | 82 |
| -0.1 | 2.2 | 83 |
| 0 | 2.6 | 85 |
| 0.1 | 3.1 | 86 |
| 0.2 | 3.7 | 87 |
| 0.3 | 4.6 | 88 |
| 0.4 | 5.7 | 90 |
| 0.5 | 7.0 | 91 |
The 3 examples below show feedback plots with:
- no substantive bias
- negative bias
- positive bias
In each of these examples, spread is consistent with the FMF reference and throughput is greater than 25 paired measurements.
Example of no substantive bias
The feedback plot below shows a green flag for bias. Measurements tend to scatter evenly about the FMF reference curve with:
- 52% of measurements within the grey band
- 24% of measurements above the grey band
- 24% of measurements below the grey band

Examples of negative bias
Feedback plot 1 is on the left and feedback plot 2 is on the right.

Feedback plot 1 (above, on left) shows an amber flag for negative bias as the bias is between 0.11mm and 0.30mm.
Measurements tend to scatter below the FMF reference curve with:
- 40% of measurements within the grey band
- 15% of measurements above the grey band
- 45% of measurements below the grey band
Feedback plot 2 (above, on right) shows a red flag for negative bias as bias is greater than 0.30mm.
Measurements tend to scatter below the FMF reference curve with:
- 26% of measurements within the grey band
- 7% of measurements above the grey band
- 67% of measurements below the grey band
The SSS and ultrasound practitioner use the process following a red flag for bias and/or spread to develop a supportive action plan.
Examples of positive bias
Feedback plot 3 is on the left and feedback plot 4 is on the right.

Feedback plot 3 (above, on left) shows an amber flag for positive bias as the bias is between 0.11mm and 0.30mm.
Measurements tend to scatter above the FMF reference curve with:
- 54% of measurements within the grey band
- 34% of measurements above the grey band
- 12% of measurements below the grey band
Feedback plot 4 (above, on right) shows a red flag for positive bias as bias is greater than 0.30mm.
Measurements tend to scatter above the FMF reference curve with:
- 38% of measurements within the grey band
- 60% of measurements above the grey band
- 2% of measurements below the grey band
The SSS and ultrasound practitioner use the process following a red flag for bias and/or spread to develop a supportive action plan.
3.4 Spread on feedback plots
NT measurements should have an expected spread or scatter around the FMF reference curve.
Spread is increased when NT measurements are more scattered than expected.
Spread is decreased when NT measurements are less scattered than expected.
If the scatter of measurements is consistent with the FMF reference curve, no flag for spread is assigned.
If measurements are substantially less scattered, or measurements are substantially more scattered than expected a red flag for spread is assigned. The SSS and ultrasound practitioner use the process following a red flag for bias and/or spread to develop a supportive action plan.
Decreased spread reduces the SPR and DR. This can result in a higher proportion of false negative results. The series of plots in the graphic below show how reduction in spread can affect the DR for trisomy 21 (T21).

The 2 examples below show feedback plots with:
- decreased spread
- increased spread
In each of these examples, there is no substantive bias relative to the FMF reference curve and throughput is greater than 25 paired measurements.
Example of decreased spread
The feedback plot below shows a red flag for decreased spread.
Measurements tend to scatter close to the FMF reference curve with:
- 95% of measurements within the grey band
- 2% of measurements above the grey band
- 3% of measurements below the grey band

Example of increased spread
The feedback plot below shows a red flag for increased spread.
Measurements tend to scatter further from the FMF reference curve than expected with:
- 21% of measurements within the grey band
- 39% of measurements above the grey band
- 40% of measurements below the grey band

3.5 Process following a red flag for throughput
The following is a suggested step-by-step guide for the SSS to develop and record a supportive action plan with the ultrasound practitioner. The template for low throughput supportive action plan can be used to help with this.
-
The practitioner feedback report is red flagged for throughput.
-
DQASS informs:
-
SSS
-
regional SQAS
-
national SQAS
-
-
Regional SQAS informs public health commissioning teams.
-
SSS informs the practitioner.
-
SSS discusses red flag for throughput with the ultrasound department manager.
-
SSS and practitioner discuss the next steps and identify the cause of low throughput.
-
If the practitioner is not continuing to participate in combined screening, the SSS records the outcome and informs DQASS and SQAS.
-
If the practitioner is continuing to participate in combined screening, the SSS records the details of how the required throughput will be achieved.
-
Due to low throughput, estimates of bias and spread are unreliable. SSS and practitioner review the:
- practitioner’s wellbeing
- NHS FASP e-learning and CPD completed in the last 12 months
- practitioner’s measurement technique and the recent NT and CRL image quality using the image review tool
-
SSS and practitioner develop a supportive action plan for throughput. The practitioner has 12 weeks to complete this plan.
-
SSS confirms with regional SQAS that a supportive action plan is in place within 2 weeks of receiving the feedback plot.
-
Regional SQAS informs public health commissioning team the supportive action plan is in place.
-
Practitioner starts to work through the action plan with supervised practice.
-
SSS reviews images of the new measurements against NHS FASP criteria using the image review tool. If the SSS has no concerns, proceed to the next step. If the SSS has concerns, additional support and training should be given before reassessing new images.
-
Practitioner collects at least 25 new paired NT and CRL measurements.
-
SSS reviews these measurements using diagnostic plot self-assessment tool. When this tool shows estimated bias is less than 0.30mm and spread is consistent with the FMF reference curve, SSS sends the 25 paired NT and CRL measurements to DQASS.
-
DQASS confirms new measurements are within NHS FASP criteria for bias and spread.
-
SSS provides feedback to the practitioner, including:
- confirmation estimated bias is less than 0.30mm
- confirmation spread is consistent with the FMF reference curve
- outcome of image review
- confirmation unsupervised scanning can restart
-
SSS records the support provided, all actions and the outcome using the template for low throughput supportive action plan.
-
SSS informs regional SQAS the supportive action plan is complete and closed. The action plan must not be sent, as this is confidential information.
-
Regional SQAS updates national SQAS and public health commissioning team.
-
National SQAS keeps a database of all red flags and outcomes.
3.6 Process following a red flag for bias and/or spread
The following is a suggested step-by-step guide for the SSS to develop and record a supportive action plan with the ultrasound practitioner. The template for red flag for bias and/or spread supportive action plan can be used to help with this.
-
The practitioner feedback report is red flagged for bias and/or spread.
-
DQASS informs:
- SSS
- regional SQAS
- national SQAS
-
Regional SQAS informs public health commissioning team.
-
SSS informs the practitioner.
-
SSS discusses red flag for bias and/or spread with the ultrasound department manager.
-
SSS and practitioner discuss the next steps and identify the cause of the red flag for bias and/or spread by reviewing the:
- practitioner’s wellbeing
- ultrasound equipment and scan environment
- NHS FASP e-learning and CPD completed in the last 12 months
- practitioner’s measurement technique
- recent NT and CRL image quality using the image review tool
-
SSS and practitioner develop a supportive action plan for bias and/or spread. The practitioner has 12 weeks to complete this plan.
-
SSS confirms with regional SQAS that a supportive action plan is in place within 2 weeks of receiving the feedback plot.
-
Regional SQAS informs public health commissioning team the supportive action plan is in place.
-
If additional practical support is required, the practitioner should be supervised until measurements show estimated bias is less than 0.30 mm and spread is consistent with the FMF reference curve.
-
Practitioner starts to work through the action plan with supervised practice.
-
SSS reviews images of the new measurements against NHS FASP criteria, using the image review tool. If the SSS has no concerns proceed to next step. If the SSS has concerns, additional support and training should be given before reassessing new images.
-
Practitioner collects at least 25 new paired NT and CRL measurements.
-
SSS reviews these measurements using the diagnostic plot self-assessment tool. When this tool shows estimated bias is less than 0.30 mm and spread is consistent with the FMF reference curve, SSS sends the 25 paired NT and CRL measurements to DQASS.
-
DQASS confirms new measurements are within NHS FASP criteria for bias and spread.
-
SSS provides feedback to the practitioner, including:
- confirmation estimated bias is less than 0.30mm
- confirmation spread is consistent with the FMF reference curve
- outcome of image review
- confirmation unsupervised scanning can restart
-
SSS records the support provided, all actions and the outcome using the template for bias and/or spread supportive action plan.
-
SSS informs regional SQAS the supportive action plan is complete and closed. The action plan must not be sent, as this is confidential information.
-
Regional SQAS updates national SQAS and public health commissioning team.
-
National SQAS keeps a database of all red flags and outcomes.
4. Feedback plot (NT/CRL) summary report for ultrasound provider
This report outlines:
- the screening laboratory used and time period covered by report
- for each practitioner – identity code, number of scans, median NT, median CRL, estimated bias and flag status
- flag status allocated in the previous cycle
- a plot of the estimated bias for each practitioner with 95% confidence intervals
5. Laboratory/network cycle report
The laboratory end-of-cycle report includes aggregated results for all laboratories and allows comparison of performance cycle on cycle. This can be seen for individual markers and for the overall screening programme. These reports also provide summary statistics for the distribution of biochemical markers, including effects of factors such as ethnicity and smoking status.
6. Ultrasound cycle report
The ultrasound end-of-cycle report includes aggregated results for all ultrasound practitioners and gives feedback on the overall performance of ultrasound over time. The plots give the mean level of bias in NT measurements relative to the NT reference curve nationally.