Appendices and glossary
Published 22 October 2021
Applies to England, Scotland and Wales

© Crown copyright 2021
This publication is licensed under the terms of the Open Government Licence v3.0 except where otherwise stated. To view this licence, visit nationalarchives.gov.uk/doc/open-government-licence/version/3 or write to the Information Policy Team, The National Archives, Kew, London TW9 4DU, or email: psi@nationalarchives.gov.uk.
Where we have identified any third party copyright information you will need to obtain permission from the copyright holders concerned.
This publication is available at https://www.gov.uk/government/publications/childrens-social-care-market-study-interim-report/appendices-and-glossary
Appendix A: Financial analysis
Introduction
This Appendix explains our methodology and shares our initial financial analysis of the UK’s 15 largest providers of children’s homes, fostering services, and unregulated accommodation.[footnote 1] Our financial analysis seeks to uncover:
- whether and to what extent private provider profits and prices in the sector are higher than our expectations for a well-functioning market, and how do they differ between private equity (PE) owned and non-PE-owned providers;
- how operating costs vary between private providers and local authority providers; and
- the debt levels of private providers, and how they differ between PE-owned and non-PE-owned providers.
Our analysis is preliminary and a work-in-progress. Therefore at this stage, there is an opportunity for stakeholders to offer feedback on our methodology, highlight any gaps and suggest improvements. We set out a list of questions at the end of this Appendix.
Background on financial analysis
We have obtained financial data on children’s homes and fostering agencies from 3 sources:
- Large providers’ dataset: We received 6 years of financial and operational data from the 15 largest providers.[footnote 2] This dataset comprises:
- Group (provider) level dataset includes the group financial data of those Large providers, which is more granular than the audited accounts. In FY 2020, these providers generated aggregate revenues of £958 million from children’s homes, fostering services and unregulated accommodation. The dataset accounts for approximately a fifth of children’s homes placements by independent providers and slightly over half of the placements by independent foster care providers.[footnote 3]
- Home level dataset includes financial and operational data at the home level for the 889 homes[footnote 4] operated by those Large providers.
- Independent fostering agency (IFA) level data includes financial and operational data at the IFA level for the 94 IFAs operated by those Large providers.
- Local authority dataset: We obtained 5-year financial and operational data from 40 local authorities. This dataset comprises:
- Home level data includes financial and operational data at the home level for the 237 homes operated by these local authorities.
- Fostering agency-level data includes financial and operational data at the agency level for the 57 agencies operated by these local authorities.
- Companies House dataset includes the audited financial information for 219 large and medium-sized companies and abbreviated data for 627 companies over 5years.
We have presented results from the Large providers’ group-level dataset for the interim report and this Appendix.
We have presented aggregated results rather than individual providers’ results. The financial performance of some providers will differ from the aggregated results.[footnote 5] Nevertheless, our aggregate analysis provides a robust indication of financial performance for the large providers because the distribution of critical results (for example, operating profit margin) were clustered around the average. In other words, most companies earned operating profit margins that were reasonably close to the average. The ones that generated profit margins away from the mean did not significantly alter the aggregated results.
Summary of findings
Our provisional findings for children’s homes operated by the Large providers between FY 2016 and 2020 are that:
- the average fee per child increased year-on-year from approximately £154,830 in FY 2016 to £199,186 in 2020, representing an annual growth rate of 5.2%. While operating costs have increased,[footnote 6] providers simultaneously benefitted from above-inflation and rising fee rates, thus keeping the operating profitability margin flat at 22.6%;
- local authority operating costs have been approximately 26.4% higher, on average, than the equivalent for the large private providers using identical definitions to gather the cost data. We cannot comment on the operating cost differential or its causes at this stage, and we will undertake further work.[footnote 7] We will examine whether differences in the acuity of care, quality or other factors explain this difference.
Our provisional findings for the fostering agency segment operated by the large providers between FY 2016 and 2020 are that:
- the average fee per child and operating profit margin have remained stable at approximately £42,626 and 19.4%, respectively. The cost structure has remained unchanged; and
- local authority operating costs have been approximately 36.8% lower, on average, between FY 2016 and 2020 than the equivalent for private providers using identical definitions to gather the cost data. We cannot comment on the operating cost differential or its causes at this stage, and we will undertake further work.[footnote 8]
Our provisional findings for unregulated accommodation operated by the large providers between FY 2018 and 2020 are that:
- the average fee per child has remained stable at approximately £49,305. The operating profit margin has declined from 39.9% to 35.5%, driven by operating cost increases; and
- compared to children’s homes, unregulated accommodation has a relatively lower cost but is a higher margin segment.
Methodology: introduction to operating and economic profitability
Operating profitability of children’s homes, fostering and unregulated accommodation
Operating profitability indicates a provider’s ability to generate revenues to meet its operating (day-to-day running) costs such as staff, maintenance of assets, supplies, utilities, and head office costs. Management cannot significantly defer these costs.
Operating costs exclude capital expenditure (CAPEX) to purchase assets and dividends that management have the option to delay up to a point and corporation tax that loss-making companies do not pay. However, providers cannot often pause interest payments on debt. Therefore, a provider can remain viable in the short term, albeit within limits, if it generates adequate revenue to cover its operating costs and interest payments.
The standard metric to measure the operating profitability of the residential accommodation (children’s homes and unregulated accommodation) and fostering agency services is a profit margin. This metric is a return on revenue measure (in percentage terms) equal to the relevant profit margin (revenue less operating costs) divided by revenue. Table 1 explains the various profit margins:
| Profit margin | Definition | Costs included to calculate the margin and deducted from revenue |
|---|---|---|
| EBITDARM | Earnings before interest, tax, depreciation, amortisation, rent and management fees. EBITDARM is used to measure the true operating profitability of residential accommodation and fostering services at the group and individual homes and IFA levels. | Staff costs associated with providing care and services in the children’s home or IFA. For example, payroll costs of care workers and foster carers. Non-staff operating costs incurred to run an individual home or IFA. For example, food, utilities, maintenance and other direct overheads. Central (head office) costs such as group finance, legal and management’s salary. |
| EBITDAR | Earnings before interest, tax, depreciation, amortisation, and rent. EBITDAR is used to measure the operating profitability of providers. It is also used to assess the ability of providers to generate adequate profits (and cash) to meet rental payments. It excludes property-related costs such as rent, depreciation and interest costs. | Costs included in EBITDARM and Management fees related to charges levied by shareholders (primarily private equity funds) for management services that they have provided the provider. |
| EBITDA | Earnings before interest, tax, depreciation and amortisation. EBITDA is used to assess the ability of providers to generate adequate profits (and cash) to meet interest payment obligations. | Costs included in EBITDAR and rent |
| EBITM | Earnings before interest, tax and management fee. EBITM is used to assess a provider’s ability to meet its debt interest obligations. It excludes the management fee. In other words, the management fee is not deducted from revenue. | Costs included in EBITDA and depreciation and amortisation, which do not have a cash impact |
| EBIT | Earnings before interest and tax. EBIT is also used to assess a provider’s ability to meet its debt interest obligations. | Costs included in EBITDA (including management fee) and depreciation and amortisation, which do not have a cash impact |
| PBT | Profit before tax | Costs included in EBIT and debt interest expense |
| Exceptional items | Non-recurring or one-off costs that a provider would not incur in the ordinary course of operating a home or fostering agency. Examples include: restructuring costs: gains or losses on disposal: foreign exchange gains and losses; and redundancy payments. The analysis of pre-exceptional margins gives a more accurate position of profitability. |
EBITDARM margin
We have used the pre-exceptional EBITDARM to assess the operating profitability of providers. This margin includes all costs to operate a residential accommodation and central charges for shared services such as finance, legal and other professional fees. It excludes property-related expenses such as rent, lease, depreciation and interest. It also excludes the management fee and exceptional items. We have excluded the management fee because it is not an essential operating expense; most providers in the large providers dataset did not incur a management fee.
We have excluded property costs when assessing operating profitability as providers can choose different ways to finance their portfolio of residential accommodation and fostering agencies. These affect the profit and loss account (P and L) differently. For example, the relevant property-related charges in the P and L would differ depending on whether a property is:
- bought outright with equity shareholder’s cash, in which case there would be no property-related charge in the P and L;
- rented, in which case the entire rental payment would be included as ‘rent’, with no depreciation charge in the P and L;
- leased and classified as a finance lease[footnote 9] for accounting purposes. The P and L charges would consist of the financing cost (under interest) and depreciation; or
- mortgaged, in which case the financing cost (only the interest element) would be included under ‘interest’, with a depreciation charge in the P and L.
By excluding property-related costs, the pre-exceptional EBITDARM margin provides a comparable benchmark to assess the operating profitability of residential accommodation and fostering agencies. The EBITDARM margin also excludes the effects of changes in accounting policy. For instance, changes in lease accounting could result in expenses switched among the rent, depreciation and interest line items of the P and L.
Some stakeholders suggested using the EBITDA margin to assess the profitability of fostering agencies. However, rent is an insignificant component for fostering agencies, and the EBITDARM margin provides an equally accurate measure comparable to our analysis of residential accommodation.
Economic profitability of residential accommodation and fostering services
Economic (surplus) profitability indicates a provider’s returns after meeting its operating costs, CAPEX and investor returns. Debt investors receive interest payments, and equity investors receive dividends. The economic profit for a sector is the aggregate revenue less its operating costs and capital costs. In other words, providers need to earn an economic profit, over and above break-even operating profits, to cover the cost of investing in the required assets to run a children’s home or fostering agency.
Economic profit analysis is better suited to asset-heavy businesses with a more precise benchmark for a standard market return. Nevertheless, for fostering agency services, we intend to conduct economic profitability analysis akin to replacement cost analysis.[footnote 10] The CMA has used such analysis on pharmaceutical cases and in assessing Google’s profitability.[footnote 11] We intend to use the same rate of return as for children’s homes on the basis that they have comparable financial risks. We also plan to conduct a margin comparator analysis for fostering agencies to triangulate the results.
Table 2: Calculations regarding economic (surplus) profits
| Measure | Calculation |
|---|---|
| Capital cost | Capital employed x % rate of return |
| Total cost | Operating costs + capital cost |
| Economic profit/(loss) | Revenue – total costs |
| Economic profit margin | Economic profit / revenue |
Capital and total cost
The capital cost is the financial value of the actual return that equity and debt investors require to invest in a business. The capital cost is similar to accounting overhead expenses to the extent it is incurred to acquire and invest in the assets to operate residential accommodation or fostering agencies. The capital cost can be an actual cost for the provider and have a cash flow impact. For example, investors may pay interest to debt-holders and dividends to equity investors. However, the capital cost is not an accounting measure, and providers’ P and Ls do not disclose it. Therefore, it is not directly measurable.
Where revenues from operating residential accommodation are more than sufficient to cover total costs, it results in an economic (surplus) profit. In such an environment, providers are incentivised to invest in the medium to long term, and they can continue replacing those assets if they continue making economic profits. The replacement of assets might arise out of wear and tear or requirements to meet quality standards. Where a provider generates an economic profit, investors also have the financial incentives to build new capacity and undertake CAPEX in existing residential accommodation and fostering agencies. Moreover, investors owning existing capacity are less incentivised to exit the market as the alternative use of the asset might not offer a higher return.
Rate of return (%)
When considering any capital investment, investors factor in the opportunity cost of that investment. It is the investor’s return from investing in another company of a similar level of risk. This return is required to cover the cost of providing finance[footnote 12] and a margin to reflect the risk taken by investors.[footnote 13]
Risk is an unavoidable part of any investment. Part of the risk investors face is the general economic environment, such as the economic cycle and interest rate changes. Risk can also arise from policy uncertainties specific to the sector. If investors consider that the risks of investing in children’s social care are high, they will seek higher returns. Where expected returns from new investment are below the level required to compensate investors for risk, they may not invest in the sector. Where these returns are high relative to the risk, we should see more significant investment activity by existing providers and new entrants. Returns need to account for the risk over the investment’s life – this principle applies to providers of all sizes and complexities regardless of their operations and finance sources.
An explanation for the rate of return
We intend to use a real return on capital employed and seek views from stakeholders on the appropriate rate and how we should assess this. We intend to consider other comparable sectors and previous analysis conducted by the CMA in evaluating the appropriate rate of return. For example,
- Our Care Homes Market Study estimated a 5-8% rate of return.[footnote 14] We consider that the risks in children’s social care may be lower as self-funders account for more than half of the care homes for the elderly sector’s revenue, which increases bad debt risk and makes revenue more volatile.
- Our private healthcare investigation found a pre-tax market rate of return on capital employed of around 9% in nominal terms (ie including inflation).[footnote 15] For that portion of the capital invested in long-lived assets such as land, a starting assumption was that prices, in the long run, would more likely remain constant in real rather than in nominal prices. Considering the Bank of England’s Consumer Prices Index (CPI) inflation target of 2%, private healthcare investors would require a real annual rate of return of around 7% in the long run, noting the CPI has increased over the 2% target since 2016.
- Economic regulators of regulated monopolies have determined reasonable returns (pre-tax capital cost) of 2.5%-4.5% relative to inflation.[footnote 16] We set an allowed real return for the appellant water companies for our recent water redetermination of 3.2%.[footnote 17]
We also note the very low current market estimates for the cost of capital. Ultra-low and negative real interest rates in the Organisation for Economic Co-operation and Development (OECD), including the UK, primarily drive these estimates.[footnote 18]
Capital employed
Capital employed is the value of the assets invested in a business. The asset valuation should, in principle, be the market value of those assets. Market values reflect the sale price of those assets as an alternative to using those assets for their current purpose. For example, the everyday use of the property in residential accommodation would be in providing care. The alternative use of property could be the redevelopment of that property into residential or commercial real estate.
We have assumed that an investor in new residential accommodation would purchase a property (land and building). The alternative would be to rent the property. In theory, over a given period representing the asset’s useful life, the rental yield should result in a similar cost as buying the property.
An investor in new residential accommodation or a new fostering agency would also require upfront investment and contribute to funding the operations with working capital. The investor would require a return on those assets. Therefore, we intend to include these assets in the capital employed and apply a rate of return on those assets (capital employed) to estimate the capital costs.
Property (used for residential accommodation)
The property valuation methodology should be similar to the standard practice chartered surveyors use to value similar houses in the real estate industry. This method should exclude any valuation premium attached to a property that had received planning permission to operate as a children’s home. The premium is akin to economic rent, as investors would have to charge higher prices to recover their investment.
We obtained recent property market valuations from 9 providers that had recently valued 399 properties. We matched these property values to the corresponding home-level annual revenue for the year of valuation for each home.[footnote 19] We then aggregated the home-level revenues and the related property valuations to calculate a market-based average ratio of aggregated revenue to aggregated property valuations of 0.52.
Many, but not all, residential accommodation sites operated by the large providers had recently conducted property valuations. Hence, we applied the market-based average ratio of 0.52 to larger segments to estimate their property valuations. For example, we applied the ratio of 0.52 to the aggregated revenues generated by providers from children’s homes to estimate their aggregate property valuation. We used the same methodology to evaluate the property market values for other segments, such as our assessment of the disaggregated capital bases for PE and non-PE providers.
This approach is likely to overestimate the property market values on several counts. First, the property values include economic rent discussed above from planning permission. We understand that children’s homes with the necessary planning permission may sell considerably higher than a similar property without planning permission. Chartered surveyors may factor in granting planning permission for children’s homes activities when they value children’s homes.[footnote 20] Second, most property valuations relate to the latter half of our review period, when property prices have increased sharply. Hence, the analysis includes higher property valuations for the first half of the review period by using the ratio of 0.52.
We also note that many providers bought their properties at historic cost when property prices were significantly lower. Given current fee levels, these providers would be earning significant returns on historic cost, reflecting rising property valuations and replacement costs.
Our calculation of property prices is likely to increase the capital employed and capital cost figure and reduce the level of economic profit, presenting a lower bound of economic profitability in the sector.
Equipment (used for residential accommodation and fostering agencies)
The actual investment cost should determine the valuation methodology of fixed asset equipment required to operate a children’s home (for example, beds, vehicles and specialist equipment), which depreciate to reflect the age of the assets.
For equipment, we obtained estimates of the actual capital expenditures in new children’s homes and fostering agencies. These estimates are aggregated on a provider level and a per-child basis for 11 large providers. The average equipment, fixtures and fittings for a new home costs £13,335 per child.[footnote 21] The non-property CAPEX requirement for a foster agency will be less than that for a new home, and we have assumed that the equipment for a fostering agency is half of that for a children’s home. Hence, we have included an average equipment cost of £6,668 per child for fostering. We multiplied the average equipment costs by the number of children in residential accommodation and foster care of the large providers.
Recruitment (fostering agencies)
An additional upfront cost which fostering agencies may incur is the cost of recruiting and training foster carers. We recognise that in some cases, this will be a sizeable cost. However, we consider that these costs would be accounted for as operating costs, and so at this stage, we have not included these costs in our analysis of capital employed.
Working capital (used for residential accommodation and fostering agencies)
Working capital is a provider’s current assets (for example, receivables) less its current liabilities (for example, payables) on its balance sheet. It measures a provider’s liquidity and short-term financial health. A positive working capital implies that when a provider converts its current assets and liabilities into cash, it should translate into a net positive cash amount. The opposite holds for negative working capital.
Local authorities generally pay providers of children’s placements in arrears. Hence, we have assumed that an investor in a new residential accommodation site or fostering agency would have to fund operations from working capital, which forms part of the capital employed.
We have excluded cash from capital employed. Including it would double count the cash balance because a positive working capital balance is a proxy for the money required for operations that providers fund through short-term financing, which banks credit to the cash account. Bar petty cash, providers could deploy the excess reported cash balance on the balance sheet elsewhere.
There are 2 methods for estimating working capital. The first is to use the reported figures from the balance sheet or to smooth the numbers using an average for the review period as we did in the Care Homes Market Study published in 2017. However, this measure may not provide an accurate picture of the working capital during the year because providers follow different strategies to manage their working capital – some providers collect their debts faster while others may delay payments longer. Also, a balance sheet is a snapshot at the year-end, and it may not give a valid indication of the actual (average) working capital levels required during the year to manage working peaks and troughs. Therefore, we have not used this method.
The second method is to estimate a notional level of working capital. Local authorities generally pay providers 1 to 3 months in arrears. Hence, on average, providers should have 2 months of their reported revenue due to them at any given time. Likewise, providers can defer payment for 2 months. Hence, on average, providers should owe 2 months of their reported operating costs. We have estimated working capital accordingly using the aggregate revenues and operating costs (EBITDARM) for inclusion in capital employed. For example, the large providers’ children homes generated aggregated revenue of £410 million and incurred aggregated operating costs of £313 million in 2020. Accordingly, we estimated they are due debts of £68.3 million and owe £52.1 million, resulting in working capital of £16.2 million for the large providers.
The first method showed that providers have negative working capital in aggregate - it means that providers collect their debts from local authorities more quickly than they pay their suppliers and employees. The second method results in significantly higher working capital, higher capital employed and capital costs and a lower economic profit. It is another reason to view our economic profitability of residential accommodation and fostering services as lower bounds.
Risk capital (not used for residential accommodation and fostering agencies)
At this stage, we have not included a risk capital balance in capital employed. The approach assumes that providers’ debt levels are low given the nature of the business and that they would not have to hold significant risk capital in equity (cash) to act as a buffer against unexpected losses. In reality, we observe that some providers have very high debt levels (see below).
Profit margin analysis of fostering
In order to understand the profit margin for a low asset business such as a fostering agency, we need to consider not only whether margins are high in absolute terms but also whether they are high compared to margins earned by similar companies in other sectors. We would expect a sector with high margins to see greater entry until the high margins are competed away.
There are 3 reasons why high absolute levels of profit margins in a sector or of a provider might persist compared to similar businesses:
- Intellectual property (IP), research and development (R&D) or specialist technology: These factors can justify an above-market return in the form of high profit margins, at least until competitors catch up. The CMA considered this in its assessment of Google’s profitability in a recent market study.[footnote 22]
- Human capital or accumulated training: It applies where the value of a business comes from its people, who have a high level of training, accumulated experience, and knowledge. Competitors or the incumbent can earn high margins in the short term by acquiring or developing those people respectively. However, the value that these people bring is broadly shared with them through high wages and compensation, such as in law firms or management consultancies.
- Risk: It applies to high-risk businesses with volatile cash-flows (for example, proprietary trading) where equity or debt investors might need to underwrite the business frequently to fund temporary liquidity shortfalls. The company will need capital to do so, for which investors will want a return.
The factors mentioned above do not appear to apply to operating a fostering agency.
The alternative method to assess whether profits and prices in fostering agencies are high is to compare profit margins to similar companies in other sectors. We have used the pre-exceptional EBITM (earnings before interest, tax and management fee) for fostering agencies’ margin analysis as it is an appropriate measure for an asset-light business with minimal depreciation, amortisation, and property costs. We also excluded the management fee for the reasons outlined above.
In our profit margin analysis for fostering agencies, we intend to compare our results to comparable listed companies. We would welcome views on the appropriate (listed) companies we should use to compare to the fostering agencies. As an example:
- Capita Plc provides consulting, transformation and digital services business to the state and private companies. Its average pre-exceptional EBIT (operating) margin between FY 2016 and FY 2020 was 2.4%, ranging from -1% to 7.8%.
- Mitie Group Plc is a provider of facilities management services to the state and private companies. Its average pre-exceptional EBIT (operating) margin between FY 2016 and FY 2020 was 2.8%, ranging from -0.3% to 4.1%.
- Serco Group plc is a provider of public services. Its average pre-exceptional EBIT (operating) margin between FY 2016 and FY 2020 was 3.4%, ranging from 1.4%% to 4.3%.[footnote 23]
Summary of our approach to profitability
As a starting point, we have estimated the operating profitability of residential accommodation and fostering agency services using the pre-exceptional EBITDARM profit margin. We have then evaluated the economic profitability of residential accommodation by using a rate of return in real terms to market values of assets and a notional level of working capital. We have estimated the economic profitability of fostering services using the same method for residential accommodation but excluded property.[footnote 24] We have also compared the EBIT benchmark to pre-exceptional EBITM margins earned in the fostering sector.
Profitability results – 15 Large providers dataset using company-level data
Group level aggregated findings
Aggregated P&L of the 15 Large providers
We assessed the operating profitability of the 15 Large providers operating children’s homes, fostering agencies and unregulated accommodation using the Large Providers dataset.
Table 3 shows a 5 year aggregated average P&L from FY 2015 to 2020 along with the growth rates and the aggregated forecast P&L for 2021 for 15 Large providers of children’s homes, fostering agencies and unregulated accommodation.
Table 3: Aggregated Profit and Loss of the 15 Large providers, FY 2016 to FY 2020 actuals and FY 2021 forecasts
| £ million | 2016 to 2020 (Actual) Average | 2016 to 2020 CAGR | 2021 (Forecast) | 2020 to 2021 YOY Growth |
|---|---|---|---|---|
| Revenue | 941 | 14.3% | 1,399 | 14.9% |
| Staff costs | 509 | 14.0% | 718 | 7.7% |
| Non-staff operating costs | 232 | 14.9% | 385 | 32.3% |
| EBITDARM | 200 | 14.4% | 296 | 13.8% |
| EBITDARM margin (%) | 21.3% | - | 21.2% | - |
| Management fee | 13 | -8.3% | 9 | -22.2% |
| EBITDAR | 187 | 15.9% | 287 | 15.6% |
| EBITDAR margin (%) | 19.8% | - | 20.5% | - |
| Rent | 20 | 5.0% | 21 | 10.5% |
| EBITDA (pre-exceptional) | 167 | 17.1% | 266 | 16.0% |
| EBITDA (pre-exceptional) margin (%) | 17.9% | - | 17.5% | - |
| Exceptional items (costs) | 8 | - | 9 | - |
| EBITDA post-exceptional | 158 | 16.3% | 257 | 17.0% |
| EBITDA post exceptional (%) | 16.7% | - | 18.3% | - |
| Depreciation and amortisation | 57 | 30.2% | 83 | -21.2% |
| EBIT | 101 | 12.0% | 174 | 51.9% |
| EBIT margin (%) | 11.1% | - | 12.4% | - |
| Interest expense | 64 | 16.9% | 83 | -7.0% |
| Profit before tax | 37 | 8.5% | 91 | 255.7% |
| Profit before tax margin (%) | 4.4% | - | 6.5% | - |
| Analysis of costs | ||||
| Costs as a % of revenue | 2016 to 2020 (Actual) Average | 2021 Forecast | ||
| Staff costs | 53.9% | 51.3% | ||
| Non-staff operating costs | 24.8% | 27.5% | ||
| Management fee | 1.5% | 0.7% | ||
| Rent | 2.2% | 1.5% | ||
| Depreciation and amortisation | 5.7% | 5.9% | ||
| Interest expense | 6.7% | 5.9% | ||
| Rent and interest | 8.9% | 7.4 % | ||
| Rent, interest and depreciation | 14.5% | 13.3% |
Source: CMA analysis of Profit and Loss information submitted by the 15 Large providers (the Large providers’ dataset).
Note:
- CAGR is the compound annual growth rate and helps smooth growth rates. The CAGR represents the average yearly growth rate between 2016 to 2020.
Table 3 shows that the large providers earned healthy profit margins between FY 2016 and 2020, and these are forecast to remain stable in FY 2021. Between FY 2016 and FY 2020, staff costs accounted for 53.9% of revenue and operating costs (including staff and non-staff operating costs) accounted for 78.7% of revenue. It means that for every £100 in revenue, it costs approximately £80 to meet the day-to-day expenses of running residential accommodation or fostering agency services.
Property related costs, such as rent, depreciation and interest expense, accounted for 14.5% of revenue. Property associated costs that have a cash flow impact, such as rent, and interest accounted for approximately 8.9% of revenue.
Analysis of revenue streams
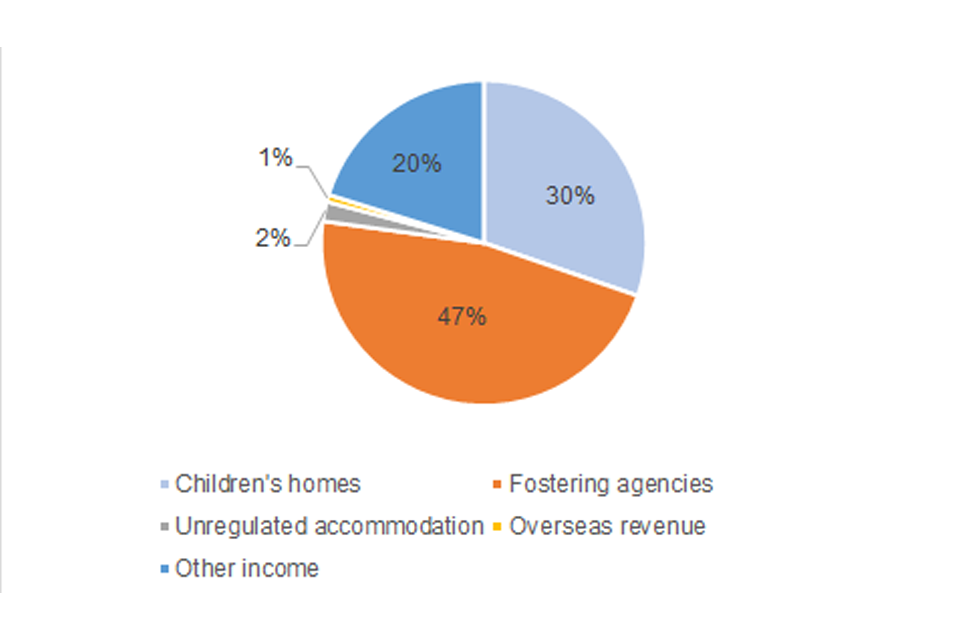
Figure 1 shows the revenue streams in aggregate by source for the 15 Large providers, whose profitability we have analysed below.
Figure 1: Revenue source of the 15 Large providers, FY 2016 to FY 2021
Source: CMA analysis of financial information of 15 large providers.
Figure 1 shows the Large providers generated nearly half their revenue from fostering agency services, just under a third from children’s homes and a fifth from activities unrelated to children’s social care.
Aggregate operating profitability of the 15 Large providers
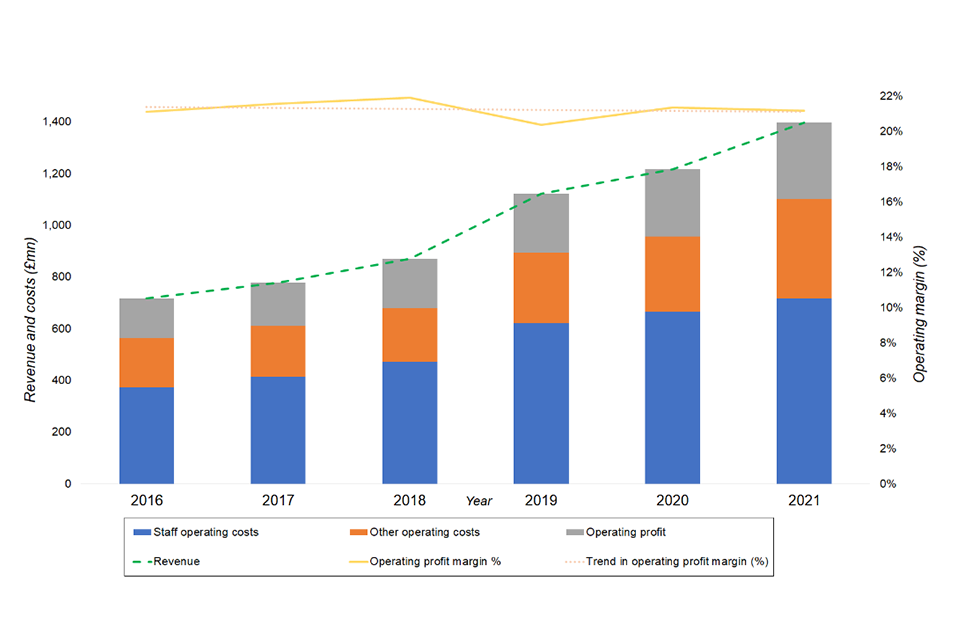
Figure 2 shows the trends in aggregate revenue, staff operating costs, other operating costs and pre-exceptional operating profit margin (EBITDARM %) of the 15 Large providers.
Figure 2: Aggregate operating profitability of the 15 Large providers, FY 2016 to FY 2021
Source: CMA analysis of Financial information of 15 large providers.
Note:
- This analysis includes the results of children’s homes, fostering agencies and unregulated accommodation.
- The 2016 to 2020 results are actuals, and the 2021 figures are forecasts.
- Operating profit margin is the pre-exceptional EBITDARM margin.
Figure 2 shows that aggregate revenue increased by 11.2% on average between FY 2016 and 2020. The operating profit margin (%) between FY 2016 to FY 2020 has remained largely flat, albeit slightly downward sloping at an average of 21.3% and is forecast to remain flat in 2021. The cost structure has not significantly changed despite the National Minimum Wage that came into effect on 1 April 2016 and the COVID-19 pandemic from FY 2020 - both would have increased operating costs in absolute terms.
Profitability of the children’s homes segment operated by the large providers
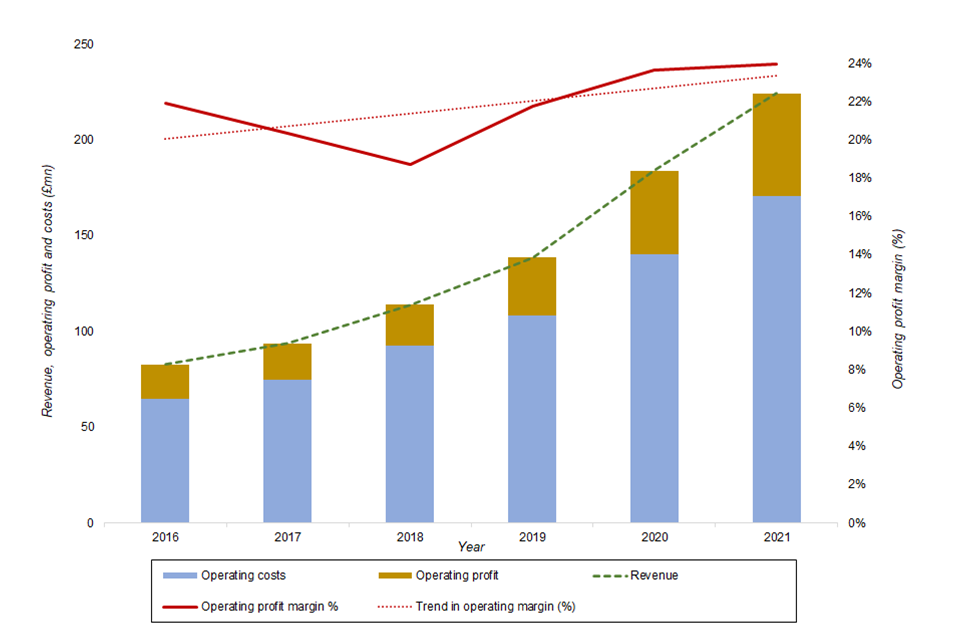
Aggregate operating profitability of the children’s homes segment
Figure 3 shows the trends in aggregate revenue, staff operating costs, other operating costs and pre-exceptional operating profit margin (EBITDARM %) of the 13 Large providers that operate children’s homes.
Figure 3: Aggregate revenue, operating profitability and operating costs for the 13 Large providers that operate children’s homes, FY 2016 to 2021
Source: CMA analysis of Financial information of 13 large providers.
Note:
- This analysis includes the results of children’s homes and excludes fostering and unregulated accommodation.
- The FY 2016 to 2020 results are actuals, and the FY 2021 figures are forecasts.
- Operating profit margin is the pre-exceptional EBITDARM margin.
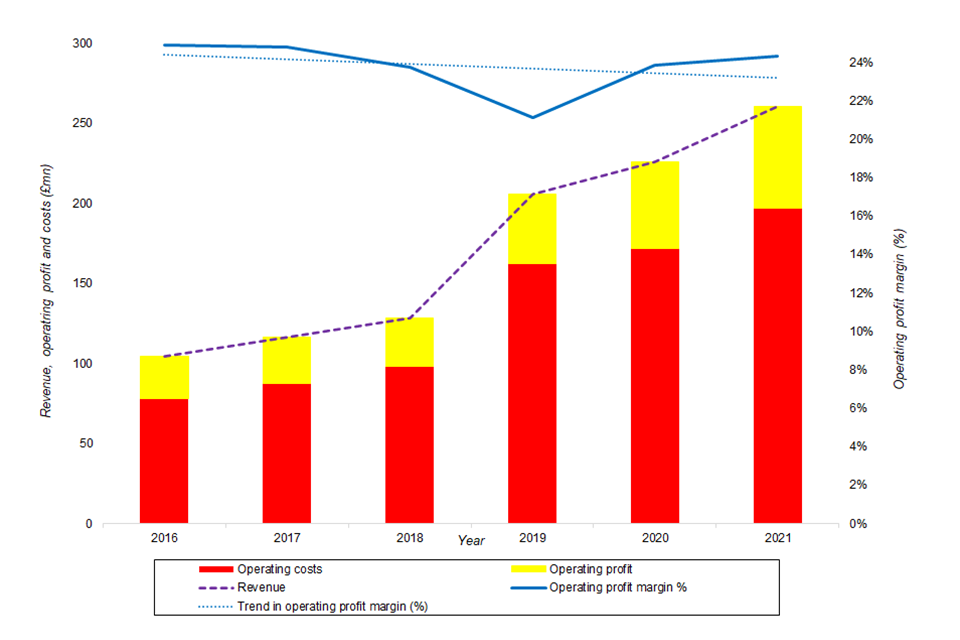
Figure 3 indicates that aggregate revenue increased by 17% on average between FY 2016 and 2020. This increase reflects a 16.9% operating cost increase, 17.2% operating profit increase, 5.2% above-inflation fee increases (Figure 11), and the impact of acquisitions. The operating profit margin (%) has largely remained flat at an average of 22.6% between FY 2016 and FY 2020 and is forecast to do so in FY 2021.
Disaggregated operating profitability of the children’s homes segment - private equity (PE) vs non-PE
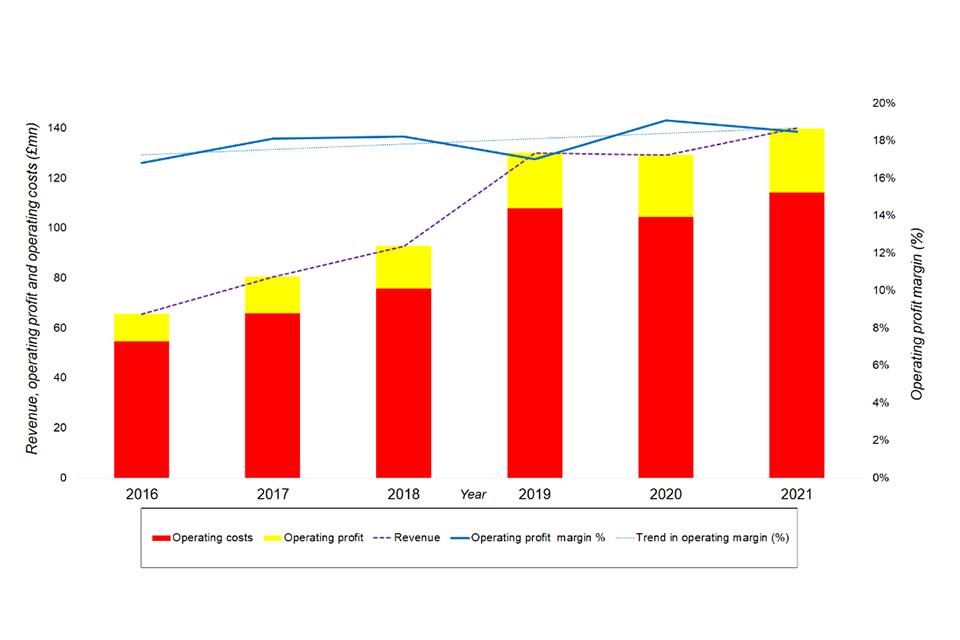
Figure 4 disaggregates figure 3 and shows the trends in the same metrics of the 7 PE-owned Large providers that run children’s homes.
Figure 4: Aggregate revenue, operating profitability and operating costs for the 7 Large PE-owned providers that operate children’s homes, FY 2016 to FY 2021
Source: CMA analysis of Financial information of 7 PE-owned Large providers.
Note:
- This analysis includes the results of children’s homes and excludes fostering and unregulated accommodation.
- The FY 2016 to 2020 results are actuals, and the FY 2021 figures are forecasts.
- Operating profit margin is the pre-exceptional EBITDARM margin.
Figure 4 illustrates that aggregate revenue increased by 17.4% on average between FY 2016 and 2020. It reflects a 16.8% operating cost increase, 5.8% above-inflation fee increase (Figure 12), 19.2% operating profit increase, and the impact of acquisitions. The operating profit margin (%) rose by 1.7% and averaged 21.3% between FY 2016 and 2020. As a result, operating profits started accounting for a greater proportion of the revenue.
Figure 5 disaggregates the detail in figure 3 and shows the trends in the same metrics of the 6 non-PE-owned Large providers that operate children’s homes.
Figure 5: Aggregate revenue, operating profitability and operating costs for the 6 Large non-PE-owned providers that operate children’s homes, FY 2016 to 2021
Source: CMA analysis of Financial information of the 6 non-PE owned Large providers.
Note:
- This analysis includes the results of children’s homes and excludes fostering and unregulated accommodation.
- The FY 2016 to FY 2020 results are actuals, and the FY 2021 figures are forecasts.
- Operating profit margin is the pre-exceptional EBITDARM margin.
Figure 5 illustrates that aggregate revenue increased by 16.7% on average between FY 2016 and 2020. It reflects a 17.0% operating cost increase, 4.7% above-inflation fee increase (Figure 12), 15.7% operating profit increase, and the impact of acquisitions. The operating profit margin (%) decreased by 1.0% and averaged 23.7% between FY 2016 and 2020. As a result, operating profits started accounting for a lower proportion of the revenue during the review period.
Profitability of the fostering agency segment operated by the Large providers
Aggregate operating profitability of the fostering segment
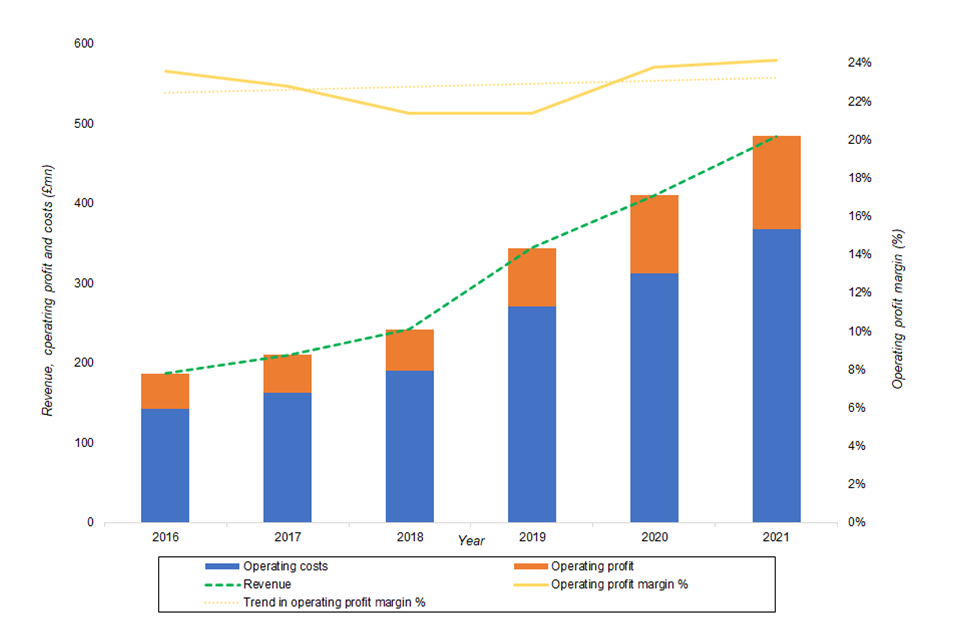
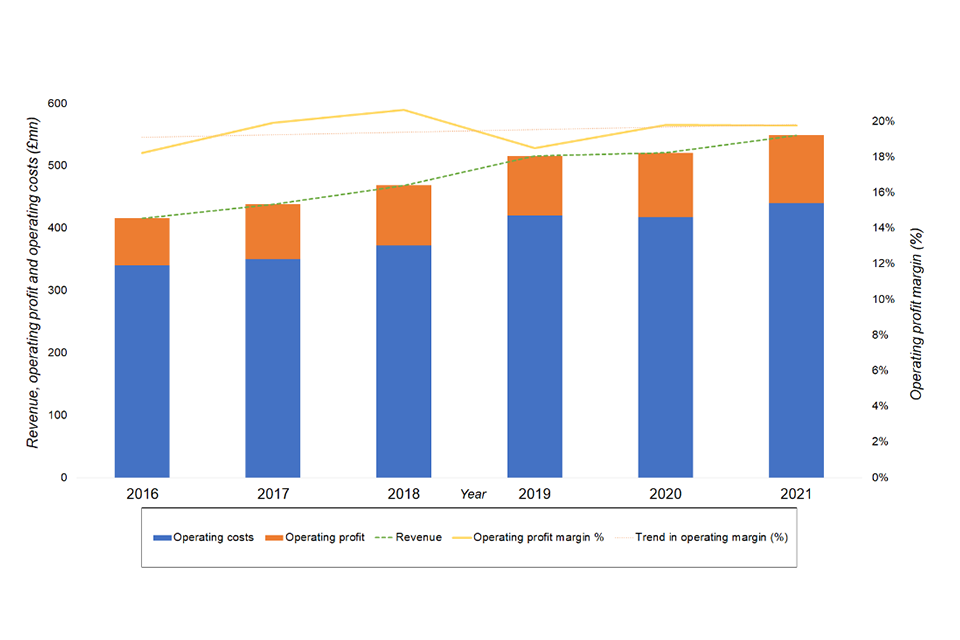
Figure 6 shows the trends in aggregate revenue, staff operating costs, other operating costs and pre-exceptional operating profit margin (EBITDARM %) of the 8 Large providers that operate fostering agencies.
Figure 6 Aggregate revenue, operating profitability and operating costs for the 8 Large providers that operate fostering agencies, FY 2016 to 2021
Source: CMA analysis of Financial information of 8 Large providers that operate fostering agencies.
Note:
- This analysis includes the results of fostering and excludes children’s homes and unregulated accommodation.
- The FY 2016 to 2020 results are actuals, and the FY 2021 figures are forecasts.
- Operating profit margin is the pre-exceptional EBITDARM margin.
Figure 6 indicates that aggregate revenue increased by 4.6% on average between FY 2016 and FY 2020. It reflects a 4.2% operating cost increase and the impact of acquisitions while the fee remained stable. The operating profit margin (%) largely remained flat at an average of 19.4% between FY 2016 and 2020 and is forecast to be similar in 2021.
Disaggregated operating profitability of the fostering segment - PE vs non-PE
Figure 7 disaggregates figure 6 and shows the trends in the same metrics of the 3 PE-owned Large providers that run fostering agencies.
Figure 7: Aggregate revenue, operating profitability and operating costs for the 3 Large PE-owned providers that operate fostering agencies, FY 2016 to 2021
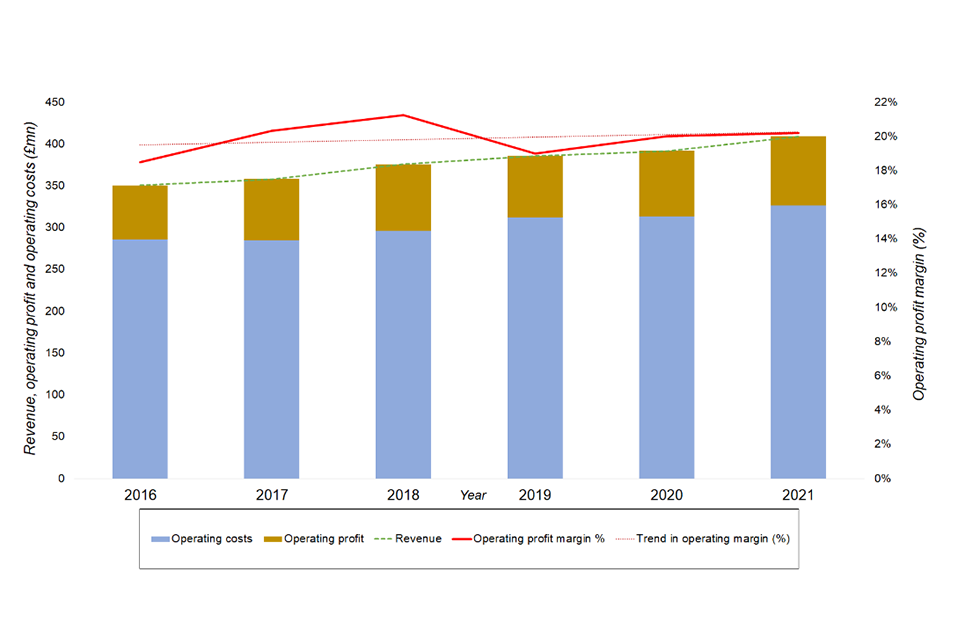
Figure 7 illustrates that aggregate revenue increased slightly by 2.2% on average between FY 2016 and FY 2020. It reflects a 1.9% operating cost increase and the impact of acquisitions while the fee remained stable. The operating profit margin (%) remained stable and averaged 19.8% between FY 2016 and FY 2020.
Figure 8 disaggregates figure 6 and shows the trends in the same metrics of the 5 non-PE-owned Large providers that operate fostering agencies.
Figure 8: Aggregate revenue, operating profitability and operating costs for the 5 Large non-PE-owned providers that operate fostering agencies, FY 2016 to 2021
Source: CMA analysis of Financial information of 5 non-PE owned Large providers that operate fostering agencies.
Note:
- This analysis includes the results of fostering and excludes children’s homes and unregulated accommodation.
- The FY 2016 to 2020 results are actuals, and the FY 2021 figures are forecasts.
- Operating profit margin is the pre-exceptional EBITDARM margin.
Figure 8 illustrates that aggregate revenue increased by 14.5% on average between FY 2016 and 2020. It reflects a 13.9% operating cost increase, 17.5% operating profit increase and the impact of acquisitions while the fee remained stable. The operating profit margin (%) remained stable and averaged 17.8% between FY 2016 and 2020.
Profitability of the unregulated accommodation segment operated by the Large providers
Aggregate operating profitability of the unregulated accommodation segment
Figure 9 shows the trends in aggregate revenue, staff operating costs, other operating costs and pre-exceptional operating profit margin (EBITDARM %) of the 5 Large providers that run unregulated accommodation.
In FY 2016 and 2017, there was a minimal number of looked-after children at the unregulated accommodation providers in our dataset. Therefore, we excluded both years from our analysis, given the risk of sampling error.
Figure 9 Aggregate revenue, operating profitability and operating costs for the 5 Large providers that operate unregulated accommodation, FY 2018 to 2021

Source: CMA analysis of Financial information of the 5 Large providers that operate unregulated accommodation.
Note:
- This analysis includes the results of unregulated accommodation and excludes children’s homes and fostering.
- The 2018 to 2020 results are actuals, and the 2021 figures are forecasts.
- Operating profit margin is the pre-exceptional EBITDARM margin.
Figure 9 indicates that aggregate revenue increased by 3.5% on average between FY 2018 and FY 2020. It reflects a 6% operating cost increase and the impact of acquisitions, despite a 0.8% fee decrease (Figure 15). The operating profit margin (%) has declined and averaged 36.7% between FY 2018 and FY 2020 and is forecast to rise in 2021.
Preliminary ROCE analysis
Figure 10 sets out our preliminary analysis of the large providers’ return on capital employed (ROCE). We explained the methodology behind our calculations of capital employed in paragraphs 25 to 42. For our ROCE analysis, we used the same approach to calculating property value, working capital and equipment for both children’s homes and unregulated accommodation and used EBITDARM (pre-exceptional) as the numerator.
Figure 10: ROCE for children’s homes run by 13 Large providers, FY 2016 to 2021 and unregulated accommodation run by 5 Large providers, FY 2018 to 2021
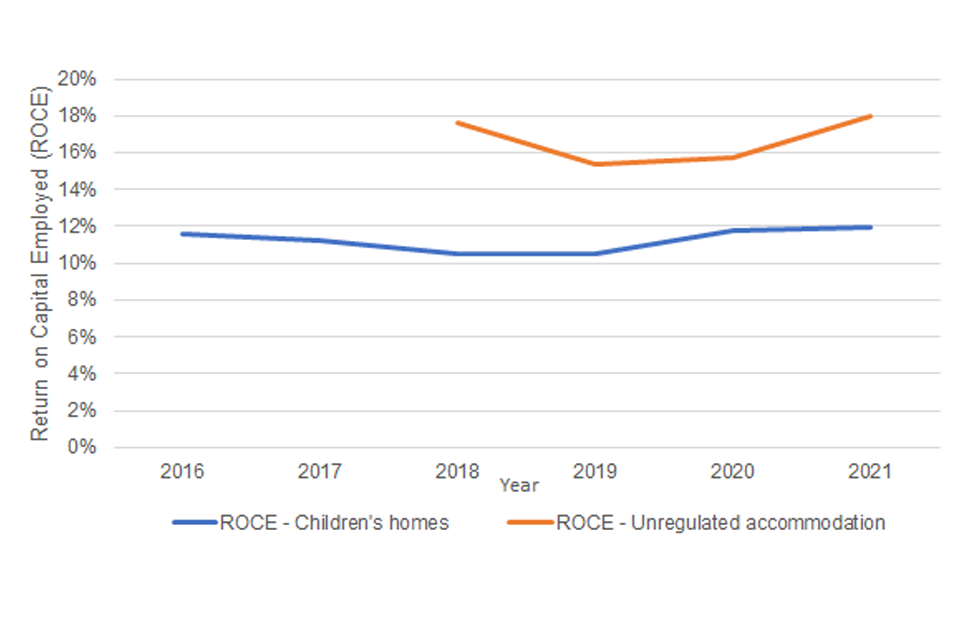
Source: CMA analysis of Financial information of 13 large providers for children’s homes and 5 large providers for unregulated accommodation.
Note:
- This analysis includes the results of children’s homes and unregulated accommodation and excludes fostering.
- The FY 2016 to 2020 results are actuals, and the FY 2021 figures are forecasts.
Figure 10 illustrates that the average rate of return was 11.1% for children’s homes for FY 2016 to FY 2020 and 16.2% for unregulated accommodation for FY 2018 to FY 2020.
As described earlier, we have not yet estimated the appropriate cost of capital to use for this sector. However, if the ROCE estimates set out above are higher than the cost of capital, that would indicate that the providers are earning a higher return than expected in a well-functioning market.
Our Care Homes market study estimated a 5-8% rate of return, while our private healthcare investigation found a pre-tax market rate of return on capital employed of around 9% in nominal terms, suggesting that over the medium-term, investors would require a real annual rate of return of 7%.
At this stage, it is unlikely that the true cost of capital in the sector is as high as the ROCE figures set out above. Therefore, it is likely that the large providers are making substantial economic profits.
Pricing analysis results using the Large providers’ dataset (company level) and local authority dataset (home level)
This section assesses the Large providers’ average fee components and compares them to local authority operating costs for children’s homes.
Average fee per child in children’s homes (operated by the Large providers) and local authority operating costs
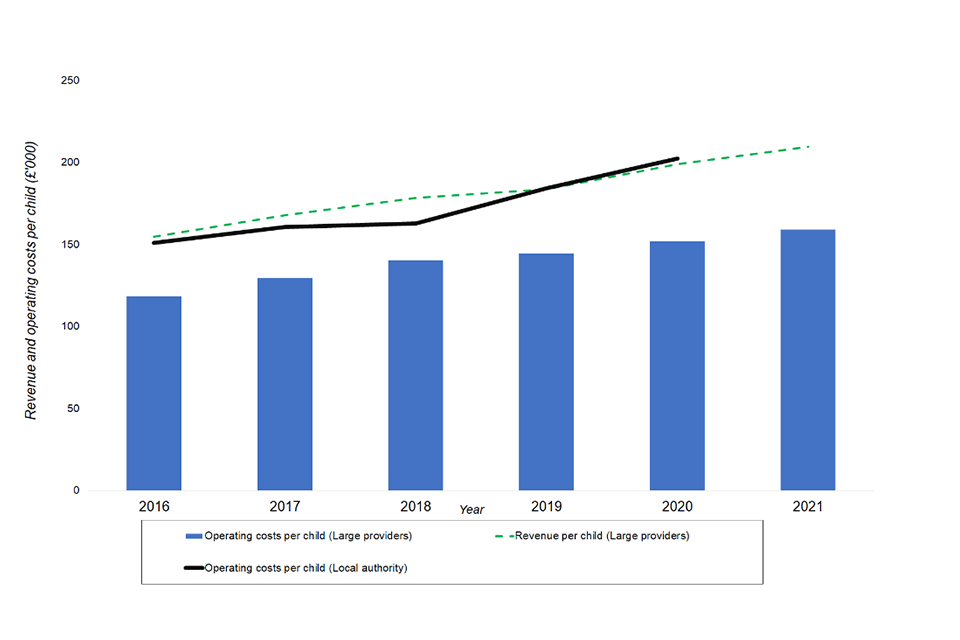
Average fee and local authority operating costs per child in children’s homes
Figure 11 shows the trend in the average fee per child for children’s homes run by 13 Large providers and compares it to the average local authority operating cost. Figure 11: Average fee per child for children’s homes run by 13 Large providers and the average local authority operating costs per child, FY 2016 to 2021
Source: CMA analysis of Financial information of 13 large providers and 14 local authorities across England, Scotland and Wales.
Note:
- This analysis includes the results of children’s homes and excludes fostering and unregulated accommodation.
- The FY 2016 to 2020 results are actuals, and the FY 2021 figures are forecasts.
Figure 11 demonstrates that:
- the average fee per child increased year-on-year from £154,830 in FY 2016 to £199,186 in FY 2020, representing an annual growth rate of 5.2%. It is forecast to continue to grow in 2021.
- Operating costs increased,[footnote 25] and providers simultaneously benefitted from the above-inflation and rising fee rates, thus keeping the operating profit margin flat at 22.6%.
- Local authority operating costs have been approximately 25.8% higher, on average, between FY 2016 and FY 2020 than the equivalent for the large private providers.[footnote 26] We used identical definitions to gather cost data, but we are undertaking further work on the operating cost differential and its causes.[footnote 27] We intend to examine whether differences in the acuity of care, quality, cost allocations or other factors explain this difference.
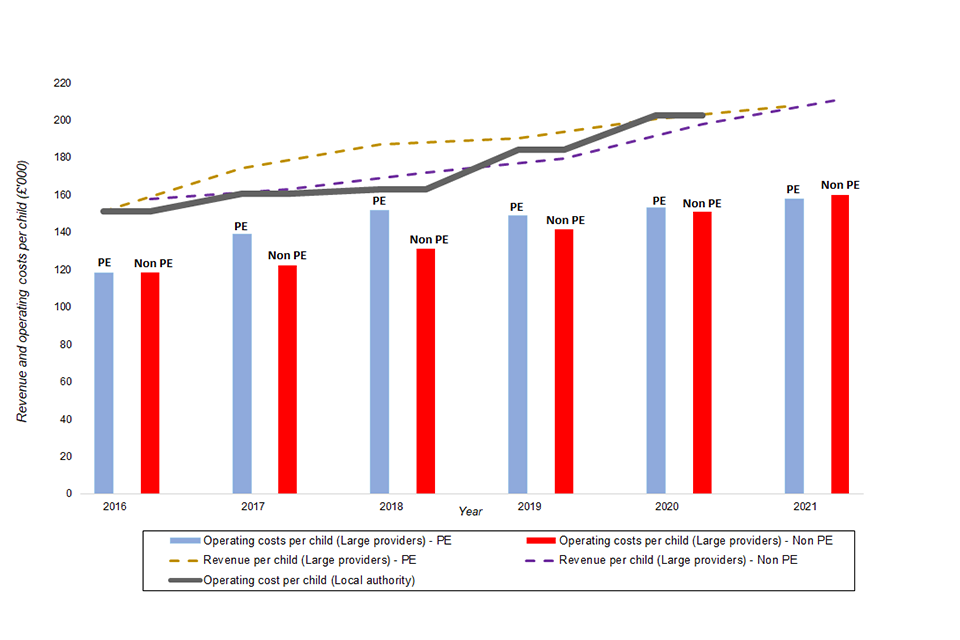
Disaggregated analysis of Large providers’ average revenue and local authority operating costs per child in children’s homes: PE vs Non-PE
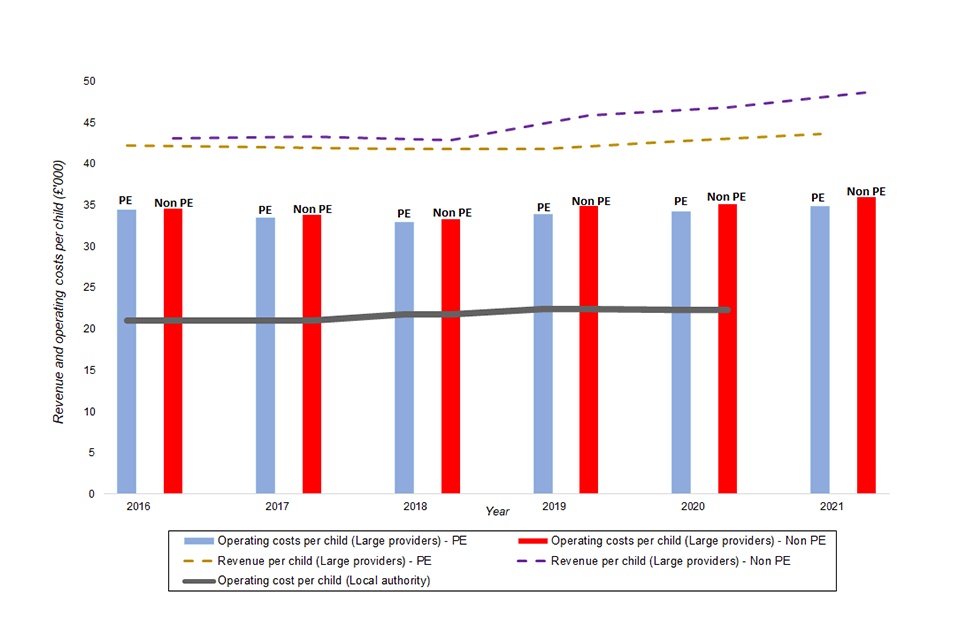
Figure 12 disaggregates figure 11 by comparing the average fees between PE-owned and non-PE-owned providers.
Figure 12: Average fee per child for children’s homes operated by 7 PE-owned providers and 6 non-PE-owned providers, and the average local authority operating costs per child, FY 2016 to 2021
Source: CMA analysis of Financial information of 13 Large providers and 14 local authorities across England, Scotland and Wales.
- This analysis includes the results of children’s homes and excludes fostering and unregulated accommodation.
- The FY 2016 to 2020 results are actuals, and the FY 2021 figures are forecasts.
Figure 12 shows that on average between FY 2016 and FY 2020: * the average fee increased by 5.8% for PE-owned providers and by 4.7% for non-PE-owned providers. * PE-owned providers’ average fee per child was approximately 3.9% higher between FY 2016 and FY 2020. * local authority operating costs have been about 21.1% and 29.7% higher, on average, between FY 2016 and 2020 than the equivalent for PE-owned and non-PE-owned providers, respectively.[footnote 28]
Average fee per child in fostering agencies (operated by the Large providers) and local authority operating costs
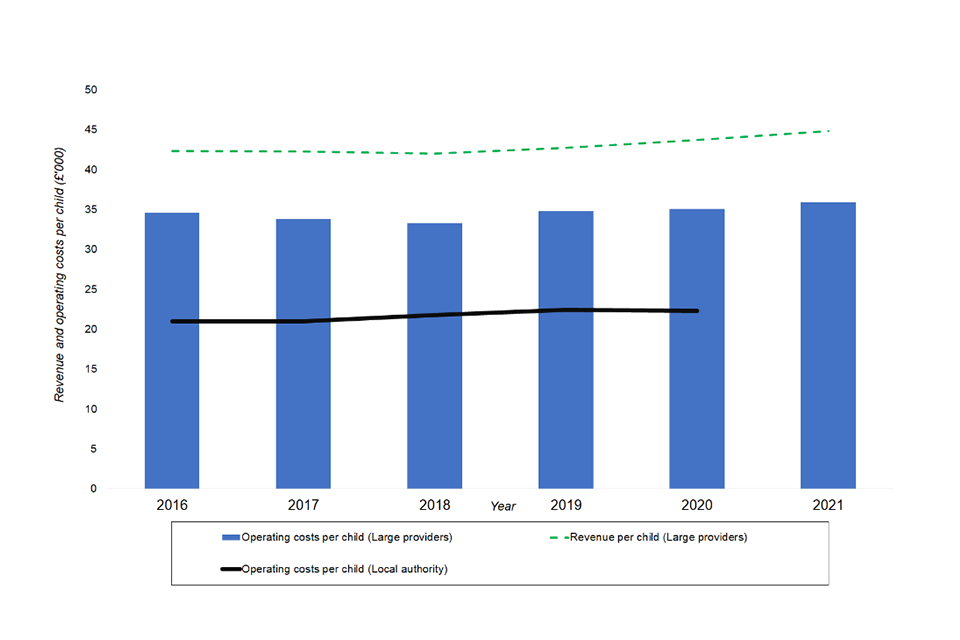
Average fee and local authority operating costs per child in fostering agencies
Figure 13 shows the trend in the average fee per child for fostering agencies operated by 8 Large providers and compares it to the average local authority operating cost in fostering.
Figure 13: Average fee per child for fostering agencies run by 8 Large providers and the average local authority operating costs per child, FY 2016 to 2021
Source: CMA analysis of Financial information of 8 Large providers and 28 local authorities across England, Scotland and Wales.
- This analysis includes the results of fostering and excludes children’s homes and unregulated accommodation.
- The FY 2016 to 2020 results are actuals, and the FY 2021 figures are forecasts.
Figure 13 demonstrates that:
- the average fee per child has remained flat from FY 2016 to 2020 at an average of £42,626. It is forecast to remain stable into FY 2021.
- Operating costs have also been flat, thus keeping the operating profit margin flat at 19.4% between FY 2016 to 2020.
- Local authority operating costs have been approximately 36.8% lower, on average, between FY 2016 and 2020 than the equivalent for the Large private providers.[footnote 29] As for children’s homes, we will examine whether differences in the acuity of care, quality, cost allocations or other factors explain this difference.
Disaggregated analysis of the Large providers’ average revenue and local authority operating costs per child in fostering agencies PE vs non-PE
Figure 14 disaggregates figure 13 by comparing the average fees between PE-owned and non-PE-owned providers.
Figure 14: Average fee per child for fostering agencies operated by 3 PE-owned providers and 5 non-PE-owned providers, and the average local authority operating costs per child, FY 2016 to FY 2021
Source: CMA analysis of Financial information of 8 Large providers and 28 local authorities across England, Scotland and Wales.
- This analysis includes the results of fostering and excludes children’s homes and unregulated accommodation.
- The FY 2016 to FY 2020 results are actuals, and the FY 2021 figures are forecasts.
Figure 14 shows that on average between FY 2016 and FY 2020:
- PE-owned providers’ average fee per child was 5.2% lower between FY 2016 and 2020.
- Local authority operating costs have been approximately 35.7% and about 40.5% lower, on average, between FY 2016 and FY 2020 than the equivalent for PE-owned and non-PE-owned providers, respectively.[footnote 30]
Average fee per child in unregulated accommodation (operated by the Large providers)
Average fee per child in unregulated accommodation
Figure 15 shows the trend in the average fee per child for unregulated accommodation by 5 Large providers.
Figure 15: Average fee per child for unregulated accommodation operated by 5 Large providers, FY 2018 to FY 2021
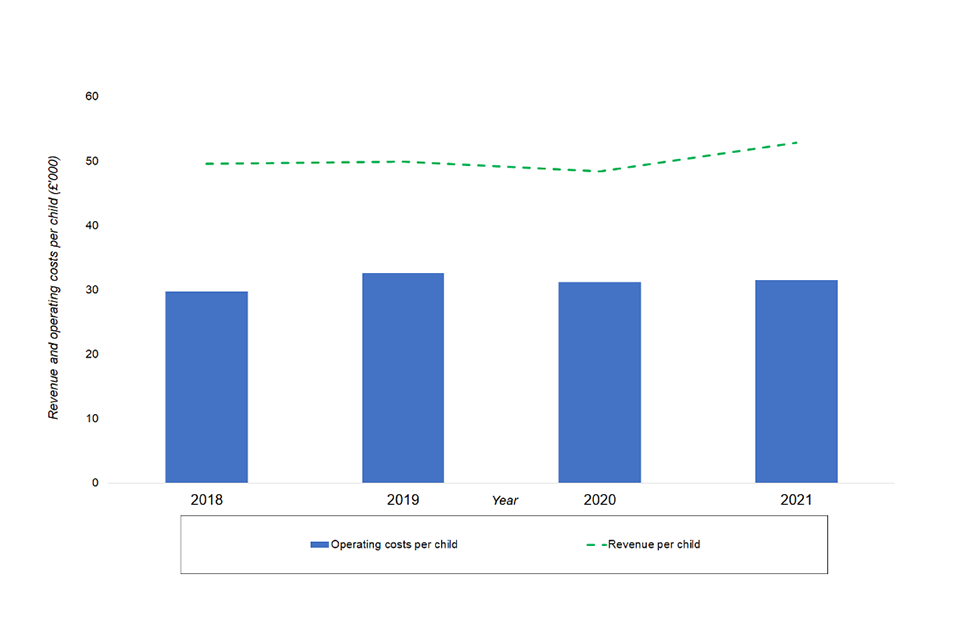
Source: CMA analysis of financial information of 5 Large providers.
Note:
- This analysis includes the results of unregulated accommodation and excludes children’s homes and fostering.
- The FY 2018 to FY 2020 results are actuals, and the FY 2021 figures are forecasts.
Figure 15 demonstrates that the average fee per child decreased year-on-year from £49,593 in FY 2018 to £48,368 in FY 2020, representing an annual decrease of 0.8% before increasing in 2021. Over the same period, operating costs increased on average by 6%.
Financial leverage and resilience results – Large providers dataset
Introduction
Some stakeholders have raised concerns about the risks to resilience arising from specific providers’ high debt levels and off-balance sheet liabilities.[footnote 31] Therefore, we have undertaken some high-level analyses to assess the levels of debt in the industry. Our work is preliminary, and we will undertake further work.
Providers operating children’s homes and unregulated accommodation might require long-term debt to purchase assets such as land, building and equipment. A fostering agency may require debt to purchase equipment. In practice, providers will use a combination of debt and equity to buy these assets. Providers might also require short-term debt to manage their working capital peaks. Our analysis in this Appendix mainly concerns long-term debt.
A provider’s capital structure is critical in determining how well it can weather endogenous and exogenous shocks. A provider with industry average levels of operating profitability and whose capital structure is fully funded by equity capital would not, ordinarily, incur significant additional non-discretionary expenses and cash outflows after paying for its operational costs. The significant cash outflow post operating costs would be dividends, which is at the discretion of management. This capital structure aids a provider in avoiding adverse cash-flow movements that could trigger financial distress or insolvency.
However, if the same provider were to fund its capital structure almost entirely with debt, its financial risk profile would increase. The provider must generate regular and adequate cash flows to repay the interest and capital and adhere to its debt covenants. High levels of debt (gearing) can increase the financial risk profile of a provider because:[footnote 32]
- a provider must make regular cash payments to repay its debt to avoid default.[footnote 33] Hence, it must generate a sufficient level of operating cash flows in each period. However, even relatively minor movements in a provider’s cash flow from internal or external shocks could dramatically affect its ability to do so;
- a provider must also adhere to its debt covenants. These can either be financial (for example, gearing ratios) or non-financial such as a negative pledge that might restrict its ability to borrow further.[footnote 34] An actual or potential breach of its covenants could trigger a restructuring event that could limit further funds to the provider from the lender, or at its worst, lead to insolvency; and
- providers with long term debt are also likely to have pledged some or all of their assets as security.[footnote 35] [footnote 36] During normal trading conditions, this restricts the use of these secured assets for other purposes. However, it gives creditors the leverage to pursue their interests over other stakeholders such as equity investors during distressed trading conditions.
Table 4 defines the metrics that we have used in our analysis.
Table 4: Definitions of debt metrics
| Metric | Definition | Meaning |
|---|---|---|
| Debt levels and financial leverage | ||
| Total debt | Loans and debt from third parties (for example, banks), shareholder loans and other debt. Excludes hire purchase leases, lease liabilities and provisions. | Money borrowed by a provider from a third party. |
| EBITDA leverage | Net debt / pre-exceptional EBITDA (excluding shareholder loans) | Provider’s ability to pay off its debt and the approximate time it can pay off all its debt. A higher value indicates that a provider may not be able to service its debt appropriately. It is suitable for businesses without significant rental payments. |
| Adjusted EBITDAR leverage | Net debt/EBITDAR (pre-exceptional) | As above, however, it is suitable for businesses with significant rental payments |
| Gearing (%) | Total Debt / (Total Debt + Shareholder Equity) | The percentage amount of funding that comes from lenders versus shareholders. |
| Years to pay the total debt | 1 / (Cash flow available for debt servicing (CFADS) / Total Debt) | t measures how long it would take a provider to repay its total debt by using all of its cash flow to repay its debt. |
| Years to pay external debt | 1 / (CFADS / External Debt) | It measures how long it would take a provider to repay its external debt by using all of its cash flow to repay its debt. External lenders are more likely to be less lenient regarding debt repayments. |
| Debt servicability | ||
| Debt service obligations (DSO) | Debt repayment commitments and interest obligations. Excludes lease and hire purchase contract payments | Debt service is the cash required to repay the principal and interest of outstanding debt for a particular period. DSO includes current interest payments and principal repayments. |
| Cash flow available for debt servicing (CFADS) | Post-exceptional EBITDA. +/- changes in working capital, +/- corporation tax, +/- capex, +/- dividends. | Net cash generated to service debt obligations. |
| Cash flow cover | CFADS / DSO | Provider’s ability to pay off debt obligations with its operating cash flows. A higher ratio is better. |
| CFADS as a percentage of total debt | CFADS/Total debt | Other than financial leverage (Debt/EBITDA), analysts are placing weight on this metric to assess the credit risk of companies in light of the very low-interest rates since 2009.[footnote 37] Note that CFADS is a close proxy to free cash flows |
| Interest cover | Pre-exceptional EBITDA / Net interest expense | Provider’s ability to pay interest on its outstanding debt. A higher ratio is better. |
| Rental cover | EBITDAR / Rent and lease expense | Provider’s ability to pay its rents. A higher ratio is better. |
| Loan to value | Tangible fixed assets value / Net debt (excluding shareholder loans) | Provider’s ability to meet debt obligations through the sale of fixed assets. It is relevant in insolvency. A higher ratio is better. |
| Net tangible worth | Net assets - Intangible assets -Deferred tax | Total value of a company’s physical and sellable assets. It is a close proxy to the amount that can be realised in insolvency. A higher value is better. |
Financial leverage of providers primarily focussed on residential accommodation
We have analysed the debt levels of the 9[footnote 38] Large providers who generated most of their FY 2016 and 2020 revenue from residential accommodation. Of these 9 Large providers, 4 were PE-owned.
Debt types
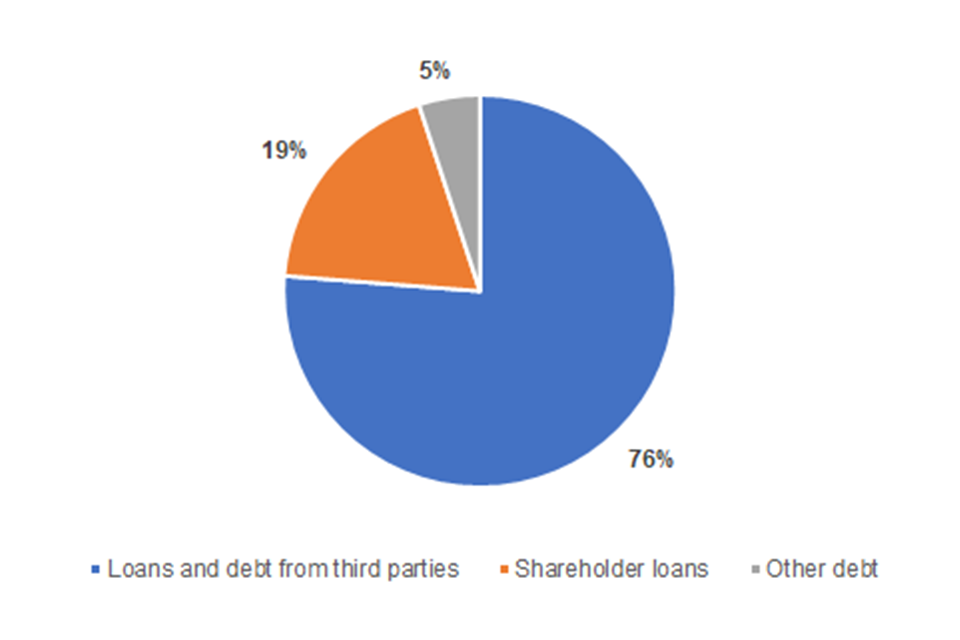
Figure 16 discloses the composition of debt of providers primarily focussed on residential accommodation.
Figure 16: Bank debt, third party loans, shareholder loans and other debt - FY 2016 to FY 2021 (average): residential accommodation focussed providers
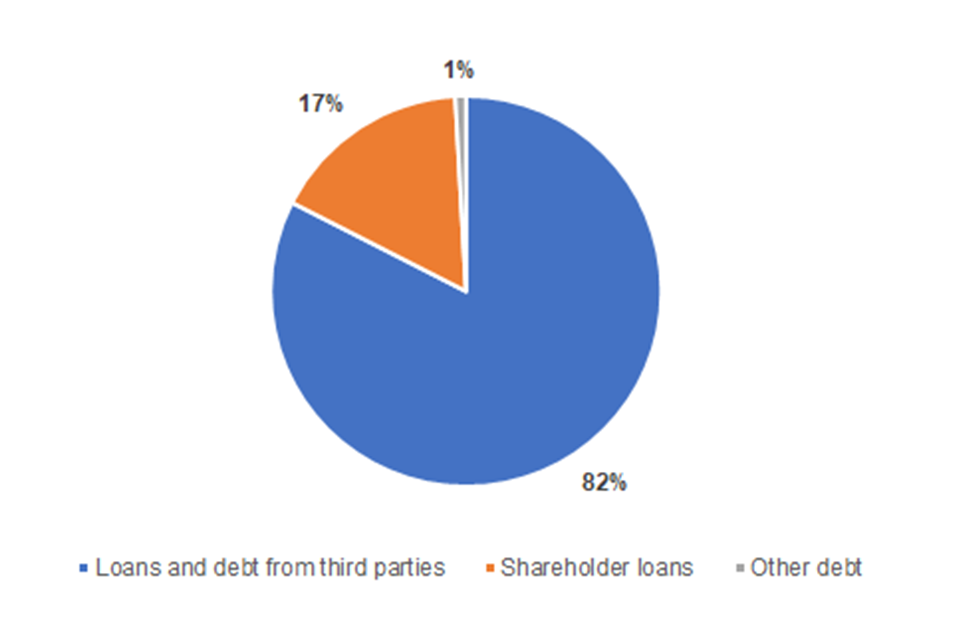
Source: CMA analysis of Financial information of 9 large providers.
Figure 16 shows that providers focused on residential accommodation obtained most of their debt from third parties. However, shareholder loans constituted a significant 17% of the overall debt. PE investors often use shareholder loans. Since they rank between junior debt and equity, their primary purpose is to guarantee investors a distribution in liquidation by placing them ahead of the other equity investors.
Disaggregation: Debt profile - PE vs non-PE residential accommodation providers
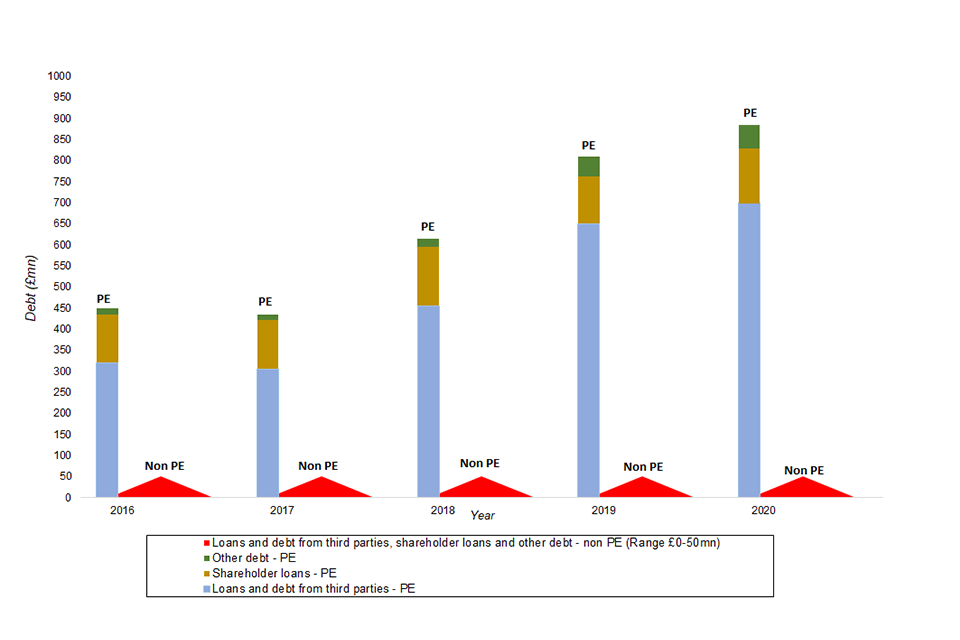
Figure 17 disaggregates figure 16 by comparing the aggregate debt composition of PE and non-PE owned providers primarily focussed on residential accommodation between FY 2016 and 2021.
Figure 17: Loans and debt from third parties, shareholder loans and other debt - FY 2016 to 2021: PE vs non-PE residential accommodation focussed providers[footnote 39]
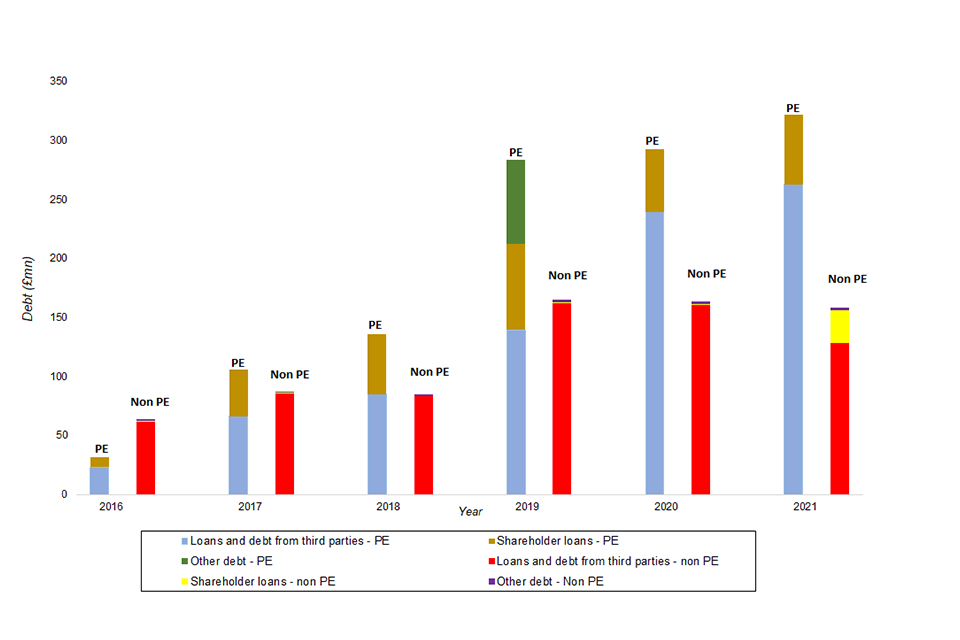
Source: CMA analysis of Financial information of 9 large providers.
Note:
- This analysis includes the results reported at the Group level. *The FY 2016 to 2020 results are actuals, and the FY 2021 figures are forecasts.
Figure 17 shows that the debt levels of PE-owned providers have increased at a faster rate than for non-PE-owned providers. Acquisitions by PE-owned providers and new debt issuances may explain this rise. Also, only the PE-owned providers had shareholder loans until FY 2020.
Debt levels compared to assets and revenue
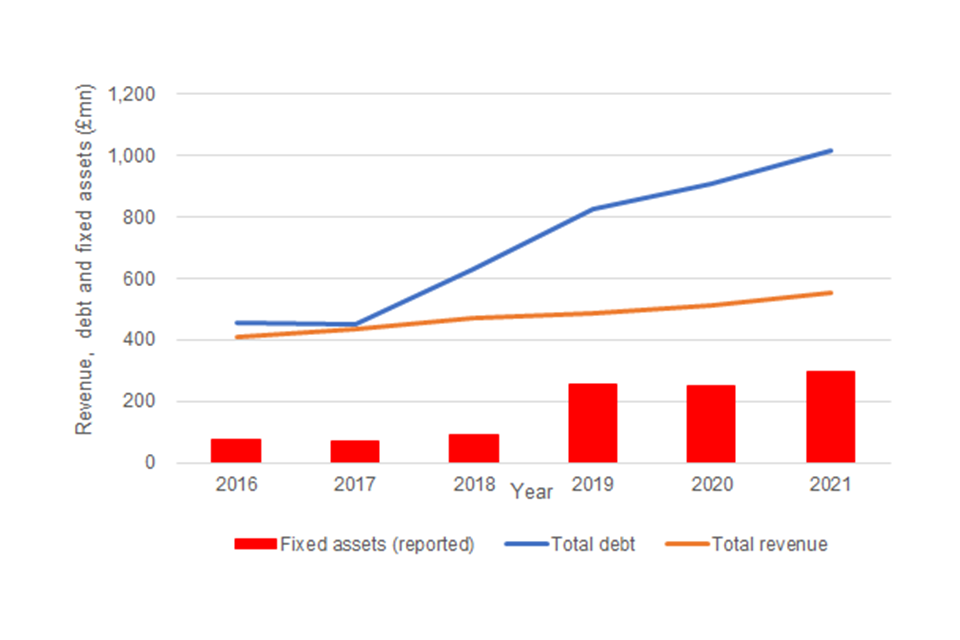
Figure 18 compares the debt levels of providers primarily focussed on residential accommodation to their revenues and fixed assets. We have also estimated a notional value for the property’s market value using the same method to estimate the capital employed above.[footnote 40]
Figure 18: Total debt compared to revenue and fixed assets (reported and notional property values), FY 2016 to 2021: residential accommodation focussed providers
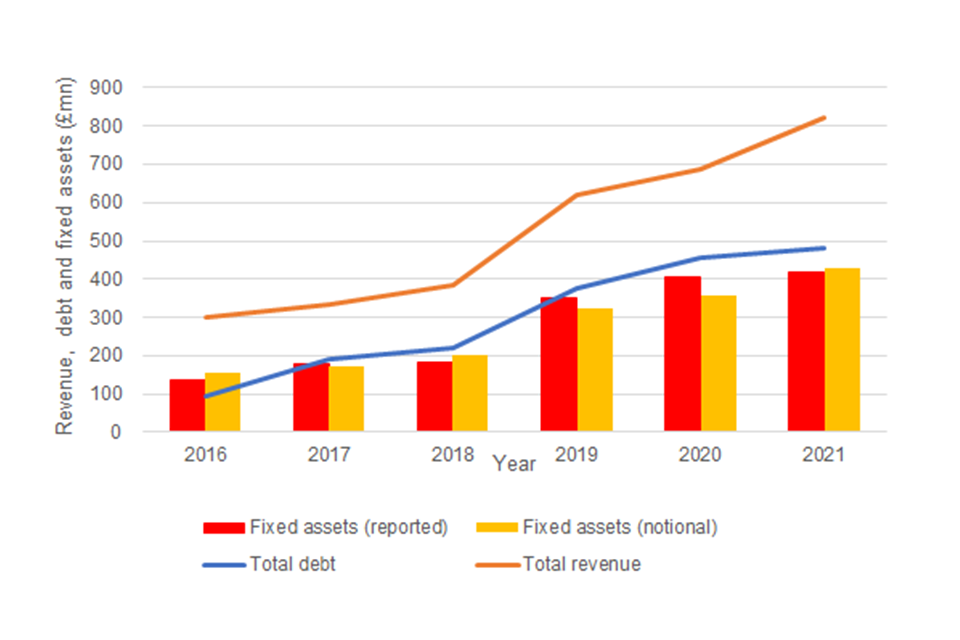
Source: CMA analysis of financial information of 9 Large providers.
Note:
- This analysis includes the results reported at the Group level.
- The FY 2016 to FY 2020 results are actuals, and the FY 2021 figures are forecasts.
Figure 18 shows that the debt levels have increased in line with rising revenues, reported fixed assets and notional property values. Debt increased by 30.9% on average between FY 2016 and 2021, compared to 18.3% for revenues and 20.7% for fixed assets. Also, total debt exceeded reported fixed assets from FY 2018 and notional property values from FY 2017. It suggests that there may be limited headroom for all debt holders to recover their outstanding debt (principle amount and interest due) in insolvency. It indicates that the large providers are carrying more debt than can be secured by the underlying assets.
Disaggregation: Debt levels - PE vs non-PE residential accommodation focussed providers
Figure 19 disaggregates figure 18 by comparing the debt levels of PE-owned and non-PE owned providers.
Figure 19: Total debt compared to revenue and fixed assets (reported and notional property values), FY 2016 to 2021: PE vs non-PE residential accommodation focussed providers
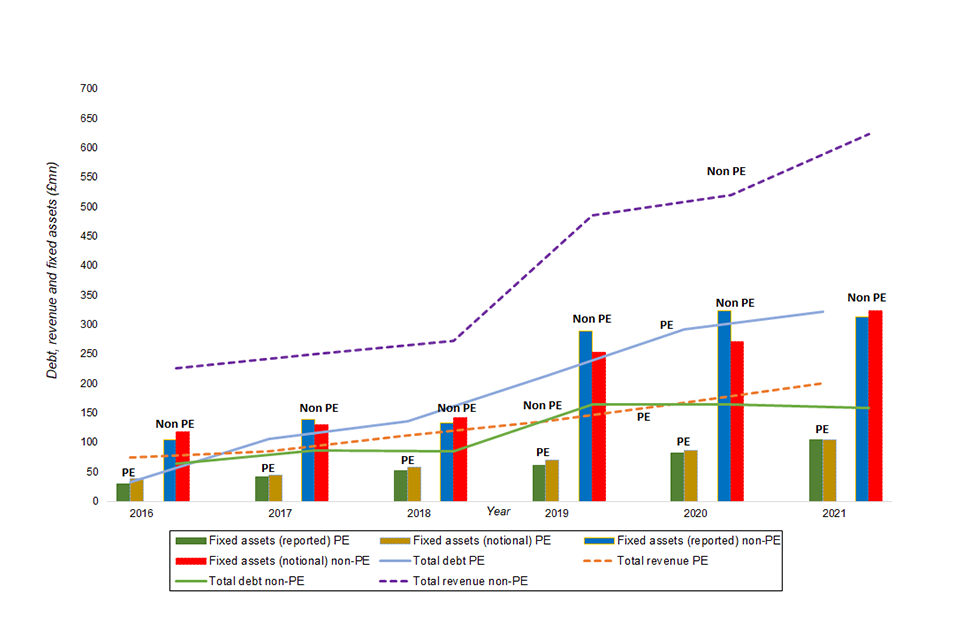
Source: CMA analysis of Financial information of 9 large providers.
Note:
- This analysis includes the results reported at the Group level.
- The FY 2016 to FY 2020 results are actuals, and the FY 2021 figures are forecasts.
Figure 19 shows that the PE-owned providers’ debt levels:
- increased faster than that for non-PE providers and faster than PE-owned providers’ revenue growth between FY 2016 and FY 2021.
- are significantly higher than the PE-owned providers’ reported fixed assets and notional property values. It suggests that there is limited headroom for all debt holders to recover their outstanding debt in insolvency. A significant proportion of the debt is likely to be unsecured unless secured by inter-company guarantees.
Financial leverage, debt serviceability and solvency
In aggregate, table 5 shows critical metrics to assess financial leverage, debt serviceability, and solvency of providers primarily focused on residential accommodation. We have compared these to a benchmark that reflects the average of submissions from providers of their financial covenants and what they consider reasonable key performance indicators (KPIs).
Table 5: Financial leverage, debt serviceability and solvency of residential accommodation focussed providers - FY 2016 to 2021
| 2016 | 2017 | 2018 | 2019 | 2020 | 2021 | Benchmark | |
|---|---|---|---|---|---|---|---|
| Debt levels and financial leverage | |||||||
| Total debt (£ million) | 95.4 | 192.7 | 220.6 | 376.9 | 455.9 | 480.1 | N/A |
| EBITDA leverage | 1.6 | 3.5 | 3.2 | 3.4 | 2.9 | 2.7 | >4.0 |
| Adjusted EBITDAR leverage | 1.3 | 2.9 | 2.7 | 2.9 | 2.7 | 2.5 | >3.5 |
| Gearing (%) | 45.3 | 49.6 | 54.7 | 54.1 | 53.7 | 54.7 | >60% |
| Years to pay the total debt | 4.6 | 7.3 | 6.0 | 4.5 | 4.1 | 4.2 | N/A |
| Years to pay the external debt | 4.1 | 5.8 | 4.6 | 3.6 | 3.6 | 3.4 | N/A |
| Debt serviceability | |||||||
| DSO (£ million) | 22.3 | 30.5 | 19.5 | 132.6 | 29.9 | 25.3 | N/A |
| CFADS (£ million) | 20.8 | 26.5 | 37.0 | 83.2 | 111.8 | 114.9 | <0 |
| Cash flow cover | 0.9 | 0.9 | 1.9 | 0.6 | 3.7 | 4.5 | <1.3 |
| CFADS as a percentage of total debt (%) | 21.8 | 13.8 | 16.8 | 22.1 | 24.5 | 23.9 | <50% |
| Interest cover | 5.8 | 4.0 | 3.6 | 2.9 | 3.3 | 4.3 | <3.0 |
| Rental cover | 6.2 | 6.4 | 6.1 | 7.0 | 13.0 | 13.7 | N/A |
| Solvency | |||||||
| Loan to value | 1.6 | 1.0 | 1.0 | 1.2 | 1.2 | 1.2 | <1.0 |
| Net tangible worth (£ million) | 49.4 | 106.6 | 92.6 | 102.1 | 70.6 | 96.6 | <0 |
Source: CMA analysis of financial information of 9 Large providers.
Note:
- This analysis includes the results reported at the Group level.
- The FY 2016 to 2020 results are actuals, and the FY 2021 figures are forecasts.
Table 5 shows that most of the metrics are within range of the benchmark. However, cash flow generation to service debt obligations appears below this benchmark (in red).
Disaggregation: Financial leverage, debt serviceability and solvency - PE vs non-PE residential accommodation focussed providers
Table 6 disaggregates table 5 by comparing the critical metrics for PE and non-PE owned providers primarily focussed on children’s homes.
Table 6: Financial leverage, debt serviceability and solvency - FY 2016 to 2021: PE Vs non-PE homes focussed providers
| 2016 | 2017 | 2018 | 2019 | 2020 | 2021 | Benchmark | |
|---|---|---|---|---|---|---|---|
| Debt levels and financial leverage | |||||||
| Total debt (£ million) - PE | 31.9 | 105.7 | 136.0 | 212.2 | 292.2 | 321.5 | N/A |
| Total debt (£ million) - non PE | 63.5 | 97.0 | 84.6 | 164.7 | 163.7 | 158.5 | N/A |
| EBITDA leverage - PE | 4.2 | 16.2 | 10.7 | 10.8 | 8.7 | 7.6 | >4.0 |
| EBITDA leverage - non PE | 1.2 | 1.6 | 1.3 | 1.7 | 1.2 | 1.1 | >4.0 |
| Adjusted EBITDAR leverage - PE | 3.0 | 11.6 | 7.8 | 8.4 | 7.0 | 6.3 | >3.5 |
| Adjusted EBITDAR leverage - non PE | 1.0 | 1.3 | 1.2 | 1.5 | 1.2 | 1.0 | >3.5 |
| Gearing (%) - PE | 74.7 | 116.1 | 126.2 | 122.0 | 113.9 | 114.6 | >60% |
| Gearing (%) - non PE | 36.7 | 25.9 | 25.5 | 29.0 | 25.8 | 24.9 | >60% |
| Years to pay the total debt - PE | 22.7 | 92.0 | 15.9 | 17.2 | 11.4 | 13.5 | N/A |
| Years to pay the total debt - non PE | 3.3 | 3.4 | 3.0 | 2.3 | 1.9 | 1.7 | N/A |
| Debt serviceability | |||||||
| DSO (£ million) - PE | 3.2 | 8.6 | 5.8 | 10.5 | 14.0 | 18.6 | N/A |
| DSO (£ million) - non PE | 19.2 | 15.7 | 6.4 | 114.3 | 7.3 | 6.7 | N/A |
| CFADS (£ million) - PE | 1.4 | 1.1 | 8.5 | 12.3 | 25.6 | 23.8 | <0 |
| CFADS (£ million) - non PE | 19.4 | 25.4 | 28.5 | 70.9 | 86.1 | 91.1 | <0 |
| Cash flow cover - PE | 0.4 | 0.1 | 1.5 | 1.2 | 1.8 | 1.3 | <1.3 |
| Cash flow cover - non PE | 1.0 | 1.6 | 4.4 | 0.6 | 11.7 | 13.7 | <1.3 |
| CFADS as a percentage of total debt (%) - PE | 4.4 | 1.1 | 6.3 | 5.8 | 8.8 | 7.4 | <50% |
| CFADS as a percentage of total debt (%) - non PE | 30.6 | 29.2 | 33.7 | 43.0 | 52.6 | 57.5 | <50% |
| Interest cover - PE | 4.6 | 0.9 | 1.0 | 1.0 | 1.2 | 1.4 | <3.0 |
| Interest cover - non PE | 6.0 | 8.4 | 10.8 | 5.6 | 6.6 | 12.8 | <3.0 |
| Rental cover - PE | 3.6 | 3.5 | 3.6 | 4.5 | 5.3 | 5.8 | N/A |
| Rental cover - non PE | 7.3 | 7.5 | 7.6 | 8.2 | 26.4 | 28.4 | N/A |
| Solvency | |||||||
| Loan to value - PE | 1.2 | 0.5 | 0.5 | 0.4 | 0.4 | 0.4 | <1.0 |
| Loan to value - non PE | 1.8 | 1.7 | 1.7 | 2.0 | 2.5 | 3.1 | <1.0 |
| Net tangible worth (£ million) - PE | -3.6 | -74.8 | -94.4 | -156.8 | -203.2 | -203.0 | <0 |
| Net tangible worth (£ million) - non PE | 53.0 | 181.4 | 187.0 | 259.0 | 273.7 | 299.6 | <0 |
Source: CMA analysis of Financial information of 9 Large providers.
Note:
- This analysis includes the results reported at the Group level.
- The FY 2016 to 2020 results are actuals, and the FY 2021 figures are forecasts.
- The benchmark reflects the average of submissions from providers of their financial covenants and what they consider reasonable KPIs.
Table 6 shows that PE-owned providers have had significantly worse financial leverage, debt serviceability, and solvency indicators than non-PE providers and also compared to the benchmark.
Financial leverage of providers primarily focussed on fostering
We have analysed the debt levels of 5 Large providers, who generated greater than 89% of their FY 2016 and 2020 revenue from fostering. Of these 5 providers, 3 were PE-owned.
Debt types
Figure 20 shows the composition of debt of providers primarily focussed on fostering.
Figure 20: Bank debt, third party loans, shareholder loans and other debt - FY 2016 to FY 2021 (average): fostering focussed providers
Source: CMA analysis of Financial information of 5 large providers.
Figure 20 shows that providers focused on fostering agency services obtained most of their debt from third parties. However, shareholder loans constituted a significant 19% of the overall debt. There is also a higher prevalence of non-traditional debt in fostering at 5% compared to 1% for providers focused on residential accommodation.
Disaggregation: Debt profile - PE vs non-PE fostering agency providers
Figure 21 disaggregates figure 20 by comparing the debt composition of PE and non-PE owned providers primarily focussed on fostering between FY 2016 and FY 2021.
Figure 21: Bank debt, third party loans, shareholder loans and other debt - FY 2016 to 2021: PE vs non-PE fostering agency providers
Source: CMA analysis of financial information of 5 Large providers.
Note:
- This analysis includes the results reported at the Group level.
- The FY 2016 to FY 2020 results are actuals, and the FY 2021 figures are forecasts.
- For this analysis, there were only 2 non-PE providers in our dataset. Therefore, we have included a range for the non-PE providers and combined the 3 debt types to protect commercially sensitive information.
Fostering agency services is an asset-light business, which requires very little long-term debt to finance the underlying assets. Therefore, we intend to investigate further the exceptionally high levels of debt held by PE-owned providers. Figure 21 also shows that the debt levels of PE-owned providers increased significantly and at a faster rate than for non-PE-owned providers. Acquisitions by PE-owned providers and new debt issuances may explain some of this rise.
Debt levels compared to assets and revenue
Figure 22 compares the debt levels of the Large providers primarily focussed on fostering agency services to their revenues and fixed assets.
Figure 22: Total debt compared to revenue and fixed assets, FY 2016 to 2021: fostering agency providers
Source: CMA analysis of financial information of 5 Large providers.
Note:
- This analysis includes the results reported at the Group level.
- The FY 2016 to FY 2020 results are actuals, and the FY 2021 figures are forecasts.
Figure 22 shows that total debt significantly exceeded reported fixed assets, suggesting limited headroom for all debt holders to recover their outstanding debt of the principle amount and interest due in insolvency. It also shows that debt levels have increased faster than revenues and growth in fixed assets. Debt increased by 14.3% on average between FY 2016 and FY 2021, compared to 5.2% for revenues and 25.1% for fixed assets.
Disaggregation: Debt levels - PE vs non-PE fostering focussed providers
Figure 23 disaggregates figure 22 by comparing the debt levels of PE-owned and non-PE owned Large providers.
Figure 23: Total debt compared to revenue and fixed assets, FY 2016 to 2021: PE vs non-PE fostering agency Large providers
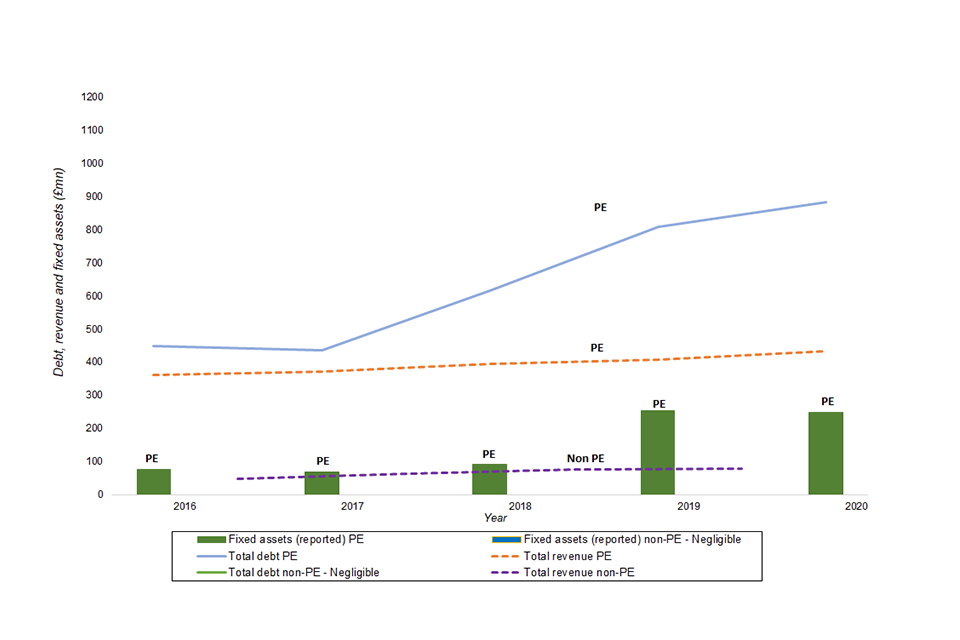
Source: CMA analysis of Financial information of 5 large providers.
Note:
- This analysis includes the results reported at the Group level.
- The FY 2016 to 2020 results are actuals based on group figures, and the FY 2021 figures are forecasts.
Figure 23 shows that the PE-owned providers’ debt levels:
- were substantially higher than the PE-owned providers’ reported fixed assets and notional property values; and
- increased at a significantly faster rate than that for non-PE providers and PE-owned providers’ revenue growth between FY 2016 and 2021. Financial leverage, debt serviceability and solvency
Table 7 shows key metrics, in aggregate, to assess financial leverage, debt serviceability and solvency of providers primarily focussed on fostering compared to a benchmark level.
Table 7: Financial leverage, debt serviceability and solvency of fostering focussed providers - FY 2016 to 2021
| 2016 | 2017 | 2018 | 2019 | 2020 | 2021 | Benchmark | |
|---|---|---|---|---|---|---|---|
| Debt levels and financial leverage | |||||||
| Total debt (£ million) | 457.6 | 452.6 | 633.2 | 827.5 | 911.6 | 1019.5 | N/A |
| EBITDA leverage | 6.7 | 5.4 | 7.3 | 9.1 | 8.9 | 9.0 | >4.0 |
| Adjusted EBITDAR leverage | 6.2 | 5.1 | 6.7 | 8.4 | 8.3 | 8.4 | >3.5 |
| Gearing (%) | 97.6 | 101.8 | 102.4 | 104.1 | 119.0 | 123.8 | >60% |
| Years to pay the total debt | 8.6 | 6.5 | 7.1 | 9.1 | 8.5 | 7.1 | N/A |
| Years to pay external debt | 6.4 | 4.8 | 5.5 | 7.8 | 7.2 | 5.9 | N/A |
| Debt serviceability | |||||||
| DSO (£ million) | 25.1 | 38.9 | 99.5 | 41.2 | 52.7 | 57.5 | N/A |
| CFADS (£ million) | 53.1 | 69.2 | 89.1 | 91.1 | 107.7 | 144.1 | <0 |
| Cash flow cover | 2.1 | 1.8 | 0.9 | 2.2 | 2.0 | 2.5 | <1.3 |
| CFADS as a percentage of total debt (%) | 11.6 | 15.3 | 14.1 | 11.0 | 11.8 | 14.1 | <50% |
| Interest cover | 1.7 | 1.6 | 1.5 | 1.4 | 1.3 | 1.4 | <3 |
| Rental cover | 13.7 | 15.1 | 11.9 | 13.5 | 15.0 | 15.4 | N/A |
| Solvency | |||||||
| Loan to value | 0.3 | 0.2 | 0.2 | 0.4 | 0.4 | 0.4 | <1.0 |
| Net tangible worth (£ million) | -410.0 | -414.7 | -591.5 | 657.4 | -733.2 | -803.0 | <0 |
Source: CMA analysis of Financial information of 5 large providers.
Note:
- This analysis includes the results reported at the Group level.
- The FY 2016 to 2020 results are actuals, and the FY 2021 figures are forecasts.
- The benchmark reflects the average of submissions from providers of their financial covenants and what they consider reasonable KPIs.
Table 7 illustrates that several metrics are outside the benchmark range (in red).
Disaggregation: financial leverage, debt serviceability and solvency - PE vs non-PE residential accommodation focussed providers
Table 8 disaggregates table 7 by comparing the critical metrics for PE and non-PE owned providers primarily focussed on fostering.
Table 8: Financial leverage, debt serviceability and solvency - FY 2016 to 2021: PE Vs non-PE fostering agency providers
| 2016 | 2017 | 2018 | 2019 | 2020 | Benchmark | |
|---|---|---|---|---|---|---|
| Debt levels and financial leverage | ||||||
| Total debt (£ million) - PE | 448.5 | 434.7 | 614.7 | 808.3 | 883.6 | N/A |
| Total debt (£ million) - non PE | 6 - 11 | 16 - 21 | 16 - 21 | 16 - 21 | 26 - 32 | N/A |
| EBITDA leverage - PE | 7.4 | 6.2 | 8.6 | 10.7 | 10.4 | >4.0 |
| EBITDA leverage - non PE | 0.7 | 1.1 | 0.6 | 1.0 | 1.3 | >4.0 |
| Adjusted EBITDAR leverage - PE | 6.9 | 5.8 | 7.8 | 9.9 | 9.7 | >3.5 |
| Adjusted EBITDAR leverage - non PE | 0.6 | 1.0 | 0.5 | 0.9 | 1.2 | >3.5 |
| Gearing (%) - PE | 101.2 | 107.5 | 107.4 | 108.3 | 125.7 | >60% |
| Gearing (%) - non PE | 24.8 | 36.0 | 21.4 | 32.9 | 37.5 | >60% |
| Years to pay the total debt - PE | 9.0 | 6.9 | 8.1 | 10.2 | 9.5 | N/A |
| Years to pay the total debt - non PE | 3.0 | 2.9 | 1.4 | 1.6 | 2.0 | N/A |
| Years to pay external debt - PE | 6.7 | 5.1 | 6.3 | 8.8 | 8.1 | N/A |
| Years to pay external debt - non PE | 1.3 | 2.0 | 1.0 | 1.2 | 1.3 | N/A |
| Debt serviceability | ||||||
| DSO (£ million) - PE | 23.2 | 34.9 | 94.6 | 36.2 | 48.3 | N/A |
| DSO (£ million) - non PE | 1 - 3 | 3 - 5 | 4 - 6 | 4 - 6 | 4 - 6 | N/A |
| CFADS (£ million) - PE | 50.0 | 63.0 | 75.6 | 79.4 | 93.4 | <0 |
| CFADS (£ million) - non PE | 2 - 4 | 6 - 8 | 12 - 15 | 10 - 13 | 13 - 16 | <0 |
| Cash flow cover - PE | 2.2 | 1.8 | 0.8 | 2.2 | 1.9 | <1.3 |
| Cash flow cover non PE | 1.6 | 1.5 | 2.7 | 2.4 | 3.3 | <1.3 |
| CFADS as a percentage of total debt (%) - PE | 11. | 14.5 | 12.3 | 9.8 | 10.6 | <50% |
| CFADS as a percentage of total debt (%) - non PE | 30 - 37 | 30 - 37 | 67 - 82 | 54 - 66 | 47 - 59 | <50% |
| Interest cover - PE | 1.6 | 1.4 | 1.3 | 1.2 | 1.1 | <3.0 |
| Interest cover - non PE | 9.1 | 11.5 | 13.4 | 17.9 | 37.6 | <3.0 |
| Rental cover - PE | 14.3 | 15.4 | 11.4 | 13.2 | 14.7 | N/A |
| Interest cover - non PE | 10.5 | 13.9 | 15.4 | 15.1 | 16.7 | N/A |
| Solvency | ||||||
| Loan to value - PE | 0.3 | 0.2 | 0.2 | 0.4 | 0.4 | <1.0 |
| Loan to value - non PE | -0.4 | 7.2 | 2.0 | 10.0 | 14.9 | <1.0 |
| Net tangible worth (£ million) - PE | -406.6 | -406.3 | -586.4 | -649.3 | -714.1 | <0 |
| Net tangible worth (£ million) - non PE | (2) - (4) | (8) - (10) | (4) - (6) | (8) - (10) | (180 - (21) | <0 |
Source: CMA analysis of Financial information of 5 Large providers.
Note:
- This analysis includes the results reported at the Group level.
- The FY 2016 to 2020 results are actuals, and the FY 2021 figures are forecasts.
- The benchmark reflects the average of submissions from providers of their financial covenants and what they consider reasonable KPIs.
- For this analysis, there were only 2 non-PE providers in our dataset. Therefore, we have included a range to protect commercially sensitive information.
- The ranges do not reflect the mid-point and are for illustration only.
Table 8 shows that PE-owned providers have had significantly higher debt levels and worse financial leverage, debt serviceability, and solvency indicators than non-PE providers and also compared to the benchmark level.
Questions for stakeholders
We welcome comments from stakeholders on:
- the approach we are taking to the analysis of the sector; and
- the initial findings from our analysis and our interpretation of those findings.
We have set out some specific questions that would help us further our analysis.
Operating and economic profitability, and prices
- We welcome views on our proposed profitability methodology.
- We are seeking input on our approach to analysing the sector’s profitability, including:
- property valuation methodology;
- our approach to estimating working capital and equipment costs; and
- our approach to profit margin analysis for fostering.
- When considering foster agencies, what other companies should we use to benchmark their profit margins?
- Our work to date has focussed on the large providers. What additional questions should we address to gauge the profitability and price levels of the sector, and what further work could we undertake?
Capital cost
- We welcome views on the most suitable approach to estimating the cost of capital and the appropriate cost of capital that we should use.
- Is there any sector-specific market data that could be used to identify a benchmark return for the industry?
- If you have information on the rate of return or cost of capital used in recent investment projects, please submit details, including the methodology used to determine rates of return.
Financial leverage and resilience
- Do you agree with our findings regarding the levels of debt and financial leverage of the large providers? Also:
- How and why would the results differ for non-large providers?
- What insights can one draw on the sector’s resilience from the above analysis and examples in similar sectors such as care homes for the elderly?
- What are the other implications of the high debt levels of some providers?
- Assuming fostering is not an asset-heavy business, what could contribute to the differences in the debt levels (figure 21) and ratios (table 8) between PE and non-PE owned providers?
- What additional work should we undertake to understand the sector’s financial resilience? For example:
- Whether and how to effectively assess off-balance sheet risks?
- Whether and how particular group structures or business models impact resilience or make it challenging to gauge resilience?
Appendix B: Key aspects of the legal framework
Local authorities’ statutory duties
Local authorities have statutory duties in relation to the children taken into their care and are obliged to safeguard and promote their welfare including (where appropriate) through the provision of accommodation and care. Where it is in the child’s best interests, this should be provided locally in order to ensure continuity in their education, social relationships, health provision and (where possible and appropriate) contact with their family.
In England, local authorities are required to take steps that secure, so far as reasonably practicable, sufficient accommodation within the local authority’s area which meets the needs of the children it looks after (the ‘sufficiency duty’).[footnote 41]
Statutory guidance published in 2010 provides details on how local authorities can ensure that they are meeting their obligations. The guidance states that local authorities ‘should include in relevant commissioning strategies their plans for meeting the sufficiency duty’ and ‘be in a position to secure, where reasonably practicable, sufficient accommodation for looked after children in their local authority area.’[footnote 42]
In Scotland, local authorities shall provide accommodation for any looked after child[footnote 43] in their area who may require such provision.[footnote 44] Local authorities may also provide accommodation for any child within their area if they consider that to do so would safeguard or promote his welfare.[footnote 45]
Scottish local authorities and the relevant health boards are required to produce strategic plans (Children’s Services Plans) every 3 years.[footnote 46] A guidance document on children’s services planning was issued in 2020.[footnote 47] The guidance notes that children’s services planning should drive ‘the development of local commissioning processes which are based on robust information about needs, cost and quality, and ongoing engagement with service users and the wider community.’[footnote 48]
In Wales, local authorities have a general duty to ‘take steps to ensure that, so far as is reasonably practicable’, they are able to provide looked after and other accommodated children with ‘accommodation that is within the local authority’s area, and meets the needs of those children ‘.[footnote 49]
Part 6 of the Code of Practice on Looked After and Accommodated Children[footnote 50] states that in discharging this duty, the local authority must have regard to the benefit of having a number of accommodation providers in their area that is sufficient to discharge its duty, and the benefit of having a range of accommodation in its area capable of meeting different needs.
Welsh local authorities and local health boards are required to jointly carry out an assessment of the projected and current needs for care and support, and the support needs of carers in the local authority’s area (a population needs assessment).[footnote 51]
Welsh local authorities, in partnership with local health boards and Regional Partnership Boards, will also be required to publish market stability reports every 5 years (with the first reports to be published by 1 June 2022). These reports will require an assessment of the sufficiency of care and support in meeting the needs and demand for social care as set out in the population needs assessment, and the stability of the market for regulated services providing care and support.[footnote 52]
Market oversight
Unlike for adult social care, in England there is no statutory market oversight scheme for the children’s social care sector. Market oversight is the term used for the scheme established by the Care Act 2014 through which the Care Quality Commission assesses the financial sustainability of those organisations providing adult social care that local authorities would find difficult to replace should they fail and become unable to carry on delivering a service because of their size, geographical coverage, or specialism. More generally, the term ‘market oversight’ is sometimes referred to as a way of obtaining a better understanding of how profit, consolidation and risk are affecting either the market or experiences in a particular sector.
In Wales there are statutory market oversight provisions,[footnote 53] but these have not yet been commenced. However, the Welsh Government intends to develop a non-statutory market oversight framework. Local authorities, working together with Local Health Boards through the 7 Regional Partnership Boards, are obliged to carry out market shaping and prepare and publish market stability reports.[footnote 54]
Currently, in Scotland, the CIS has no formal market oversight role or function in respect of care services (whatever the age group). Where data collection or inspection activity highlights an emerging concern in relation to provision, the CIS can highlight it in a national publication, but it is unable to do this in a systematic way. For example, in its annual statistical bulletin on fostering services it highlighted the continued challenge of finding suitable placements to avoid family groups being separated.
Glossary
| Term / Acronym | Definition |
|---|---|
| Care Order | A Care Order is an order made to protect a child from harm, abuse or neglect and often states that the local authority must look after the child and provide somewhere for the child to live. |
| Care Plan | A Care Plan is a plan which sets out what services and other help will be provided to the relevant child and their family. The Care Plan will state what the local authority and other agencies will do to meet the child’s needs including health, education, identity, family relationships and hobbies and sets out the plan for the child’s future. |
| The Care Inspectorate Scotland (CIS) | The Care Inspectorate Scotland is the independent regulator of social care and childcare in Scotland. |
| The Care Inspectorate Wales (CIW) | The Care Inspectorate Wales is the independent regulator of social care and childcare in Wales. |
| Child | A Child means a person under 18 in England and Wales and a person under 16 in Scotland. |
| Children’s home | A children’s home is an establishment which provides care and accommodation for looked-after children and is registered with and inspected by Ofsted in England, or the Care Inspectorates in Scotland or Wales. |
| Distant placement | A distant placement is a placement outside the area of the responsible local authority and not within the area of any adjoining local authority. |
| Emergency Protection Order (EPO) | The local authority can apply to the court for an Emergency Protection Order if there is an urgent need to protect a child or young person. The order typically gives the applicant the power to remove or detain the child. |
| Former relevant child (in England) | A former relevant child is a young person aged 18 or over who was either an eligible or a relevant child (defined in section 23C of the 1989 Act). The local authority has duties in relation to former relevant children until they reach the age of 21, or 25 in the case of former relevant children who are pursuing a programme of education or training. |
| Fostering agency | A fostering agency is a local authority or privately run organisation which recruits, trains and connects foster carers with looked-after children. |
| Fostering services | Fostering services means the services provided by a fostering agency. |
| ITC | Invitation to Comment – following the launch of the market study the CMA invited comments on the issues raised in the invitation to comment, including from interested parties such as care and accommodation suppliers, local authorities, looked-after and care-experienced children and their advocates, and other interested parties. |
| Independent fostering agency (or ‘IFA’) | An independent fostering agency is a privately run fostering agency. |
| Independent Children’s Home Association (ICHA) | The Independent Children’s Home Association represents independent providers of children’s homes and provide information and networking opportunities for companies working in the independent sector and running residential children’s homes. |
| Independent provision | Care or accommodation which is not provided by the local authorities (including both for-profit and not-for-profit providers). |
| Large provider. “PE” indicates private equity owned, “includes unregulated” means a provider of unregulated, as well as regulated, accommodation. | 1 of the 15 largest providers of children’s homes and/or fostering services that submitted evidence to the CMA, namely: Providers of children’s homes and fostering services; Caretech Holdings Plc (‘Caretech’ - includes unregulated), Care Visions Group Limited (‘Care Visions’), Compass Community Limited (‘Compass’ - PE), Homes2Inpsire Ltd (‘Homes2Inpsire’ - includes unregulated), Nutrius UK Topco Limited (‘Polaris’ – PE, includes unregulated), Priory Group UK 1 Limited (‘Priory Group’), The Outcomes First Group Limited (‘Outcomes First’ - PE). Providers of children’s homes only; Hexagon Care Services Limited (‘Hexagon’ - includes unregulated), Horizon Care and Education Group Ltd (‘Horizon’ - PE, includes unregulated), Keys Group Limited (‘Keys’ - PE, includes unregulated), Sandcastle Care Ltd (‘Sandcastle’ - PE), The Esland Group Holdings Ltd (‘Esland’ - PE), The Partnership of Care Today (‘Care Today’). Providers of fostering services only; Capstone Foster Care Limited (‘Capstone’), Orange Cloud Topco Ltd (‘Orange Cloud’). |
| Looked-after child (LAC) | A looked-after child is a child in the care of a local authority. |
| Local Government Association (LGA) | The Local Government Association is the national membership body for local authorities. Its core membership is made up of 339 English councils and the 22 Welsh councils through the Welsh Local Government Association. |
| Ofsted | Ofsted is responsible, under the Care Standards Act 2000, for (amongst other things) regulating establishments and agencies that provide children’s social care services in England. |
| Nationwide Association of Fostering Providers (NAFP) | The Nationalwide Association of Fostering Providers is trade association comprised of independent and voluntary sector fostering agencies, including large national organisations, medium sized providers and small local agencies. |
| Placement | A Placement refers to where a child is placed by a local authority and can include: (1) a placement with an individual who is a relative, friend or other person connected with the child, (2) a placement with a local foster carer parent or (3) placement in a children’s home or (4) placement in unregulated accommodation. |
| Private Equity (or PE) | Private equity is medium to long-term finance provided in return for an equity stake in potentially high-growth unquoted companies. |
| Private provider (or ‘for-profit provider’) | A Private provider means a for-profit organisation that is owned by the private sector. It includes PE-owned providers. |
| Residential accommodation | This covers children’s homes and unregulated accommodation, but excludes fostering services. |
| Smaller provider | Any provider of children’s homes and/or fostering services that is not 1 of the 15 largest providers listed in the definition above of Large provider |
| Residential setting | This covers children’s homes, secure and semi-independent living and residential schools. |
| Supported accommodation | Supported accommodation is a form of temporary accommodation with support (not care) for young people who are not ready to live independently. It is unregulated provision. |
| Voluntary sector (or ‘third sector’) | The part of an economy comprising non-governmental and non-profit-making organisations or associations, including charities, voluntary and community groups, cooperatives, etc. |
| Unregistered accommodation | Unregistered accommodation means accommodation where care is being provided without registration. This is illegal. |
| Unregulated accommodation | Unregulated accommodation is residential accommodation for children in England and Wales where care is not provided. |
Financial Glossary
| Term / Acronym | Definition |
|---|---|
| Large providers’ dataset | Refers to the 6 years of financial and operational data we obtained from the 15 large providers. |
| Group (provider) level dataset | Includes group financial data of those large providers that generated aggregate revenues in financial year 2020 of £958 million. |
| Home level dataset | Includes financial and operational data at the home level for the 889 homes operated by large providers. |
| Independent fostering agency (IFA) level data | Includes financial and operational data at the IFA level for the 94 IFAs operated by large providers. |
| LAs dataset | Refers to the 5-year financial and operational data we obtained from 40 local authorities. |
| Home level data | Includes financial and operational data at the home level for the 237 homes operated by the 40 local authorities we obtained date from. |
| Fostering agency-level data | Includes financial and operational data at the agency level for the 57 agencies operated by the 40 local authorities we obtained date from. |
-
We have used providers’ aggregated group level data, which includes Wales, Scotland, England and Northern Ireland. ↩
-
See the glossary for a list of the Large providers. ↩
-
We aggregated each Large provider’s data on the average number of children in children’s homes (excluding unregulated accommodation) and foster care separately for the financial year (FY) 2020 to calculate the numerators. We used Tables 2 and 3 of our interim report to calculate the denominators for the children’s home places and the number of children in foster care, respectively, for non-local authority provision. ↩
-
Includes children’s homes and unregulated accommodation. ↩
-
Occupancy, provider type, size, region and efficiency could drive variation in results. ↩
-
From 1 April 2016, the government introduced a new mandatory national living wage (NLW) for workers aged 25 and above. ↩
-
We recognise the challenges in comparing the operating costs of local authorities to those of private providers. Hence, we asked local authorities and private providers to submit operating costs with identical definitions to ensure completeness and accuracy of the data. ↩
-
Foster Care in England A Review for the Department for Education by Sir Martin Narey and Mark Owers in pages 60-62 also found that local authority costs were lower than those of IFAs. The report also noted the challenges in comparing costs. ↩
-
The risks and rewards associated with owning the asset are with the lessee. ↩
-
Replacement cost analysis involves estimating the market value of assets and applying a weighted average cost of capital. ↩
-
See Online platforms and digital advertising, Appendix D: profitability of Google and Facebook. ↩
-
This relates to the time value of money. The essence is that an amount of money (for example, £100) is worth more to an investor today than the same amount of money on any given date in the future. ↩
-
It is not just private sector investors that require a return. Even the public sector applies a discount rate of 3.5% in real terms with regards to its investment decisions. HM Treasury: The Green Book. ↩
-
CMA’s, Care homes market study Appendix D. ↩
-
CMA’s Private Healthcare Market Investigation, Final Report. ↩
-
Recent CMA decisions are at: Regulatory appeals and references: detailed information. ↩
-
Anglian Water Services Limited, Bristol Water plc, Northumbrian Water Limited and Yorkshire Water Services Limited price determinations, Final report, 17 March 2021. Page 11, paragraph 7. ↩
-
OECD data: Long-term interest rates and short-term interest rates. World Bank data on the UK’s real interest rates. ↩
-
For some providers we observed that the revenue reported during the year of property valuation did not represent a full year’s revenue. Where this was the case, to ensure the revenue figure used for our calculation equated to a full year’s revenue we used a future year’s full year revenue. ↩
-
For example, 1 of the valuation reports had the following disclaimer, “our valuation is undertaken on the special assumption that each of the subject units are being used as a dwelling (C3 use) and that the appropriate planning permissions are in place to allow this. Should permissions/building regulations not be in place our opinion of value may be subject to change. It is important that this is confirmed and should there be any changes our opinion of value may differ.” ↩
-
We observed that the CAPEX per child in a submission from 1 provider was considerably higher than the average in 2018. We excluded this figure from our calculations. ↩
-
Online platforms and digital advertising, Appendix D: profitability of Google and Facebook. ↩
-
Source: Refinitiv Eikon ↩
-
The property cost for a fostering agency relates to the renting of office space and should be insignificant relative to operating costs. ↩
-
From 1 April 2016, the government introduced a new mandatory national living wage (NLW) for workers aged 25 and above. ↩
-
We used data from 14 local authorities in Scotland, Wales and England that operated 66 children’s homes. ↩
-
We recognise the challenges in comparing the operating costs of local authorities to those of private providers. Hence, we asked local authorities and private providers to submit operating costs with identical definitions to ensure completeness and accuracy of the data. ↩
-
We used data from 14 local authorities in Scotland, Wales and England that operated 74 children’s homes. ↩
-
We used data from 28 local authorities in Scotland, Wales and England that operated 34 fostering agencies. ↩
-
We used data from 28 local authorities in Scotland, Wales and England that operated 34 fostering agencies. ↩
-
For example, The Balanced Economy Project’s response in its response to the Invitation to Comment noted that PE-owned providers had significant debt levels. ↩
-
Debt is booked as a liability on its balance sheet. ↩
-
The cash repayments relate to interest charges and capital repayments. The frequency and timing of these payments will depend on the type of debt instrument. ↩
-
An undertaking by the borrower (provider) to a specified lender not to create a class of creditor that ranks above that specified lender, with regards to priority for repayment. ↩
-
Long term debt is usually secured debt such as term loans, which are the most common form of debt for companies that do decide to borrow. ↩
-
In the case of a children home, security is likely to be its land and building. ↩
-
Financial Times. Is leverage still the best benchmark of credit risk? ↩
-
1 provider, which generated greater than 69% of revenue from residential accommodation, was excluded from our analysis as it failed to provide adequate debt figures. ↩
-
Some providers submitted P&L data for activities in scope (children’s homes, fostering and unregulated accommodation), but group balance sheets for activities outside the scope of the study. Therefore, we adjusted the balance sheet and cash flows apportioning revenue to ensure that the financial statements had a likefor- like comparison. ↩
-
We used a revenue to property value ratio of 0.52. ↩
-
Children Act 1989, section 22G. ↩
-
Sufficiency: Statutory guidance on securing sufficient accommodation for looked after children, paragraph 1.16. ↩
-
Specifically “any child who, residing or having been found within their area, appears to them to require such provision because - (a) no-one has parental responsibility for him; (b) he is lost or abandoned; or (c) the person who has been caring for him is prevented, whether or not permanently and for whatever reason, from providing him with suitable accommodation or care.” Children (Scotland) Act 1995, section 25(1). ↩
-
Children (Scotland) Act 1995, section 25(1). ↩
-
Children (Scotland) Act 1995, section 25(2). This is subject to section 25(1). ↩
-
The Children and Young People (Scotland) Act 2014, section 8. ↩
-
Children and Young People (Scotland) Act 2014: Statutory Guidance on Part 3: Children’s Services Planning – Second Edition 2020. ↩
-
Ibid., paragraph 28. ↩
-
Social Services and Well-being (Wales) Act 2014, section 75(1). ↩
-
At paragraph 123. ↩
-
Social Services and Well-being (Wales) Act 2014, section 14. Further details set out in chapter 2 of Social Services and Well-being (Wales) Act 2014, Part 2 code of Practice (General Functions). ↩
-
Social Services and Well-being (Wales) Act 2014, section 144B and The Partnership Arrangements (Amendment) and Regulated Services (Market Stability Reports) (Wales) Regulations 2021. Further detail is provided in the ‘Code of Practice and Guidance under the Social Services and Well-being (Wales) Act 2014: Code of Practice and guidance on the exercise of social services functions and partnership arrangements in relation to market stability reports’ 29 March 2021 (Code of Practice and Guidance under the Social Services and Well-being (Wales) Act 2014). ↩
-
Under the Regulation and Inspection of Social Care (Wales) Act 2016 (sections 59-63). These are a series of provisions aimed at identifying those providers of regulated services that provide a service which, if it were to fail, would have an impact on the care and support market in Wales and would be the trigger point for the local authority duties to be exercised under sections 189 to 191 of the Social Services and Well-being (Wales) Act 2014. ↩
-
Section 144B of the Social Services and Well-being (Wales) Act 2014 and The Partnership Arrangements (Amendment) and Regulated Services (Market Stability Reports) (Wales) Regulations 2021 set out the form these must take, matters to be included, and the prescribed period for carrying out market stability assessments. Statutory Guidance and a Code of Practice set out how local authorities must carry out their market stability functions. Matters which must be included in the market stability report are: the sufficiency and overall quality of provision of those services, current or developing trends, significant challenges, and the impact of commissioning and funding on local authority social services functions. ↩