Statistics on International Development: Provisional UK Aid Spend 2020
Published 8 April 2021

© Crown copyright 2021
This publication is licensed under the terms of the Open Government Licence v3.0 except where otherwise stated. To view this licence, visit nationalarchives.gov.uk/doc/open-government-licence/version/3 or write to the Information Policy Team, The National Archives, Kew, London TW9 4DU, or email: psi@nationalarchives.gov.uk.
Where we have identified any third party copyright information you will need to obtain permission from the copyright holders concerned.
This publication is available at https://www.gov.uk/government/statistics/statistics-on-international-development-provisional-uk-aid-spend-2020/statistics-on-international-development-provisional-uk-aid-spend-2020
About this release
What is ODA?
Official Development Assistance (ODA) is provided according to the standardised definitions and methodologies of the Organisation for Economic Cooperation and Development’s (OECD) Development Assistance Committee (DAC)[footnote 1]. ODA is defined as resource flows to developing countries and multilateral organisations, which are provided by official agencies (e.g. the UK Government) or their executive agencies, where each transaction meets the following requirements:
- it is administered with the promotion of the economic development and welfare of developing countries as its main objective
- it is concessional, including grants and soft loans[footnote 2]
Which countries are ODA eligible?
The list of countries eligible to receive ODA is set by the OECD Development Assistance Committee (DAC). Gross National Income (GNI) per capita below the World Bank high-income threshold defines the coverage and boundaries of the list. It includes all low, lower-middle and upper-middle income countries, except for those that are members of the G8 or the European Union (including countries with a firm accession date for EU membership). The DAC reviews the list every 3 years. Countries ‘graduate’ if they have surpassed the high- income GNI per capita threshold for the 3 consecutive years prior to a graduation year.
What is in this report?
This publication provides provisional statistics about the amount of Official Development Assistance (ODA) the UK provided in 2020. It also provides comparisons with 2019 spend. It includes:
- total UK ODA spend and total UK ODA spend as a proportion of GNI (the ODA:GNI ratio) - chapter 2
- total UK ODA spend delivered through bilateral and multilateral channels - chapter 3
- a breakdown of UK ODA spend by contributor - chapter 4
- FCDO region-specific bilateral ODA broken down by region - chapter 5
- FCDO non-region specific bilateral ODA broken down by Type of Aid - chapter 6
The spend figures presented in this publication are provisional and based on summary data with limited sector and geographical breakdowns.
A final estimate of UK ODA spend, the ODA:GNI ratio and more detailed breakdowns of spend will be published in autumn 2021 in ‘Statistics on International Development: Final UK Aid Spend 2020’ (Final SID)[footnote 3].
Notes to users
- on the 2nd September 2020, the Department for International Development (DFID) and Foreign and Commonwealth Office (FCO) merged to form a new department - the Foreign, Commonwealth and Development Office (FCDO). This report presents spend in 2020 by former DFID and former FCO as well as total 2020 spend by FCDO. From 2021, the first full year of the merged department, only the FCDO aggregated spend will be available
- in the report there are comparisons to 2019 FCDO figures. These are based on the sum total of former DFID and former FCO spend given that FCDO did not exist in 2019
- The Office for National Statistics (ONS) implemented a new methodology for calculating Gross Domestic Product (GDP) in its 2019 Blue Book (the UK National Accounts statistics), that in turn had an impact on GNI. The GNI used to calculate the ODA:GNI ratio for 2019 was based on the pre-2019 Blue Book methodology. As stated in Final SID 2019, GNI figures based on the new methodology (ONS headline measure for GNI) were used for managing and reporting 2020 ODA spend (please see the explanatory note for more detail). It’s worth noting, therefore, that the change in the ONS headline measure for UK GNI between 2019 and 2020 will not directly match the change in the 2019 and 2020 UK GNI figures reported in SID
- in July 2020, in response to an expected decrease in the size of the economy as a result of the COVID-19 pandemic, and therefore a decrease in the value of the 0.7% commitment for 2020, the Government announced a package of reductions in planned ODA spend[footnote 4]. The announcement noted there would continue to be adjustments made to ODA spend in 2020 to respond to further changes in the economy and therefore the value of the 0.7% commitment. It is important to note that the outturn figures shown in this report reflect how the 0.7% commitment was met in 2020 and are likely to differ from figures relating to the Government review process (see background note 7.2 for more information)
- some revisions to the 2019 UK ODA spend figures are published in this report to remove double counting of a small amount of administration costs shared between Government Departments. These revisions are minor, and the trends reported in Final 2020 SID, published in September 2020 are unaffected[footnote 5]. The effect of these revisions has reduced UK ODA spend in 2019 by £13 million. The revised figure for total 2019 UK ODA is £15,183 million; the ODA:GNI ratio is unaffected at 0.70%. For further information including the revision plan, please see the background note 7.6
What else is included as part of Statistics on International Development
All data tables included in this report are available to download in spreadsheet format. If you require any other data or information relating to this publication, or if you have any suggestions on how to improve the publication, please contact the statistics team at: statistics@fcdo.gov.uk
Further information on the technical terms, data sources, quality and processing of the statistics in this publication are found in Annexes 1-3 on the Statistics on International Development webpage
Key Points
- the provisional ODA:GNI ratio for 2020 was 0.70%
- in 2020, UK Official Development Assistance (ODA) spend was £14,471 million, a decrease of £712 million (4.7% decrease) on 2019
- in 2020, UK bilateral ODA spend was £9,492 million while UK multilateral ODA was £4,979 million. For more information and definitions see section 3
- The Foreign, Commonwealth and Development Office (FCDO) spent £10,662 million in 2020, compared with £11,786 million in 2019 (a decrease of £1,124 m). The FCDO’s share of total UK ODA stood at 73.7% in 2020, compared to an FCDO equivalent of 77.6% in 2019
- non-FCDO[footnote 6] spend on ODA in 2020 was £3,809 million, compared with £3,398 million in 2019 (an increase of £412 m). The non-FCDO share was 26.3%, up from 22.4% in 2019
- statistics on bilateral ODA by geographic region are currently only available for FCDO spend. Africa received the largest share (55.4%) of FCDO’s bilateral country or region-specific spending in 2020, representing £2,226 million.
The ODA:GNI Ratio
The ODA:GNI ratio presents UK Official Development Assistance (ODA) spend as a proportion of UK Gross National Income (GNI).
Key Definition - 0.70% commitment
The ODA:GNI target of 0.7% was first agreed internationally in 1970 by the United Nations General Assembly. The UK government made a commitment to invest 0.7% of GNI on ODA from 2013. In 2015 the International Development (Official Development Assistance Target) Act placed the commitment to spend 0.7% of GNI on ODA into UK law from 2015 and each subsequent calendar year.
Following economic and fiscal circumstances of the Coronavirus (COVID-19) pandemic, the UK government has taken the temporary decision to spend 0.5% of GNI on ODA in 2021.
Table 1 shows that in 2020:
- the ODA:GNI ratio was 0.70%. The commitment to spend 0.7% of GNI on ODA has been met
- UK ODA was £14,471 million, a decrease of £712 million (4.7%) on 2019. This change is driven by the decrease in GNI, and therefore the reduction in the value of the 0.7% commitment, due to the effect of the coronavirus (COVID-19) pandemic on the size of the UK economy. The GNI used to calculate the UK ODA:GNI ratio fell from £2,158 billion in 2019[footnote 7] to £2,074 billion in 2020
[Table 1: UK GNI[footnote 8] Estimates, total UK ODA and ODA:GNI ratios; current prices (£ millions) 2019 to 2020](https://assets.publishing.service.gov.uk/government/uploads/system/uploads/attachment_data/file/976869/p-sid-2020-Table1.ods)
Long-term trends in UK ODA
Figure 1 shows the trend in UK ODA since 1970. Overall there has been a steady increase in the level of UK ODA since 1970, with a peak in 2005 and 2006 which was driven by high levels of debt relief, and a steep increase in 2013 when the UK Government first met the 0.7% ODA:GNI target. As the UK commitment to spend 0.7% on ODA is based on the UK GNI (a key economic measure), when GNI increases/decreases, in turn the UK ODA spend will also increase/decrease.
Between 2013 and 2019, UK ODA continued to increase in line with growth in the UK’s GNI. The relatively larger increase in the level of ODA in 2016 (by £1.2bn) reflects the switch to the European System of Accounts (ESA) 2010 methodology for measuring GNI and the consequent increase in UK ODA to meet the 0.7% ODA commitment on that basis.
The decrease in 2020 ODA spend reflects the decrease in the size of the economy in 2020 as a result of the Coronavirus (COVID-19) pandemic. Figure 1 shows the levels of ODA in 2020 are broadly similar to the amount of ODA spend in 2018.
Figure 1: UK ODA levels (£ billions) and ODA:GNI ratios (%), 1970 to 2020
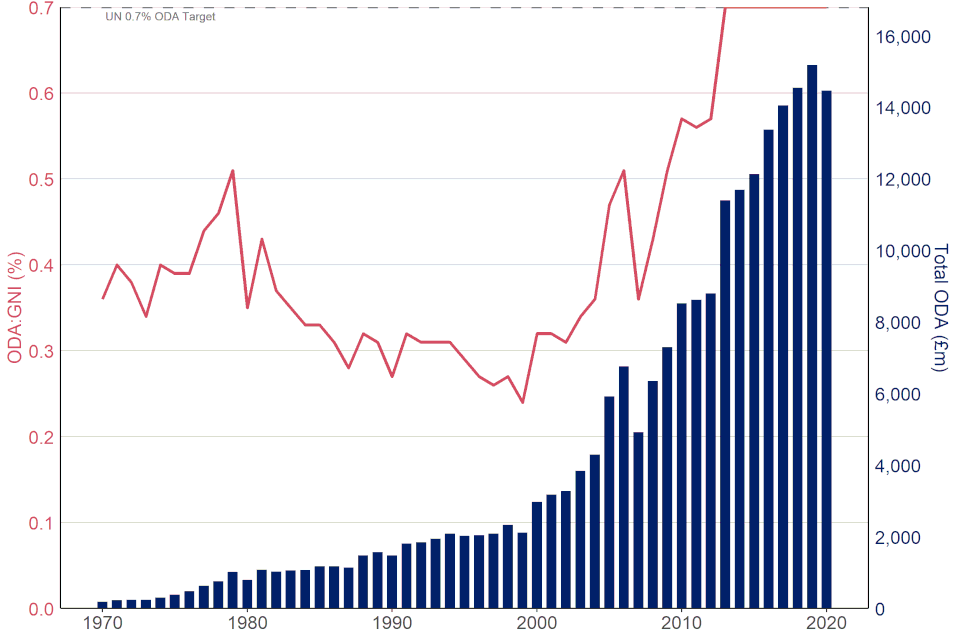
Figure 1 legend: The blue bars are the UK ODA spend from 1970 to 2020, (note the 2020 ODA figure is provisional), the pink line is the calculated ODA:GNI ratio from 1970 to 2020 and the grey dashed line is the 0.7% ODA:GNI target set by the United Nations General Assembly in 1970. From 2018 onwards, ODA has changed from being measured on a cash basis to being measured on a grant equivalent basis, following a decision taken by the DAC in 2014[footnote 9].
UK Bilateral and Multilateral ODA
There are 2 main channels of delivery for ODA: bilateral and multilateral.
- bilateral ODA is earmarked spend. This means that the donor has specified where and what the ODA is spent on – this is usually ODA going to specific countries, regions or programmes. For example, delivering family planning services across Malawi through a Non-Government Organisation. Bilateral ODA also includes earmarked spend through multilaterals.
- core multilateral ODA is un-earmarked core funding from national governments to multilateral organisations, which is pooled with other donors’ funding and disbursed as part of the core budget of the multilateral organisation. For example, the UK’s un-earmarked contribution to the World Bank International Development Association. Core contributions will fluctuate from year to year in part due to the payment schedules of the receiving multilateral organisation
Table 2 shows that in 2020:
- £9,492 million of UK ODA spend was delivered through bilateral channels. This was a 7.3% decrease (£752 m) compared to 2019. Bilateral ODA accounted for 65.6% of total UK ODA
- £4,979 million of UK ODA was delivered through core contributions to multilaterals. This was a 0.8% increase (£40 m) compared to 2019
- core contributions to multilaterals represented 34.4% of total UK ODA, compared to 32.5% in 2019. Despite this slight increase in share, the proportion of UK ODA delivered through core multilateral ODA is still below the share seen each year between 2010 to 2018 (above 36%)
- £1,272 million of bilateral ODA spend was used to provide humanitarian assistance (8.8% of total UK ODA). This represents a decrease of £264 million compared with 2019. Over the last five years[footnote 10], the levels of humanitarian assistance has fluctuated year on year with a peak in spend in 2019. The UK’s bilateral humanitarian assistance in 2020 is broadly similar to 2018 (£1,299 m).
- in 2020, approximately £1.39 billion[footnote 11] of UK bilateral ODA was spent on activities to address the COVID-19 pandemic. For example, activities to enhance a developing country’s ability to prevent the spread of the pandemic[footnote 12]. The final SID will include a case-study on the use of ODA as part of the UK’s COVID-19 response
More detailed breakdowns of UK ODA in 2020 will be published in the Final SID (Autumn 2021).
Table 2: UK Official Development Assistance 2019 to 2020
Breakdown of UK ODA by contributor
Table 3 shows ODA spend broken down by UK government department and other official sector contributors of UK ODA in 2020. It also shows changes in spend from 2019. The analysis presented in the table is based on summary provisional returns from government departments and other sources. More detailed spending data will be published in ‘Statistics on International Development: Final UK Aid Spend 2020’ this autumn.
The overall amount of ODA spend is determined by the size of GNI, however shifts in the percentage shares of departments and other ODA contributors depend on their spending in the given year. See section 1.4 for more information on the UK’s Government’s review of ODA in response to the expected decrease in the size of the economy as a result of the COVID-19 pandemic, and therefore a decrease in the value of the 0.7% commitment for 2020.
Contributors of UK ODA in 2020:
- FCDO spent £10,662 million of ODA (73.7% of total UK ODA) in 2020 (of which former-DFID: £10,047m, former-FCO: £614 m). This was a decrease of £1,124 million (or 9.5%) compared with the total ODA spend by former DFID and former FCO in 2019
- ODA spend by all contributors other than FCDO (known as non-FCDO) totalled £3,809 million in 2020, an increase of 12.1% (or £412 m) on 2019. Of this:
- spend by government departments other than FCDO (known as Other Government Departments), totalled £2,773 million in 2020, an increase of 2.5% (or £67 m) on 2019
- spend by Other Contributors of UK ODA totalled £1,037 million in 2020, an increase of 49.8% (or £345 m) compared to 2019
-
the largest year on year changes amongst non-FCDO contributors were:
- the UK’s contribution to the IMF Poverty Reduction and Growth Trust (IMF-PRGT), which totalled £255 million of ODA in 2020. There was no UK contribution to IMF-PRGT in 2019
- Home Office, which spent £597 million of ODA in 2020, an increase of £151 million, or 33.9%, on 2019. This was due to increased accommodation costs for asylum seekers to support additional measures put in place as a result of the COVID-19 pandemic
- Conflict, Stability and Security Fund (CSSF), which spent £535 million of ODA in 2020, this was a decrease of £118 million, or 18.1%, on 2019
- EU Attribution (Non-DFID)[footnote 13], which totalled £581 million of ODA in 2020, an increase of £100 million, or 20.8%, on 2019. This was due to spending by the EU in response to the COVID-19 pandemic
Table 3: UK ODA Contributors 2019-2020; ordered by 2020 ODA spend
Contributors’ share of UK ODA
- with former DFID and former FCO having merged, the FCDO is responsible for the majority of the UK ODA budget. In 2020 the FCDO accounted for 73.7% of UK ODA, compared to 77.6% in 2019 (combined shares of former DFID and former FCO)
- the share of total ODA spend by contributors other than FCDO increased from 22.4% in 2019, to 26.3% in 2020
- of the non-FCDO contributors, Other Government Departments’ (OGD) ODA accounted for 19.2% of total UK ODA, compared to 17.8% in 2019. The departments with the largest shares of ODA were: the Department for Business, Energy & Industrial Strategy (BEIS) (7.0% of ODA); the Home Office (4.1%); the Conflict, Stability and Security Fund (3.7%); and the Department of Health and Social Care (1.7%)
- the largest Other Contributors of UK ODA were EU attribution (non-DFID) (4.0% of UK ODA); IMF-PRGT (1.8% of UK ODA) and Gift Aid claimed by charities and used for ODA eligible activities (1.1% of UK ODA)
Figure 2: Proportion of UK ODA accounted for by FCDO (of which former-DFID, former-FCO), Other Government Departments and Other contributors of ODA: 2016 to 2020
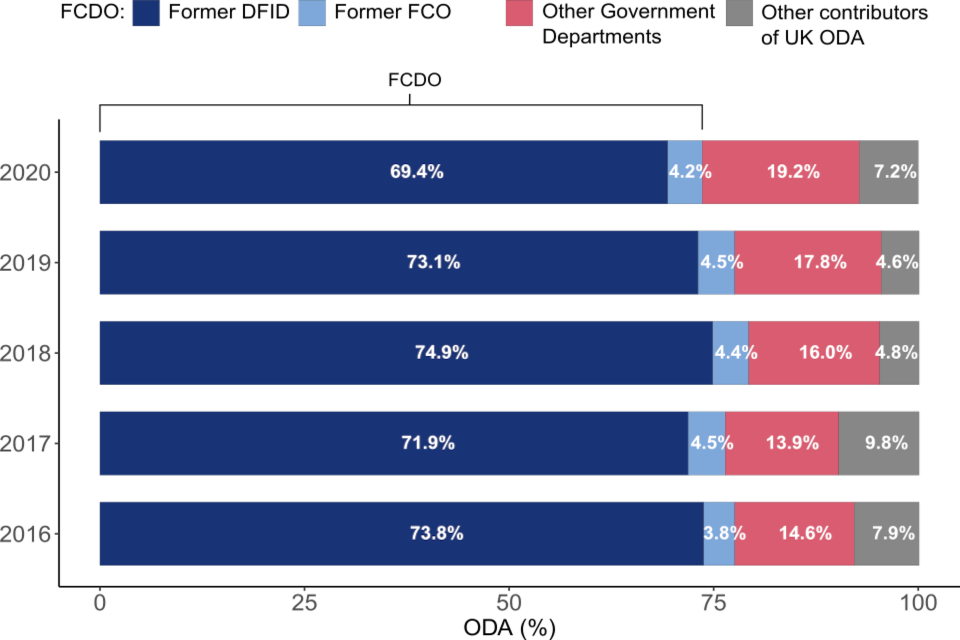
Figure 2 legend: Total UK ODA by UK department. The bars for each year represent 100% of total UK ODA spend. The combination of the dark (former DFID) and light (former FCO) blue sections represents the proportion of total UK ODA delivered through the Foreign, Commonwealth and Development Office. In pink is the proportion of UK ODA delivered through Other Government Departments. In grey is the proportion of total UK ODA that was delivered through Other Contributors of UK ODA. Note, percentages may not sum to 100 due to rounding.
FCDO Region-Specific Bilateral ODA
Figure 3 presents the breakdown of FCDO’s region-specific bilateral ODA spend. These figures represent only part of the picture on UK bilateral ODA spend by region because similar data from all other contributors of UK ODA is not available for this provisional release. Also, bilateral spend that benefits multiple countries and/or regions is not included (see section 6).
- in 2020, FCDO region-specific bilateral ODA was £4,019 million, a decrease of £897 million compared with the total region-specific bilateral ODA spend by former DFID and former FCO in 2019. The proportion of FCDO’s total bilateral ODA this represented decreased from 63.8% in 2019 to 58.1% in 2020
- in 2020, Africa received £2,226 million of FCDO bilateral ODA, a decrease of £425 million compared to 2019, Despite this decrease, Africa remained the largest recipient of FCDO region-specific bilateral ODA in 2020, representing 55.4% of the total, up from 53.9% in 2019
- in 2020, Asia received £1,562 million of bilateral ODA from FCDO – a decrease of £475 million compared to 2019, representing 38.9% of the total, down from 41.4% in 2019
- from 2019 to 2020 the amount of bilateral ODA distributed by the FCDO to both the Americas and Europe remained largely unchanged. The Pacific received £22 million of FCDO bilateral ODA in 2020, an increase of £12 million compared to 2019
Figure 3: FCDO Region-Specific Bilateral ODA: 2019[footnote 14] to 2020
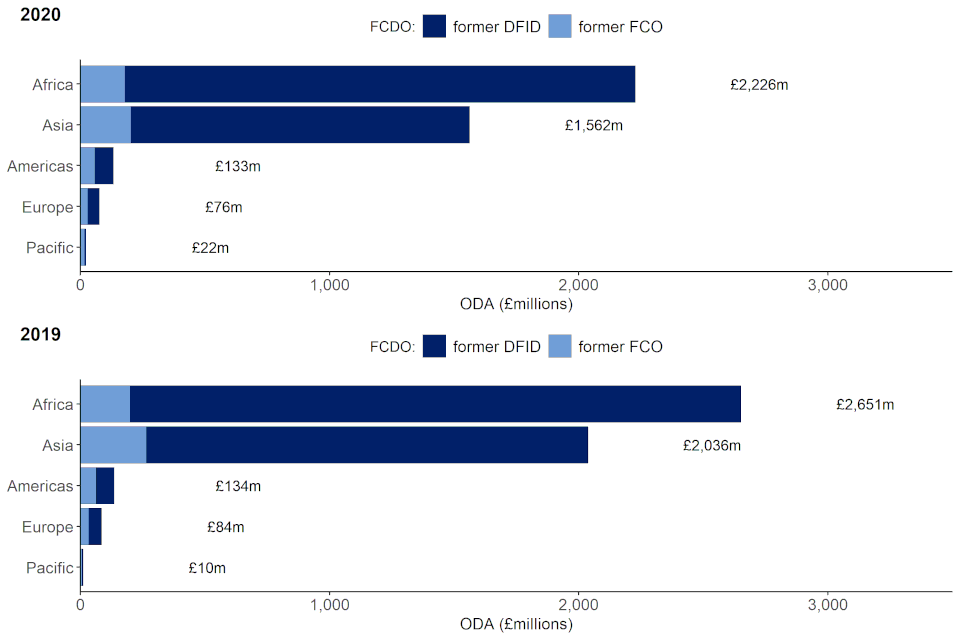
Figure 3 legend: FCDO (of which: former DFID, dark blue; former FCO, light blue) bilateral ODA by receiving region (£ millions), 2019 and 2020.
Region-specific bilateral ODA will be presented in the ‘Statistics on International Development: Final UK Aid Spend 2020’ publication.
FCDO Non-Region-Specific Bilateral ODA
Non-region-specific bilateral ODA consists of spend on projects which are not assigned to any single recipient country or region. For example, centrally funded research or programmes which benefit several developing countries and cannot be meaningfully recorded to a single benefitting country or region.
Bilateral ODA spend by FCDO on projects not assigned to any single recipient country or region amounted to £2,901 million in 2020, an increase of £112 million compared to 2019. This accounted for 41.9 programme spending in 2020 benefitting multiple countries or regions rather than being country or region specific.
Figure 4 provides a breakdown of FCDO’s non-region bilateral ODA for 2020.
Figure 4: Breakdown of FCDO’s non-region-specific bilateral ODA in 2020
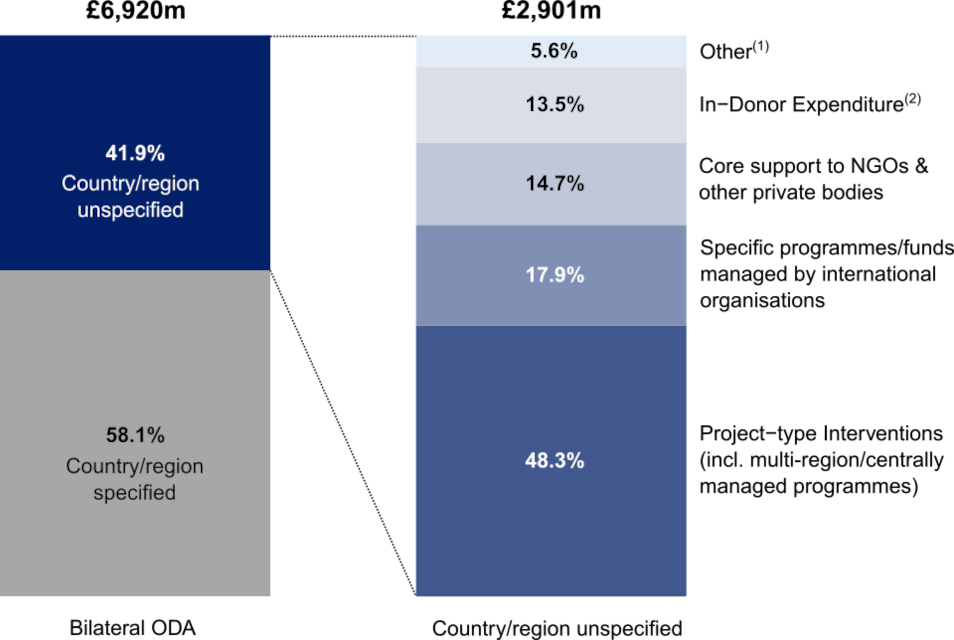
Figure 4 legend: Breakdown of FCDO non-region-specific bilateral ODA by type of aid (£ millions), 2019 and 2020. 1. “Other” includes Basket funds/pooled funding and Other technical assistance. 2. “In-donor expenditure” relates to ODA-eligible activities conducted within countries that donate aid, including the United Kingdom. ODA spend in the UK to support development work overseas or refugees within the UK are both examples of in-donor expenditure.
Background Notes
Definitions and Sources
Information on the main definitions and sources used in this publication can be found in Annexes 2 and 3, respectively, of the Statistics on International Development publication.
UK ODA spend figures for this publication are derived from:
- former DFID’s ‘ARIES’ database of financial transactions relating to payments and receipts, which is quality assured centrally to ensure that data is complete, coding is correct and spend is in line with OECD definitions of ODA. Former FCO’s data is collected in a similar manner from financial transactions data and quality assured by a dedicated team. These 2 administrative source comprises 73.7% of total UK ODA in 2020
- non-FCDO sources are largely derived from financial transaction data. ODA contributors also assess whether the spend is in line with the OECD definitions of ODA. A small proportion of non-DFID spend is estimated, for example Gift Aid on ODA eligible activity. These non-FCDO sources account for around 26.3% in 2020
Scope
This publication presents information on the UK’s Official Development Assistance (ODA) spend in calendar year 2020. Comparisons are made to calendar year 2019. It includes data from UK government departments as well as the Devolved Administrations of the UK and other contributors to UK ODA such as EU Attribution and Gift Aid. Data relating to both Bilateral and Multilateral ODA are included in the scope of this publication.
This publication does not include information on:
- private spending or donations made in support of developing countries, for example by the public, the voluntary sector or through remittances, are not part of the ODA definition and not covered in this publication
- financial Year ODA budget allocations, which are set by HM Treasury. Users are advised to use caution when making comparisons between the calendar year figures reported in SID with financial year ODA budget allocations
ODA spending and reporting
FCDO and HM Treasury monitor spend by UK departments and funds, and movements in GNI during the year. The UK ODA commitment is reported in the calendar year following the spend, using confirmed ODA outturn spend, and GNI estimates published by the Office for National Statistics.
While FCDO manages its own spending on ODA, FCDO has no control over GNI nor the spending by other government departments and other sources of ODA. After final decisions on UK ODA spending are made the GNI estimate can still shift, due to later economic data for the year becoming available. So can the amount of ODA spent by other government departments and ODA contributions from non-departmental sources.
Between the spring and the autumn, the previous year’s ODA spending of FCDO and other government departments are finalised. Government departments other than FCDO will provide project-level details that allow the ODA spend to be quality assured by FCDO. The ONS will release further updates of GNI throughout the year. The final ODA data and the most up-to-date available GNI estimate are then used to calculate the final ODA:GNI ratio in the autumn publication.
FCDO is responsible for collating data and reporting spend on ODA to the Organisation of Economic Development and Co-operation (OECD), including the ODA:GNI ratio.
EU attribution
The provisional estimate for the UK’s share of the EU ODA budget in 2020 was £1,130 million compared to £983 million in 2019. EU attribution fluctuates from year to year because the EU works on a 7 year programming cycle and so EU disbursements in a given year can vary. Other reasons for fluctuations between years include the change in UK’s share of the EU budget in comparison to other member states and exchange rate variations. In addition to the normal fluctuations, the increase in 2020 was driven by COVID response activities. The estimate in 2019 and 2020 is based on published data from the European Commission on the UK’s share of development expenditure.
To avoid double counting, Table 3 reports £27.5 million of the EU attribution figure for the UK’s contribution to EU peacekeeping under the CSSF, as the fund responsible for this spending. This does not affect the overall EU attribution figure.
Under the Withdrawal Agreement, the UK committed to meet outstanding commitments from the 2014-2020 EU budget beyond 1 January 2021 including for external action, development and humanitarian aid. This means a declining tail of ODA contributions until 2027 and which is part of the wider financial settlement in the Withdrawal Agreement.
From 2022 reporting (on 2021 ODA), the full UK attribution of the EU ODA budget will be reported under FCDO. This is in line with UK ODA allocations.
Grant Equivalent Measure
From 2018 onwards, Official Development Assistance (ODA) has changed from being measured on a cash basis to a grant equivalent basis, following a decision taken by the DAC in 2014. This change in measure effects official loans to sovereign states and development multilaterals. See our technical note for more information.
The headline grant equivalent measure of UK ODA for 2020 was £14,471 million, compared to £15,005 million on the cash basis measurement (a difference of 3.6%).
The majority of the difference is due to the UK’s multilateral loan disbursement to the IMF-Poverty Reduction and Growth Trust (IMF-PRGT). In 2020 IMF-PRGT used £255 million ODA under the grant equivalent, (headline ODA measure for 2020) compared with £822 million ODA under the cash flow measure. The remaining difference is due to official loan reflows not being included under the grant equivalent measure.
Revisions and Changes to the Publication
The revisions process is set out in FCDO’s Revisions Policy.
There have been 2 revisions made to UK ODA 2019 figures in this publication. The revision to 2019 has currently only been applied to the aggregate figures provided in the provisional SID report. In April and May 2021, the ODA statisticians will work with departments to revise the Final SID 2019 data tables and the “data underlying the SID” dataset.
The first revision is to account for double counting of a small amount of overseas platform costs[footnote 15] between government departments.
Former FCO implemented a new methodology for capturing ODA eligible administrative costs in 2017. The methodology document published at the time, specified that the UK Government platform would be captured as ODA by FCO and DFID. However, the statistics team recently discovered that small amounts of these costs have also been included in government departments’ ODA figures.
These revisions are minor, and the trends reported in September 2020 are unaffected. The effect of these revisions has reduced UK ODA by £13 million. The revised figure for total UK ODA is £15,183 million; the ODA:GNI ratio continues to be 0.70%.
The ODA statisticians will work together with the affected government departments to assess if it is possible to revise these figures back to 2017. We will communicate our revision schedule to users at the earliest opportunity. It is likely that the magnitude of the double counting in 2017 and 2018 will be similar to the amount in 2019: £13m per year.#
There has also been a minor revision (+£0.5m) to former-FCO bilateral ODA total for Asia. This is due to a data coding error which has led to the recipient country of one programme (GB-China Centre) changing from “Developing country, unspecified” to “China”. This means the revised UK bilateral ODA to China figure for 2019 is £68,380 thousand. UK ODA to China to the nearest million remains at £68 million for 2019.
Future developments
An important part of National Statistics production is investigating whether a product continues to meet user needs. The ODA statistics team will review the SID to identify areas to develop further, as well as testing how best to present and communicate ODA trends. We are keen to hear from SID users to help us plan future developments and meet users’ analytical needs as far as possible. We would also be grateful to hear users’ views on a handful of our proposed ideas for improvements. You can provide feedback either by completing our short user feedback survey. Alternatively, you can contact us by email to statistics@fcdo.gov.uk
Our short user feedback survey will be open until 10 May 2021. We will analyse the results and use the findings to build a development plan for SID. This plan will be published on gov.uk.
FCDO is defined as a multi-purpose agency by the OECD, as it carries out both ODA and non-ODA activities. FCDO statisticians are working to develop a suitable methodology that captures the ODA eligible proportion of FCDO administration costs. It will be implemented from 2022 ODA when reporting ODA 2021 spend. We will communicate the methodology via an explanatory note at the earliest opportunity.
Timing and Releases
FCDO releases 2 editions of Statistics on International Development each year:
- Provisional UK Aid spend will be published in the spring and includes a preliminary estimate of the UK’s ODA:GNI ratio for the previous calendar year. This is usually early April each year
- Final UK Aid spend is usually published in the autumn. This publication confirms the UK’s ODA:GNI ratio for the previous year, as well as including more detailed analysis of the UK’s Bilateral and Multilateral ODA, and includes the microdata used to produce the publication. The latest edition of this publication can be found on GOV.UK.
Provisional 2020 ODA statistics for all members of the OECD will be published by the OECD Development Assistance Committee (DAC) in April 2021. Final data is normally published by the OECD in December.
Quality
The DAC sets the definitions and classifications for reporting on ODA internationally. These are laid out in the DAC Statistical Reporting Directives. The statistics shown here are reported in line with these directives and are subject to the quality assurance process as described in Annex 3 of Statistics on International Development.
The data in the publication is largely based on administrative data and so it is not subject to sampling error. However, these provisional statistics may change between now and the final release in Autumn 2021 as the data is further audited and assured as part of the closing of accounts and statistical quality assurance processes.
Temporary sustenance for asylum seekers is ODA eligible for their first 12 months of stay, this includes basic health and education services. DHSC ODA includes support to asylum seekers for the provision of ODA eligible basic health services. For this publication the estimates have been produced with a 2019 unit cost healthcare (per capita cost). The FCDO ODA statistics team and DHSC will work together, before the Final SID, to review the impact the coronavirus pandemic may have had on the unit cost.
The figure presented for the Welsh Government represents their estimated spend for the financial year 2020/21 and is used as a proxy for their calendar year 2020 spend.
ODA spend in response to the Coronavirus (COVID-19) Pandemic
The activities captured in the COVID-19 ODA spend figure have the objective of supporting the control of the COVID-19 pandemic or responding to its socio-economic impacts. The OECD DAC has requested aggregated total COVID-19 ODA spend from all donors. This will be published in their preliminary statistics in mid-April.
The sources of this ODA spend data are as follows:
- former DFID: COVID-19 spend data was captured on the Aid Management Platform, which is the same source[footnote 16] of former DFID spend data on sectors and benefitting country. ODA activities can be tagged either as a COVID-19 activity or as not applicable. Some new ODA activities were designed specifically to address COVID-19 (COVID-19 specific), while some existing programmes were adapted or flexed to respond to the crisis (COVID-19 adapted)
- former FCO: COVID-19 activities were carried out through the International Programme’s enabling fund, which provides small amounts of discretionary funding to posts /directorates for small-scale activities. The Fund is designed to be agile, to allow posts to respond quickly to developing events[footnote 17]
- non FCDO: ODA contributors provided the amount of ODA focused on addressing the COVID-19 pandemic via the usual provisional data return
Former DFID accounted for 97% of UK bilateral ODA on activities to address the COVID-19 pandemic.
The majority of former DFID’s COVID-19 data (60%) is based on COVID-19 specific activities. This information is of high quality and we are confident that all the activities focus on addressing the pandemic. The remaining COVID-19 spend is defined as adapted spend. Each activity that has been identified as “COVID-19 adapted”, also has an estimate of the proportion of the activities budget that was focused on addressing COVID-19 for financial year 2020-21. These proportions have been applied to ODA activities identified as “COVID-19 adapted” spend from April to December 2020.
For this provisional publication, we have excluded ODA activities which result in a COVID-19 adapted programme spend under £1 million. We will continue to quality assure former DFID’s COVID-19 adapted data over the summer and will present a detailed case study in the Final SID published Autumn 2021.
The £1.39 billion does not include the UK’s core contributions to multilaterals, a proportion of which will have been channelled to address the COVID-19 pandemic. We will investigate options to estimate how much of the UK’s core contributions to multilaterals would have been used in this way. UK Imputed Multilateral Shares for 2020 will be published early 2022.
Related Statistics and Publications
The OECD statistics provide ODA breakdowns for DAC donors (including multilaterals). This source is useful when carrying out international comparisons.
The Development Tracker can be used to explore details of the individual development projects that the UK is funding. This allows you to filter projects by country and sector and view further details about the project as published in documents such as the business case and annual review. The tracker uses open data on development projects, compliant with the International Aid Transparency Initiative standard, to show where funding by the UK Government and its partners is going and ‘trace’ it through the delivery chain.
Uses and users
The main purpose of these statistics is to provide timely summary statistics on ODA expenditure by the UK. They are published prior to the release of provisional ODA statistics by the OECD DAC for all OECD members.
Based on user feedback, these statistics are used for a variety of purposes: preparing material for briefs; PQs and public correspondence; inclusion in reports and reviews and providing data for research and monitoring. Our users represent the government, civil society and non-government organisations, students, academia and the media.
As mentioned in section 7.7, we are running a short feedback survey to gather users views. This provides us with the opportunity to understand further how our readers are using the SID products and data. You can provide feedback either by completing our short user feedback. Alternatively you can contact us by email to statistics@fcdo.gov.uk.
National Statistics
The Office for Statistics Regulation (part of the United Kingdom Statistics Authority) designated these statistics as National Statistics in March 2016, in accordance with the Statistics and Registration Service Act 2007 and signifying compliance with the Code of Practice for Statistics. Designation means the statistics carry the National Statistics label and conform to the standards summarised below.
Office for Statistics Regulation published their finding from the compliance check of SID which confirmed that it is designated a National Statistics.
The Foreign, Commonwealth and Development Office is now responsible for producing the Statistics on International Development statistical series, the designation of National Statistics carries through to the new Department.
For information on the work of the UK Statistics Authority visit: http://www.statisticsauthority.gov.uk
Contact
For enquiries (non-media) about the information contained in this publication, or for more detailed information, please contact:
Alice Marshall
Telephone: 01355 84 36 51
E-mail: statistics@fcdo.gov.uk
For media enquiries please contact the FCDO Press Office on +44 (0)20 7008 3100.
For further information on development issues and FCDO policies, please contact the Public Enquiry Point on 020 7008 5000.
-
The full OECD DAC ODA directives, including the full ODA definition can be found on their website ↩
-
A glossary, explaining key terms used throughout this report, is available in Annex 1 ↩
-
Once released the publication will be available on the ’Statistics at FCDO webpage ↩
-
See the Government statement ↩
-
Revisions will be marked with an R in the SID accompanying tables ↩
-
This includes spend by other UK government departments and spend by other contributors such as the Scottish Government and Gift Aid claimed by charities working on ODA eligible activities ↩
-
For ODA reporting 2019, the Gross National Income (GNI) used was measured on a pre-Blue Book 2019 level. For more detail, please see “Note to users” section 1.4 ↩
-
Explanatory Note: Statistics on International Development – use of new Gross Domestic Product Framework ↩
-
For information on the different between the Grant Equivalent measure and the historical cash measurement please see background note 7.5 ↩
-
See table A7 from Statistics on International Development: Final UK Aid Spend 2019 for the full time series. ↩
-
Please see the background note section 7.9 for information on ODA COVID-19 data collection, quality and calculation. Please note this figure is provisional and is open to revision between the provisional and final SID. ↩
-
Activities captured have the objective of supporting the control of the COVID-19 pandemic and the response to its social-economic impacts. For more information and examples of the UK’s ODA response to COVID-19, see press releases from Feb 2020, Mar 2020 and Apr 2020 ↩
-
CSSF includes a contribution of £27.5 million for peacekeeping activities carried out by the EU, as it is the fund responsible for the spend. This is not counted in EU Attribution (non-DFID). From 2021, the full UK Attribution of the development share of the EU budget will be reported under FCDO. This is in line with ODA allocations. ↩
-
There has been a minor revision (+£0.5m) to former-FCO bilateral ODA total for Asia. This is from data coding error which has led to the recipient country of one programme changing from “Developing country, unspecified” to “China. For more information please see background note 7.6 ↩
-
Overseas platform are costs that the FCDO incur to provide office and residential properties overseas to Government partners (for example rents, utilities and maintenance). The government partners reimburse the FCDO for those costs ↩
-
See the SID accompanying annexes for more information on FCDO’s assessment of assurance of the administrative data ↩