Fertiliser usage on farm, England 20/21 - statistics notice (published 26 May 2022)
Updated 30 March 2023
Applies to England

© Crown copyright 2023
This publication is licensed under the terms of the Open Government Licence v3.0 except where otherwise stated. To view this licence, visit nationalarchives.gov.uk/doc/open-government-licence/version/3 or write to the Information Policy Team, The National Archives, Kew, London TW9 4DU, or email: psi@nationalarchives.gov.uk.
Where we have identified any third party copyright information you will need to obtain permission from the copyright holders concerned.
This publication is available at https://www.gov.uk/government/statistics/historic-fertiliser-usage-on-farm-england/fertiliser-usage-on-farm-england-2021-statistics-notice-published-26-may-2022
The Farm Business Survey (FBS) fertiliser data is currently being reviewed to assess whether the data should sit under the British Survey of Fertiliser Practice in the future, or whether there are specific questions that should continue to be collected within the FBS. If you use FBS fertiliser data or this publication we would like to hear from you at fbs.queries@defra.gov.uk
Fertiliser usage on farms: Results from the Farm Business Survey, England 2020/21
This release presents estimates of fertiliser application rates at farm level in England, the use of precision farming techniques, soil nutrient software, clover or other legumes in grass swards, green manures, and sources of nutrient planning advice.
Results here are presented for the farm as a whole and can be compared to the financial data published in other Farm Business Survey (FBS) releases. The British Survey of Fertiliser Practice (BSFP) remains the primary source of data on fertiliser use in Great Britain, collecting data at the field/crop level and providing detailed breakdowns of the crops that fertilisers are applied too. See survey details for further information on the differences between the BSFP and the fertiliser data collected by FBS. Comparisons between the two surveys are made throughout this publication.
These results cover the period of March 2020 - February 2021. The full breakdown of results, including machine readable data sets, can be found on the landing page.
1. Key results
Fertiliser Practices
- 27% of farm businesses carried out precision farming techniques to guide fertiliser application. Usage was more likely on cereal and general cropping farms and on farms with at least some of their land within a Nitrate Vulnerable Zone.
- 30% of farms used soil nutrient software packages to help determine fertiliser applications. Usage was most common on cereal and general cropping farms and on farms with at least some of their land within a Nitrate Vulnerable Zone.
- Approximately half of farms with grass included clover or legumes in their grass swards. This practice was most common on mixed and dairy farms, and on farms in the South West.
- 18% of farms businesses used green manures in their arable rotations. Usage was most common on cereal, general cropping and mixed farms.
- For those farms using either clover or legumes, or green manures, 74% made adjustments to their fertiliser application rates. This practice was most common on general cropping and dairy farms.
- 45% of farm businesses relied on their own non-FACTS(a) qualified advice for nutrient planning, 29% relied on independently supplied FACTS advice, and 21% received advice from their FACTS-qualified fertiliser supplier.
(a) FACTS = Fertiliser Advisers Certification and Training Scheme.
Fertiliser Application Rates
Table 1.1 Overall fertiliser application rates per hectare of farmed area (kg/ha) recorded by the Farm Business Survey, England 2020/21
| Nutrient Type | Nitrogen | Phosphate | Potash |
|---|---|---|---|
| Inorganic | 109 | 21 | 24 |
| Organic | 9 | 11 | 28 |
- There has been little change in overall application rates per hectare of farmed area recorded by the Farm Business Survey since 2012/13.
- Overall, cereal, general cropping and horticulture farms had the highest application rates of inorganic fertilisers, whilst grazing livestock generally had the lowest.
- Compared to other farm types, dairy and pig & poultry farms had by far the highest application rates for all organic nutrient types.
2 General Questions
This section details the results of the six questions on fertiliser practices included in the Farm Business Survey.
Farmers were asked:
- If they carry out precision farming techniques.
- If they use soil nutrient software packages to help determine fertiliser applications.
- If they include clover or legumes in grass swards.
- If they use green manures in their arable rotation.
- If they include clover or legumes in grass sward or use green manures, do they make any adjustment to fertiliser application rates.
- Where they source their nutrient planning advice.
Generalised linear regression modelling was used to determine which key factors were related to a positive response for each question. For further detail see section 5.4.
2.1 Precision farming techniques
Precision farming techniques can make processes such as fertiliser application more efficient. Growers must balance the cost of inputs with a demand for higher yields and the pressure of increased environmental awareness and compliance. Precision technology can help to improve the efficiency of farm operations, including cultivation and better targeted fertiliser and agrochemical applications. This can reduce input use (and cost) and improve soil structure.
View and download the data for this chapter(323kb)
In 2020/21, 27% of farms used these techniques (Table 2.1), increasing from 24% from the previous year. The use of these techniques was dependant on farm type, farm size, region and having land in a Nitrate Vulnerable Zone (NVZ).
Table 2.1: Percentage of farm businesses using precision farming techniques, England 2019/20 to 2020/21
| 2019/20 | 2020/21 | 95% Confidence interval 2020/21 (+/-) | |
|---|---|---|---|
| Precision farming techniques used | 24 | 27 | 3 |
| No precision farming techniques used | 72 | 69 | 3 |
| Not applicable (a) | 4 | 4 | 1 |
(a) This includes farms who do not use any fertilisers and those that do not grow arable crops.
When broken down by farm type the main arable farm types, cereal and general cropping, were the most likely to use these techniques (53% and 51% respectively, Figure 2.1). Grazing livestock, horticulture and pig & poultry farms had the lowest uptake of these techniques.
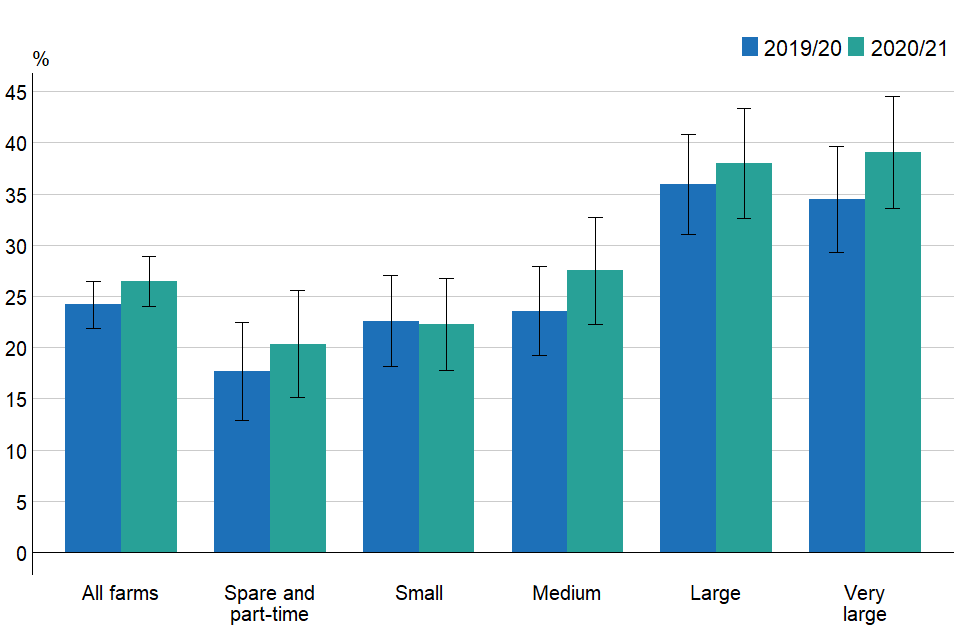
In general, usage increased with farm size. Larger farms were more likely to use these techniques, with both large and very large farms showing a similar usage of 38% and 39% respectively (Figure 2.2).
Additionally, when broken down by Nitrate Vulnerable Zone (NVZ) status, farms which were wholly or partially within a NVZ were more likely to use precision farming techniques than those outside a NVZ. Farms in the East Midlands were also more likely to use these techniques than farms in other regions. See data set for full breakdown.
Figure 2.1: Percentage of farm businesses using precision farming techniques by farm type, England 2019/20 to 2020/21
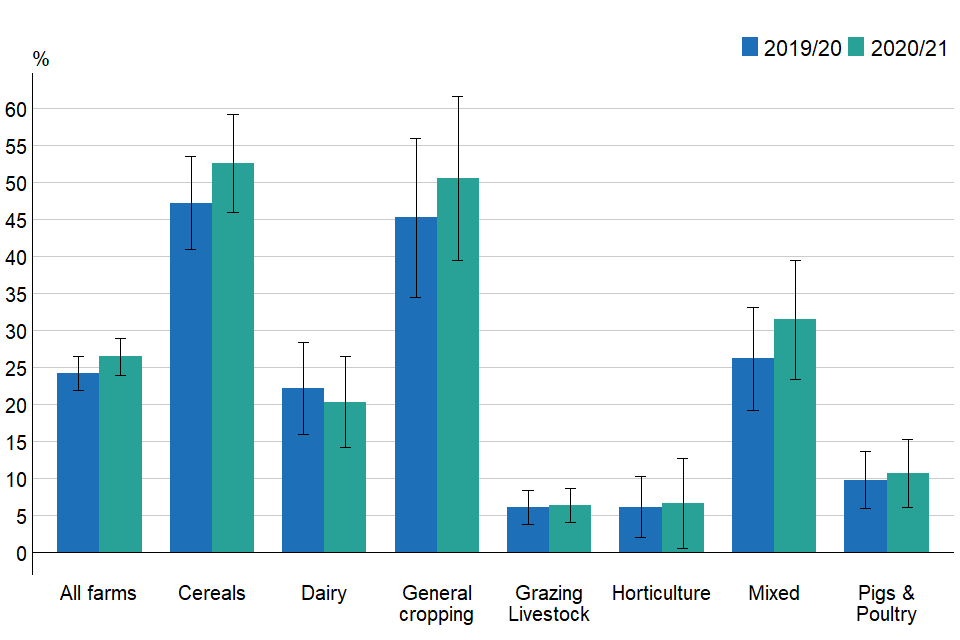
Figure 2.2: Percentage of farm businesses using precision farming techniques by farm size, England 2019/20 to 2020/21
2.2 Soil nutrient software
Effective nutrient management provides sufficient nutrients to meet the growth requirements of crops and grassland whilst managing environmental impacts. It can help minimise greenhouse gas emissions, reduce the incidence of diffuse water pollution and increase productivity by reducing input costs. There are a variety of tools and sources of advice that farmers can use to assess soil nutrient requirements; bespoke software packages provide one such means.
View and download the data for this chapter(323kb)
In 2020/21, 30% of farms used soil nutrient software packages to help determine fertiliser applications (Table 2.2). In comparison, the British Survey of Fertiliser Practice (BSFP) shows that 33% of farms in England used a computer program to record manufactured fertiliser application rates and 22% for organic manures.
The use of soil nutrient software was dependant on farm type, farm size and having land in a Nitrate Vulnerable Zone (NVZ).
Table 2.2: Percentage of farm businesses using soil nutrient software packages to help determine fertiliser applications, England 2019/20 to 2020/21
| 2019/20 | 2020/21 | 95% Confidence interval 2020/21 (+/-) | |
|---|---|---|---|
| Soil nutrient software used | 27 | 30 | 3 |
| No soil nutrient software used | 69 | 66 | 3 |
| Not applicable(a) | 4 | 5 | 1 |
(a) This includes farms that do not use any fertilisers and those that do not grow arable crops.
Uptake of this practice by farm type showed a very similar pattern to that of precision farming techniques. Both cereal and general cropping farms had the highest uptake at 61% and 64% respectively (Figure 2.3), whilst grazing livestock, horticulture and pig & poultry farms all had the lowest usage of such software.
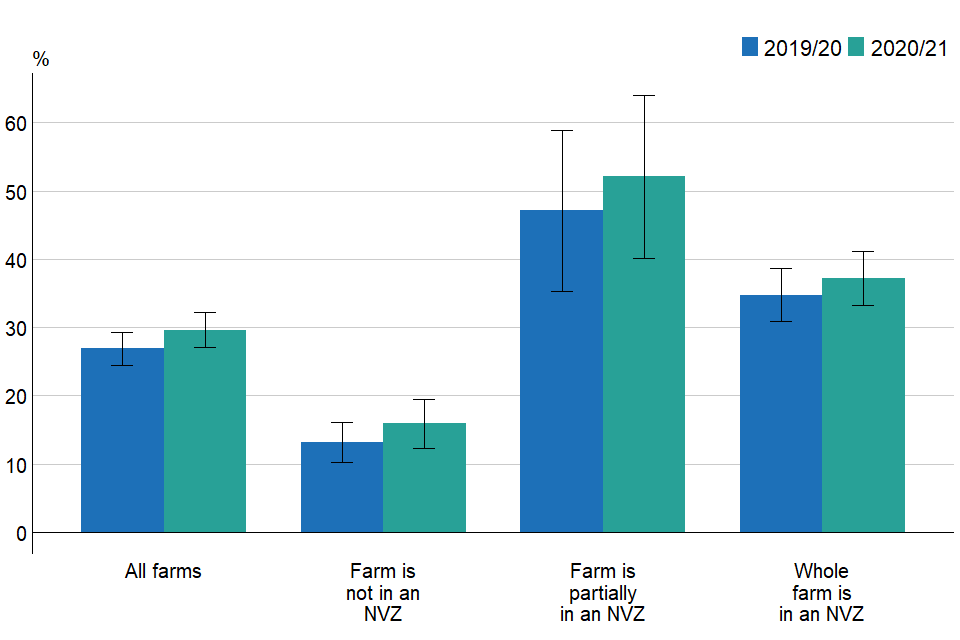
Again, similar to the use to precision farming techniques, farms with at least some land within a NVZ were more likely to use soil nutrient software. Just 16% farms fully outside of a NVZ used soil nutrient software (Figure 2.4).
Figure 2.3: Percentage of farm businesses using soil nutrient software packages by farm type, England 2019/20 to 2020/21
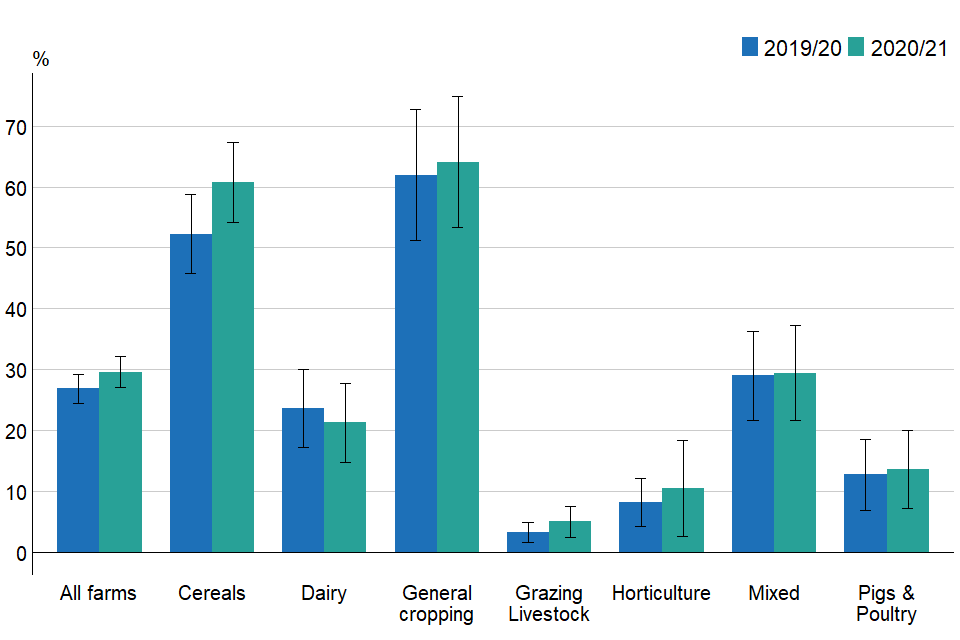
Figure 2.4: Percentage of farm businesses using soil nutrient software packages by NVZ status, England 2019/20 to 2020/21
2.3 Clover or other legumes in grass swards
In many situations, sowing grassland with a clover mix or other legumes can be a cost-effective method of increasing production and improving environmental protection. For example, clover’s nitrogen-fixing properties (although not suitable for all soil types) can reduce the amount of nitrogen required and improve grassland yields.
View and download the data for this chapter(323kb)
Of those farms with permanent or temporary grass, just over half included clover or other legumes in their grass swards in 2020/21 (Table 2.3), with the use of this practice being dependant on farm type, farm size, region and the age of the farmer.
Table 2.3: Percentage of farm businesses with temporary and/or permanent grass (excluding rough grazing) that include clover or other legumes in grass swards, England 2019/20 to 2020/21
| 2019/20 | 2020/21 | 95% Confidence interval 2020/21 (+/-) | |
|---|---|---|---|
| Includes clover or legumes | 50 | 51 | 3 |
| Does not include clover or legumes | 41 | 40 | 3 |
| Not applicable | 9 | 9 | 2 |
Usage was most common on dairy and mixed farms (67% and 66% respectively, Figure 2.5) and least likely on horticulture farms, where usage fell from 28% in the previous year to 16% in 2020/21. When comparing different regions, farms in the South West were the most likely to use clover and legumes in grass swards (74%, Figure 2.6).
Figure 2.5: Percentage of farm businesses with permanent or temporary grass using clover or other legumes in grass swards by farm type, England 2019/20 to 2020/21
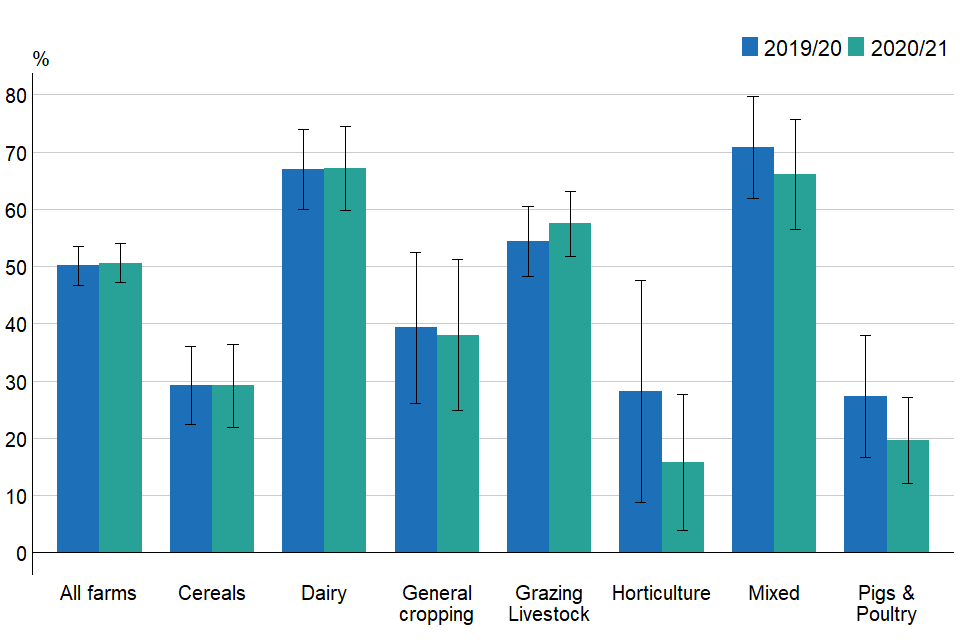
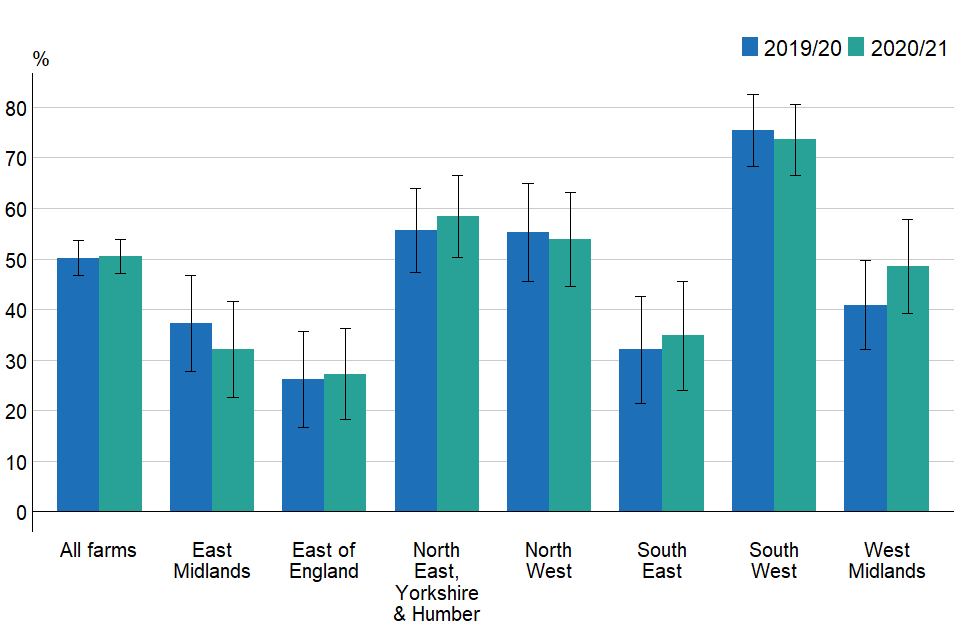
Figure 2.6: Percentage of farm businesses with permanent or temporary grass using clover or other legumes in grass swards by region, England 2019/20 to 2020/21
2.4 Green manures
Green manures are crops grown specifically for building and maintaining soil fertility and structure, although they may also have other functions such as weed control and preventing leaching of soluble nutrients. They are normally incorporated back into the soil, either directly, or after removal and composting.
View and download the data for this chapter(323kb)
Just under a fifth (18%) of farmers used green manures in their arable rotations in 2020/21 (Table 2.4). The use of green manures in 2020/21 was found to be dependant on farm type and farm size.
Table 2.4: Percentage of farm businesses employing green manures in arable rotation, England 2019/20 to 2020/21
| 2019/20 | 2020/21 | 95% Confidence interval 2020/21 (+/-) | |
|---|---|---|---|
| Used green manures | 18 | 18 | 3 |
| Did not use green manures | 66 | 67 | 3 |
| Not applicable | 16 | 15 | 2 |
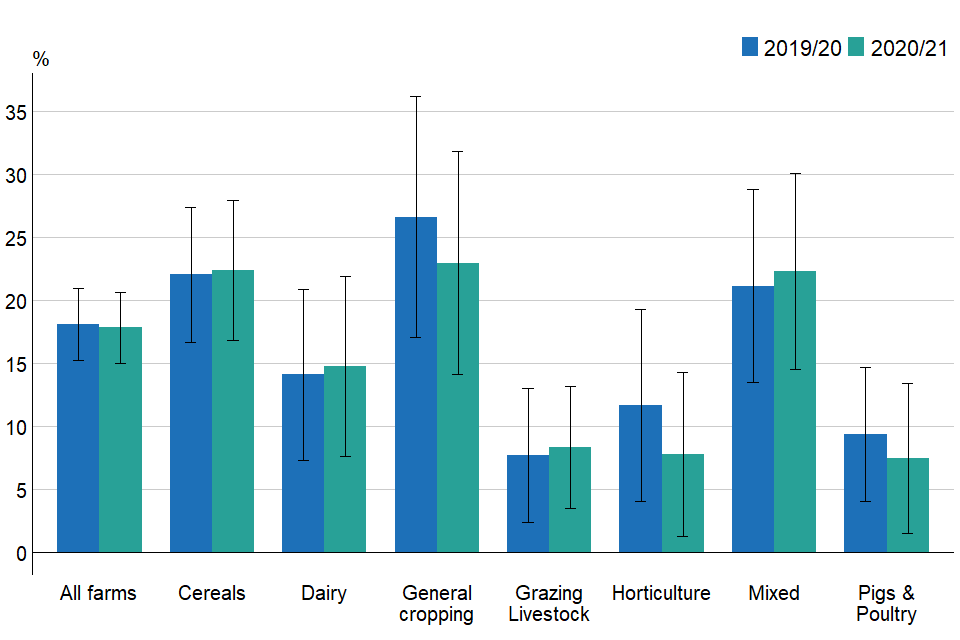
General cropping farms remained the most likely farm type to use green manures, although usage fell from 27% to 23% (Figure 2.7), and now shows similar usage to cereal and mixed farms (22% for both types). Grazing livestock, horticulture and pig & poultry farms remain the least likely to use green manures.
Figure 2.7: Percentage of farm businesses using green manures in arable rotation by farm type, England 2019/20 to 2020/21
2.5 Adjustments to fertiliser applications
Including legumes or clover in grass swards and using green manures are alternative methods to increase the quantities of available nitrogen and will reduce the requirement for additional nutrients from fertilisers.
View and download the data for this chapter(323kb)
In 2020/21, 74% of farmers that had used these crops reported that they had made adjustments to their fertiliser application rates (Table 2.5). This was found to be dependant on farm type, farm size, region and farms’ economic performance.
Table 2.5: Percentage of farm businesses adjusting fertiliser application after using clover/legumes or green manures, England 2019/20 to 2020/21
| 2019/20 | 2020/21 | 95% Confidence interval 2020/21 (+/-) | |
|---|---|---|---|
| Made adjustments to fertiliser applications | 72 | 74 | 4 |
| Did not make adjustments to fertiliser applications | 28 | 26 | 4 |
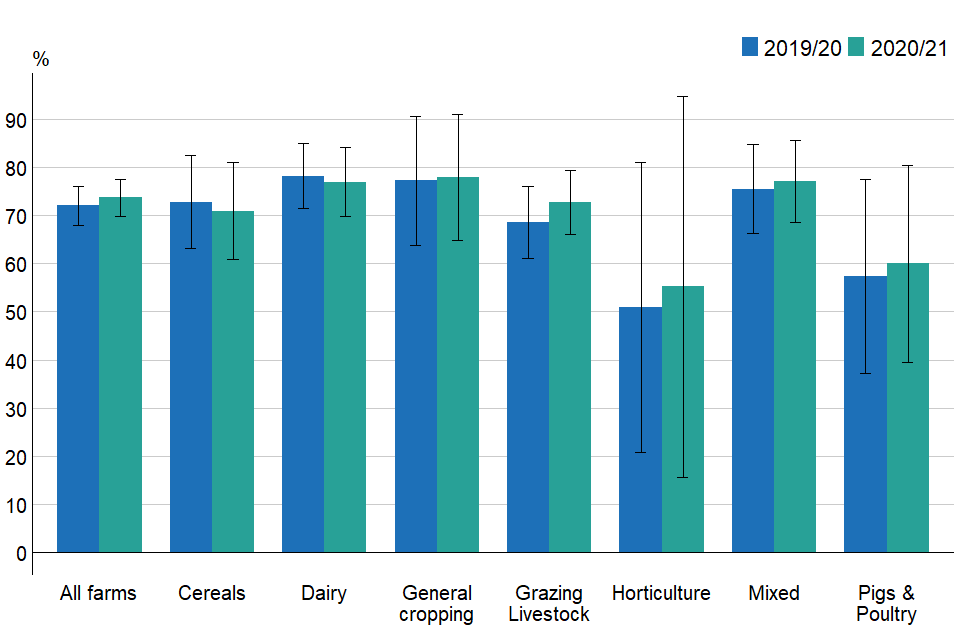
Where either clover or legumes or green manures were used, all farm types were highly likely to adjust their fertiliser application rates. With the exception of horticulture and pig & poultry farms, all farm types had an uptake of this practice of at least 70% (Figure 2.8).
Figure 2.8: Percentage of farm businesses adjusting fertiliser application after using clover/legumes or green manures by farm type, England 2019/20 to 2020/21
2.6 Sources of nutrient planning advice
Some farmers and their advisers may pay greater attention to the calculation of fertiliser application rates, sourcing their advice from qualified individuals so that their application rates match crop requirements. The Fertiliser Advisers Certification and Training Scheme (FACTS) provides training in an evidence-based approach to fertiliser applications.
View and download the data for this chapter(323kb)
There was little change in the overall source of advice from the previous year, with the largest source being farmers’ own non-FACTS qualified advice (45%, Table 2.6). However, the majority of farmers continue to rely on FACTS qualified advice, with half of farm businesses sourcing either independent advice or that of their fertiliser supplier, with the remaining 5% sourcing their own FACTS qualified advice. The source of farmers’ nutrient planning advice was dependant on farm type, farm size and region.
Table 2.6: Main source of advice for nutrient planning by farm type, England 2019/20 to 2020/21(a)
| 2019/20 | 2020/21 | 95% Confidence interval 2020/21 (+/-) | |
|---|---|---|---|
| Own advice (not FACTS) | 45 | 45 | 3 |
| Own advice (FACTS) | 5 | 5 | 1 |
| Independent advice (FACTS) | 28 | 29 | 3 |
| Fertiliser supplier advice (FACTS) | 22 | 21 | 3 |
(a) This question was not applicable to farms without a utilised agricultural area (UAA) or farms letting out their full UAA.
The majority of cereal and general cropping farms sourced their nutrient planning advice from FACTS qualified sources, 84% in both cases (Figure 2.9). Conversely, over two thirds of grazing livestock, horticulture, and pig & poultry farms relied on their own non-FACTS qualified advice, far greater than any other farm type. Very few farms sourced their own FACTS qualified advice, with general cropping farms being the most likely at just 10%.
In general, smaller farms were more likely to source their own non-FACTS qualified nutrient planning advice, with almost half of spare/part-time and small farms using this source (Figure 2.10). The proportion of farms receiving independent FACTS qualified advice tended to increase with farm size, although there was little variation between size groups in those receiving advice from their FACTS qualified fertiliser supplier.
Figure 2.9: Main source of advice used in nutrient planning by farm type, England 2020/21
| Farm type | Own advice (not FACTS) | Own advice (FACTS) | Independent advice (FACTS) | Fertiliser supplier advice (FACTS) | Own or Independent advice (FACTS) | Total |
|---|---|---|---|---|---|---|
| All farms | 45 | 5 | 29 | 21 | 0 | 100 |
| Cereals | 16 | 9 | 53 | 22 | 0 | 100 |
| Dairy | 46 | 4 | 25 | 26 | 0 | 100 |
| General cropping | 16 | 10 | 55 | 19 | 0 | 100 |
| Grazing Livestock | 70 | 2 | 7 | 20 | 0 | 100 |
| Horticulture(a) | 72 | 0 | 0 | 18 | 10 | 100 |
| Mixed | 34 | 3 | 37 | 26 | 0 | 100 |
| Pigs & Poultry | 66 | 3 | 23 | 8 | 0 | 100 |
Percentages may not add to 100% due to rounding.
(a) For horticulture farms, ‘Own advice (FACTS)’ and ‘Independent advice (FACTS)’ have been merged into ‘Independent or Supplier advice (FACTS)’ due to a low sample count.
Figure 2.10: Main source of advice used in nutrient planning by farm size, England 2020/21
| Farm size | Own advice (not FACTS) | Own advice (FACTS) | Independent advice (FACTS) | Fertiliser supplier advice (FACTS) | Total |
|---|---|---|---|---|---|
| All farms | 45 | 5 | 29 | 21 | 100 |
| Spare and part-time | 49 | 4 | 28 | 19 | 100 |
| Small | 49 | 5 | 25 | 21 | 100 |
| Medium | 39 | 8 | 29 | 24 | 100 |
| Large | 41 | 3 | 33 | 22 | 100 |
| Very large | 33 | 6 | 37 | 24 | 100 |
Percentages may not add to 100% due to rounding.
3 Fertiliser application rates
This section examines the quantity of nitrogen (N), phosphate (P2O5) and potash (K2O) applied by farms from manufactured and organic fertilisers. The quantities of fertiliser were collected for the farm as a whole, not at the crop level and are presented per hectare of farmed area, excluding rough grazing.
Organic fertilisers applied to agricultural land may be produced on farm or imported from other sources. Types of organic fertilisers include: livestock products (slurries, farmyard manure (FYM) and poultry manures), treated sewage sludges (also called bio-solids) and some industrial ‘wastes’ such as compost, paper waste or brewery effluent. Table 3.1 shows a breakdown of the source of organic fertilisers applied as a proportion of the total application rates recorded in this chapter.
Table 3.1: Proportion of overall organic application rates per hectare of farmed area (excluding rough grazing) by nutrient type, England 2020/21
| Nitrogen | Phosphate | Potash | |
|---|---|---|---|
| Farmyard manure (FYM) & slurry(a) | 89% | 84% | 95% |
| Digestate from on-farm anaerobic digestion | <1% | <1% | <1% |
| Digestate from off-farm anaerobic digestion | 7% | 2% | 2% |
| Other organic products | 4% | 14% | 3% |
Percentages may not add to 100% due to rounding.
(a) Includes home produce, imported and purchased FYM and Slurry.
Calculation of fertiliser application rates includes those farms which applied no fertiliser that year but were actively farming. Relatively few horticulture farms apply organic fertilisers making these estimates subject to a high degree of uncertainty and so should be treated with caution.
Weather conditions can influence which crops are grown and the application rates of manufactured fertilisers. For a summary of the 2020/21 weather conditions see Appendix A. For the 2020 crop areas on agricultural holdings see the June Survey of Agriculture’s annual series.
Generalised linear regression modelling was used to determine which key factors were related to each application rate. For further detail see section 5.4.
3.1 Nitrogen (N)
The overall application rates of both manufactured and organic nitrogen as recorded by the Farm Business Survey has varied very little over time, with both remaining at 109 Kg/ha and 9 Kg/ha respectively compared to the previous year (Table 3.2). This is higher than the overall application rates for manufactured fertilisers for England from the British Survey of Fertiliser Practice (88 kg per hectare in 2020). The application of both manufactured and organic nitrogen was dependant on farm type, size, region and tenancy, with organic application rates additionally dependant on farms’ economic performance.
View and download the data for this chapter(76.9KB)
Table 3.2: Overall nitrogen application rates per hectare of farmed area (excluding rough grazing), England 2019/20 to 2020/21
| 2019/20 | 2020/21 | 95% Confidence interval 2020/21 (+/-) | |
|---|---|---|---|
| Manufactured Fertilisers | 109 | 109 | 5 |
| Organic Fertilisers | 9 | 9 | 1 |
The breakdown of manufactured nitrogen by farm type generally split into three groups with cereal, dairy and general cropping farms showing the highest application rates (Figure 3.1). Grazing livestock had by far the lowest application rate of manufactured nitrogen at 39 kg/ha, with all other farm types having an application rate ranging from 97 and 102 kg/ha. For organic nitrogen, dairy and pig & poultry farms had by far the highest application rates at 38 kg/ha and 23 kg/ha respectively (Figure 3.2), with all other farm types having an application rate no greater than 10 kg/ha.
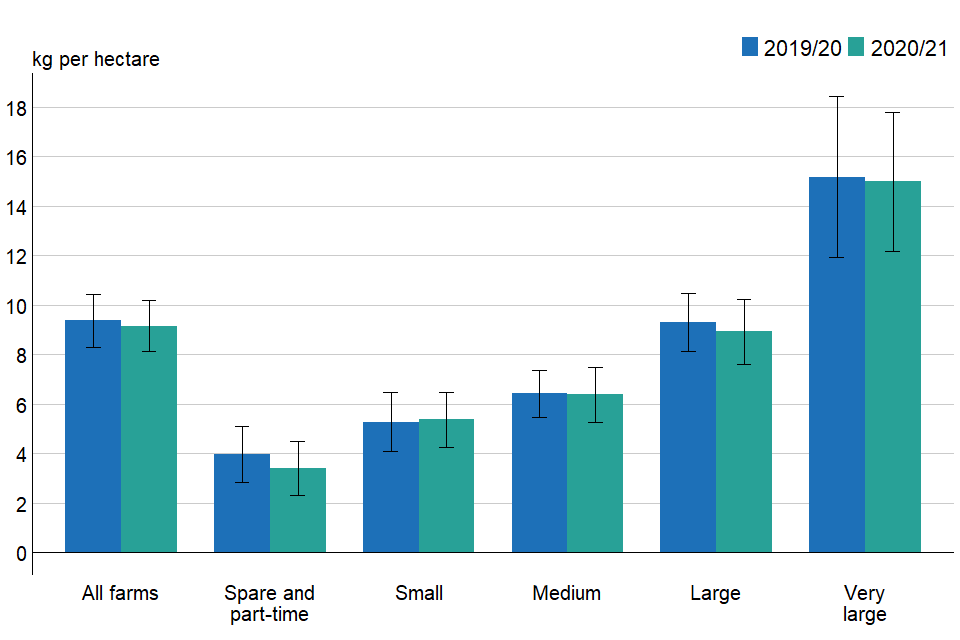
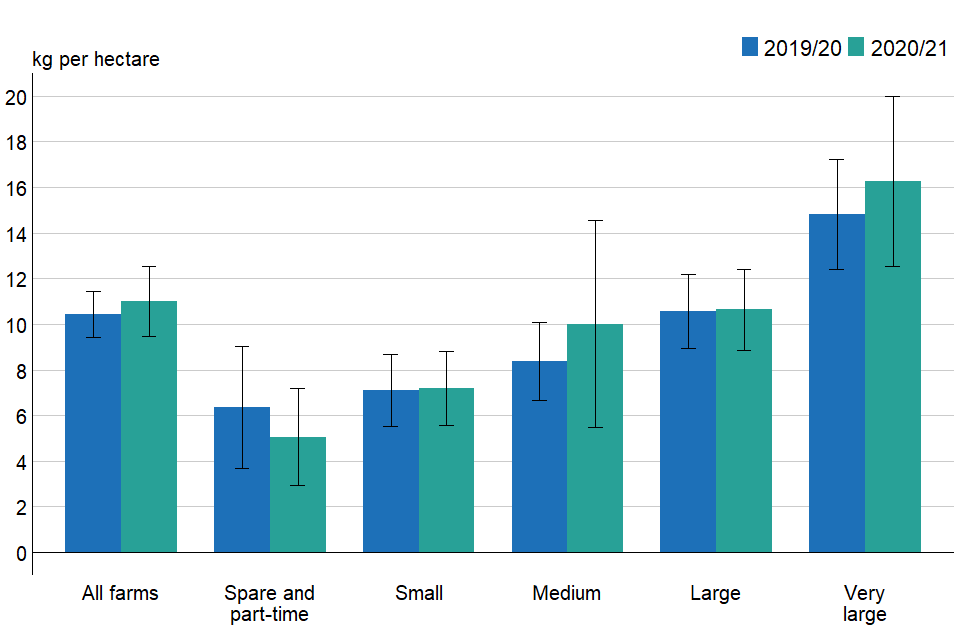
Application rates of organic nitrogen increased with farm size, ranging from 3 kg/ha for spare and part-time farms to 9 kg/ha for large farms, with a larger jump to 15 kg/ha for very large farms (Figure 3.3). Additionally, organic nitrogen application rates were much higher for medium performing farms than for either low or high performing farms. See data set for full breakdown.
Figure 3.1: Overall manufactured nitrogen application rates per hectare of farmed area (excluding rough grazing) by farm type, England 2019/20 to 2020/21
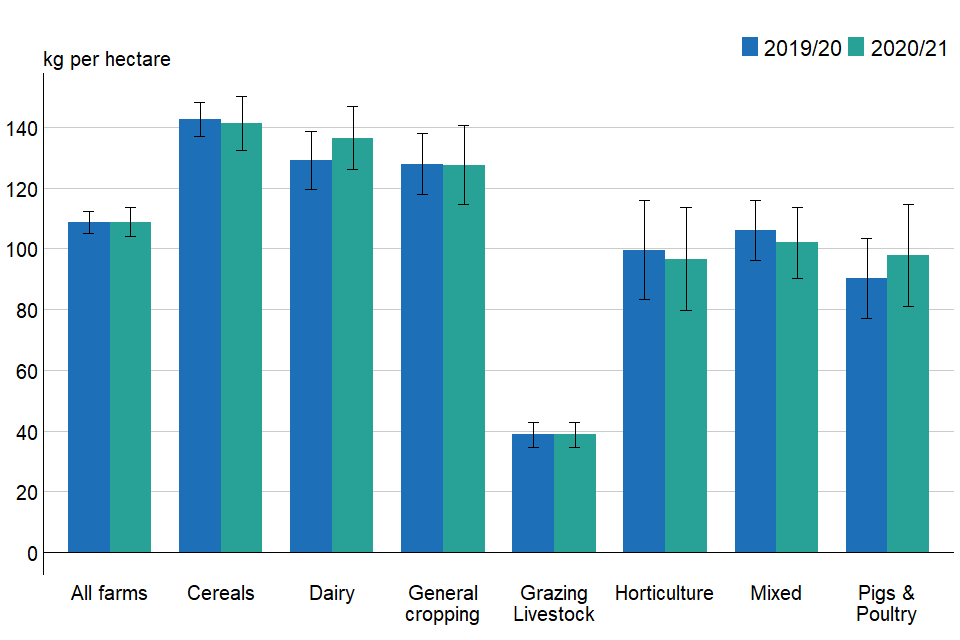
Figure 3.2: Overall organic nitrogen application rates per hectare of farmed area (excluding rough grazing) by farm type, England 2019/20 to 2020/21
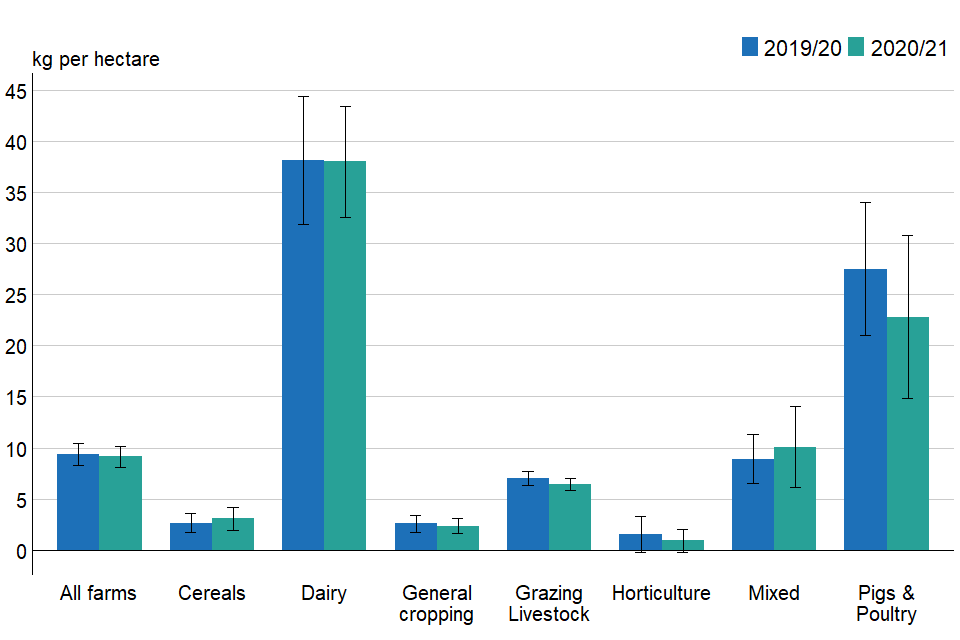
Figure 3.3: Overall organic nitrogen application rates per hectare of farmed area (excluding rough grazing) by farm size, England 2019/20 to 2020/21
3.2 Phosphate (P2O5)
There has been little change in the overall quantities of phosphate applied since 2012/13, with the small increase from the previous year (Table 3.3) not statistically significant. Manufactured phosphate application rates (for total crops and grassland) for England from BSFP were 14 kg per hectare (sown land area) in 2020, lower than the FBS results. In 2020/21 application of manufactured and organic phosphate was dependant on farm type and region, with the application of organic phosphate additionally dependant farm size, farm tenancy and farms’ economic performance.
View and download the data for this chapter(76.9KB)
Table 3.3: Overall phosphate application rates per hectare of farmed area (excluding rough grazing), England 2019/20 to 2020/21
| 2019/20 | 2020/21 | 95% Confidence interval 2020/21 (+/-) | |
|---|---|---|---|
| Manufactured Fertilisers | 19 | 21 | 2 |
| Organic Fertilisers | 10 | 11 | 2 |
In 2020/21, usage of manufactured phosphate fell across all farm types except for cereal and general cropping farms which had the highest application rates at 31 kg/ha and 30 kg/ha respectively (Figure 3.4). Dairy and pig & poultry farms remain the largest users of organic phosphate at 30 kg/ha and 33 kg/ha respectively. All other farm types had a usage no higher than 10 kg/ha (Figure 3.5).
Application rates of organic phosphate increased with farm size ranging from 5 kg/ha for spare and part-time farms to 11 kg/ha for large farms, with a larger jump to 16 kg/ha for very large farms (Figure 3.6).
Figure 3.4: Overall manufactured phosphate application rates per hectare of farmed area (excluding rough grazing) by farm type, England 2019/20 to 2020/21
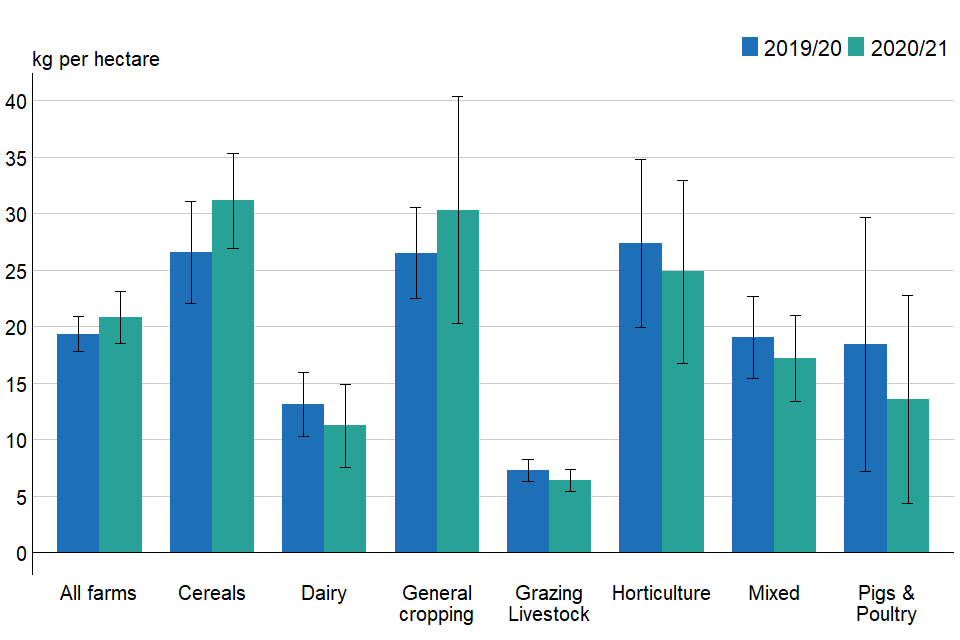
Figure 3.5: Overall organic phosphate application rates per hectare of farmed area (excluding rough grazing) by farm type, England 2019/20 to 2020/21
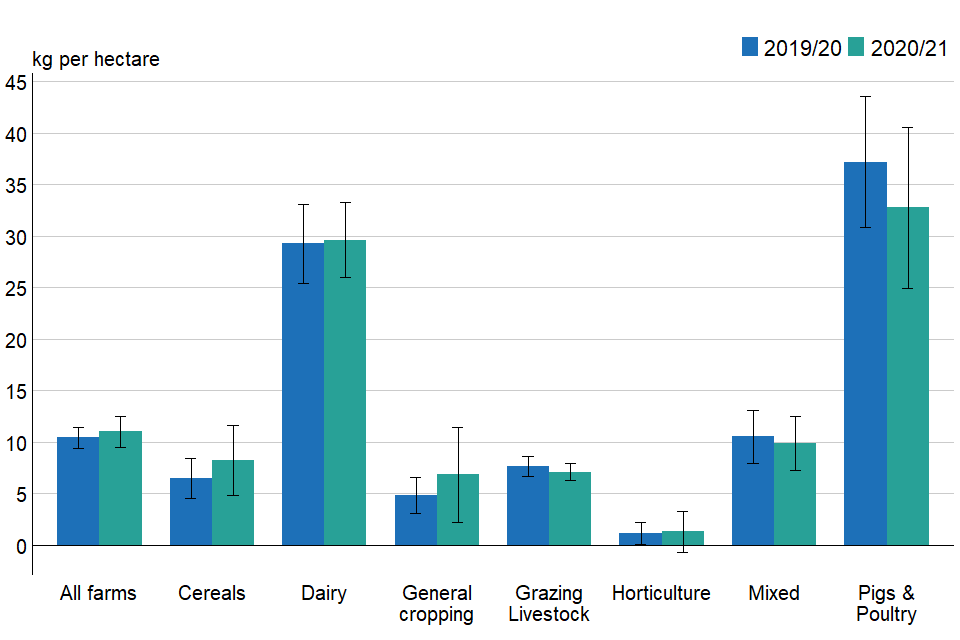
Figure 3.6: Overall organic phosphate application rates per hectare of farmed area (excluding rough grazing) by farm size, England 2019/20 to 2020/21
3.3 Potash (K2O)
The average amount of manufactured and organic potash applied per hectare in 2020/21 was 24 kg/ha and 28 kg/ha respectively (Table 3.4), little change from previous years. Manufactured potash application rates (for total crops and grassland) for England from the BSFP were 17 kg per hectare (sown land area) in 2020, lower than the FBS results. Application rates of manufactured and organic fertilisers from the Farm Business Survey were dependant on farm type and region, with application of organic potash additionally dependant on farm tenancy and farms’ economic performance.
View and download the data for this chapter(76.9KB)
Table 3.4: Overall potash application rates per hectare of farmed area (excluding rough grazing), England 2019/20 to 2020/21
| 2019/20 | 2020/21 | 95% Confidence interval 2020/21 (+/-) | |
|---|---|---|---|
| Manufactured Fertilisers | 26 | 24 | 2 |
| Organic Fertilisers | 29 | 28 | 2 |
Horticulture and general cropping farms continued to have the highest average application rates of manufactured potash at 47 kg/ha and 46 kg/ha respectively (Figure 3.7). Usage on pig & poultry farms fell from 23 kg/ha to 13 kg/ha between 2019/20 and 2020/21, whilst grazing livestock farms remained the smallest users of manufactured potash at 9 kg/ha.
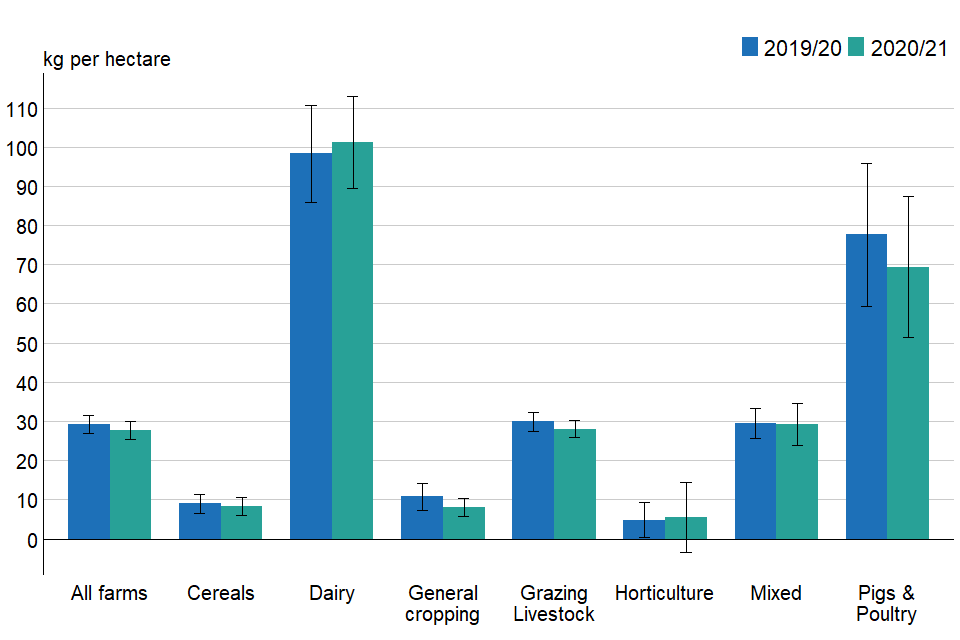
As with other organic nutrients, dairy and pig & poultry farms had the highest usage of organic potash at 101 kg/ha and 69 kg/ha respectively (figure 3.8). All other farm types had an application rate of less than 30 kg/ha.
Figure 3.7: Overall manufactured potash application rates per hectare of farmed area (excluding rough grazing) by farm type, England 2019/20 to 2020/21
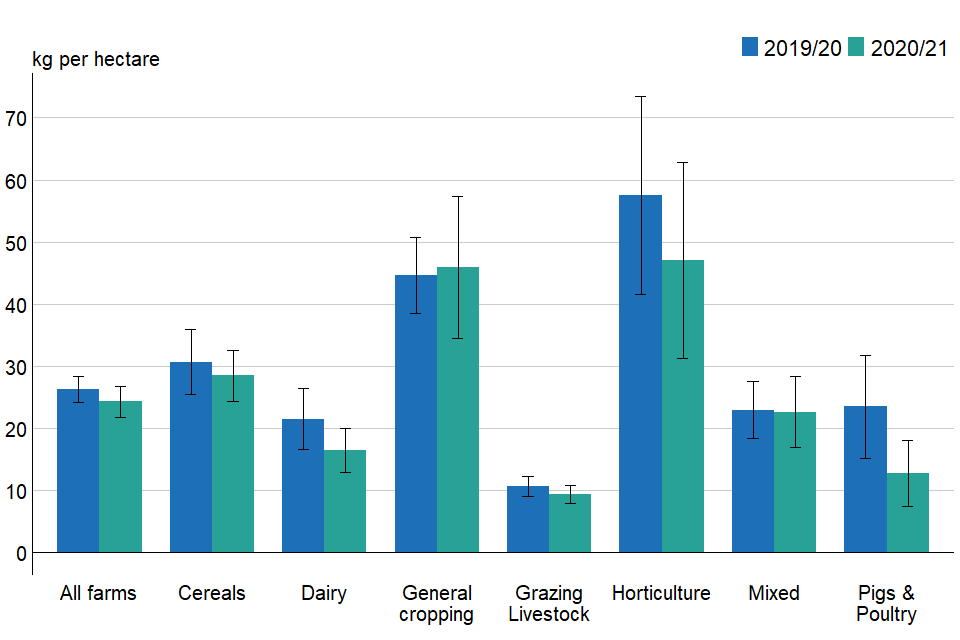
Figure 3.8: Overall organic potash application rates per hectare of farmed area (excluding rough grazing) by farm type, England 2019/20 to 2020/21
4. What you need to know about this release
4.1 Contact details
Responsible statistician: Cristobal Rengifo Castillo
Email: fbs.queries@defra.gov.uk
Farm Business Survey Team
Room 201
Foss House
1-2 Peasholme Green
York
YO1 7PX
4.2 National Statistics Status
National Statistics status means that our statistics meet the highest standards of trustworthiness, quality and public value, and it is our responsibility to maintain compliance with these standards.
These statistics last underwent a full assessment against the Code of Practice for Statistics in 2014. Since the last review by the Office for Statistics Regulation, we have continued to comply with the Code of Practice for Statistics across the FBS.
For contractual reasons, the fertiliser module was introduced in 2012/13; 2017/18 was the first year that data became available for all farms in the FBS sample. This has generally resulted in improved data quality with smaller confidence intervals produced across all fertiliser questions and within the various breakdowns that are published.
For general enquiries about National Statistics, contact the National Statistics Public Enquiry Service:
Tel: 0845 601 3034
Email: info@statistics.gov.uk
You can find National Statistics on the internet on the Gov.uk website.
As part of our ongoing commitment to compliance with the Code of Practice for Official Statistics, we wish to strengthen our engagement with users of these statistics and better understand the use made of them and the types of decisions that they inform. Consequently, we invite users to make themselves known, to advise us of the use they do, or might, make of these statistics, and what their wishes are in terms of engagement. Feedback on this notice and enquiries about these statistics are also welcome.
4.3 Key Words
- Fertilisers
- Manufactured fertilisers
- Organic Fertilisers
5. Survey details
5.1 Background
Historically, the Farm Business Survey (FBS) has focused on the collection of financial rather than physical data for agricultural inputs. Over recent years attention has turned to agriculture’s environmental footprint and the need to develop a more sustainable industry. Nutrients, particularly nitrogen, are the biggest determinant of yield and have a major impact on crop/sward structure and the quality of the end product.
Nutrient losses to ground and surface waters can cause pollution, affecting biodiversity (e.g. through eutrophication, increased turbidity, fish kills) and the quality of drinking water. Gaseous losses such as ammonia and oxides of nitrogen also cause air pollution, and can contribute to the eutrophication of sensitive habitats and to climate change. Any measures taken to reduce nutrient losses should also result in better financial returns to the farmer.
In order to better measure a farm’s environmental footprint one of the most important data gaps to address is the quantity of nitrogen (N), phosphate (P2O5) and potash (K2O) applied as fertiliser. In 2012/13 these quantities were collected for the first time within the FBS. The data collected:
- Provides important data needed to estimate the environmental footprint of farming.
- Enables farms to benchmark their environmental as well as their financial performance.
Data from the Farm Business Survey is widely used by the industry for benchmarking and informing wider research into the economic performance of the agricultural industry, as well as for evaluating and monitoring current policies.
5.2 Survey content and methodology
The Farm Business Survey is an annual survey providing information on the financial position and physical and economic performance of farm businesses in England. The sample of around 1,750 farm businesses covers all regions of England and all types of farming, with the data being collected by face-to-face interview with the farmer. Results are weighted to represent the whole population of farm businesses that have at least 25,000 Euros of standard output as recorded in the annual June Survey of Agriculture and Horticulture. In 2020/21, this accounted for approximately 56,000 farm businesses.
Since 2012/13, the FBS has included an additional module to collect information on fertiliser usage. Completion of the fertiliser module was voluntary until 2017/18 when it became compulsory following a planned, phased introduction. See Appendix B Table 7.1 for details on the number of farms completing the fertiliser module each year.
The information collected within the fertiliser module covered:
- Use of precision farming techniques.
- Use of soil nutrient software packages.
- Inclusion of clover or legumes in grass swards.
- Use of green manures.
- Adjustments to fertiliser application rates.
- Amount of UAA subjected to restricted fertiliser applications (up until 2015/16).
- Sources of nutrient planning advice (since 2016/17).
- Volumes of nitrogen (N), phosphate (P2O5) and potash (K2O) used.
Where information on fertiliser quantities is not directly available from the farmer, estimates have been made based on available information. These estimates are based on further information available from the farmer or calculated based on their expenditure and known usage on other, similar farms. For both manufactured and organic fertiliser, estimates of usage have been made for 17% farms in the sample. See Appendix B Tables 7.2 and 7.3 for a full breakdown by farm type.
The organic fertiliser section of the module was first published in 2020. This section was not published previously due to methodological changes in data collection on poultry farms and a small sample size for pig farms. The methodology has remained the same since 2016/17 and there has been an increase in sample size.
In the case of horticulture farms, application rates describe total levels of nutrients being applied to what might be more than one crop being grown during the year on the same parcel of land. The amount of nutrients applied will be correlated with the types of crops that are grown, for example potato crops require high amounts of potassium.
The farmed area includes rough grazing, but this has been excluded from the farmed area when calculating the overall application rate as it does not tend to receive applications.
Full details of the information collected on fertiliser usage and other technical notes can be found here.
5.3 Differences between the BSFP and FBS fertiliser data.
The British Survey of Fertiliser Practice (BSFP) is Defra’s main source of fertiliser data, but fertiliser data are also collected as part of the FBS. It is important to note the differences between the FBS fertiliser estimates presented here with the BSFP, which make both surveys useful for alternative purposes. Table 5.1 provides a summary of some of the key differences between the two surveys along with when each set of figures should be used.
One of the most important differences comes from their data collection strategies. The BSFP collects data at field level and provides detailed information on fertiliser application rates for individual crops. The FBS collects fertiliser quantities for the farm as a whole, which can be linked to the detailed financial information provided by the FBS.
More recently, the FBS release includes breakdowns of organic fertiliser applications. While the BSFP also publish data on organic fertilisers, it is primarily designed to detail the application of manufactured fertiliser.
Table 5.1 Key differences between the FBS and BSFP
| FBS | BSFP | |
|---|---|---|
| Survey Coverage | England | Great Britain (but the figures presented in this release are for England) |
| Sample Strategy | Stratified random sampling by combined farm type and farm size groups. Sample size 1,750. | Stratified random sampling by combined farm type, region and crop/grass area groups. Sample size 1,250. |
| Sample Exclusion | Excludes farms with < 25,000 Euros of standard output. | Excludes farms with < 20 hectares of crops/grass. |
| Sampling Units | Farm Business | Farm Holding |
| What is collected | Manufactured and organic fertiliser quantities at the farm business level. | Manufactured fertiliser quantities at the field/crop level. |
| What is currently published | Fertiliser applications broken down by high level factors including: farm type, size, region, farm tenancy, farm economic performance, NVZ status and organic status. | Fertiliser application rates broken down by major crop groups, grassland, product types, farm types and region. |
| When to use | Analysing fertiliser quantities by high level factors and linking to financial data in England. | Analysing fertiliser quantities applied to individual crops and for overall figures across Great Britain. |
5.4 Data analysis
The results from the FBS relate to farms which have a standard output of at least 25,000 Euros. Initial weights are applied to the FBS records based on the inverse sampling fraction for each design stratum (farm type by farm size). These weights are then adjusted (calibration weighting) so that they can produce unbiased estimators of a number of different target variables.
Generalised linear regression models were fitted to the key results to help determine the main factors associated with each response. In each case seven factors were considered - farm type, farm size, farm tenure, farmer’s age, region, farm economic performance and Nitrate Vulnerable Zones (NVZs). In the case of using green manures and when analysing organic fertiliser application rates, organic status was also considered, whilst the farmer’s age was not considered for fertiliser application rates. Model simplification was conducted using a backwards stepwise approach, with non-significant parameters dropped with each step.
5.5 Accuracy and reliability of the results
We show 95% confidence intervals alongside the averages. These show a plausible range of values for the averages based on our sample. They are calculated as the standard errors (se) multiplied by 1.96 to give the 95% confidence interval (95% CI).
The standard errors only give an indication of the sampling variability. They do not reflect any other sources of survey errors, such as non-response bias. For the Farm Business Survey, the confidence limits shown are appropriate for comparing groups within the same year only; they should not be used for comparing with previous years since they do not allow for the fact that many of the same farms will have contributed to the Farm Business Survey in both years.
We have also shown error bars on the figures in this notice. These error bars represent the 95% confidence intervals (as defined above). Where possible we have provided comparisons with other data sources, particularly the British Survey of Fertiliser Practice.
5.6 Availability of results
This release contains headline results for each section. The full breakdown of results, by farm type, farm size, region, farm tenure, farmer age, farm economic performance, Nitrate Vulnerable Zones (NVZs), and organic status can be found here.
Defra statistical notices can be viewed on the Food and Farming Statistics pages on the Defra website which also provides details of future publications, with pre-announced dates.
6. Definitions
Manufactured fertilisers
These are high concentration essential nutrients required for plant growth immediately available for plant use.
Organic fertilisers
Organic fertilisers are distinguished from manufactured fertilisers by having undergone minimal processing, having remained in their natural form and being generally less concentrated than manufactured fertilisers.
Farm Type
Where reference is made to the type of farm in this document, this refers to the ‘robust type’, which is a standardised farm classification system.
Farm Sizes
Farm sizes are based on the estimated labour requirements for the business, rather than its land area. The farm size bands used within the detailed results tables which accompany this publication are shown in the table below. Standard Labour Requirement (SLR) is defined as the theoretical number of workers required each year to run a business, based on its cropping and livestock activities.
Table 6.1 Standard Labour Requirement (SLR) of each farm size category
| Farm size | Definition |
|---|---|
| Spare & Part time | Less than 1 SLR |
| Small | 1 to less than 2 SLR |
| Medium | 2 to less than 3 SLR |
| Large | 3 to less than 5 SLR |
| Very Large | 5 or more SLR |
Farm Economic performance
Economic performance for each farm is measured as the ratio between economic output (mainly sales revenue) and inputs (costs). The inputs for this calculation include an adjustment for unpaid manual labour. The higher the ratio, the higher the economic efficiency and performance. The farms are then ranked and allocated to performance bands based on economic performance percentiles:
- Low performance band - farms who took part in the fertiliser survey and were in the bottom 25% of economic performers.
- Medium performance band - farms who took part in the fertiliser survey and were in the middle 50% of performers.
- High performance band - farms who took part in the fertiliser survey and were in the top 25% of performers.
Utilised Agricultural Area (UAA)
Utilised Agricultural Area (UAA) is the crop area, including fodder, set-aside land, temporary and permanent grass and rough grazing in sole occupation (but not shared rough grazing) i.e. the agricultural area of the farm. It includes bare land and forage let out for less than one year.
Farmed area
Farmed area = Utilised Agricultural Area + bare land rented in + forage area hired in - bare land let out - forage area let out.
Some specialist pig and poultry farms have no farmed area.
Grass swards
Land or soil which features a layer of grass.
Nitrate Vulnerable Zones
Nitrate Vulnerable Zones (NVZs) are areas designated as being at risk from agricultural nitrate pollution. Farmers with land in NVZs must follow rules to tackle nitrate loss from agriculture. The boundaries that apply in England and Wales are reviewed and updated every four years. Click here for map of the most recent NVZ boundaries.
7. Appendices
7.1 Appendix A. Weather conditions
2020/21 (2020 harvest)
Autumn 2019 was characterised by generally unsettled conditions, with rainfall above the long-term average throughout the season and temperatures generally below the long-term average.
Winter 2019/20 saw exceptional rainfall and above average temperatures. This included the wettest February since 1862, with rainfall over two and a half times the long-term average. December was generally changeable, with periods of settled weather leading to above average sunshine. January and February had near average sunshine levels.
In contrast to winter, spring was very dry, particularly in eastern half of England. May recorded the driest conditions since 1862, with rainfall less than a fifth of the long-term average. 2020 saw among the sunniest March through to May periods since 1929. Spring temperatures were generally above the long-term average.
Summer 2020 began with temperatures and sunshine levels for June and July close to the long-term average, however, wet conditions in the South East drove June rainfall to 43% above the long-term average. This was followed by a drier than average July. August recorded above average temperatures and saw a return to wetter conditions, with rainfall 58% above the long-term average.
September and October 2020 were contrasting months. Both had near average temperatures, however, September sunshine hours were 21% above the long-term average whilst in October they were 35% below. Compared to the relatively dry September, October was wet with rainfall well above the long-term average.
2019/20 (2019 harvest)
Autumn 2018 saw mixed conditions. Despite some unsettled periods, many areas had above average sunshine and temperatures in September and October. Overall, October rainfall was around three quarters of the average.
The winter of 2018/19 was mild, particularly February which had 63%more sunshine than average making it the sunniest in a series from 1929. Rainfall was 15% higher than the average in December followed by a drier January and February.
March 2019 began with wet, windy and unsettled weather although it was generally mild. April temperatures were also slightly higher than average while in May they were a little below the average. Sunshine was above normal across the spring months with April and May also drier than usual. Spring was generally warm and dry.
Summer 2019 began with generally wet conditions, with many parts of England seeing double the average rainfall. The latter part of June and most of July were fairly settled with the end of July bringing record-breaking temperatures and plenty of sunshine. Rainfall in July was 9% above average, but this varied widely across the country. August was rather unsettled, with sunshine, rainfall and mean temperature all above average with a hot spell at the end of the month.
Wet conditions dominated many areas of the country in September and October 2019 with rainfall above the long term average by 54% and 36% respectively.
7.2 Appendix B: Characteristics of responders to the FBS fertiliser module
Table 7.1: Number of farms which completed the Farm Business Survey fertliser module.
| Year | Farms in Sample | Number Completed Fertiliser Module |
|---|---|---|
| 2012/13 | 1877 | 975 |
| 2013/14 | 1889 | 975 |
| 2014/15 | 1880 | 968 |
| 2015/16 | 1805 | 1329 |
| 2016/17 | 1763 | 1421 |
| 2017/18(a) | 1762 | 1762 |
| 2017/18(b) | 1766 | 1766 |
| 2018/19 | 1768 | 1768 |
| 2019/20 | 1664 | 1664 |
| 2020/21 | 1661 | 1661 |
(a) Farm typology based on 2010 standard output coefficients.
(b) Farm typology based on 2013 standard output coefficients.
Table 7.2: Percentage of farms by source of data on manufactured fertiliser application rates for the 2020/21 FBS sample
| Farm type | Actual Data | Data estimated from farmer information | Fertiliser calculator used | No fertiliser usage |
|---|---|---|---|---|
| Cereals | 75 | 12 | 11 | 2 |
| General cropping | 66 | 15 | 18(b) | (b) |
| Dairy | 72 | 10(a) | (a) | 18 |
| LFA Grazing Livestock | 73 | 5 | 0 | 22 |
| Lowland Grazing Livestock | 60 | 10(a) | (a) | 29 |
| Pigs | 45 | 9(a) | (a) | 46 |
| Poultry | 29 | (c) | (c) | (c) |
| Mixed | 72 | 14 | 5 | 9 |
| Horticulture | 54 | 13 | 20 | 13 |
| All farms | 65 | 10 | 7 | 18 |
(a) For these farm types the ‘Data estimated from farmer information’ and ‘Fertiliser calculator used’ values have been merged due to insufficient observations. The combined result is shown in the ‘Data estimated from farmer information’ cell.
(b) For these farm types the ‘Fertiliser calculator used’ and ‘No fertiliser usage’ values have been merged due to insufficient observations. The combined result is shown in the ‘Fertiliser calculator used’ cell.
(c) Figures omitted due to insufficient observations.
Table 7.3: Percentage of farms by source of data on organic fertiliser application rates for the 2020/21 FBS sample
| Farm type | Actual Data | Data estimated from farmer information | No fertiliser usage |
|---|---|---|---|
| Cereals | 42 | 12 | 45 |
| General cropping | 43 | 16 | 41 |
| Dairy | 71 | 29 | 0 |
| LFA Grazing Livestock | 83 | 14 | 2 |
| Lowland Grazing Livestock | 71 | 25 | 4 |
| Pigs | 60 | 10 | 30 |
| Poultry | 42 | 8 | 51 |
| Mixed | 77 | 22(a) | (a) |
| Horticulture | 5 | 3 | 92 |
| All farms | 57 | 17 | 26 |
(a) For these categories ‘Data estimated from farmer information’ and ‘No fertiliser usage’ have been merged due to insufficient observations. The combined value is shown in the ‘Data estimated from farmer information’ cell.