Balance sheet analysis and farming performance, England 2020/21 - statistics notice
Updated 27 March 2024
Applies to England

© Crown copyright 2024
This publication is licensed under the terms of the Open Government Licence v3.0 except where otherwise stated. To view this licence, visit nationalarchives.gov.uk/doc/open-government-licence/version/3 or write to the Information Policy Team, The National Archives, Kew, London TW9 4DU, or email: psi@nationalarchives.gov.uk.
Where we have identified any third party copyright information you will need to obtain permission from the copyright holders concerned.
This publication is available at https://www.gov.uk/government/statistics/historic-balance-sheet-analysis-and-farming-performance-england/balance-sheet-analysis-and-farming-performance-england-202021-statistics-notice
Key results
- In 2020/21 the average (mean) level of liabilities (debt) across all farms was £246,100, a small decrease from 2019/20.
- The average net worth across all farms was £1.94 million, a small increase on 2019/20. Forty-one percent of farms had a net worth of at least £1.5 million.
- The average gearing ratio across all farms was 11%, which is a figure largely unchanged over the last decade.
- The average liquidity ratio was 262%, which marked the third year of consecutive increases to a 10-year high.
- Net interest payments were 10% of Farm Business Income (FBI), a small decrease on 2019/20.
- The median ROCE was -0.2% in 2020/21. This has changed little over the last 9 years, although there was a wide range of values across farms and over half (52%) of farms had a negative return.
1 Liabilities
This section examines the indebtedness of farm businesses, as measured by their total liabilities. Liabilities are the total debt (short-term and long-term) that the farm business holds, including mortgages, long term loans and monies owed for hire purchases, leasing and overdrafts. A farm with high levels of liabilities will require consistent income flows to ensure that interest payments can be met.
Figure 1.1 Average liabilities per farm, in current values and real terms (2020/21 prices) all farms, England 2011/12 to 2020/21(a)(b)(c)
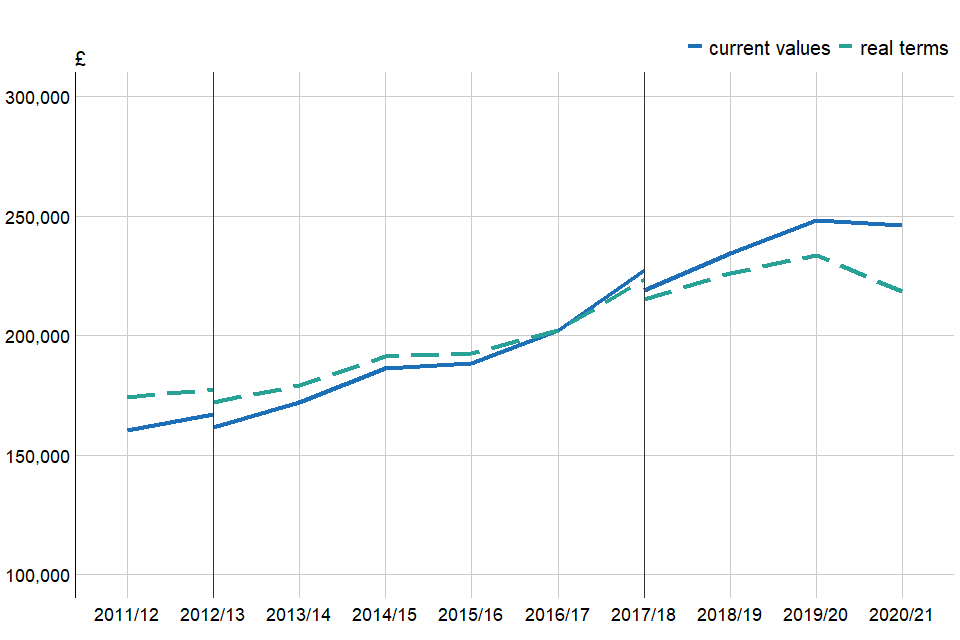
(a) Farms shown have at least 25,000 euros of Standard Output.
(b) Real terms figures are deflated by GDP.
(c) Standard output coefficients were updated in 2012/13, and 2017/18 using 5 year averages centred on 2010 and 2013 respectively. Figures prior to 2012/13 were based on a 5 year average centred on 2007. Results for the two transition years have been calculated using old and new coefficients for comparability and are denoted by the vertical black lines.
The average level of debt across all farms in 2020/21 was around £246,100, a small decrease from the previous year (Figure 1.1). In real terms, the decrease is more pronounced, and is driven by the marked increase in GDP inflation. The component parts of average liability per farm in 2020/21 are shown in Figure 1.2. Bank and institutional loans are the largest components of any liabilities, and this overall composition has changed little in recent years.
Figure 1.2 The composition of liabilities (£ per farm) for the average farm, England 2020/21(a)
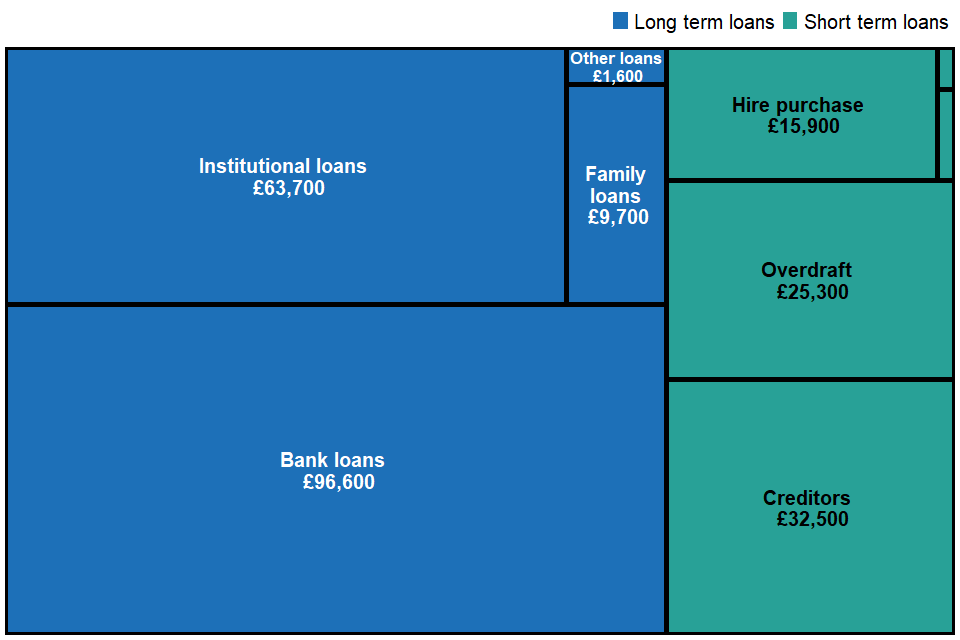
(a) The size of the box for each category is proportional to its contribution to the overall average liability per farm. The ‘Other short term loans’ and ‘Leasing’ categories (top right) are too small to be captioned in the plot, their contributions are £700 and £300 per farm respectively.
While farms in the lowest economic performance band saw liabilities fall for a second year, compared to other performance bands, they have maintained a broadly similar level for the last 10 years (Figure 1.3). High economic performance farms fell below medium performance farms for the first time since 2013/14, but the gap between these two categories and low performance farms is still substantial.
Figure 1.3 Average liabilities per farm, by farm economic performance band, England 2011/12 to 2020/21(a)
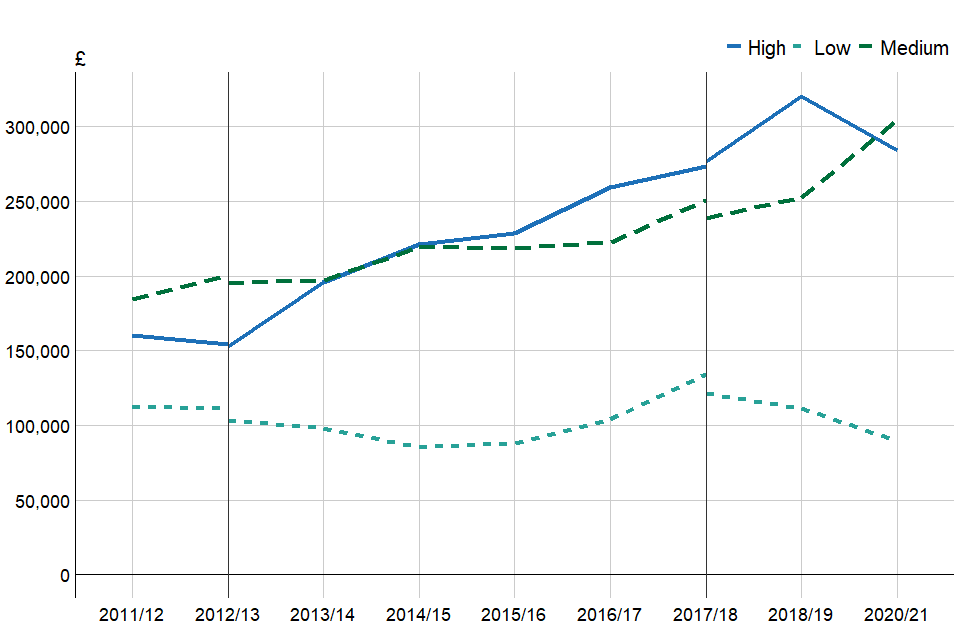
(a) Standard output coefficients were updated in 2012/13 and 2017/18 using 5 year averages centred on 2010 and 2013 respectively. Figures prior to 2012/13 were based on a 5 year average centred on 2007. Results for the two transition years have been calculated using old and new coefficients for comparability, and are denoted by the vertical black lines.
Generalised linear modelling was used to show that farm size, type and region were related to the level of farm debt in 2020/21.
In Figure 1.4 the relationship between farm type and liabilities is shown. For most farm types there is little change on 2019/20 figures. Specialist pigs and poultry farms had the highest average debts of £625,100 per farm, compared with LFA grazing livestock and lowland grazing livestock which had the lowest average debts of any farm type at £96,300 and £98,000 respectively. The latter two farm types also have the lowest farm business incomes of any farm type, further details of which can be found in our Farm Business Income publication.
Figure 1.4 Average liabilities (£ thousands per farm) by farm type, England 2019/20 and 2020/21(a)
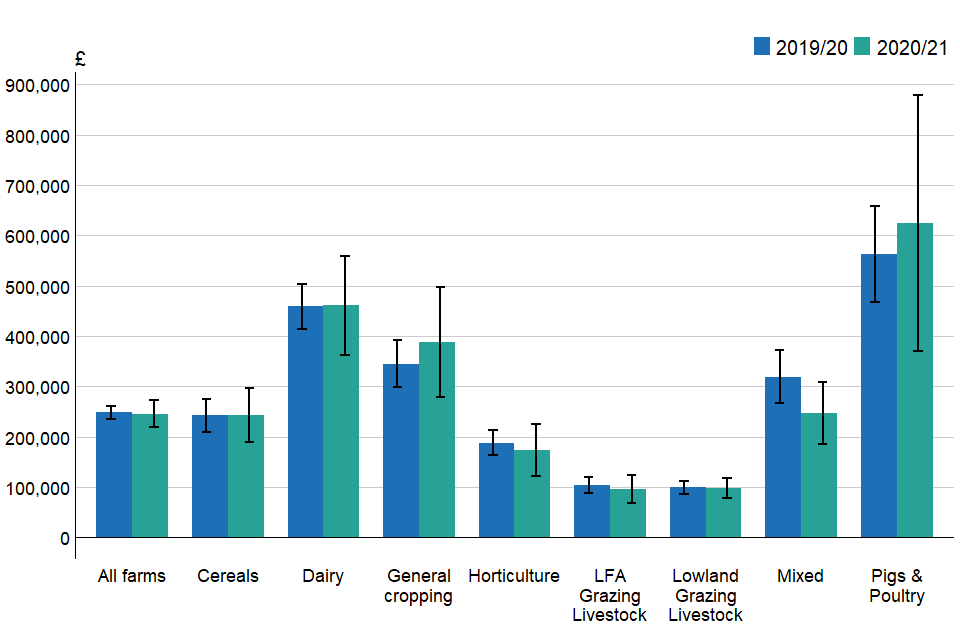
(a) Liability values are shown here with 95% confidence intervals. Pigs & poultry farms have notably larger confidence intervals, as the sample size is relatively small.
The component parts of average liability per farm in 2020/21 are shown in Figure 1.5: 17% of all farms had liabilities exceeding £400,000, with 24% owing less than £10,000. This has changed little on the previous four years. Figure 1.5 also shows the distribution of liabilities for each farm type. Sixty-two percent of dairy and nearly half (47%) of pigs and poultry farms had liabilities of at least £150,000, which has changed little on last year. Thirty nine percent of LFA grazing livestock farms, 33% of lowland grazing livestock farms and 36% of horticulture farms had liabilities of less than £10,000. In contrast, just 6% of dairy farms had liabilities of less than £10,000, reflecting the large differences between farm types which were identified by statistical modelling. Farm type was found to be a significant predictor of liability at the 95% confidence level.
Figure 1.5 Distribution of liabilities (per farm) by farm type, England 2020/21(a)
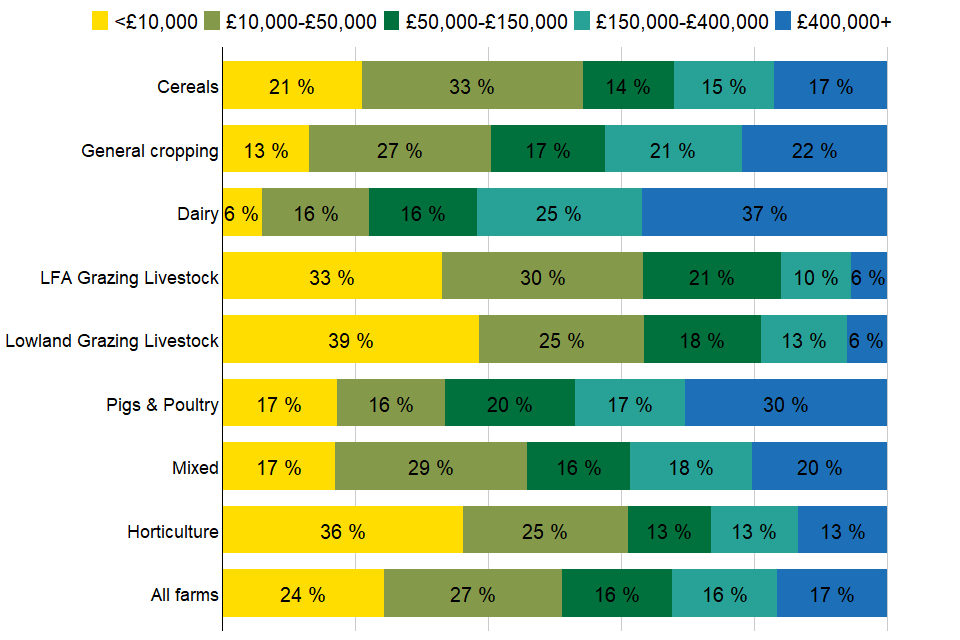
(a) Text is not displayed where proportions are below 5%.
In Figure 1.6 a striking pattern is displayed between liabilities and farm size. For farms with liabilities of below £10,000 and below £50,000, there is a monotonic decrease in the proportion of farms by farm size. The smaller the farm size category, the lower the liabilities. In terms of averages very large farms have liabilities of £873,500, while spare and part-time farms have liabilities of £78,400. When the farms’ area is taken into account spare and part-time, small and medium have similar liabilities per hectare, while large and very large farms have larger liabilities per hectare (Table 1.1). Very large farms have the highest average liabilities (£2,340 per hectare), while small farms have £1,240 of liabilities per hectare.
Figure 1.6 Distribution of liabilities (per farm) by farm size, England 2020/21(a)
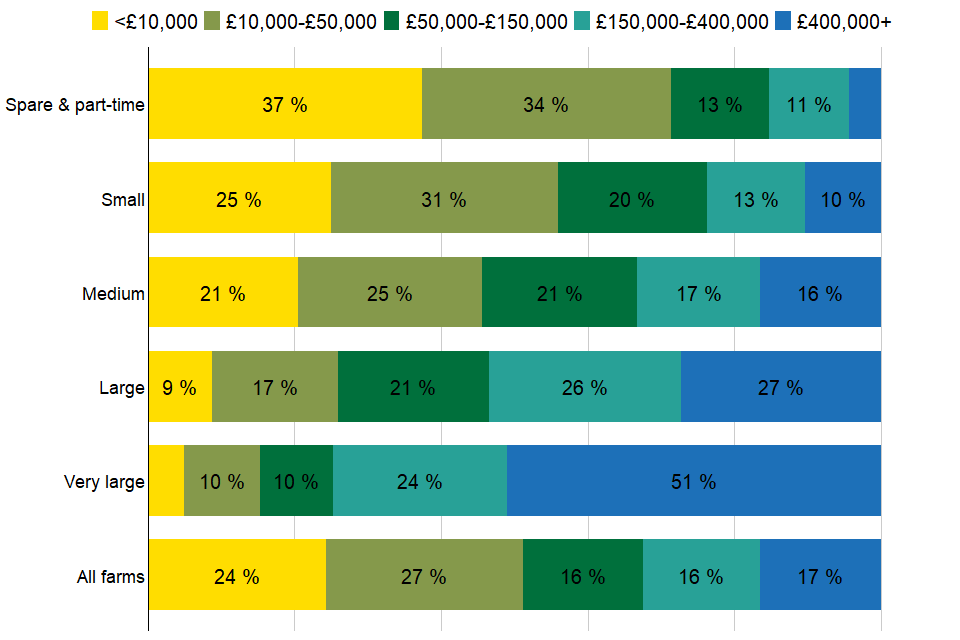
(a) Text is not displayed where proportions are below 5%.
Table 1.1 Average liabilities per hectare, by farm size, England, 2020/21
| Farm Size | Liabilities (£/ha) |
|---|---|
| Spare & part-time | 1250 |
| Small | 1240 |
| Medium | 1240 |
| Large | 1580 |
| Very large | 2340 |
| All | 1690 |
The average level of debt also varied by region across England, figures for which are available in the accompanying dataset. In general, farms in the North had lower debt levels than those in the South; farms within the East of England had the highest average debt level of around £366,400, whilst farms in the South West had the lowest average level of debt (£170,400).
2 Net Worth
This section examines the net worth of farm businesses in England. Net worth represents the wealth of a farm if all of their liabilities were called in. It is measured by subtracting the value of the total liabilities from total assets, including tenant type capital and land. Those farms with a high net worth are more likely to be resilient to changes in their income in the short term, as they can draw on their reserves to support the business if the financial position of the farm deteriorates.
Figure 2.1 Net worth calculation, England, 2020/21
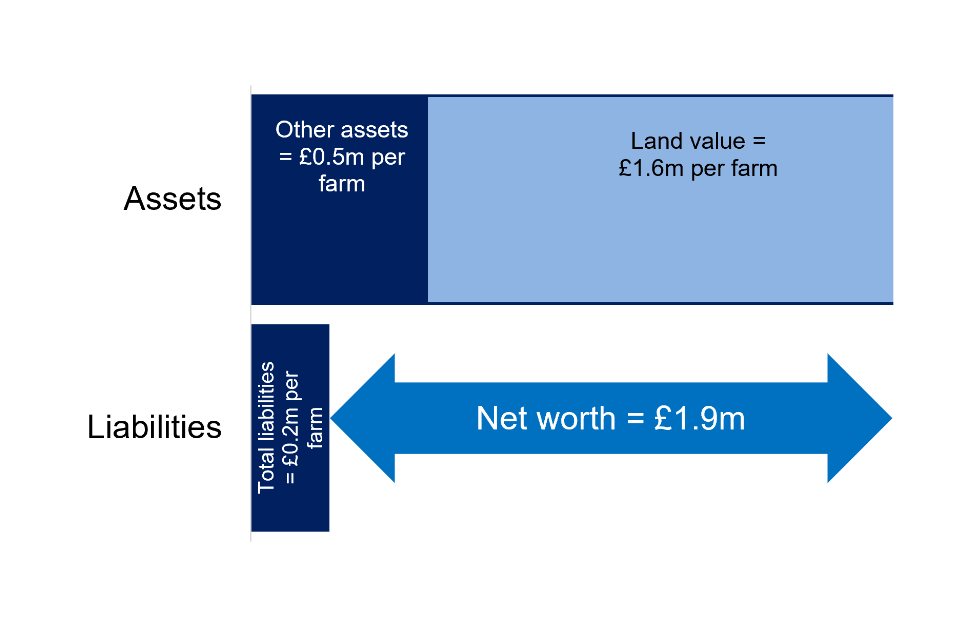
The average net worth across all farms in England was £1.94m in 2020/21 (Figure 2.1). There has been a general increase in both current prices and real terms since 2009/10 (Figure 2.2), driven mostly by an increase in the value of land and other assets. However, since 2017/18 the real terms value has stagnated and consequently the gap between real terms and current values has widened. Forty-one percent of farms had a net worth of at least £1.5 million in 2020/21, a 2% rise on 2019/20.
Figure 2.2 Average net worth per farm, in current values and real terms (2020/21 prices) all farms, England 2011/12 to 2020/21(a)(b)(c)
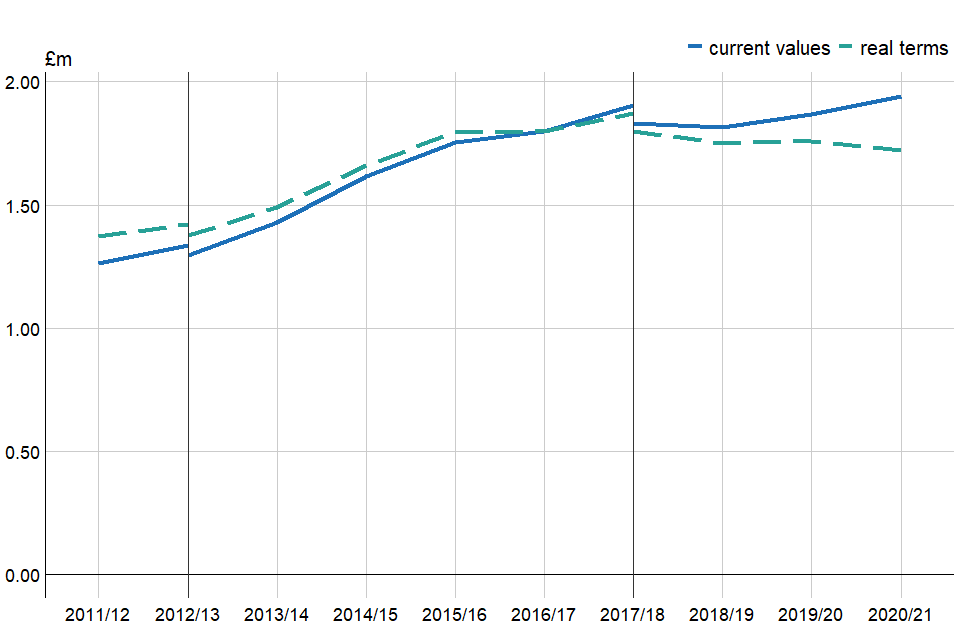
(a) Farms shown have at least 25,000 euros of Standard Output.
(b) Real terms figures are deflated by GDP.
(c) Standard output coefficients were updated in 2012/13, and 2017/18 using 5 year averages centred on 2010 and 2013 respectively. Figures prior to 2012/13 were based on a 5 year average centred on 2007. Results for the two transition years have been calculated using old and new coefficients for comparability and are denoted by the vertical black lines.
Generalised linear modelling was used to show that farm size, type, region tenancy type and economic performance band were related to the net worth of farms in 2020/21.
Farms in the lowest net worth categories (less than £0.5 million) were more likely to be smaller rather than larger farms. They were also more likely to be pigs and poultry or horticulture farms. They were more likely to be wholly tenanted farms than other tenancy options.
Those farms with greater net worths (at least £1.5 million) were more likely to be: large or very large farms; dairy, cereal or general cropping farms; to be in the South East of England; to be mixed-mainly owner occupied rather than tenanted, or to be economically high performance farms.
In general, farms with greater land ownership tend to have a greater net worth. For example, cereals and general cropping farms have the largest total area of owned land of any farm type on average. Farms that are of mixed tenure but mainly owner occupied had the greatest average net worth of £2.79 million, whilst wholly tenanted farms had an average net worth of £296,500. Average net worth has grown for each of tenure type since 2011/12 (Figure 2.3), though fully tenanted farms have grown relatively slowly. This relationship of tenancy type demonstrates the important contribution of land value to net worth.
Figure 2.3 Average net worth by farm tenure, England 2011/12 to 2020/21(a)
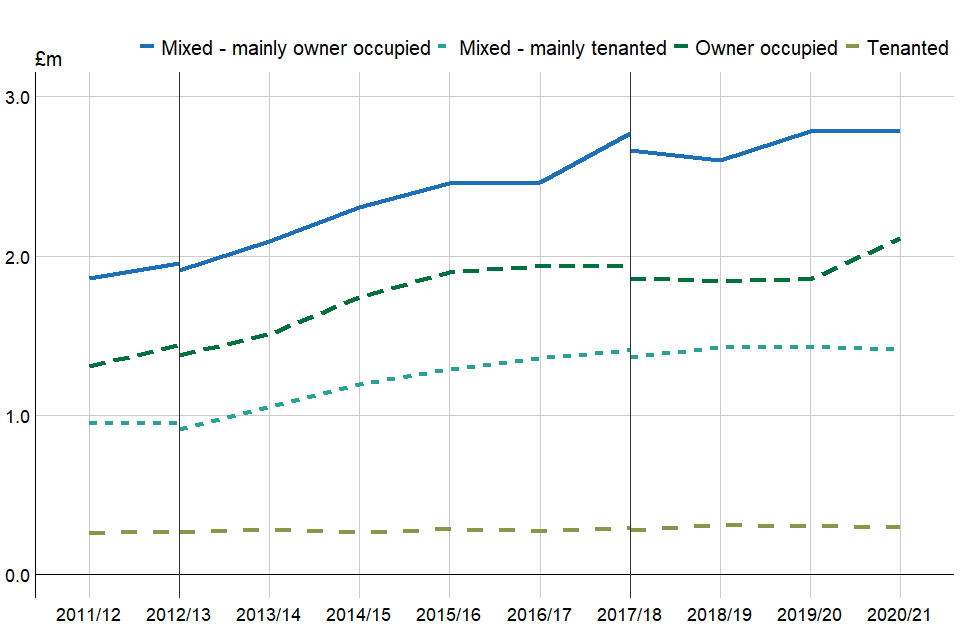
(a) Standard output coefficients were updated in 2012/13, and 2017/18 using 5 year averages centred on 2010 and 2013 respectively. Figures prior to 2012/13 were based on a 5 year average centred on 2007. Results for the two transition years have been calculated using old and new coefficients for comparability and are denoted by the vertical black lines.
For a definition of tenant type capital see the section on definitions
Figure 2.4 Distribution of net worth by farm type, England 2020/21(a)
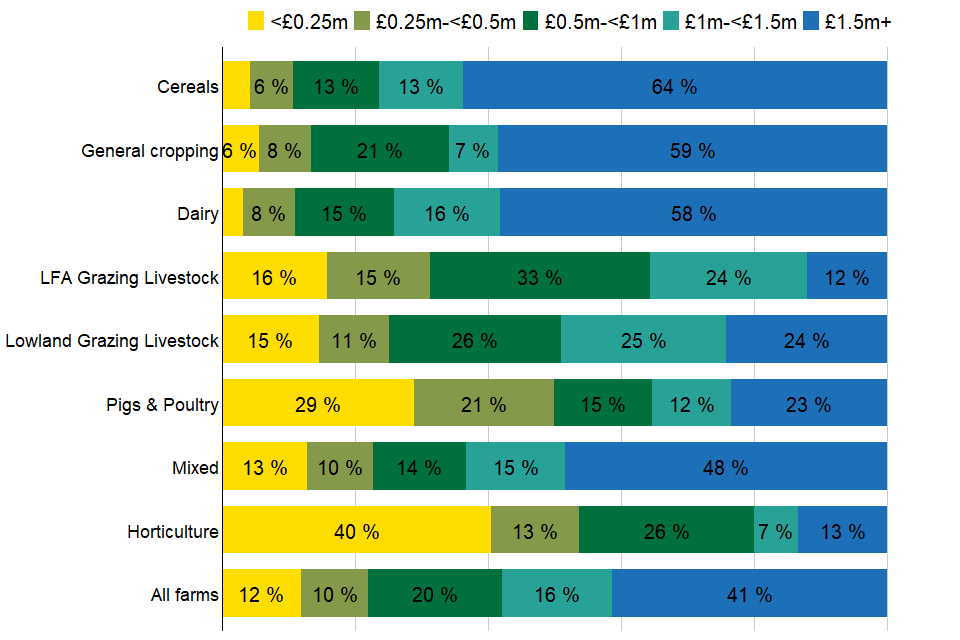
(a) Text is not displayed where proportions are below 5%.
Continuing a trend over several years, cereal and general cropping farms had the highest average net worth of all farm types, at £3.10 million and £2.92 million respectively, with the larger average area of land owned by these types of farms likely to be the main driver. Horticulture farms again had the lowest net worth at £760,000. However, if these farm types are compared on a per hectare basis, horticulture farms net worth is £37,600 per hectare, more than double that of cereals farms at £15,900 per hectare. LFA grazing livestock farms had the lowest average net worth per hectare at £5,800, though this was an increase of £700 per hectare on last year.
Per hectare is per hectare of farmed area, where
Farmed area = Utilised Agricultural Area + net land hired in (i.e. land hired in minus land hired out)^
Table 2.1 Average net worth per hectare, by farm size, England, 2020/21
| Farm Type | Net Worth (£/ha) |
|---|---|
| Cereals | 15900 |
| General cropping | 14600 |
| Dairy | 12700 |
| LFA Grazing Livestock | 5800 |
| Lowland Grazing Livestock | 13300 |
| Pigs & Poultry | 18300 |
| Mixed | 12800 |
| Horticulture | 37600 |
| All | 13500 |
Figure 2.5 Average net worth by farm size (£ millions per farm), England 2020/21(a)
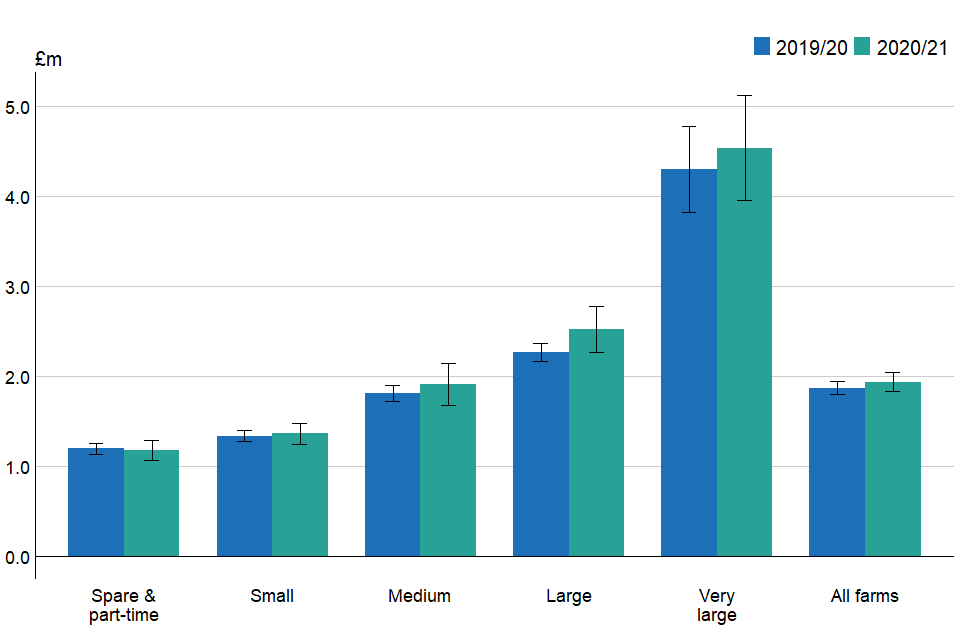
(a) Net worth values are shown here with 95% confidence intervals.
As with liabilities, the average net worth of farms increases with farm size (Figure 2.5); from £1.17 million for spare and part-time farms, to £4.5 million for very large farms. The proportion of farms with a net worth of over £1.5 million increases with the size of the farm business, from 30% of spare and part-time farms to 70% of very large farms (Figure 2.6). However, this relationship between net worth and farm size does not hold on a per hectare basis. Spare and part-time farms have an average net worth of £18,900 per hectare compared to £12,400 for very large farms.
Figure 2.6 Distribution of net worth by farm size, England 2020/21(a)
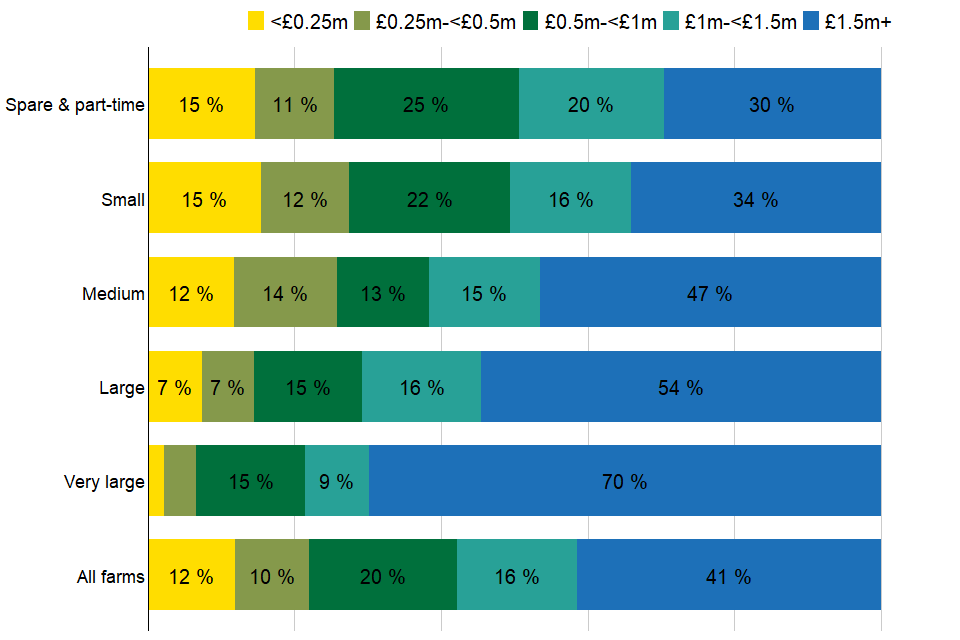
(a) Text is not displayed where proportions are below 5%.
3 Gearing ratio
In order to get a deeper understanding of the indebtedness of a farm we can compare what the farm business owes (its liabilities) with the assets that the owners have tied up in the business. An accounting measure is used which expresses a farm’s liabilities as a proportion of its assets, sometimes referred to as the gearing ratio (Figure 3.1).
If a farm has assets equal to its liabilities, this will give a gearing ratio value of 100%, and if their assets are twice as large as its liabilities, the gearing ratio will be 50%. This provides a measure of the long term financial viability of a farm. A lower ratio is generally seen as more acceptable because this suggests that the farm business is more likely to be able to meet its investment needs from earnings. A higher ratio may be seen as a greater risk as interest costs will be higher and the farm will have lower funds to borrow against. However, being highly geared does not necessarily imply an unsuccessful business. Investment can increase profitability, so increasing the gearing ratio can lead to better performance.
Figure 3.1 Gearing ratio calculation, England 2020/21
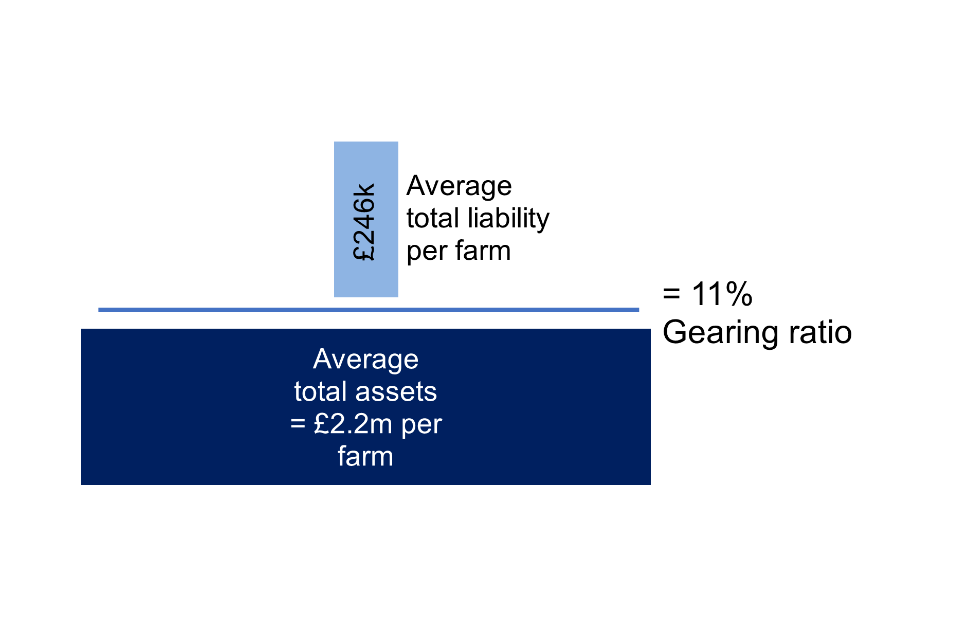
Figure 3.2 Average gearing ratio (%) per farm, all farms and selected farm types, England 2011/12 to 2020/21(a)
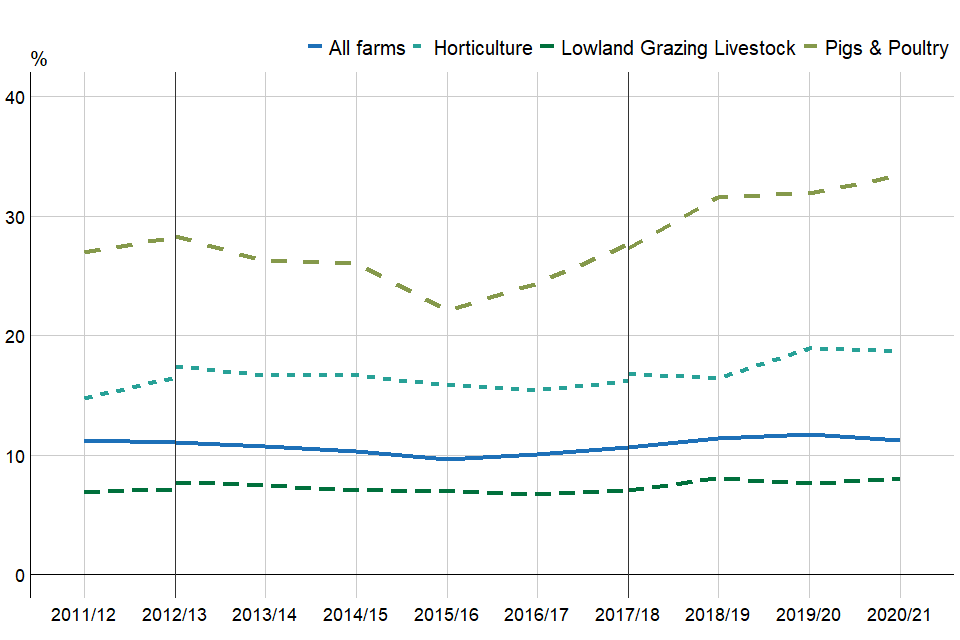
(a) Standard output coefficients were updated in 2012/13, and 2017/18 using 5 year averages centred on 2010 and 2013 respectively. Figures prior to 2012/13 were based on a 5 year average centred on 2007. Results for the two transition years have been calculated using old and new coefficients for comparability and are denoted by the vertical black lines.
The average gearing ratio for all farms in 2020/21 has changed little from its value in 2011/12. Generally speaking, farms in England have large assets relative to their liabilities, and after 5 years of the average gearing ratio increasing, it decreased from 2019/20 to 2020/21.
Generalised linear modelling was used to show that farm size, type, and tenancy type were related to the gearing ratio of farms in 2020/21.
Pig and poultry farms continued to have the highest average gearing ratio (33%) in 2020/21 (Figure 3.2, Table 3.1), with 21% having a gearing ratio that exceeded 40% (Figure 3.3). This is substantially higher than the next highest average farm type which was Dairy farms at an 19% average gearing ratio. Cereals, grazing livestock (LFA and lowland) and general cropping farms all had lower average gearing ratios, each at or below 12%.
Table 3.1 Average gearing ratio (%) per farm, by farm type, England, 2020/21
| Farm Type | Gearing Ratio |
|---|---|
| All farms | 11 |
| Cereals | 7 |
| General cropping | 12 |
| Dairy | 19 |
| LFA Grazing Livestock | 10 |
| Lowland Grazing Livestock | 8 |
| Pigs & Poultry | 33 |
| Mixed | 11 |
| Horticulture | 19 |
Figure 3.3 Distribution of Gearing Ratio by farm type, England 2020/21
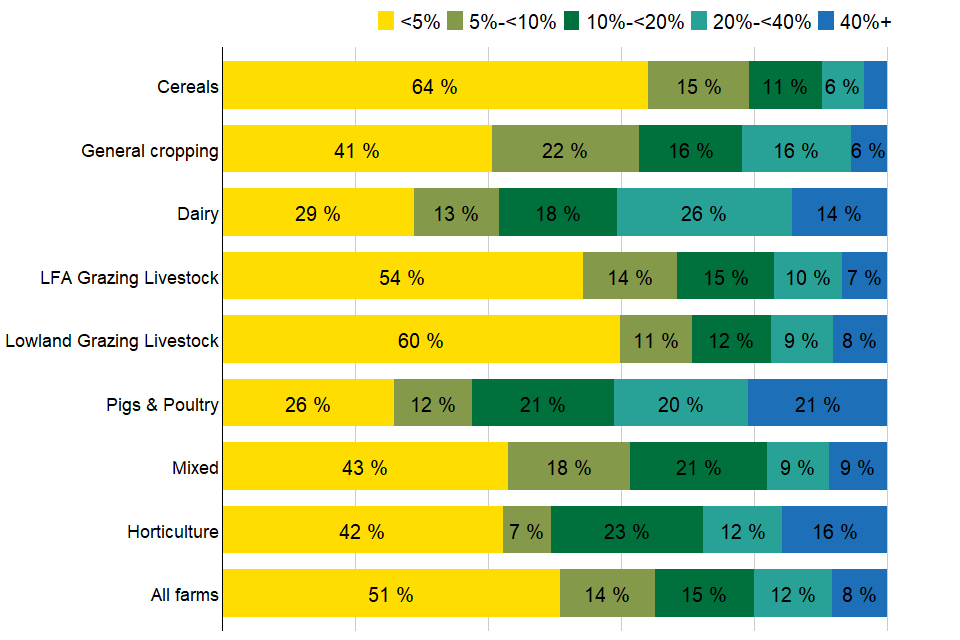
(a) Text is not displayed where proportions are below 5%.
The average gearing ratio increased with farm size, from 6% for spare and part-time farms to 16% for very large farms, with little difference on 2019/20.
Figure 3.4 Distribution of Gearing Ratio by farm size, England 2020/21(a)
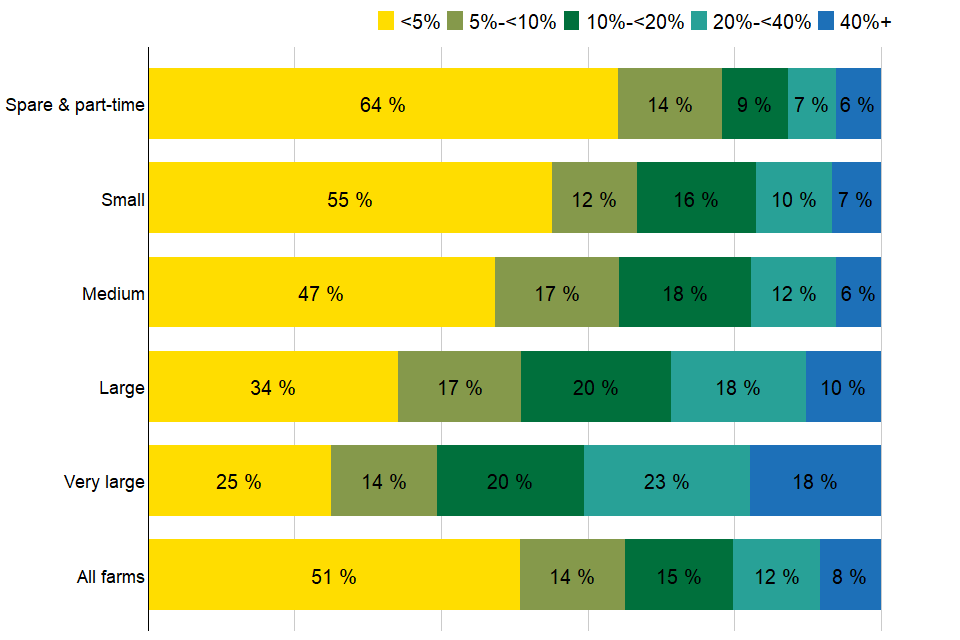
(a) Text is not displayed where proportions are below 5%.
The gearing ratio tends to reduce with the level of land ownership, a pattern which is consistent over the last ten years (Figure 3.5). Tenanted farms had an average gearing ratio of 26% whilst owner occupied farms had an average gearing ratio of 8%. Just 4% of owner occupied and 5% of mixed – mainly owner occupied farms had a gearing ratio of 40% or more, compared to around a fifth (20%) of tenanted farms (Figure 3.5). These findings highlight the importance of the value of land in contributing to owner occupied and mixed tenure farms’ asset base.
Those farms with lower liabilities also tended to have a lower gearing ratio. Almost all (98%) of those farms with less than £10,000 liabilities, had a gearing ratio of less than 5%. This indicates that these farms are in a favourable situation as they have a very small amount of liabilities compared to assets. However, of those farms with at least £400,000 of liabilities, a 31% had a gearing ratio of over 40%. By itself, as previously mentioned, a high gearing ratio is not necessarily a marker of a less successful business.
Figure 3.5 Average gearing ratio (%) per farm by farm tenure, England 2011/12 to 2020/21(a)
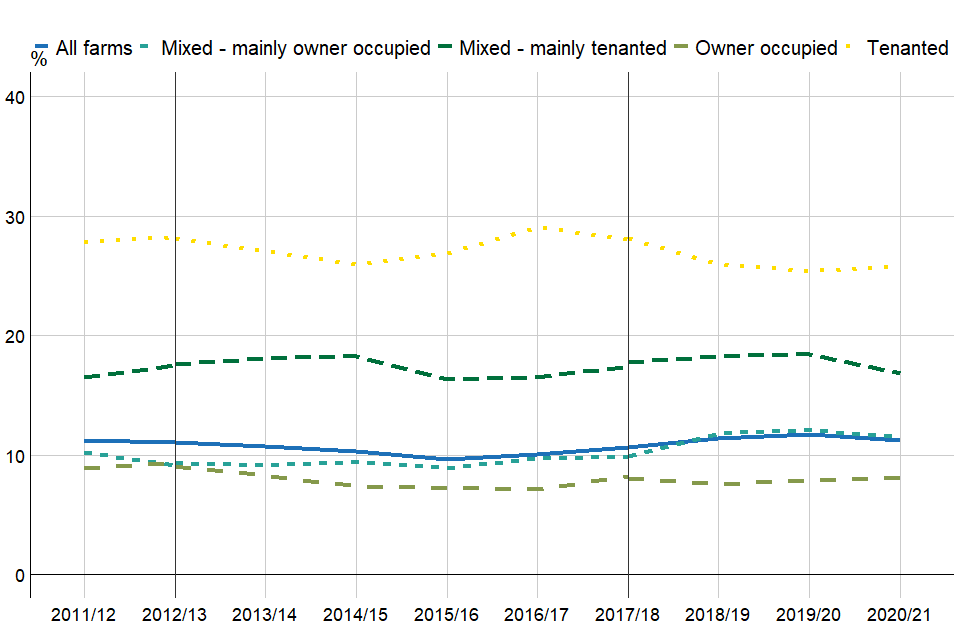
(a) Standard output coefficients were updated in 2012/13, and 2017/18 using 5 year averages centred on 2010 and 2013 respectively. Figures prior to 2012/13 were based on a 5 year average centred on 2007. Results for the two transition years have been calculated using old and new coefficients for comparability and are denoted by the vertical black lines.
Figure 3.6 Distribution of Gearing Ratio by farm tenure, England 2020/21(a)
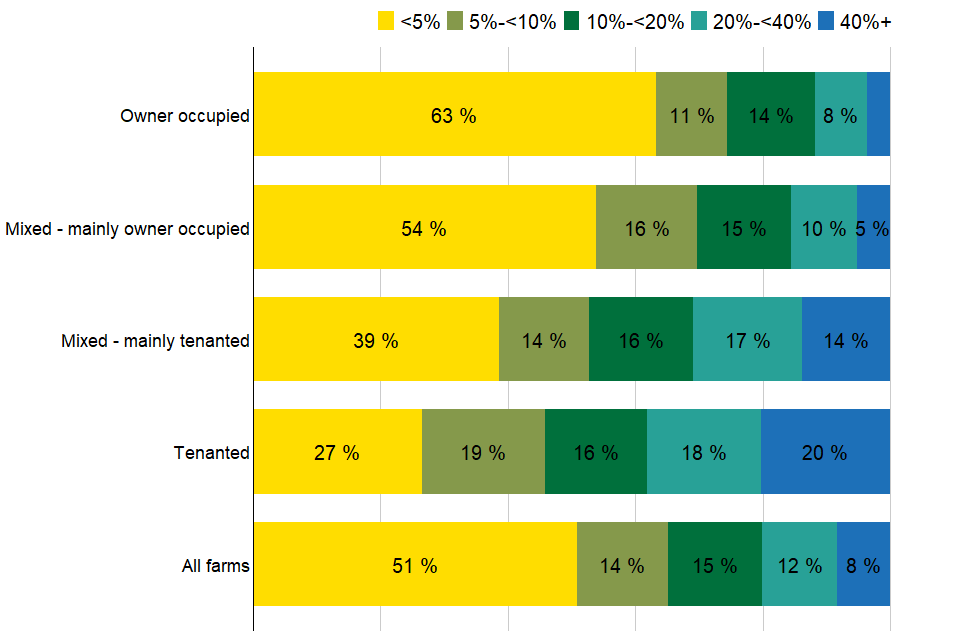
(a) Text is not displayed where proportions are below 5%.
Those farms with higher net worth also tended to have a lower gearing ratio. Of those farms with a net worth of under £250,000, 31% had a gearing ratio of over 40%, compared to 3% of farms with a net worth of over £1.5 million. Similarly, almost a quarter (26%) of farms with a net worth of under £250,000 had a gearing ratio of under 5%, compared to over half (51%) of farms with a net worth of at least £1.5 million.
4 Liquidity
‘Liquidity’ is a measure of the short term financial viability of farms. A large proportion of the assets of a farm, such as land or machinery, will typically have a monetary value that is difficult or costly to realise in the short term. The liquidity ratio provides an indication of the ability of a farm to finance its immediate financial demands from its current assets (i.e. those which can be realised easily, excluding land or machinery), such as cash, savings or stock (Figure 4.1).
If the liquidity ratio is equal to or above 100%, then a farm is able to meet its current liabilities using current assets. If the ratio is less than 100%, then a farm is unable to meet its immediate financial demands using current assets.
Figure 4.1 Liquidity ratio calculation, England 2020/21
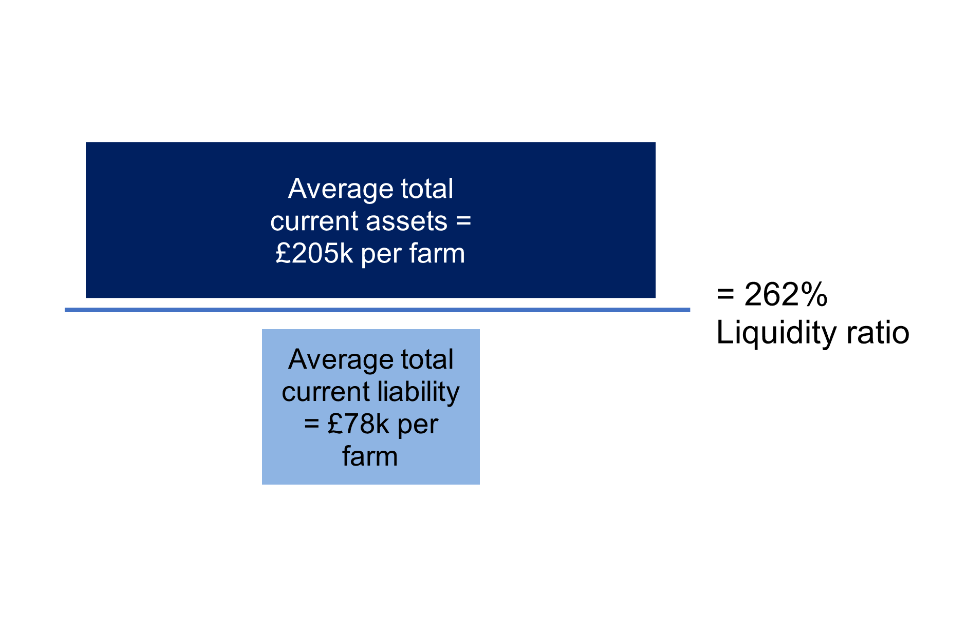
The average liquidity ratio of farm businesses in England has increased for the third year in a row to 262% in 2020/21 (Figure 4.2). The majority of farms continue to have a strong liquidity ratio; 72% had a ratio of at least 200%, suggesting that they could easily cover their immediate financial demands with their current assets.
Figure 4.2 Average liquidity ratio (%) per farm, England 2011/12 to 2020/21(a)
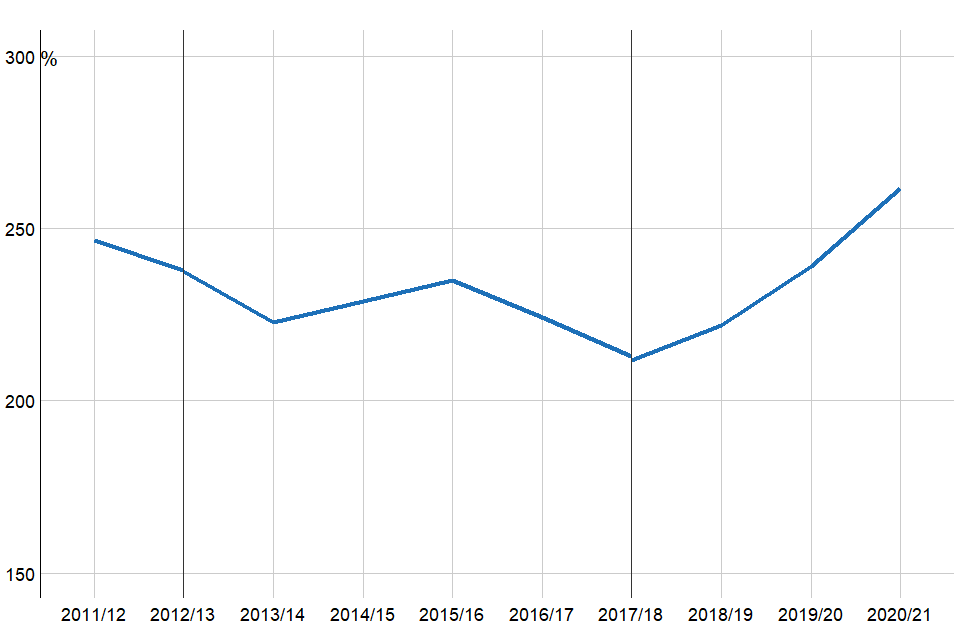
(a) Standard output coefficients were updated in 2012/13, and 2017/18 using 5 year averages centred on 2010 and 2013 respectively. Figures prior to 2012/13 were based on a 5 year average centred on 2007. Results for the two transition years have been calculated using old and new coefficients for comparability and are denoted by the vertical black lines.
Generalised linear modelling was used to show that farm size, type, economic performance band and tenancy type were related to the liquidity ratio of farms in 2020/21.
Fifteen percent of farms had a liquidity ratio below 100% (Figure 4.3), the point at which current assets do not cover liabilities (debts). Dairy (31%) farms are most likely to be in this situation, a situation unchanged on the last two years.
Figure 4.3 Distribution of liquidity ratio by farm type, England 2020/21(a)
(a) Text is not displayed where proportions are below 5%.
Cereals and grazing livestock farms (lowland) had the highest average liquidity ratios at 371% and 335% respectively. This represents a large gain in liquidity ratio for cereals farms since 2018/19 when their average was 228%. Pigs and poultry farms saw an increase from 132% to 158%, and in 2020/21 dairy farms had the lowest average liquidity ratio of 155%.
In general, the average liquidity ratio of a farm decreases with farm size, with very large farms having the smallest average ratio of any size at 212%. Though spare and part-time farms had 78% of farms with a liquidity ratio of at least 200%, very large farms still had over 60% of farms meeting this criteria (Figure 4.4).
Figure 4.4 Distribution of liquidity ratio by farm size, England 2020/21(a)
(a) Text is not displayed where proportions are below 5%.
Seventeen percent of low economic performance farms also have liquidity ratios below 100%, while just 11% of high economic performance farms do (Figure 4.5). This gap between low and high performance farms has narrowed since 2018/19.
Figure 4.5 Distribution of liquidity ratio by economic performance band, England 2020/21(a)
(a) Text is not displayed where proportions are below 5%.
Those farms in the high economic performance band (the top 25% of farms) had a higher average liquidity ratio (401%) compared to those in the low economic performance band (231%), which was a larger gap than recent years. However, medium performance bands had the lowest average liquidity ratio (206%), though this is an increase and is closer to the low performance band than the same figures in 2019/20. As with recent years, the associated confidence intervals are relatively large, so caution should be taken over the interpretation of this change. Around three fifths (60%) of farms in the high economic performance band had a liquidity ratio of 200% or more (Figure 4.5).
5 Net Interest payments as a proportion of Farm Business Income (FBI)
This section examines net interest payments as a proportion of FBI (Figure 5.1). This measure provides an indication of whether farms can afford to pay the interest on their debts.
Due to Farm Business Income (FBI) including net interest payments as a cost, for this measure we have used FBI before deducting net interest.
Figure 5.1 Net interest as a proportion of FBI calculation, England 2020/21(a)
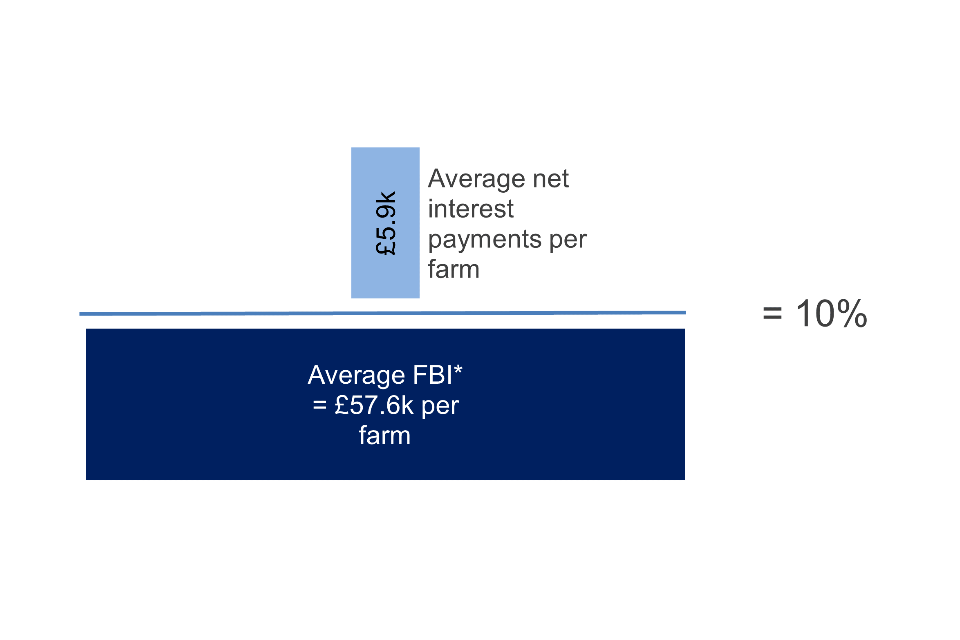
(a) For this measure FBI is calculated before deducting net interest payments.
Net interest payments were, on average, 10% of FBI in 2020/21, a fall of 3% on 2019/20. This proportion steadily increased from 2011/12 to 2015/16 as net interest payments increased whilst FBI fell (Figure 5.2) and has stagnated since.
Figure 5.2 Average net interest payments as a proportion of FBI, England 2011/12 to 2020/21(a)(b)
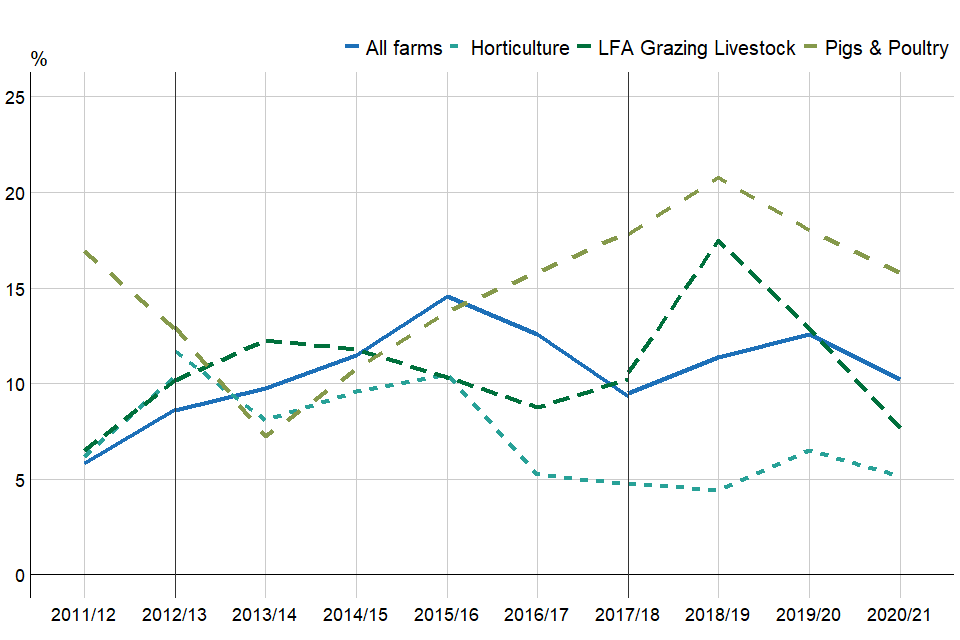
(a) Farms shown have at least 25,000 euros of Standard Output.
(b) Standard output coefficients were updated in 2012/13, and 2017/18 using 5 year averages centred on 2010 and 2013 respectively. Figures prior to 2012/13 were based on a 5 year average centred on 2007. Results for the two transition years have been calculated using old and new coefficients for comparability and are denoted by the vertical black lines.
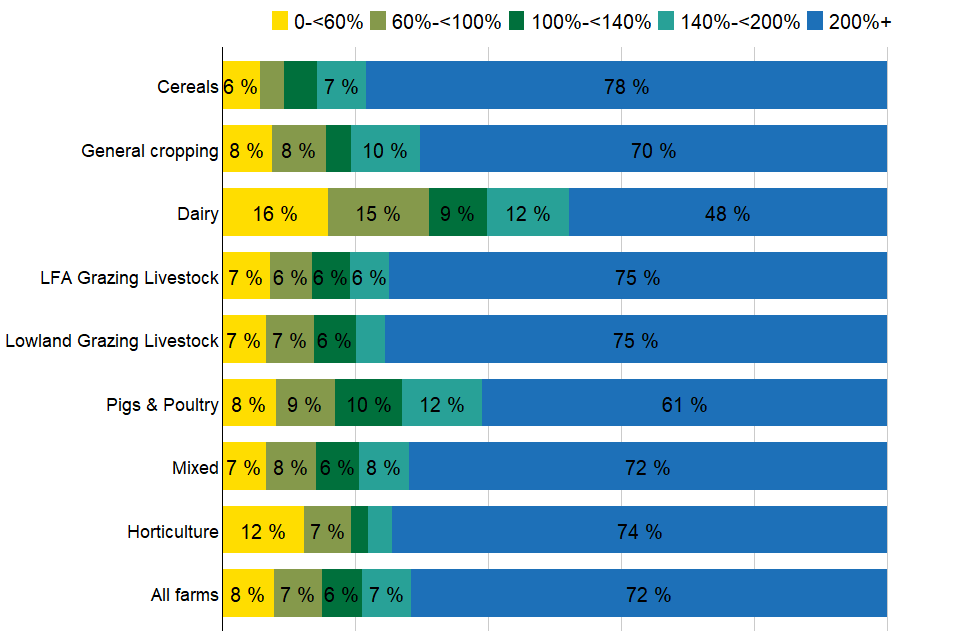
In 2020/21 the farm types with the greatest net interest payments as a proportion of FBI were pigs and poultry farms (16%) and mixed farms (13%), and least for horticulture farms (5%)(Figure 5.2). Average FBI for all farm types rose in 2020/21 after two years of decreases and was the main driver in this net interest metric decreasing this year. In particular grazing livestock farms saw large increases in FBI from 2019/20, contributing to the large decrease in net interest payments this year. For more information on FBI please see our Farm Business Income publication.
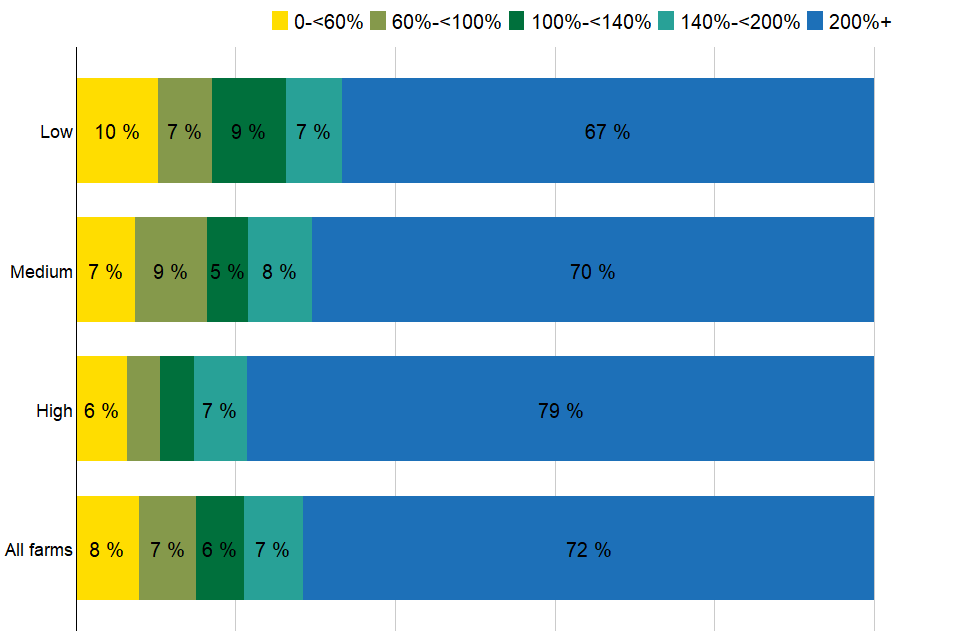
Figure 5.3 Distribution of net interest payments as a proportion of FBI by farm type, England 2020/21(a)
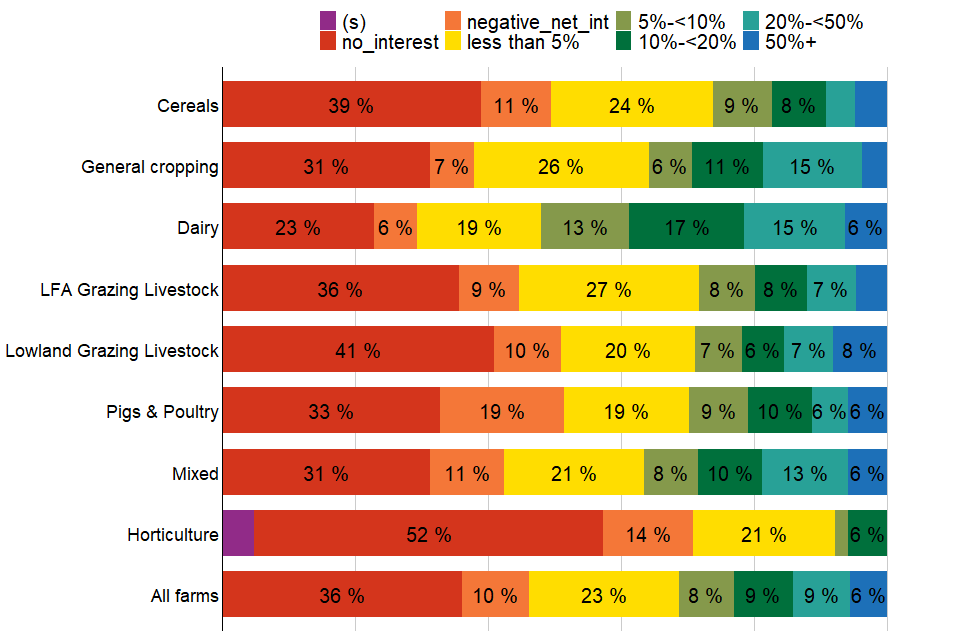
(a) Text is not displayed where proportions are below 5%.
(b) Where two categories have been merged due to low observation numbers, a suppressed category has been created and is labelled “(s)”.
In 2020/21, 36% of farm businesses paid no interest (i.e. had no loans) or the interest received (i.e. on savings or investments) was greater than the interest paid on loans. Over half (52%) of horticulture farms were in this group, compared to just 23% of dairy farms (Figure 5.3). Around a fifth (21%) of dairy farms paid net interest equivalent to 20% or more of their FBI, compared to around 5% of horticulture farms (Figure 5.3).
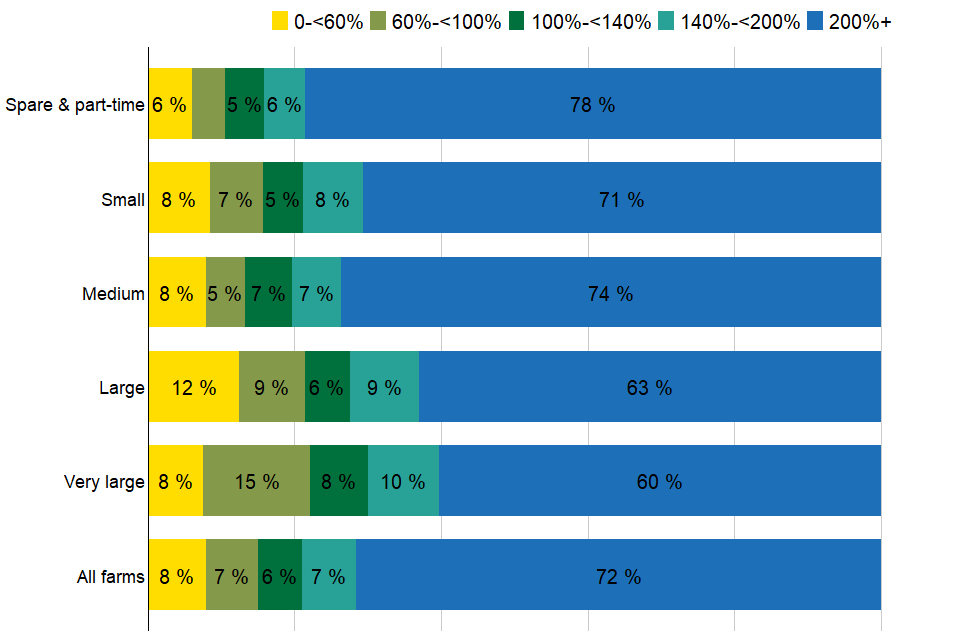
Figure 5.4 Distribution of net interest payments as a proportion of FBI by farm size, England 2020/21(a)
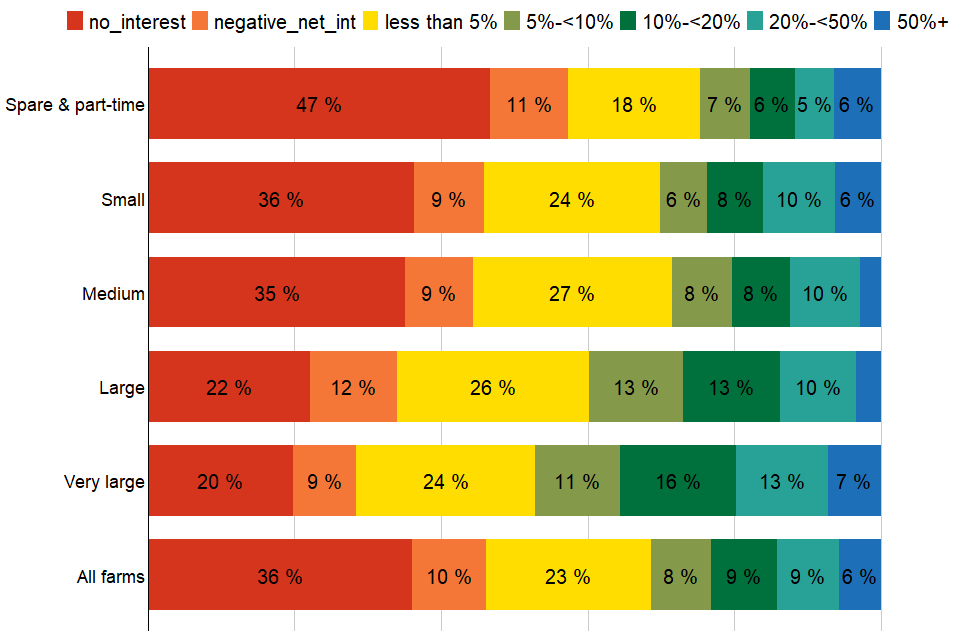
(a) Text is not displayed where proportions are below 5%.
A larger proportion of smaller farms had no interest received or paid no interest as a proportion of FBI than larger farms; 47% of spare and part-time farms had no interest received or paid no interest as a proportion of FBI, compared to 20% of very large farms. The proportion of farms who paid net interest equivalent to 20% or more of their FBI was about 15% for all farm sizes (Figure 5.4). Ten percent of farms already had a negative FBI (before interest payments) and would have been unable to pay some or all of the interest on their debts without further borrowing or drawing on their assets.
6 Return on Capital Employed
Return on capital employed (ROCE) is a measure of the return that a business makes from its available capital. ROCE provides a more holistic view than profit margins, focusing on efficient use of capital and low costs, allowing an equal comparison across farms of differing sizes. A positive ROCE value indicates that a farm is achieving an economic return on the capital used, while a negative ROCE value indicates that a farm is not achieving an economic return on the capital employed. ROCE is calculated using the following:
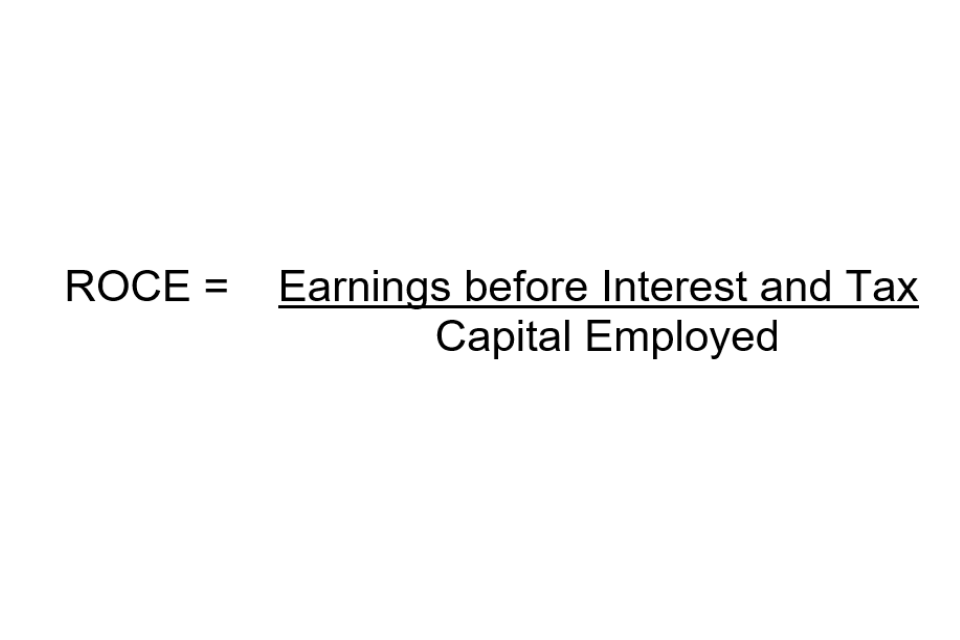
Earnings before Interest and Tax has been calculated using Defra’s main income measure, Farm Business Income (FBI), minus the imputed cost of all unpaid labour. Capital employed is the available amount that each farm could use to earn profit in the upcoming financial year. It has been calculated by subtracting current (i.e. short term) liabilities from total assets. Given the distribution of the ROCE measure, the average is most appropriately described using the median (shown below) rather than the mean. Both measures are presented in the accompanying workbook of results. Given the importance of land as an asset base for farming, an additional measure of ROCE has been investigated which excludes the value of land from assets.
Given the distribution of the ROCE measure, the most appropriate descriptive statistic is the median (shown in Figure 6.1) rather than the mean.
The median ROCE for all farm businesses declined between 2011/12 and 2015/16, but rose slightly in 2016/17 and 2017/18 to 0.2% (Figure 6.1) before returning to negative values in 2019/20 and 2020/21 (-0.2%). Over half (52%) of farms had a negative return, indicating that these businesses are not achieving an economic return on the capital employed. Around 5% of farms had a ROCE of over 10%.
Figure 6.1 Return on capital employed (ROCE, median values, %) per farm, England 2011/12 to 2020/21(a)(b)
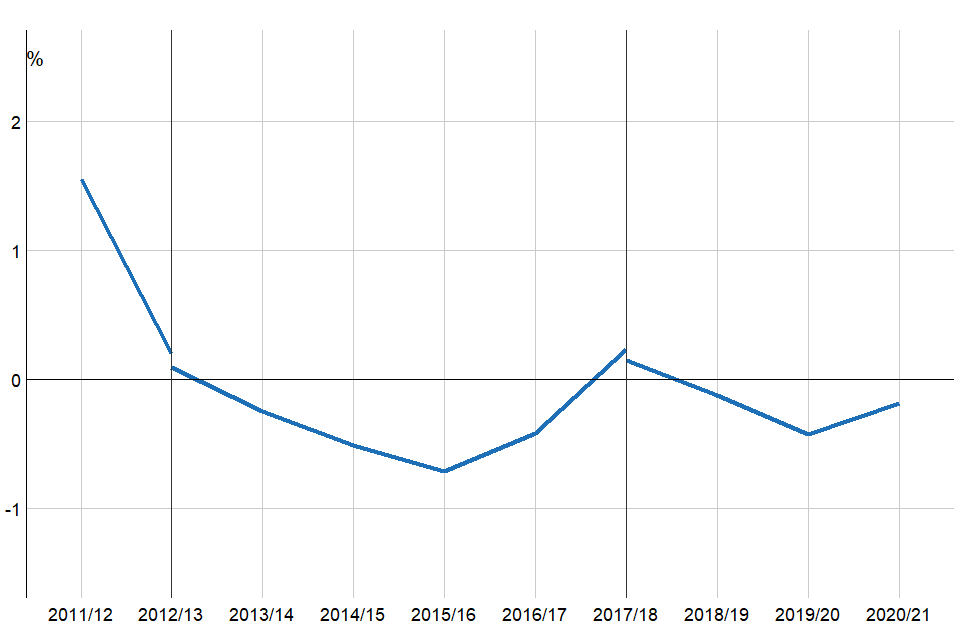
(a) Farms shown have at least 25,000 euros of Standard Output.
(b) Standard output coefficients were updated in 2012/13, and 2017/18 using 5 year averages centred on 2010 and 2013 respectively. Figures prior to 2012/13 were based on a 5 year average centred on 2007. Results for the two transition years have been calculated using old and new coefficients for comparability and are denoted by the vertical black lines.
Figure 6.2 Box plot showing spread of ROCE by farm size, England 2020/21(a)
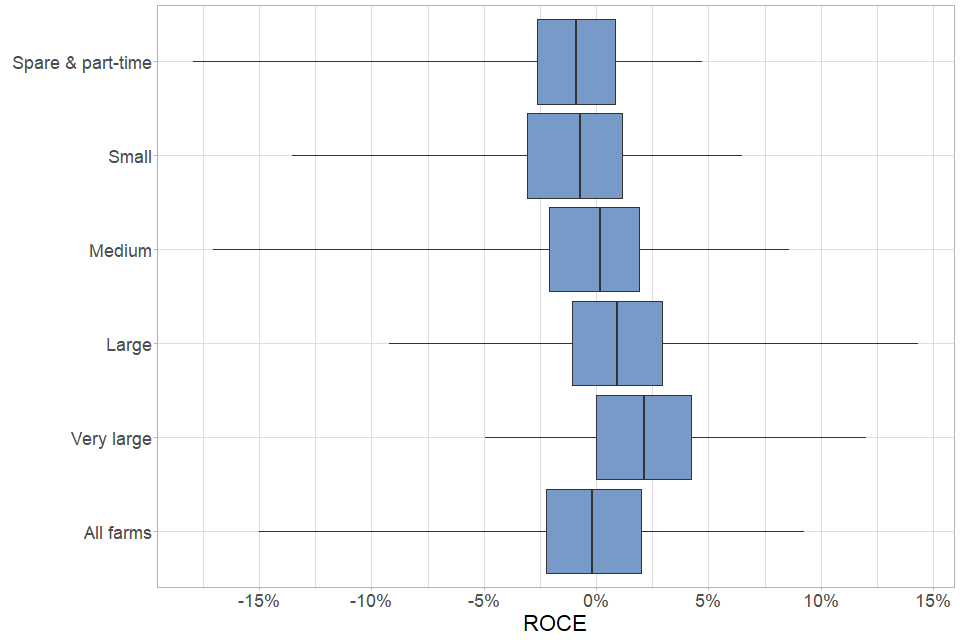
(a) Within each blue box, the vertical line represents the median ROCE, with the box itself showing the spread between the first and third quartiles. Thus 50% of farms lie within the range shown by the blue box. The horizontal lines to each side indicate the spread between the lowest 5% of farms and the top 5% of farms. Thus 90% of farms lie within the range indicated by the lines.
Generalised linear modelling was used to show that farm size, economic performance band, and region were related to ROCE in 2020/21.
Figure 6.2 shows the distribution of ROCE by farm size. The proportion of farms with a negative ROCE generally decreased as farm size increased. Median ROCE scores were related to farm economic performance (Figure 6.3). As with 2019/20, no high performing farms had negative ROCE, with a stark contrast against low performing farms where nearly all farms had a negative ROCE. Excluding land has no impact on these specific statistics.
Figure 6.3 Box plots showing spread of ROCE by economic performance band, England 2020/21(a)
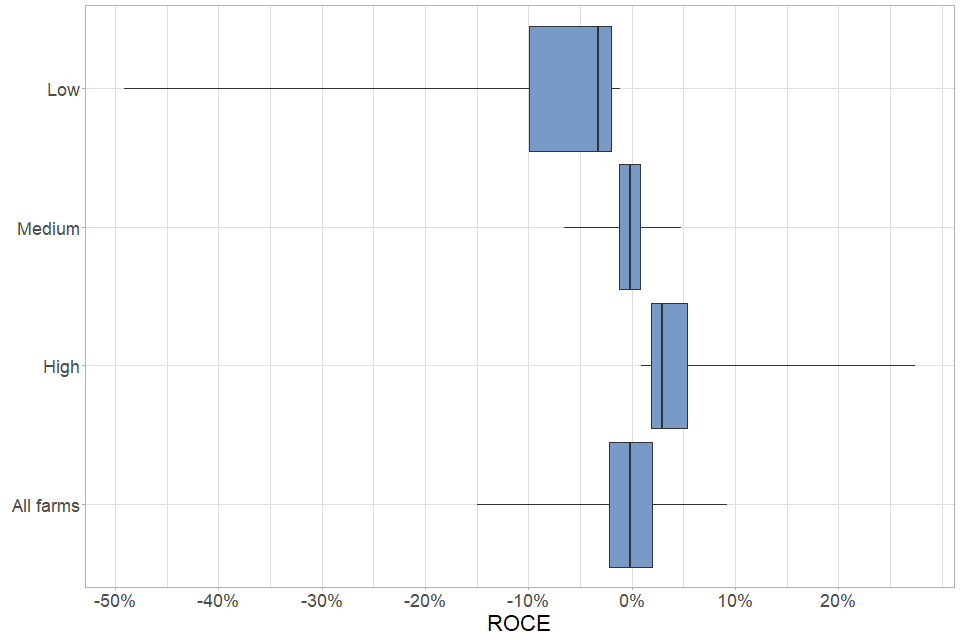
(a) Within each blue box, the vertical line represents the median ROCE, with the box itself showing the spread between the first and third quartiles. Thus 50% of farms lie within the range shown by the blue box. The horizontal lines to each side indicate the spread between the lowest 5% of farms and the top 5% of farms. Thus 90% of farms lie within the range indicated by the lines.
7 What you need to know about this release
7.1 Contact details
Responsible statistician: Sam Finlayson
Public enquiries: fbs.queries@defra.gov.uk
Room 201
Foss House
1-2 Peasholme Green
York
YO1 7PX
7.2 Key words
- Liabilities
- Net worth
- Gearing
- Liquidity
- Return on Capital Employed
- Farm Business Income
Definitions of these key words are provided in Section 8.
8 Survey details
8.1 Survey content and methodology
The Farm Business Survey (FBS) is an annual survey providing information on the financial position and physical and economic performance of commercial farm businesses in England. It covers all types of farming in all regions of the country and includes owner-occupied, tenanted and mixed tenure farms. The FBS only includes farm businesses with a Standard Output of at least €25,000, based on activity recorded in the previous June Survey of Agriculture and Horticulture. In 2020, this accounted for approximately 56,048 farm businesses. In 2016 the sample was reduced from 1800 to 1750 farm businesses. In 2019/20 and 2020/21 the samples were slightly smaller as a result of Covid-19 restrictions on data collection. Data are collected by face to face interviews with farmers, conducted by highly trained researchers.
Each record is given a weight to make the sample representative of the population. Initial weights are applied to the FBS records based on the inverse sampling fraction. These weights are then adjusted by calibrating certain totals to match published totals from other surveys so that they can be used to produce unbiased estimators of a number of different target variables. More detailed information about the Farm Business Survey, the data collected and information on calibration weighting can be found at our website.
8.2 Data analysis
The results from the FBS relate to farms which have a standard output of at least 25,000 Euros. Initial weights are applied to the FBS records based on the inverse sampling fraction for each design stratum (farm type by farm size). These weights are then adjusted (calibration weighting ) so that they can produce unbiased estimators of a number of different target variables. The data used for this analysis is from those farms present in the Farm Business Survey for 2011/12 to 2020/21 that have complete returns on their assets and liabilities. In 2020/21 this subsample consisted of 1,643 farms. This subsample has been reweighted using a method that preserves marginal totals for populations according to farm type and farm size groups. As such, farm population totals for other classifications (e.g. regions) will not be in-line with results using the main FBS weights, nor will any results produced for variables derived from the rest of the FBS (e.g. Farm Business Income).
8.3 Accuracy and reliability of the results
We show 95% confidence intervals against the results. These show the range of values that may apply to the figures. They mean that we are 95% confident that this range contains the true value. They are calculated as the standard errors (se) multiplied by 1.96 to give the 95% confidence interval (95% CI). The standard errors only give an indication of the sampling error. They do not reflect any other sources of survey errors, such as non-response bias. For the Farm Business Survey, the confidence limits shown are appropriate for comparing groups within the same year only; they should not be used for comparing with previous years since they do not allow for the fact that many of the same farms will have contributed to the Farm Business Survey in both years. We have also shown error bars on the figures in this notice. These error bars represent the 95% confidence intervals (as defined above).
8.4 Statistical methods
Generalised linear models were fitted to examine which of five predictive variables (farm type, size, tenure type, region and economic performance) were related to each of the response variables of interest (liability, gearing ratio, liquidity, interest payments as a proportion of FBI and ROCE). In each case the distribution of the response variable was examined, and if necessary log 10 or square-root transformed to conform to assumptions of normality. Where a binomial response variable was used (i.e. farms having a liquidity ratio of less than 100%) a binomial based Generalised linear model was fitted using a binomial error distribution and a logit link. No statistical model was fitted to the net worth, liquidity or net interest as a proportion of FBI data, as no suitable model structure was found for the data which satisfied assumptions of normality. In all instances a model simplification procedure was used; firstly all parameters were fitted and then a backwards stepwise approach was used to drop the non-significant terms. Where a parameter was of borderline significance the predictions were examined to see if there was a logical pattern and then judgement used to determine whether to retain or drop the parameter from the model. The fit of each model was inspected using plots of model residuals.
8.5 Availability of results
All Defra statistical notices can be viewed on the gov.uk site.
More publications and results from the Farm Business Survey are available here.
8.6 Data Uses
Data from the FBS are widely used by the industry for benchmarking and inform wider research into the economic performance of the agricultural industry, as well as for evaluating and monitoring current policies.
8.7 User engagement
As part of our ongoing commitment to compliance with the Code of Practice for Official Statistics, we wish to strengthen our engagement with users of these statistics and better understand the use made of them and the types of decisions that they inform. Consequently, we invite users to make themselves known, to advise us of the use they do, or might, make of these statistics, and what their wishes are in terms of engagement. Feedback on this notice and enquiries about these statistics are also welcome.
8.8 Definitions
Mean
The mean is found by adding up the weighted variable of interest (e.g. liabilities or net worth) for each individual farm in the sample for analysis and dividing the result by the corresponding weighted number of farms. In this report average is usually taken to refer to the mean.
Percentiles
These are the values which divide the population for analysis, when ranked by an output variable (e.g. ROCE or net worth), into 100 equal-sized groups. For example, twenty five percent of the population would have a net worth below the 25th percentile.
Median
The median divides the population, when ranked by an output variable, into two equal sized groups. The median of the whole population is the same as the 50th percentile.
Farm Type
Where reference is made to the type of farm in this document, this refers to the ‘robust type’, which is a standardised farm classification system. For this publication, pigs and poultry have been amalgamated into a single farm type category.
Farm Sizes
Farm sizes are based on the estimated labour requirements for the business, rather than its land area. The farm size bands used within the detailed results tables which accompany this publication are shown in the table below. Standard Labour Requirement (SLR) is defined as the theoretical number of workers required each year to run a business, based on its cropping and livestock activities.
Table 8.1: Farm size by Standard Labour Requirement (SLR)
| Farm size | Definition | |
| —————— | ———–Low performance band | farms in the bottom 25% of economic performers |
| Medium performance band | farms in the middle 50% of performers | |
| High performance band | farms in the top 25% of performers. |
Assets
Assets include milk and livestock quotas, as well as land, buildings (including the farm house), breeding livestock, and machinery and equipment. For tenanted farmers, assets can include farm buildings, cottages, quotas, etc., where these are owned by the occupier. Personal possessions (e.g. jewellery, furniture, and possibly private cash) are not included.
Net worth
Net worth represents the residual claim or interest of the owner in the business. It is the balance sheet value of assets available to the owner of the business after all other claims against these assets have been met. Net worth takes total liabilities from total assets, including tenant type capital and land. This describes the wealth of a farm if all of their liabilities were called in.
Liabilities
Liabilities are the total debt (short and long term) of the farm business including monies owed. It includes mortgages, long term loans and monies owed for hire purchase, leasing and overdrafts.
Tenant type capital
Tenant type capital comprises assets normally provided by tenants and includes livestock, machinery, crops and produce in store, stocks of bought and home-grown feeding stuffs and fodder, seeds, fertilisers, pesticides, medicines, fuel and other purchased materials, work in progress (tillages or cultivations), cash and other assets needed to run the business. Orchards, other permanent crops, such as soft fruit and hop gardens and glasshouses, are also generally considered to be tenant-type capital.
Return on capital employed (ROCE)
Return on capital employed (ROCE) is a measure of the return that a business makes from the available capital. ROCE provides a more holistic view than profit margins, focusing on efficient use of capital and low costs and allowing an equal comparison across farms of differing sizes. It is calculated as economic profit divided by capital employed.
Liquidity ratio
The liquidity ratio shows the ability of a farm to finance its immediate financial demands from its current assets, such as cash, savings or stock. It is calculated as current assets divided by the current liabilities of the farms.
Gearing ratio
The gearing ratio gives a farm’s liabilities as a proportion of its assets.
Utilised Agricultural Area (UAA)
Utilised Agricultural Area (UAA) is the crop area, including fodder, set-aside land, temporary and permanent grass and rough grazing in sole occupation (but not shared rough grazing) i.e. the agricultural area of the farm. It includes bare land and forage let out for less than one year.
Farm Business Income (FBI)
Farm Business Income (FBI) for sole traders and partnerships represents the financial return to all unpaid labour (farmers and spouses, non-principal partners and directors and their spouses and family workers) and on all their capital invested in the farm business, including land and buildings. For corporate businesses it represents the financial return on the shareholders capital invested in the farm business. Note that prior to 2008/09 directors remuneration was not deducted in the calculation of farm business income.
Farm Business Income is used when assessing the impact of new policies or regulations on the individual farm business. Although Farm Business Income is equivalent to financial Net Profit, in practice the measures are likely to differ because Net Profit is derived from financial accounting principles whereas Farm Business Income is derived from management accounting principles. For example in financial accounting output stocks are usually valued at cost of production, whereas in management accounting they are usually valued at market price. In financial accounting depreciation is usually calculated at historic cost whereas in management accounting it is often calculated at replacement cost.