DCMS Sectors Economic Estimates 2018: Business Births and Deaths
Published 9 July 2020

© Crown copyright 2020
This publication is licensed under the terms of the Open Government Licence v3.0 except where otherwise stated. To view this licence, visit nationalarchives.gov.uk/doc/open-government-licence/version/3 or write to the Information Policy Team, The National Archives, Kew, London TW9 4DU, or email: psi@nationalarchives.gov.uk.
Where we have identified any third party copyright information you will need to obtain permission from the copyright holders concerned.
This publication is available at https://www.gov.uk/government/statistics/dcms-sectors-economic-estimates-business-births-and-deaths/dcms-sectors-economic-estimates-2018-business-births-and-deaths
This release provides estimates of the number of business births (defined as newly-registered businesses) and business deaths (defined as businesses that have de-registered, or ceased trading) in the DCMS Sectors. It is a new set of statistics looking at the businesses in our sectors. Estimates on other business demographics concerning DCMS Sectors have been published annually in the last three years, most recently in May 2020.
These are part of a wider family of DCMS economic statistics (including gross value added, employment, trade etc.), which enable stakeholders to evaluate the economic contribution of DCMS sectors, which are not traditional National Account sectors, and to understand how current and future policy interventions can be most effective.
The DCMS sectors covered in this report are:
- Creative Industries
- Cultural Sector
- Digital Sector
- Gambling
- Sport
- Telecoms
- Tourism (defined here as the Tourism industries)
Civil Society is not covered in this release, as their sectors are not defined on the same basis.
Headline findings
- In 2018, there were 92,325 new businesses registered in the UK for DCMS Sectors, 24.3% of the total for all UK business births.
- London (26,730, 28.9% of the DCMS Sector total) had the most DCMS Sector business births, followed by the South East (13,575, 14.7%) and the North West (8,600, 9.3%).
- Correspondingly, 78,650 UK businesses in DCMS Sectors ceased trading in 2018, 23.4% of the total for all British business deaths.
- London (20,835, 26.5% of DCMS Sector total) had the most DCMS Sector business deaths, followed by the South East (11,550, 14.7%) and the North West (7,565, 9.6%).
- More business were created in DCMS sectors than closed for every year between 2010 and 2018. Net growth varied from 2,230 businesses in 2010 to a peak of 26,615 businesses in 2013. The 2018 figure for net growth was 13,675.
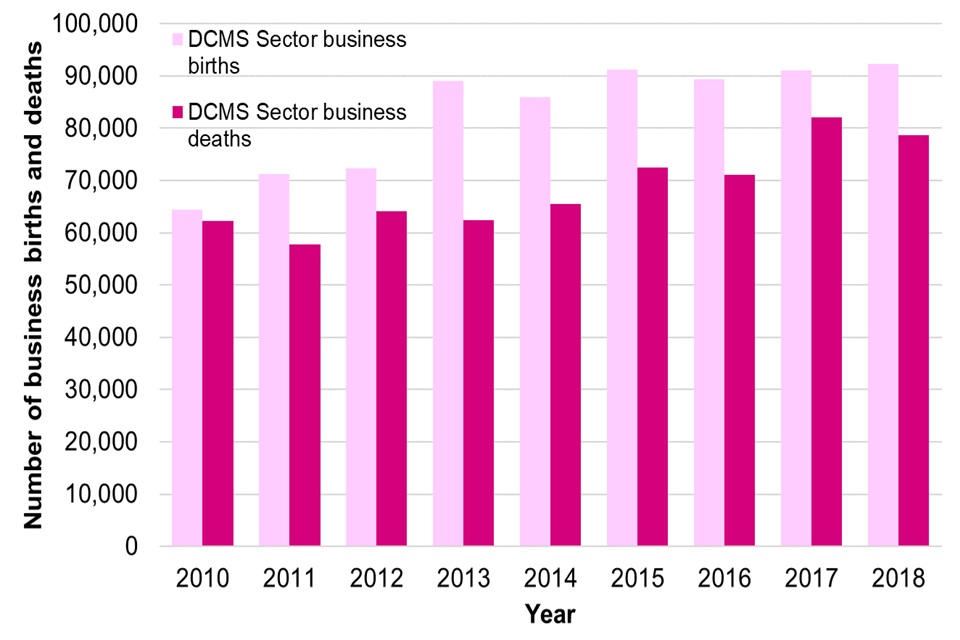
Figure 1: DCMS Sector (excluding Civil Society) births and deaths: 2010 to 2018
Chapter 1: Introduction
Experimental statistics
These statistics are classed as experimental statistics as it is the first time DCMS has introduced analysis on business births and business deaths for its sectors. They improve policy colleagues’ understanding of the level of new business births and recent business deaths in our sectors and sub-sectors. They are expected to complement the other suite of business demographics statistics published by DCMS, in order to further understand the businesses in our sectors.
We welcome any feedback on the value of these statistics to you as a reader and user. Feedback should be sent to evidence@dcms.gov.uk. Feedback on this publication will be collated along with any feedback from the Economic Estimates review consultation with the aim of the experimental statistics badging being removed by the time of the 2021 publication.
Background
Released: 9 July 2020
Geographic Coverage: United Kingdom
These statistics look at business births, and business deaths, for the DCMS Sectors (excluding Civil Society). They are based on the ONS Inter-Departmental Business Register (IDBR), a list of businesses compiled by the ONS based predominantly on a combination of Companies House, Value Added Tax (VAT) and Pay As You Earn (PAYE) data.
Business births are defined as being new business registrations for VAT and PAYE, which amount to a new registration for the IDBR.
Business deaths are defined as businesses that have ceased to trade, which are identified by their de-registration from VAT and PAYE (and, hence, the IDBR). An adjustment is made to the two most recent years of the data by the data owner (the Office for National Statistics (ONS)) to allow for potential re-activations of businesses (which therefore may not have entirely ceased trading), ensuring a balance between timely statistics and subject guidance about the likelihood of re-activations.
Data are available for each DCMS sector; and also for sub-sectors within the Creative Industries, Digital sector, and the Cultural sector. As with other statistics in the Economic Estimates series, categorisation of DCMS sectors is based on the Standard Industrial Classification (SIC) codes. There is significant overlap between DCMS sectors so users should be aware that the estimate for “DCMS sectors Total” is lower than the sum of the individual sectors.
Users should also note that the definition of Tourism used in this report is equivalent to that used in the Business Demographics publication, but differs to that used in all other DCMS Sector Economic Estimates reports. Specifically, this release is based on a “tourism industries” approach, which counts any establishment for which the principal activity is a tourism characteristic activity. By contrast, the DCMS GVA and Employment releases, in particular, are based on results from the Tourism Satellite Account, which estimates the proportion of each industry that is supported by tourism. As such, the estimates for Tourism within this release account for a greater proportion of the DCMS sectors (excluding Civil Society) total.
In summary, the data presented in this report on business births and deaths:
- Are based on official statistics data sources.
- Are based on internationally-harmonised codes, meaning the estimates are:
- Comparable at both a national and international level.
- Comparable over time, allowing trends to be measured and monitored.
- Subject to limitations of the underlying classifications around reflecting the current balance and make-up of the UK economy. For example, the SIC codes were developed in 2007 and have not been revised since. Emerging sectors, such as Artificial Intelligence, are therefore hard to capture and may be excluded or mis-coded.
- Are based on admin data (the IDBR). In this case, it will mean they are a comprehensive record of businesses registered for VAT and/or PAYE (and registered with Companies House). However, it will not contain non-registered businesses, which typically comprise low turnover non-employing businesses.
Chapter 2: Business Births in DCMS Sectors
2018 figures
- 92,325 new UK businesses were registered in DCMS Sectors in 2018, 24.3% of all UK business births.
- Nearly 3 in ten of all DCMS Sector business births were in London (26,730, 28.9% of all DCMS Sector business births), followed by the South East (13,575, 14.7%) and the North West (8,600, 9.3%).
Looking at individual sectors and sub-sectors:
The Tourism industries (45,935), Creative Industries (39,650) and the Digital Sector (34,235) had the highest number of business births in 2018.
A comparison of the regional distribution of business births for the individual DCMS sectors is shown in Figure 2. Most notably, the Tourism industries have a smaller percentage of births in London and the South East than the Creative Industries and Digital Sectors. This is illustrated by the Tourism sector having lighter shades of blue for London and the South East, and darker shades for other regions.
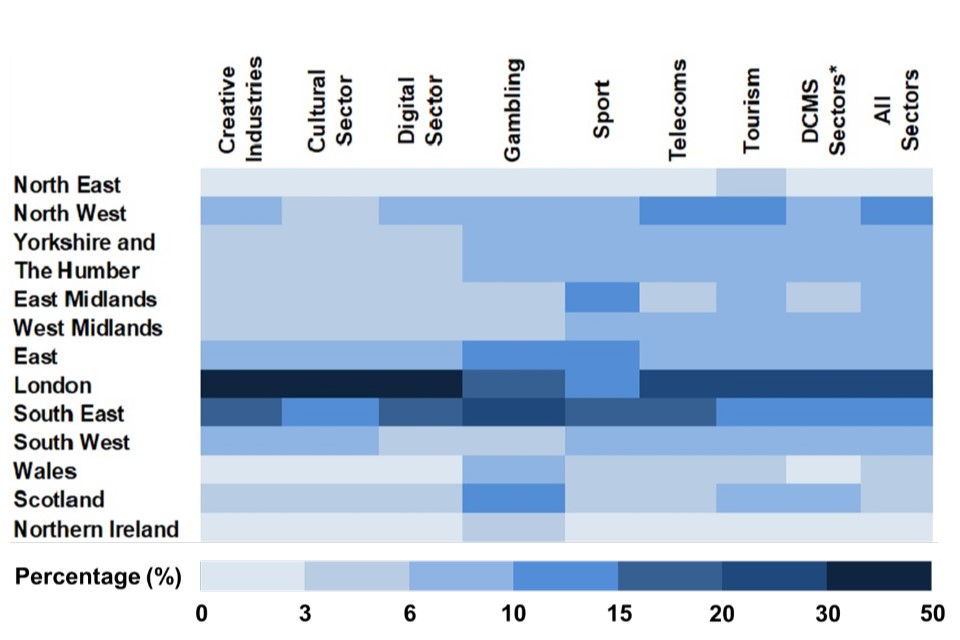
Figure 2: Level plot showing the regional distribution of business births in each DCMS Sector, 2018
Some industries are included in more than one sector. For example, the computer programming and computer consultancy industries are in both the Digital Sector and the Creative Industries. In fact, these industries are in the sub-sectors with the highest numbers of business births for both the Digital Sector and the Creative Industries (“Computer programming, consultancy and related activities”, 23,640 births, 69.1% of Digital Sector total; “IT, software and computer services”, 21,750 births, 54.9% of Creative Industries total). This suggests that an industry can drive trends in more than one sector. The overlaps between the sectors, and how much they contribute to business births, are illustrated in Figure 3 below.
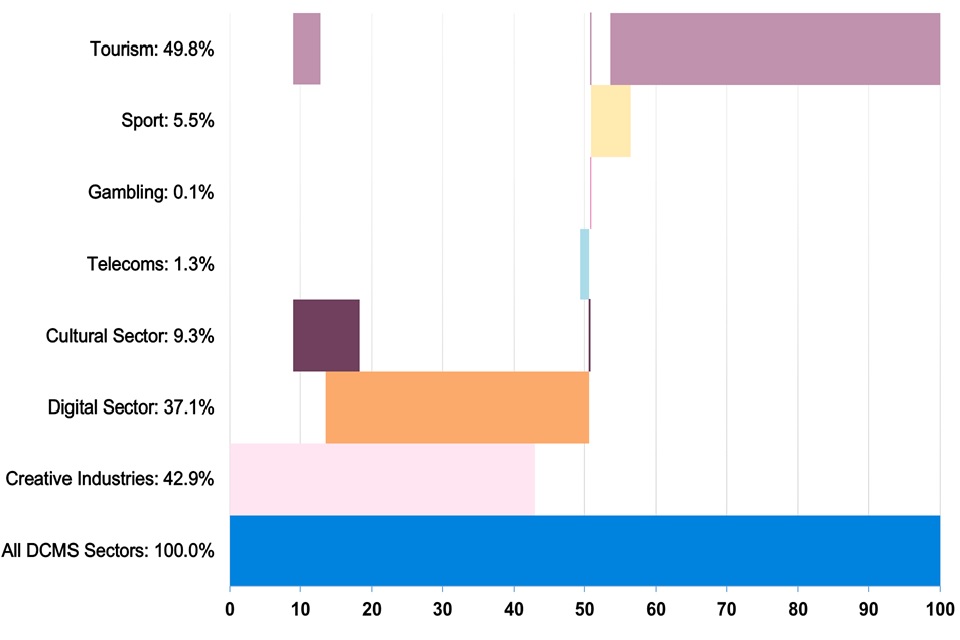
Figure 3: Business births in DCMS Sectors as a percentage of all DCMS Sector (excluding Civil Society) business births
Note: There is a very small (less than 0.1%) overlap between Tourism and Culture only which cannot be visually identified in Figure 3.
Time series
The number of business births per year in DCMS Sectors grew by 38.2% between 2010 and 2013. Since 2013, the number of newly-registered DCMS Sector businesses has been relatively stable, between 85,000 and 93,000 per year.
The DCMS Sector business birth figures grew at a similar rate to the UK economy from 2010 to 2012 (12.1% for DCMS Sectors; 14.6% for all sectors). Since then, overall, business births in the DCMS Sectors have grown at a slower rate than for the UK economy as a whole (27.8% vs 41.2%). As a result, the 24.3% of total UK business births that were in DCMS Sectors in 2018 is decrease compared to 2010 (27.4% of UK business births). This is shown in Figure 4 below.
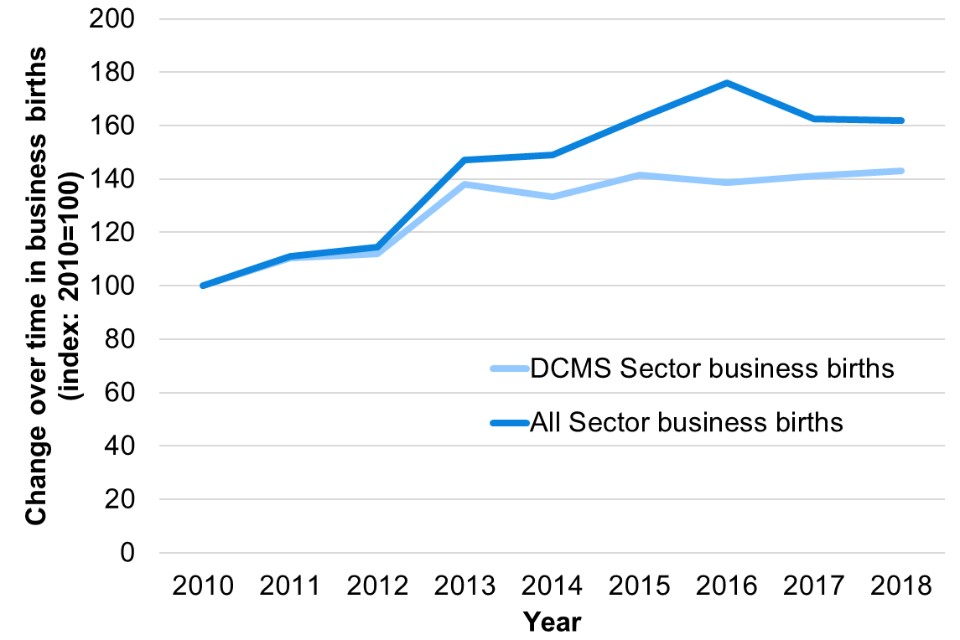
Figure 4: Indexed trends in DCMS Sector business births compared with business births for all sectors: 2010 to 2018 (2010=100)
Chapter 3: Business Deaths in DCMS Sectors
2018 figures
- 78,650 UK businesses in DCMS Sectors ceased trading in 2018, 23.4% of all UK business deaths.
- London (20,835, 26.5% of total) had the most DCMS Sector business deaths, followed by the South East (11,550, 14.7%) and the North West (7,565, 9.6%).
Looking at individual sectors and sub-sectors:
- The Tourism industries (39,895), Creative Industries (32,935) and the Digital Sector (28,315) had the most business deaths in 2018.
- As with business births, the regional distribution of the Tourism industries differs compared to the Creative Industries and the Digital Sector. London and the South East together accounted for the majority of business deaths in the Creative Industries (51.1%) and the Digital Sector (50.6%) in 2018. However, only 33.5% of business deaths in the Tourism industries come from London and the South East.
- The Digital sub-sector “Computer programming, consultancy and related activities” (18,980); and the Creative Industries sub-sector “IT, software and computer services” (17,005) experienced the most (sub-sector) business deaths in 2018. Both these sub-sectors contain the computer programming and computer consultancy industries. Therefore, for example, a de-registered IT consultancy business would count as a death in both Creative Industries and the Digital Sector; and wider trends of this sub-sector could be a strong driver of both sectors.
Time series
- The number of business deaths in DCMS Sectors has grown by 26.3% since 2010, compared to 35.0% for UK sectors. During this period, the largest year-on-year change was between 2016 and 2017 (15.5% growth in business deaths for DCMS Sectors; and 29.0% growth in number of deaths for all UK businesses). Overall, the changes in the number of business deaths in DCMS Sectors over time are similar to the overall UK picture. This is shown in Figure 4 below.
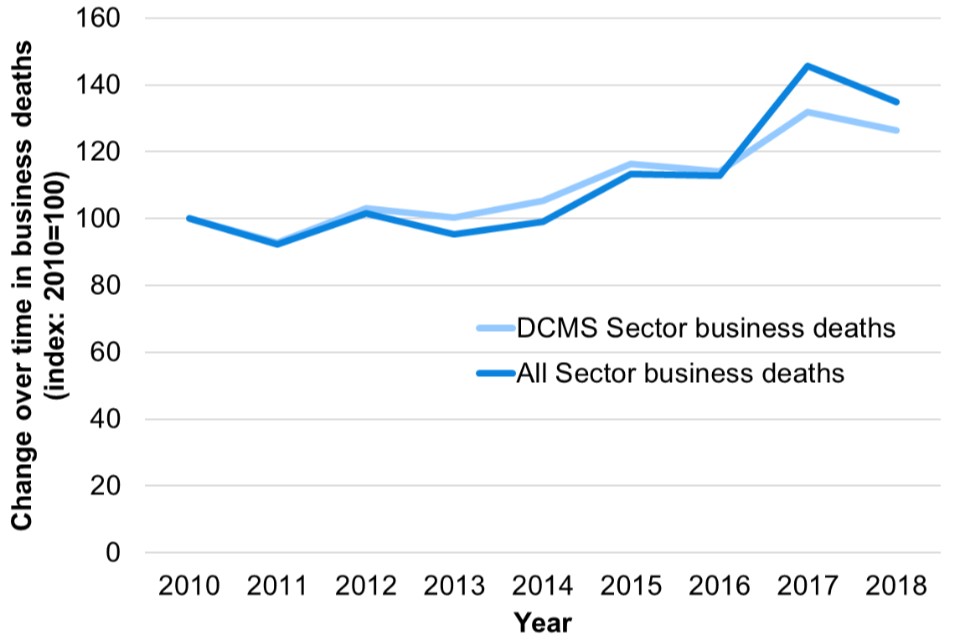
Figure 5: Indexed trends in DCMS Sector business deaths compared with business deaths for all sectors: 2010 to 2018 (2010=100)
Chapter 4: Comparing Business Births and Deaths
- More businesses were created in DCMS sectors than closed for every year between 2010 and 2018. Net growth varied from 2,230 businesses in 2010 to a peak of 26,615 businesses in 2013. In 2018 the net growth was 13,675 businesses.
- In most regions and sectors the number of births (newly-created businesses) exceeded the number of deaths in 2018. The main exceptions were the Gambling and Telecoms sectors, where deaths exceeded births across the UK; and the West Midlands, the only region where deaths exceeded births for the DCMS Sectors total.
- Overall, the DCMS Sectors trend mirrors the trend for all UK businesses across regions, except for
- the West Midlands: there was net growth in the total number of businesses, but a net loss for the number of businesses in DCMS Sectors
- Scotland: there was a net fall in the total number of businesses, but net growth in the number of businesses in DCMS Sectors.
Comparison with DCMS Economic Estimates: Business Demographics
- DCMS business demographics figures, the latest of which were published end May 2020, have shown the following:
- The total number of businesses in DCMS sectors increased by 14,000 between 2017 and 2018.
- The total number of businesses in the UK grew by 43.7 thousand between 2017 and 2018.
- These compare to the figures reported in this release of a net increase of 13,675 businesses in DCMS Sectors in 2018, and a net increase of 44,900 thousand businesses in the UK in the same year.
- The numbers are similar but not exactly the same. We would expect there to be some differences for the following reasons:
- Different data sources: the Business Demographics are based on the Annual Business Survey, and Business Births and Deaths on the IDBR.
- Different business types: the Business Demographics release reports the number of reporting units; the Business Births and Deaths release reports on number of enterprises. An enterprise is the smallest combination of legal units which has a certain degree of autonomy, and may contain several reporting units. Please see Annex A for further information.
- Different time periods: the Business Demographics release reports the number of businesses operating at a nominal time in the year given, and changes in the number of businesses are calculated as the difference between calendar years. The Business Births and Deaths release reports the change in the number of businesses within a calendar year.
Chapter 5: Next Steps
DCMS has developed a suite of economic estimates which help support policy and understand the economic impact our sectors have on the UK economy. The business births and deaths estimates in the release are expected to be used by customers both within and outside the government. In combination with other economic indicators, employment estimates help build a comprehensive picture of the UK economy, and of the DCMS sectors’ importance within it.
The next set of publications of DCMS sectors Economic Estimates are: * DCMS Sectors Economic Estimates 2018: Trade full report (scheduled for late summer 2020) * Digital Sector Economic Estimates 2019: Earnings full report (scheduled for late summer 2020)
The final dates will be announced via the DCMS statistical release calendar nearer the time.
Views on this publication are welcomed from users. Responses should be provided to evidence@dcms.gov.uk.
Annex A: Definitions and Limitations
This annex outlines the definitions used within Economic Estimates: Business Demographics and the limitations of the data.
Definition of a business
Within this release, a business is defined as any Enterprise the Inter Departmental Business Register (IDBR). A business is held on the IDBR if it is registered for Value Added Tax (VAT) with HM Revenue and Customs (HMRC), or registered for a Pay As You Earn (PAYE) scheme with HMRC, plus being a business registered at Companies House. The table below outlines the differences between these types of unit.
| Business Unit | Description | Example | Referred to in this release as |
|---|---|---|---|
| Enterprise | The smallest combination of legal units (generally based on VAT and/or PAYE records) which has a certain degree of autonomy. An enterprise carries out one or more activities at one or more locations, but may still be a sole legal unit. | Arcadia (who own Topshop, Topman, Dorothy Perkins and Burton among others) | “Enterprise” |
| Reporting unit | Put simply, the Reporting Unit holds the mailing address to which the survey questionnaires are sent. The questionnaire can cover the enterprise as a whole, or parts of the enterprise identified by lists of local units. | Topshop | “Business” |
| Local unit | A local unit is an enterprise or part thereof (e.g. a workshop, factory, warehouse, office, mine or depot) situated in a geographically identified place. | An individual Topshop store e.g. on a local high street or in a shopping mall | “Business site” |
In practice, in the vast majority of cases, the local unit and business unit are the same unit - only about 2% of businesses operate more than one local unit. As such, most of the time the terms ‘enterprise’, ‘business’, and ‘local unit’ may be used interchangeably.
Limitations
The estimates set out in this report are robust but there are some limitations which users should be aware of. More information can be found in the Methodology Note:
Sport
For the purpose of this publication the statistical definition of sport has been used. This incorporates only those 4 digit Standard Industrial Classification (SIC) codes which are predominantly sport (see methodology note Table 2.1).
DCMS also publishes estimates of sport based on the EU agreed Vilnius definition. The Vilnius definition is a more comprehensive measure of sport which considers the contribution of sport across a range of industries, for example sport advertising, and sport related construction. The methodology for the DCMS Sport Satellite Account is currently being reviewed and therefore has not been used in these estimates.
Tourism
The methodology used to produce estimates for Tourism within this release differs to that used in other DCMS Sector Economic Estimates releases. This release is based on a “tourism industries” approach, which counts any establishment for which the principal activity is a tourism characteristic activity. This differs to the direct approach used in DCMS GVA and Employment releases, which estimate the direct economic impact of tourism (or tourists) within the tourism industries, using the Tourism Satellite Account. As such, the estimates for Tourism within this release account for a greater proportion of the DCMS Sectors (excluding Civil Society) total. Estimates for tourism used in this publication are based on the tourism industries, rather than direct tourism only. Tourism industries are defined within Table 2.2 of the methodology note.
Operation of historical sites and similar visitor attractions
It is recognised that, due to the limitations associated with SIC codes, the SIC code used as a proxy for the Heritage sector (91.03 - Operation of historical sites and building and similar visitor attractions) is likely to be an underestimate of this sector’s value. As such, we have altered the name of the Heritage sector to ‘Operation for historical sites and similar visitor attractions’ to reflect this.
Office for Civil Society
The Office for Civil Society (OCS) leads cross-government work in support of the voluntary, community and social enterprise sector. Estimates have been provided in throughout report which outline the number of businesses in the different parts of the Office for Civil Society. However, this sector is not defined by SIC codes, and therefore different data sources have to be used to measure the size of this sector to the other DCMS sectors. Comparisons made between Civil Society and other sectors will not be on a comparable basis and should therefore be treated with caution.
Feedback and consultations
DCMS aims to continuously improve the quality of estimates and better meet user needs. If you have any feedback on this publication please contact evidence@dcms.gov.uk.
Annex B: Alternative data sources
The DCMS Business Births and Deaths statistics are closely related to a series of other government statistics, including:
- The ONS Business Demography statistics: These are based on the IDBR, like our statistics and focus on new business registrations and on de-registrations (cessation of trading). Information is broken down by region and by sector, but the sector breakdowns are at a higher level (SIC sections – Finance and Insurance etc.) than for our DCMS Sector estimates.
- The BEIS Business Population estimates: These use the IDBR, ONS Labour Force Survey and HMRC self-assessment tax data to estimate the business population, including unregistered businesses (which ONS’ and DCMS’s statistics do not include). The emphasis is on population, rather than births and deaths. Breakdowns are available by region, SIC level up to 3-digit. The focus is on private sector businesses but there is also data for “whole economy”.
- ONS Business Activity statistics: These also count the total number of businesses (enterprises), broken down by different types (e.g. sole proprietorships, companies, public corporations etc.), as well as industries (SIC letter) and regions.
- Civil Society data is often available through Annual Reports and similar administrative data. For example:
- Charity Commission Annual Report, 2018-2019
- Community Interest Companies Regulator: Annual Report 2018 to 2019
- Public Service Mutuals: State of the Sector 2019
The DCMS Business Births and Deaths statistics are also closely related to the DCMS Business Demographics series, which we published most recently in May 2020 and includes breakdowns of number, turnover, employment, ownership and trade for DCMS Sectors.
During spring 2020, the team also developed analysis based on DCMS clusters, a related but distinct way of classifying DCMS’s work, with a focus on Covid-19 impact analysis required by key internal and external stakeholders. As part of this, estimates on number and turnover of businesses by DCMS clusters were also published. See the ad hoc analysis page for more information.
Annex C: Further information
- Rishi Vaidya is the responsible statistician for this release. For enquiries on this release, please contact Rishi or evidence@dcms.gov.uk.
- For general enquiries contact: Department for Digital, Culture, Media and Sport, 100 Parliament Street, London, SW1A 2BQ Email: enquiries@dcms.gov.uk
- For media enquiries contact: 020 7211 2210
- DCMS statisticians can be followed on Twitter via @DCMSInsight.