State of the water environment: long-term trends in river quality in England
Updated 22 May 2023
Applies to England

© Crown copyright 2023
This publication is licensed under the terms of the Open Government Licence v3.0 except where otherwise stated. To view this licence, visit nationalarchives.gov.uk/doc/open-government-licence/version/3 or write to the Information Policy Team, The National Archives, Kew, London TW9 4DU, or email: psi@nationalarchives.gov.uk.
Where we have identified any third party copyright information you will need to obtain permission from the copyright holders concerned.
This publication is available at https://www.gov.uk/government/publications/state-of-the-water-environment-indicator-b3-supporting-evidence/state-of-the-water-environment-long-term-trends-in-river-quality-in-england
The graphs which follow present the results of an analysis of long-term trend data for ammonia, biochemical oxygen demand (BOD) and nutrients as important measures of the quality and health of English rivers. The Environment Agency carried out this analysis in 2022.
1. Monitoring points used and analysis carried out
Data gathered at harmonised monitoring (HM) sampling points between the mid-1980s and 2019 were used for this analysis. The HM sampling points are located in the principal rivers of England (see Figure 1). They are mostly sited at the lower end of those rivers, just above the tidal limit. There are also some HM sampling points at the confluences of rivers.
There are around 130 of these fixed sites, most of which have been monitored (generally monthly) from the 1970s onwards. This provides a large reliable data set and a good basis for assessing how lowland river water quality is changing nationally over time.
The data reflect the combined effects of all that is happening in the catchments of England upstream of the sampling points. This includes the effect of control measures for point and diffuse sources of pollution, and other influences.
1.1 Figure 1 – location of HM sampling points in England
This map shows the location of all sites which have been included in the analysis.
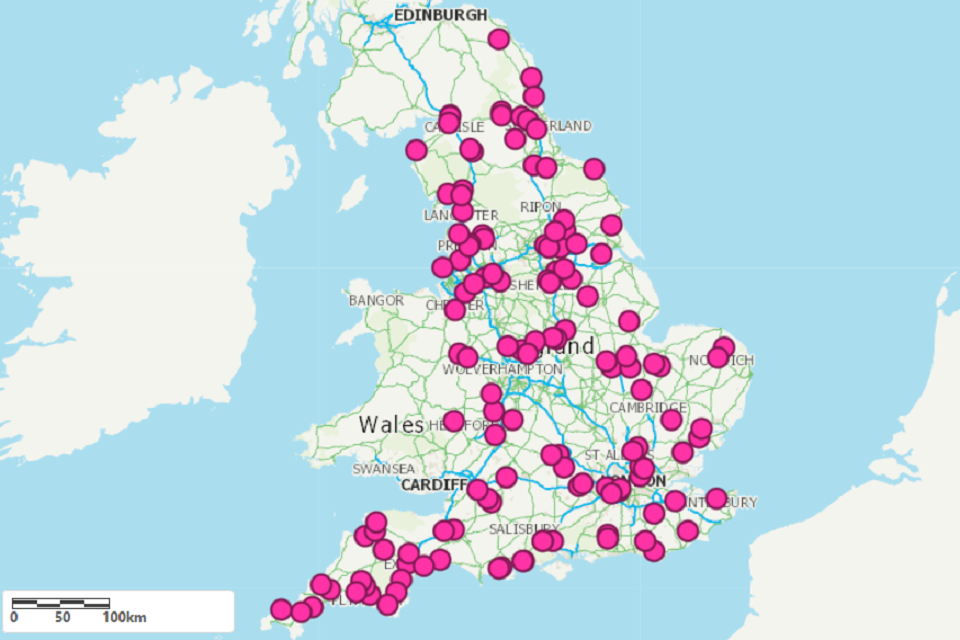
Map © Ordnance Survey and © Environment Agency
For each calendar year, the annual average value from the whole pooled data set was determined for each of the following parameters:
- ammonia
- BOD
- orthophosphate – as phosphorus (P)
- nitrate – as nitrogen (N)
The results are plotted in section 3 as time series graphs showing error bars around the calculated means. ‘Less than’ (limit of detection) values were treated as 50% of the face value result. Data from 1986 to 2019 inclusive were used in this analysis.
For BOD, data to 2014 were used as regular monitoring of BOD at HM points stopped at this time. BOD is not part of Water Framework Directive Regulations water body classification and water bodies do not have BOD status objectives set.
For nitrate-nitrogen, 1994 was chosen as the start of the data set as before that time the number of sampling points for this parameter was lower.
The data set comprised around:
- 90,000 sample results for ammonia
- 76,000 sample results for BOD
- 84,000 sample results for P
- 52,000 sample results for nitrate-nitrogen
In 2020 and 2021 sample numbers were significantly reduced as COVID-19 restricted monitoring activities. Data for these years were excluded from the analysis.
2. Why these parameters were used
The parameters assessed are important basic measures of river water quality.
Ammonia is toxic and can kill or be otherwise harmful to aquatic life including fish.
BOD is an indicator of organic pollution of the water environment. The higher the BOD, the greater the potential for oxygen levels in the water to fall, which can stress or, in extreme cases, kill aquatic life.
Elevated levels of nutrients (particularly P in fresh waters) can give rise to the problem of eutrophication. This is when there is too much nutrient present in the water, causing excessive growth of algae and plants. This adversely affects the quality of the water and our uses of it, as well as damaging the local aquatic life.
High levels of nitrate-nitrogen are a concern in terms of abstraction of water for drinking water treatment. They can also contribute to eutrophication in lakes, estuaries and coastal waters.
3. Results of the analysis
The long-term time series graphs for ammonia, BOD and nutrients (P and N) are set out here.
3.1 Annual average ammonia concentrations (1986 to 2019)

3.2 Annual average BOD concentrations (1986 to 2014)

3.3 Annual average orthophosphate reactive (as P) concentrations (1986 to 2019)

3.4 Annual average nitrate (as N) concentrations (1994 to 2019)

4. What the graphs show
The graphs indicate the following changes to average concentrations of the selected parameters between the mid-1980s and the present day (2019):
- ammonia concentrations have reduced to about 15% of average concentrations in 1990
- BOD concentrations have reduced to 55% to 60% of average concentrations in 1990
- orthophosphate concentrations have reduced to 15% to 20% of average concentrations in 1990
- nitrate-nitrogen concentrations show no clear trend
The improvements in lowland river water quality shown here complement recent findings of an analysis of national-scale trends in the macroinvertebrate communities of English rivers from 1991 to 2019. Cardiff University carried out this analysis for the Environment Agency. See An analysis of national macroinvertebrate trends for England: 1991 to 2019 – summary.
Important findings were:
- the richness of invertebrate communities (the average number of families present) increased from 1991 to 2005 overall and to 2010 in urban rivers, with no increase after that
- the prevalence of pollution-sensitive invertebrates increased from 1991 to 2019, with rivers continuing to gain these invertebrates (that are intolerant of pollution) across the complete period
The improvements in river biology over the last 30 years were consistent with improvements in water quality, notably organic pollution. The HM data show that average BOD concentrations fell by about 40% between 1990 and 2010 and average ammonia levels reduced to about 20% of their 1990 value. Improving biological trends are the opposite of those expected under a warming climate, suggesting that water quality gains are offsetting some of the impacts of climate change.
The national loadings of BOD and ammonia from water company sewage treatment works (STWs) to rivers also fell dramatically over this period. BOD loadings reduced by around 40% and ammonia loadings by 66% between 1995 and 2010, as reported in the Regulating for people, the environment and growth 2019 report. By 2020 the reductions in STW loadings to rivers since 1995 were 49% for BOD, 79% for ammonia, and 66% for P.