State of the Estate 2022-23 (HTML)
Updated 19 April 2024

© Crown copyright 2024
This publication is licensed under the terms of the Open Government Licence v3.0 except where otherwise stated. To view this licence, visit nationalarchives.gov.uk/doc/open-government-licence/version/3 or write to the Information Policy Team, The National Archives, Kew, London TW9 4DU, or email: psi@nationalarchives.gov.uk.
Where we have identified any third party copyright information you will need to obtain permission from the copyright holders concerned.
This publication is available at https://www.gov.uk/government/publications/state-of-the-estate-in-2022-2023/state-of-the-estate-2022-23-html
Joint Ministerial Foreword
The Government estate is – by some distance – the biggest, most diverse property portfolio in the UK. It is made up of hundreds of thousands of assets – from prisons and courts, to schools and museums, hospitals and health surgeries, job centres, military bases, overseas embassies, administrative offices, and many more. However, it is much more important to all of our lives than just a simple collection of buildings.
The Government estate is the platform from which almost all public services are provided. Better buildings provide the foundation for better public services. More imaginative and efficient use of public property and land can inspire economic growth, deliver our Greening Government Commitments, create new jobs, and allow for new family homes to be built, creating new communities.
This State of the Estate report provides an overview of the physical assets which make up the public estate, showing their scale, cost and how they are used. It also shows the progress we are making to make our estate more sustainable.
Our work to transform the Government estate is guided by the missions within the Government Property Strategy 2022-2030. That Strategy made commitments to capitalise on the estate to transform places and services; to create a smaller, better, and greener estate; and to improve professional excellence and insight.
While a requirement of the Climate Change Act 2008, this State of the Estate report also represents a progress report from the first months of the new Government Property Strategy. Much has been achieved already, although we understand and acknowledge much remains to be done before we achieve the ambitions we hold for the Government estate.
Readers of this report will see significant progress against many of our objectives. We are also seeing significant savings being achieved, demonstrating our commitment to running the UK estate in as efficient a manner as possible. We have disposed of no longer needed properties worth more than £1 billion, returning that money to the taxpayer to be reinvested. Programmes such as Places for Growth and One Public Estate – celebrating its ten-year anniversary – continue to drive important economic growth in local communities.
The Greening Government Commitments ensure that the government plays its part in meeting the Environmental Improvement Plan’s goals through its own estates and operations, leaving the environment in a better state than we found it. We continue to see a positive trajectory in reducing emissions from buildings used in the delivery of public services, leading to reduced energy consumption saving the UK taxpayer £163 million, compared to our 2017-18 baseline year.
We celebrate the progress this State of the Estate report demonstrates, and we look forward to seeing further progress in the next few crucial years as we work towards delivering the ambitions set out in the Government Property Strategy.
Parliamentary Secretary for the Cabinet Office
Alex Burghart MP
Minister for Nature
Rebecca Pow MP
Head of Function Foreword
“All of us working in the Government Property Function have a huge responsibility. We are the people tasked with managing, protecting, and maintaining the most diverse – and most important – property portfolio in the UK. We are also the guardians of the Government covenant, with a duty to maximise its value and impact.
When the Government Property Strategy was published in August of 2022, it was designed to be a long-term roadmap to deliver real and lasting improvements to the public estate. We’re now 18 months into this journey, and I am pleased at the progress we have been able to report.
- We are well on track to achieve our target of relocating 22,000 roles out of London through our Places for Growth programme, which is a big contribution to the Government’s ambition to level up the country.
- The One Public Estate has continued its trend of delivering real, lasting, tangible positive impact on communities up and down the country. During 2022/23, this programme has achieved over £63m in capital receipts, £25m in running cost savings, land for 5,800 homes, and 9,100 new jobs. We will continue this work over the coming year.
- Against a target of achieving disposals of £1.5 billion by 2025, we have already delivered £1.1bn. Two thirds of the target has been delivered in the first year, which is outstanding work in a volatile and sometimes unpredictable property market.
There are more achievements I could highlight over the course of the last year, and many of them are covered throughout this report. It’s also important to recognise the significant improvements which have been made in how we collect, assure, and manage data across the organisations which make up the Government Property Function – this report comprises data and insight from in excess of 130 individual departments or organisations across our function.
It’s clear that, in many important areas, we have made positive progress. However, we are acutely aware there are still challenges to resolve and issues to tackle.
There are some encouraging statistics in this report which demonstrate real progress in making the estate greener and more sustainable – one of the three main missions in our Government Property Strategy. We know we need to go further and faster in this space if we are to deliver the truly net zero public estate we are all committed to.
The condition of our estate is another clear challenge. The issues on Reinforced Autoclaved Aerated Concrete (RAAC) – widely reported in the media during 2023 – is one part of this challenge, but it is by no means the only issue. An estate as varied, as diverse, and as complex as the one managed by the Government will always need regular proactive investment on maintenance. A real focus on improving and increasing this work is required if we are to bring the estate up to the standard we aspire to. Whilst the focus on RAAC in September 2023 was after the period of this report I wanted to thank my colleagues across the Property Profession for their responsiveness and diligence in quickly assessing and mitigating building condition risk.
I am pleased and encouraged by the work, and the impact of that work, which is set out in this report. I believe we are on the right track to deliver on the commitments in our Government Property Strategy and I know – if we are able to positively and proactively tackle the condition and sustainability issues which remain – we can deliver an outstanding public estate to support every public service.
Government Chief Property Officer
Mark Chivers
Purpose and scope
The State of the Estate (SoftE) Report fulfils the requirement in the Climate Change Act 2008[footnote 1] to assess the progress made in the year towards improving the efficiency and contribution to sustainability of buildings that are part of the government’s estate. As required under the Act, the report is laid before Parliament. This report covers the period from 1 April 2022 to 31 March 2023.
More detailed data on Government Estate Portfolios for the year ending 31 March 2023 can be found in the Government Estate: Annual Data Publication, 2022-23[footnote 2] which contains estate information for the period 2020-21 to 2022-23. This State of the Estate report utilises data contained in that publication to deliver reporting requirements under the Climate Change Act 2008.[footnote 3]
In 2020-21, as a result of the Declaration on Government Reform,[footnote 4] this report underwent an expansion beyond the general purpose estate, resulting in substantial change of scope, classifications and methodologies. Periods prior to 2020-21 are not comparable so are not presented here.
The focus of the report is on the central government estate and does not include local authority assets or the wider public estate. Most portfolios cover central government property throughout the United Kingdom. Estates managed by the Devolved Administrations are out of scope.
This publication provides an overview of Government property and estate sustainability in 2022-23 alongside recent trends and context.
The report provides the following aspects of the Government estate:
- How the estate is comprised
- The size of the estate
- Running the estate
- Progress towards a greener estate
Information presented in the chapter ‘A Greener Government Estate’, is collected by the Department of Environment, Food and Rural Affairs (Defra) through monitoring of the Greening Government Commitments[footnote 5] (GGCs). The GGCs are government targets developed by Defra and agreed across Government. GGCs set out actions UK government departments and their agencies will take to reduce their impact on the environment.”
Executive Summary
Key changes observed across the estate in 2022-23 are summarised below, with further detail following across this report.
Composition
The shape of the Government estate is ever changing to reflect citizens’ and the Modern Civil Service’s needs. The estate is made up of a series of portfolios, some for the delivery of direct public services including schools, the health service, courts and tribunals, the probation service, prisons, job centres and cultural assets; others support government activity in the public interest, including the defence estate, science, general purpose offices, logistics and storage and other land.
Size
In 2022-23 built assets across the estate decreased in number by 0.9% to ~141,600, spanning 159.2 million m2. This decrease was driven primarily by the defence portfolio. The overall disposal of surplus assets were spread across a wider portfolio as explained in the Disposals section below.
The School portfolio occupies the highest proportion of floor area across the Government estate (49.5%), followed by the Defence portfolio (21.6%) and the Health Portfolio (18.9%).
Value and Running Costs
The value of the freehold estate, recorded using a range of methods, in 2022-23 amounted to £187.1bn, an increase of 2.8% from 2021-22. £3.2bn of the change in value was a result of schools previously out of scope of this report, being classified as academies bringing them into scope. Additionally, the Defence, Health and science estates all contributed to the increase. The definition of value and running costs can be found through Appendix B.
Annual running cost of the estate increased by 3.9% (£0.8bn) to £22.0bn in 2022-23. Key contributing factors include the increased cost of energy and the impact of inflation across the estate. The Health portfolio accounted for 80.5% of the increased costs and is additionally attributable to an increase in the number of patients passing through the NHS estate (an increase of 1.7m from 2021-22), which directly impacts facilities management costs such as cleaning, catering, portering and linen and laundry.
Greener Estate
The Government Property Sustainability Strategy,[footnote 6] published in November 2022, outlines how government will seek to achieve a greener estate, based on the requirements of the GGCs and brigaded under the headings:
- Net-Zero Emissions
- Adaptation
- Natural Capital
- Resource Efficiency
The Property Function is now working on a number of products and structures to support the achievement of the aims within the Strategy.
2022-23 highlights from individual property portfolios are presented below, with more detailed information elaborated across this report.
Courts and Tribunals
During 2022-23 HM Courts and Tribunals Service (HMCTS) focused on ensuring their estate was resilient, to maintain hearing capacity in support of reducing the outstanding caseload. £75m was spent on court maintenance and repairs during the year, with funding prioritised towards ensuring that buildings are safe, secure, meet statutory requirements and protect continuity of service. An extra £30m was also spent on additional minor repairs and replacement items, including re-decoration, replacement carpets and deep-cleans. Despite this expenditure, running costs for the courts and Tribunals portfolio decreased, due mainly to property exits during the year.
Cultural assets
This portfolio saw an increase in running costs in 2022-23. This was associated with a number of organisations. For the Victoria and Albert Museum, the completion of capital project works bringing additional assets into operational budgets, an uplift in costs of materials and labour and a rent review for an asset resulting in a significant uplift in annual cost contributed to the increase; the British Library saw running costs increase compared to 2021-22 due to the cessation of rates relief for St Pancras during Covid-19, an increase in repairs particularly at St Pancras following Covid-19, a major Knowledge Centre rewiring project at St Pancras as well as substantial increases in electricity, gas and water costs; The Tate Modern and Science Museums group also reported increases in running costs.
Defence
The Ministry of Defence (MoD) utilises its large property estate to work towards its objective of “Protecting the UK and its Overseas Territories”, 12% of the MoD budget is utilised in managing its estate, which in 2022-23 spanned ~95,800 built assets covering 34.3 million m2. Through its sites, the MoD undertakes a wide range of operations including building the Astute-class submarines and the Typhoon programme[footnote 7] which creates 20,000 jobs in the UK through the use of existing infrastructure. The MoD is taking steps such as a world first 100% sustainable fuelled flight to reduce its environmental impact.
In its support of NATO, the MoD provides equipment, munitions, training, and support such as Ukrainian volunteers being trained in England by a multinational force.”
Health
The health portfolio for England is summarised in three categories: Primary Care (Community Health Services), Secondary Care (NHS Trust Hospitals) and Residential and Care Facilities. Additionally, Offices and laboratories from within healthcare contribute to the Office and Science portfolios.
The primary care portfolio saw improved data collection which resulted in an increase to assets included. The secondary care portfolio, covering hospitals, saw increased patient numbers and rising energy costs resulting in higher running costs. The Residential and Healthcare Facilities portfolio saw an overall increase in assets due to several organisations reclassifying properties into this category.
Infrastructure
Asset acquisition under HS2 has been by various mechanisms i.e. compulsion, statutory blight and discretionary schemes. Whilst, prior to 2022-23 these were held under the infrastructure portfolio, the government pause in early 2023 on some areas of HS2, and the subsequent 2023 announcement has meant that some assets that were acquired for the railway, will no longer be required and therefore have been reclassified from the Infrastructure portfolio into Remaining Estate in 2022-23.
Job Centres
Within the Jobcentre portfolio 880 sites offered front line services in 2022-23. Although this represents a decrease on 2021-22, due to rationalisation of leases of the operational estate, rent and running costs have increased following the acquisition of temporary jobcentres and assessment centres for extra capacity to support during the pandemic.
Land
The government estate includes land that is not directly associated with buildings and is used for a wide variety of different purposes from coach and lorry parking, to forests and lakes. In 2022-23 the number of land assets across the Estate increased. This is mainly due to acquisitions by HS2 and the Department for Environment, Food and Rural Affairs (Defra).
Logistics and storage
Running costs reduced within this portfolio in 2022-23, this is due primarily to an exit made by the Department for Work and Pensions (DWP) from its largest records management site. DWP is legally required to manage its customer records to ensure it meets the requirements of the General Data Protection Regulation (UK GDPR). Records across the site underwent a full review and were subsequently either safely destroyed, scanned, stored digitally or moved to an outsource provider’s premises.
Surplus floor area also reduced due to property exits made by the NHS Business Services Authority.
Office
The Government Property Agency (GPA) is the enabler for delivering the Government’s property agenda across its office portfolio. It is responsible for the property elements of the Government’s Levelling Up, Net Zero, and the Civil Service Reform initiatives. This includes a significant programme of commercial office developments and investment in our existing estate in all parts of the UK.
The government office portfolio accommodates over 340,000 staff in ~1,200 properties. It is a £1.8bn portfolio, with current running costs just under £1.5bn. This is a 9.1% cost saving from 21/22 generated through estate rationalisation and improved space optimisation, returning money to the public purse.”
Overseas
There has been an increase in the number of built assets in the overseas portfolio due to new acquisitions, despite this running costs increased only marginally due to efficiency savings.
In 2022-23, there were 10 overseas disposals in 2022/23 that raised £695m. These disposals were made by the Foreign, Commonwealth and Development Office (FCDO). The proceeds from some of these sales are being reinvested to help fund improvement projects across the FCDO overseas estate.”
Prisons
Although the total number of built assets within the Prison portfolio has decreased following some property exits in 2022-23, total running costs have increased due to costs associated with the closure of HMP Hewell Grange. As a result of the designation of HMP Camphill as surplus during 2022-23 surplus floor area increased within this portfolio.”
Probation
The total number of Probation built assets decreased from 522 to 500 in 2022-23. This was the third year of the Probation Reform Programme which delivered a 4-year estate strategy to begin to transform the probation estate. Although the programme formally closed this year, a number of estates projects will complete in 2024/25.
Total running costs in the probation portfolio have increased due to increasing rent, rates, fuel and utilities.
School
The school portfolio consists of state funded primary schools, secondary schools, and sixth form colleges. These can include academies, nurseries, specialists or alternative provisions. The scope of this report includes data on the number and floor area of state funded schools and the value and academy premises costs of academies only.
The Department for Education (DfE) provides funding for maintenance and improvement of the condition of school buildings and surrounding grounds in England. The DfE is not the custodian of the school estate, the responsibility of the estate is devolved to responsible bodies (RBs) depending on the type of school. These bodies have the legal responsibility for the land and buildings and to those bodies and others who may hold the freehold or leasehold interest in the land or hold it on trust.”
Science
In 2022-23 this portfolio saw an increase in the number of built assets, floor space and running costs. This is mainly due to increases reported by UK Research and Innovation, UK Atomic Energy Authority and Met Office.”
Remaining Estate
The remaining estate covers a wide variety of asset types including ancillary uses for the operational estate, conference/training facilities and industrial buildings. This portfolio also includes organisations with difficult to disaggregate data e.g. small organisations with a diverse portfolio of operational and multi-purpose assets such as those managed by the British Transport Police, Maritime and Coastguard Agency and the Driver and Vehicle Licencing Agency.”
Chapter 1: Composition of the Government Estate
Portfolio: A collection of property assets. (Government Property Portfolio – assets in the same or similar use held by the Government in connection with delivery of public services.)
Property: Real estate in a known ownership, with legal title. (In this report ‘a property’ is a unit of real estate identifiable by boundaries and a geographical location.)
Defining the Government Estate
From 2020-21, the focus of this report has been expanded, making it consistent with the requirements of the Declaration of Government Reform.[footnote 8] The expanded coverage includes: core (general purpose) properties owned or occupied by central government departments, executive agencies, executive non-departmental public bodies and government companies; but also the wider estate which includes galleries, museums, railways and roads, defence, the National Health Service (NHS); and parts of the non government estate (Schools).
Estate Summary
-159.2 million m2 Floor Area (Gross Internal Area) - 141.6k built assets - £22.0 billion annual running costs - Tenure by floor area m2 - 81.4% Freehold - 7.8% Leasehold - 7.7% PFI - 3.1% Other - £187.1bn Reported freehold value - Courts and Tribunals: 1.8 million m2 - Cultural Assets: 1.6 million m2 - Defence: 34.3 million m2 - Health: 29.3 million m2 - Infrastructure: 0.5 million m2 - Job Centres: 1.0 million m2 - Logistics and Storage: 0.6 million m2 - Offices: 2.8 million m2 - Overseas: 1.8 million m2 - Prison: 4.0 million m2 - Probabtion: 34.3 million m2 - Schools: 78.7 million m2 - Science: 1.4 million m2 - Remaining Estate: 1.0 million m2
Table 1: Size and Value of the Government Property Estate 2020/21-2022/23
| Value | Sub Value | Unit | 2020/21 | 2021/22 | 2022/23 | Change 2021/22-2022/23 (j) |
|---|---|---|---|---|---|---|
| Number of Assets | Number | 166.3k | 165.5k | 164.7k | -0.5% | |
| Built Assets | Number | 143.7k | 142.9k | 141.6k | -0.9% | |
| Land Assets | Number | 22.6k | 22.6k | 23.1k | 1.9% | |
| Total Floor Area (a) | m² | 157.2m | 160.3m | 159.2m | -0.7% | |
| Freehold | m² | 132.9m | 130.9m | 129.6m | -1.0% | |
| Leasehold | m² | 11.6m | 12.3m | 12.4m | 0.6% | |
| PFI (k) | m² | 8.7m | 12.2m | 12.2m | - | |
| Other | m² | 4.0m | 4.9m | 5.0m | 1.5% | |
| Vacant Floor Area | m² | 697.5k | 585.2k | 592.8k | 1.3% | |
| Surplus Floor Area (b) | m² | 830.0k | 673.3k | -18.9% | ||
| Land Area | ha | 627.1k | 626.4k | 628.7k | 0.4% | |
| Surplus Land Area (b) | ha | 719 | 261 | -63.8% | ||
| Freehold value (c) | £ | 177.3bn | 182.1bn | 187.1bn | 2.8% | |
| Total Running Cost (d) (i) | £ | 20.9bn | 21.2bn | 22.0bn | 3.9% | |
| Annual Rent for leaseholds (d) | £ | 2.5bn | 2.4bn | 2.3bn | -4.4% | |
| Annual Rates | £ | 1.1bn | ||||
| Security Costs | £ | 441.7m | ||||
| Soft FM | £ | 6.1bn | ||||
| Hard FM (e) | £ | 3.8bn | ||||
| Other Costs | £ | 6.6bn | ||||
| Academy Premises Costs | £ | 1.6bn | ||||
| Number of Buildings Requiring an EPC | Number | 5,735 | 5,714 | 6,198 | 8.5% | |
| Number of Buildings EPC A-C | Number | 2,315 | 2,504 | 2,721 | 8.7% | |
| New acquisitions (f) | Number | 284 | ||||
| Number of Disposals (h) | Number | 306 | ||||
| Disposal Proceeds (h) | £ | 1.1bn |
For further information on Table notes, please refer to Appendix F at the end of this document.
The Government estate is the biggest and most diverse property portfolio in the UK. In 2022-23 the estate covered 159.2 million m2 floor space across ~141,600 built assets valued at £187.1bn.
Acquisitions of 284 new freehold and leasehold assets occurred during 2022-23, and 306 freehold assets were disposed from the estate in 2022-23 as part of Government’s efficiency and disposals programme.[footnote 9] Receipts from confirmed unconditional sales amounted to £1.1bn.
In 2022-23 the number of built assets decreased by 0.9% to ~141,600, this was driven primarily by property exits and demolitions within the defence estate. Land assets increased by 1.9% with the Defence portfolio accounting for 49.5% of the increase as a result of the Defence Infrastructure Organisation (DIO) Accommodation Capital Purchase Programme. Defra accounted for a further 28.0% of land asset increases.
In 2022-23 the value of the estate was £187.1bn, seeing an increase of 2.8% from 2021-22. The Defence and Health estates reported increases were attributable to structural realignments across the Health portfolio, as well as the impact of inflation and market changes across Defence. However, £3.2bn of the increase in value was a result of schools previously out of scope of this report, being classified as academies and as a result, now in scope.
The running cost of the estate increased by 3.9% (0.8bn) to £22.0bn over the same period. Key contributing factors include the increased cost of energy and impact of inflation across the estate. The Health portfolio accounted for 80.5% of the increased costs and is inter-alia attributable to an increase in the number of patients passing through the NHS estate (an increase of 1.7m from 2021-22), which directly impacts facilities management costs such as cleaning, catering, portering and linen and laundry. Other contributors include the School portfolio, where previously out of scope academy premises costs are now in scope of the report due to increase in the number of schools classified as academies.
Surplus floor area across the estate reduced by 18.9%, this was primarily due to a number of Network Rail sites with surplus space in the office portfolio closing during 2022. In addition to the reduction in surplus floor area across the estate, there were 10 office building closures in London as a result of the GPA Whitehall Campus Programme, further information can be found in Appendix E.
Estate Location
In 2022-23, organisations reported their floor and land areas by region.
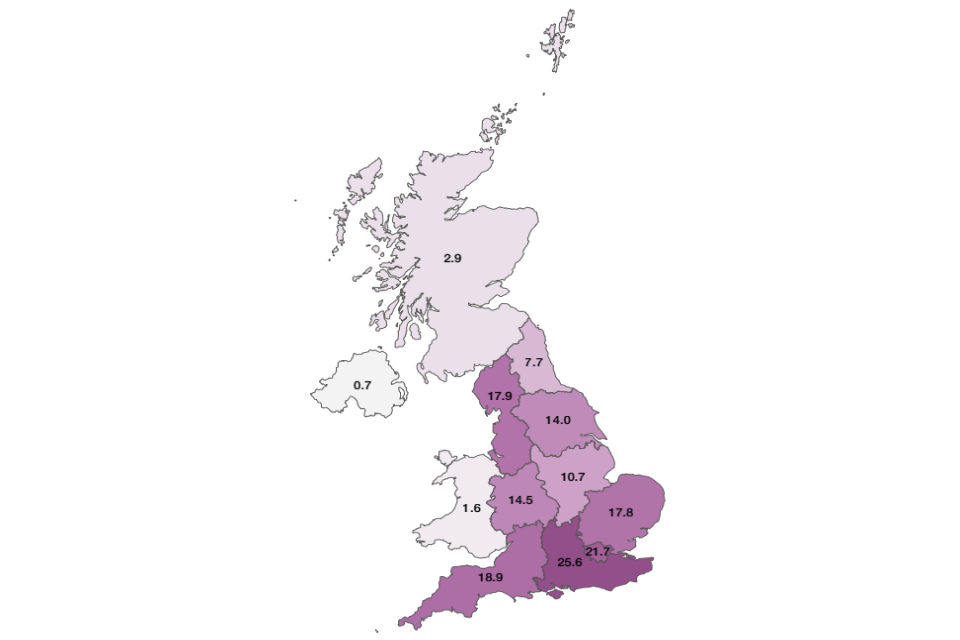
Floor Area
Built assets across the estate have a combined floor area of 159.2 million m2. The School portfolio occupies the highest proportion of floor area across the estate (49.5%), followed by the Defence portfolio (21.6%) and the Health Portfolio (18.9%).
The South East contains the largest proportion of any region with just over 25.6 million m2 of floor area, equivalent to 16.1% of the total. The next two largest regions are London and the South West, with 13.7%, 11.9% of the total floor area respectively, with East of England and the North West both comprising 11.2% of total floor area. Taken together these five regions comprise the majority of the estate’s floor area, 64.1% or 101.2 million m2.
Figure 1: Estate Floor Area by Region, 2022-23
Land
Ha: A hectare (ha) is an area of land which is equal to 10,000 square metres, or 2.471 acres.
Land across the estate covered an area of approximately 630,000 hectares (ha) in 2022-23. Two departments account for the vast majority of this estate, the MoD and the Forestry Commission (FC), representing 54.6% and 40.0% of the total land respectively. Thus the regional breakdown is driven by regions in which the MoD and FC have the strongest presence.
By region, the largest proportion of the land estate is located in the South West of England, comprising 25.1% of the total land area, driven by large MoD and FC estates, each representing 49% of the government land area in the South West. The North East of England contains the next largest proportion of land area, 15.9% of the total land area or 100,000ha; this is driven by a strong MoD presence in the region, comprising 74.8% of land area. The South East of England contains 14.2% of the total government land estate, of which the FC comprises 62.0% of the area in this region.
Collectively, these three regions cover an area of approximately 350,000ha, 55.2% of the land estate.
Figure 2: Estate Land Area by Region, 2022-23
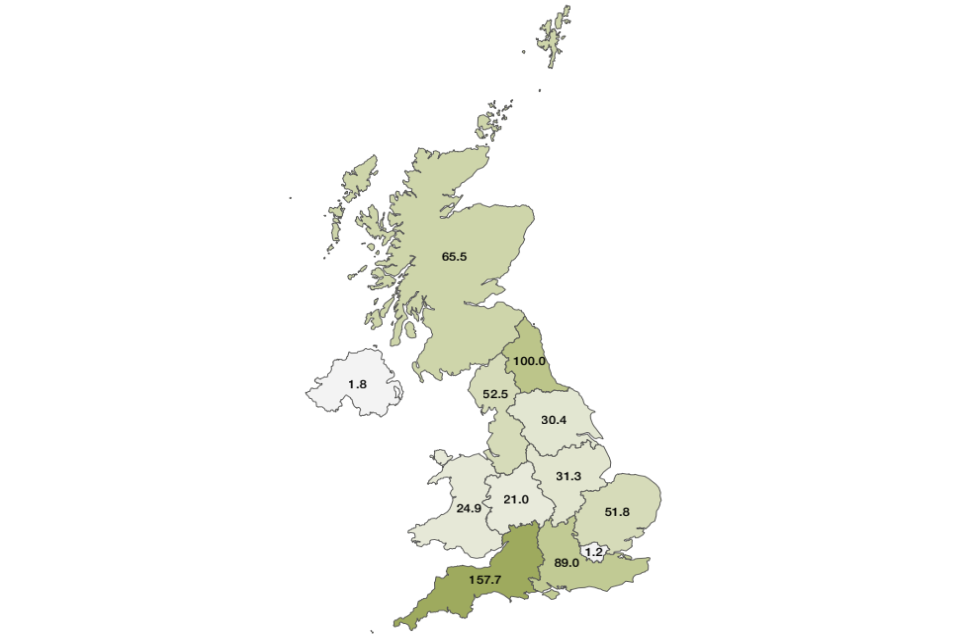
Table 2: Size of the Government Estate, by Region 2022/23
| 2022/23 | Floor Area (a) | Land Area | ||
|---|---|---|---|---|
| m² | Percentage | ha | Percentage | |
| Total area | 159.2m | 628.7k | ||
| East Midlands | 10.7m | 6.7% | 31.3k | 5.0% |
| East of England | 17.8m | 11.2% | 51.8k | 8.2% |
| London | 21.7m | 13.7% | 1.2k | 0.2% |
| North East | 7.7m | 4.8% | 100.0k | 15.9% |
| North West | 17.9m | 11.2% | 52.5k | 8.3% |
| South East | 25.6m | 16.1% | 89.0k | 14.2% |
| South West | 18.9m | 11.9% | 157.7k | 25.1% |
| West Midlands | 14.5m | 9.1% | 21.0k | 3.3% |
| Yorkshire and The Humber | 14.0m | 8.8% | 30.4k | 4.8% |
| Wales | 1.6m | 1.0% | 24.9k | 4.0% |
| Scotland | 2.9m | 1.8% | 65.5k | 10.4% |
| Northern Ireland | 0.7m | 0.4% | 1.8k | 0.3% |
| Overseas | 4.3m | 2.7% | 0.0k | 0.0% |
| Unknown | 1.0m | 0.6% | 1.5k | 0.2% |
For further information on Table notes, please refer to Appendix F at the end of this document.
Property Portfolios
The estate is made up of a series of portfolios, some for the delivery of direct public services including schools, the health service, courts and tribunals, the probation service, prisons, job centres and cultural assets; others support additional government activity in the public interest, including the defence estate, science, general purpose offices, logistics and storage and other land.
Table 3: Government Property Portfolios[footnote 10],[footnote 11]
| Portfolio Description | |
|---|---|
| Courts and Tribunals | Operational courts and tribunal buildings including any associated space used as administrative buildings and/ or storage sites. |
| Cultural assets | Museums (including front of house and back office estate where relevant), galleries, libraries, cinemas, including art/artefact storage, where relevant. |
| Defence | Property assets and land from which the MOD lives, works, trains, operates and deploys military capability. The Defence portfolio also includes maritime, airfield, rail to support and enable Defence operations and the overseas defence estate. |
| Health | NHS Trust hospitals (secondary care), health clinics and community hospitals (primary care) and residential and care facilities (other). |
| Infrastructure | Transport, energy, digital (telecommunications), waste, wastewater and sewage, and flood defences. |
| Job Centres | Job centres and assessment centres. |
| Land | Land that is not directly associated with buildings, which includes (but is not limited to) training land, nature conservation, woodlands and lakes. The land portfolio excludes land related to the defence estate which is reported under the Defence portfolio. |
| Logistics and storage | Includes but is not limited to document stores, fuel testing barns, salt barns, vehicle depots, motorway service compounds. |
| Office | Offices include front of house, HQ, service supporting and serviced offices and IT/data/call centres. It does not include public facing office accommodation that is ancillary to the primary purpose of that building (e.g. at a school, prison, job centre etc). |
| Overseas | All assets outside the UK. |
| Prisons | Prisons, prison officer’s quarters and other associated buildings. |
| Probation | Probation centres, contact centres and approved premises. |
| School | State funded primary and secondary schools, sixth form colleges, including academies, maintained nurseries, special schools and alternative provision. The scope of this report includes data on the number and floor area of state funded schools and the value and academy premises costs of academies only. All DfE data are reported on an academic year basis that are different to financial years. They run one year behind for the periods September to August each year. |
| Science | Laboratories, science sites and research facilities. |
| Remaining Estate | All assets which cannot be categorised into the above portfolios or where a breakdown of the estate is not available. |
For further information on Table notes, please refer to Appendix F at the end of this document.
Composition of the Estate by Portfolio
In 2022-23, the Schools portfolio occupied the highest proportion of floor area across the estate (49.4%), followed by the Defence Portfolio (21.6%) and the Health portfolio (18.4%).
Figure 3: Composition of the Government Estate by Floor Area 2022-23
- Schools: 49.4%
- Defence: 21.6%
- Health: 18.4%
- Other portfolios*: 6.3%
- Prison: 2.5%
- Offices:1.8%
(*) Other portfolios: Overseas, Courts and Tribunals, Cultural Assets, Science, Job Centres, Remaining Estate, Logistics and Storage, Infrastructure, Probation
Table 4: Composition of the Government Estate by Floor Area, 2022-23
| Portfolio | Floor Area – m2 (a) | Floor Area – % |
|---|---|---|
| Courts and Tribunals | 1.8m | 1.1% |
| Cultural Assets | 1.6m | 1.0% |
| Defence | 34.3m | 21.6% |
| Health – Community, Other Health & Social Care | 1.0m | 0.6% |
| Health – Primary Care & Community | 1.4m | 0.9% |
| Health – Secondary Care | 26.9m | 16.9% |
| Infrastructure | 0.5m | 0.3% |
| Job Centres | 1.0m | 0.6% |
| Logistics and Storage | 0.6m | 0.4% |
| Offices | 2.8m | 1.8% |
| Overseas | 1.8m | 1.2% |
| Prison | 4.0m | 2.5% |
| Probation | 0.3m | 0.2% |
| Remaining Estate | 1.0m | 0.6% |
| Schools | 78.7m | 49.4% |
| Science | 1.4m | 0.9% |
For further information on Table notes, please refer to Appendix F at the end of this document.
The School portfolio had the greatest freehold value recorded of all portfolios representing 34.0% of the whole estate value in 2022-23 (followed by Health and Defence with 32.1% and 17.7% respectively). It should be noted that the basis of valuation differs across portfolios and are not directly comparable. These are therefore indicative of the relative strength of the portfolios and not a reflection of value as such. Further consistency across portfolios will be pursued in future reports.
Figure 4: Estate Freehold Value by portfolio, 2022-23
- Schools: 34%
- Health: 32.1%
- Defence: 17.7%
- Other portfolios*: 4.5%
- Prison: 4.2%
- Cultural Assets: 3.1%
- Land: 2.5%
- Courts and Trubunals: 1.8%
(*) Other Portfolios: Overseas, Science, Offices, Remaining Estate, Infrastructure, Probation and Logistics and Storage
The Health estate reported the highest total running costs between in 2022-23 at £13.0bn, accounting for 58.8% of the overall estate running cost. Defence and Schools followed this with 13.1% (£2.9bn) and 7.3% (£1.6bn) respectively. The Health portfolio cost £443 per m2 with Defence and Schools costing £84 and £21 per m2 respectively. The Office and Job Centre portfolios had the highest running cost per m2, £511 and £510 respectively. Further detail on running the estate is available in Chapter 4.
Figure 5: Estate Running Costs by portfolio, 2022-23
- Health: 58.8%
- Defence: 13.1%
- Schools: 7.3%
- Other portfolios*: 7.2%
- Offices: 6.6%
- Prison: 4.8%
- Job Centres: 2.3%
Other portfolios: Courts and Tribunals, Overseas, Remaining Estate, Science, Cultural Assets, Probation, Logistics and Storage, Infrastructure and Land
Chapter 2: Government Property Strategy
The Government Property Strategy 2022-2030 (GPS):[footnote 12] The GPS sets out how we will transform the public estate, delivering savings and achieving better value for money.
Places for Growth:[footnote 13] The Places for Growth (PfG) programme is working to deliver a Civil Service that is representative of the communities we serve with more Government roles, including senior leaders, being based outside London, joining the many dedicated front line staff already based in towns and cities across the UK. We work closely with Government departments in three key areas, helping them to: relocate roles; build Civil Service communities; and right size the London estate.
One Public Estate: One Public Estate is a national programme jointly run by the Cabinet Office Government Property Unit and the Local Government Association (LGA). It supports joint working across central and local government to release land and property and boost economic growth, regeneration and integrated public services. It encourages public sector partners to share buildings, transform services, reduce running costs, and release surplus and under-used land for development.
Government Hubs: A regional network of government offices offering shared facilities and services within an interoperable estate, which are acting as a catalyst to transform the Civil Service and create great places to work.
NPV: Net Present Value captures value of an investment or saving over a defined period or lifetime.
Building Research Establishment Environmental Assessment Method (BREEAM): Provides industry recognised certification levels and standards to ensure projects are delivered to high performing and sustainable standards, whilst creating positive environmental and social impact. These standards include sustainable building methods such as utilising natural air flow, building orientation and shading to naturally regulate temperatures and air quality, as well as installation of Building Management Systems (BMS) to intelligently control building conditions based on space utilisation.
The GPS contains three core missions which will ensure the Government estate helps to transform places and services; is smaller, better and greener; and is managed in a professional and increasingly commercial way, informed by high quality property data and insight.
Transforming Places and Services
The location, design, and configuration of public assets can play a crucial role in driving economic growth and regeneration. Across Government and the wider public sector, services are delivering real improvements through more imaginative and integrated estate design, through encouraging co-location and more efficient use of space.
By 2030 government property will have significantly contributed to economic growth, and supported improving the quality of public services, while at the same time helping to transform places and communities.
Case study: Transforming underutilised space into a new Neighbourhood Hub in York
NHS Property Services (NHSPS) partnered with Humber North Yorkshire Integrated Care Board (ICB), GP Federation, Primary Care Networks (PCN) and Acute and Mental Health Trusts to repurpose underutilised healthcare space into a neighbourhood hub, bringing more integrated care into the heart of the community, as recommended by The Fuller Report,[footnote 14] and making the estate more efficient.
Acomb Garth Community Care Centre was a 1980s community unit for the elderly of which 900m2 of space was not in use, accounting for 3/4 of the total space. Building on a long-standing relationship with the then Clinical Commissioning Group (CCG), NHSPS embarked on a joint project to maximise use of the site.
As part of NHSPS’ Social Prescribing programme, £100,000 was invested in a community café, consultation room and outdoor wellbeing space.
Acomb Garth re-opened in 2022, providing 22,000 patients with a greater range of services under one roof and staff with more modern and pleasant working facilities.
The social prescribing hub is being used by a range of services and charities including Dementia Forward, Citizens Advice, and Wheelchair Social Group, allowing local people to create support networks and reduce loneliness and social isolation.
Through the Places for Growth commitment, by March 2023, 12,075 roles had been relocated outside of London, this increased by a third to 16,061 by September 2023. This exceeds the programme’s interim 2025 milestone set out in the Levelling Up White Paper of relocating 15,000 roles by 2025. Through local delivery plans, the Civil Service presence in places across the UK will make a tangible contribution to levelling up in those communities.
Work continues to build on existing progress within organisations, to identify further opportunities for exit from or sharing of property across the government estate. This is already underway for the office estate, led by the GPA and PfG Programmes, work has also been undertaken by local authorities who have been supported by the One Public Estate programme.
The GPA Government Hubs[footnote 15] have continued to grow in number during 2022-23, with the opening of Peterborough, Quay House, which brings together departments into this shared location, making more efficient use of space. Sixteen hubs are now in operation, with a combined floorspace of ~ 330,000m2, located in all four nations of the United Kingdom, providing a network of shared modern workspaces for the UK Civil Service. This regional approach presents opportunities to reduce the footprint of the office estate and enhance collaborative working. The Civil Service will be better represented, linked into wider communities, skills, education establishments and able to draw from a broad pool of talent in line with objectives set out by the Declaration on Government Reform[footnote 16] and the PfG programme. The Hubs are fitted out to meet a common modern design guide,[footnote 17] which aims to deliver the great places to work needed for a modern civil service.
Case study: Quay House Peterborough
Quay House in Peterborough is the GPA’s first new build Hub within the Government Hubs Programme. It sits at the gateway to Fletton Quays and is a crucial part of the £120 million regeneration project for Peterborough.
The Hub was opened in March 2023 to 1,200 civil servants from five government bodies including Defra, Joint Nature Conservation Committee, Environment Agency, Natural England and the HM Passport Office, including their public caller facilities.
Quay House is part of the Government Hubs Programme which exists to create a portfolio of regional office buildings for multi-departmental use, playing a pivotal role in the Levelling Up agenda supporting the relocation of 22,000 Civil Service roles from London and the south‑east.
Four offices will close as civil servants relocate to Quay House. These closures will save an expected £9.1million in operating costs, returning money to the public purse.
Quay House is built to BREEAM Excellent standard. Energy data monitoring and connection to the District Heating Scheme will deliver a low carbon energy efficient building with an Energy Performance Certificate in the top quartile.
Smaller, Better, Greener
The Government Property Strategy sets out that a shift is needed to a higher quality, fit for purpose, shared, more efficient, productive and sustainable estate, which is smaller, better and greener. The ambition is that by 2030 the estate is right-sized, reflecting the requirements of the civil service and modern public services; more flexible and adaptable to meet changing demands and needs for property; planned through improved asset management; managed with an enhanced focus on the customer experience; and contributing towards achieving the commitment to reach net zero emissions by 2050.
This report supports delivery of the GPS through the monitoring and tracking of the following Key Performance Indicators (KPIs), setting baselines where not previously defined:
Table 5: Government Property Strategy KPIs 2022-23: Floor Area
| Smaller | |||
|---|---|---|---|
| KPI: Floor Area of each portfolio (m2) | |||
| Portfolio | 2021/22 | 2022/23 | Change |
| Courts and Tribunals | 1.72m | 1.77m | 2.6% |
| Cultural Assets | 1.64m | 1.63m | -1.1% |
| Defence (Floor Area m2) | 35.66m | 34.34m | -3.7% |
| Defence (Land Area ha) | 0.34m | 0.34m | 0.0% |
| Health | 29.21m | 29.29m | 0.3% |
| Infrastructure | 0.32m | 0.45m | – |
| Job Centres | 1.02m | 0.99m | -3.0% |
| Land (ha) | 0.28m | 0.29m | 0.8% |
| Logistics and Storage | 0.70m | 0.65m | – |
| Offices | 2.99m | 2.85m | -5.0% |
| Overseas | 1.58m | 1.85m | – |
| Prison | 4.04m | 4.04m | -0.1% |
| Probation | 0.35m | 0.32m | -8.0% |
| Schools | 78.70m | 78.70m | 0.0% |
| Science | 1.37m | 1.41m | 2.7% |
| Remaining Estate | 0.99m | 0.96m | – |
For further information on Table notes, please refer to Appendix F at the end of this document.
Notes:
Infrastructure portfolio – Year on year changes are not displayed where comparisons are due to the improvements in data reporting and restructuring rather than material changes in the floor area across the estate.
Logistics and Storage portfolio – In 2022-23 a number of organisations made reclassifications within the portfolio. This included the reclassification of a number of National Highways assets into the Infrastructure portfolio, the reclassification of 2 Tate Modern assets into this portfolio and improvements in HMRC reporting under this portfolio.
Overseas portfolio – Year on year changes are not displayed where comparisons are not like for like, in this instance The British Council have reported floor area which was previously unavailable.
Remaining Estate portfolio – The observed reduction in floor area is due to the reclassification of some of the assets previously reported in this portfolio
Compared to the 2021-22 baseline, there has been an overall 0.7% reduction in the floor area of the government estate. The defence, office and probation portfolios are the main contributing portfolios to this reduction. The key reasons for the material changes impacting the floor area of the government estate have been set out below.
The defence portfolio has seen a decrease of 3.7% in floor area due to their disposal programme,[footnote 18] exits of leases and demolitions to optimise the defence estate as part of the Defence Estate Optimisation (DEO) Portfolio,[footnote 19] which is the single biggest estates change programme within Defence, investing £5.1bn in modern, greener and more sustainable infrastructure.
The size of the office portfolio has decreased by 5.0%, with space reductions observed across all tenure categories. There was a 5.4% reduction overall in freehold offices, with three freeholds transferred from departmental estates into the GPA within Cabinet Office estate during the year. The GPA’s Whitehall Campus Programme is driving exits from non core property to consolidate workspaces into 17 main buildings in central London. This is also shown in the other tenure type category, which represents short leases and serviced office space – this significant reduction shows the focus being on creating the right space and sharing buildings between different departments.
Notable Office floor area reductions by departments included a 31% reduction by Department for Levelling Up, Housing and Communities (DLUHC), 25% reduction in the Department for Education (DfE), due to the consolidation of space in three sites, and a 3% reduction by Department for Work and Pensions (DWP), due to a multi-year consolidation programme. Cabinet Office (CO) saw growth of nearly 20% in the number of office buildings, due to the Government Property Agency (GPA) transferring 25 assets from other government departments during 22-23. This is in line with wider policy and with commensurate reductions in the transferring department’s floor area.
In 2022-23 the Probation portfolio achieved a reduction of 8% in floor area, through the third year of the Probation Reform Programme which delivered a 4-year estate strategy to begin to transform and rationalise the probation estate. Community Rehabilitation Companies (CRC) buildings were moved back under the Probation Service as part of the programme. However, a number of these Community Rehabilitation Companies (CRC) sites were not retained due to site issues, such as; security of tenure, accessibility/equality, poor condition, flexible workspace, keeping users safe, enabling environment and opportunity to co-locate in other Probation buildings. Although the programme formally closed this year, a number of estates projects will complete in 2024/25.
Case study: Reduction of DWP Office Estate
One of the key priorities of the Government’s Property Strategy is to reduce the core public estate footprint and create a smaller, better and greener estate. The DWP Workplace Transformation Programme is a critical enabler to achieve this goal. The programme has a 10-year plan to reduce the number of Back of House locations by 62%.
Over the current spending review (SR) period, DWP plan to reduce by March 2025 the Back of House Estates from 127 to 75 sites.
2022-23 was a pivotal year in the programme with the exit of 37 office buildings totalling 141,000m2. The exits achieved by exploiting lease opportunities were primarily compressed into Q3/Q4 2022-23.
All planned exits were achieved. The programme moved key operations to retained sites within the existing DWP Estate and wider public estate.
Table 6: Government Property Strategy KPIs 2022-23: Running Cost
| Smaller | |||
|---|---|---|---|
| KPI: Annual running cost each portfolio (£) | |||
| Portfolio | 2021/22 | 2022/23 | Change |
| Courts and Tribunals | 448.3m | 375.7m | -16.2% |
| Cultural Assets | 126.6m | 152.9m | 20.8% |
| Defence | 2,786.3m | 2,883.8m | 3.5% |
| Health | 12,298.9m | 12,967.9m | 5.4% |
| Infrastructure | 36.2m | 38.0m | – |
| Job Centres | 487.0m | 503.4m | 3.4% |
| Land | 7.8m | 26.1m | – |
| Logistics and Storage | 60.4m | 58.7m | – |
| Offices | 1,599.5m | 1,454.5m | -9.1% |
| Overseas | 370.4m | 371.5m | 0.3% |
| Prison | 1,037.4m | 1,052.6m | 1.5% |
| Probation | 109.3m | 126.7m | 15.9% |
| Schools | 1,489.9m | 1,614.0m | 8.3% |
| Science | 190.1m | 201.6m | 6.0% |
| Remaining Estate | 159.6m | 211.3m | – |
For further information on Table notes, please refer to Appendix F at the end of this document.
Notes:
Infrastructure portfolio – Due to improved data quality received from Nuclear Decommissioning Authority (NDA) Group entities. As well as the government pause on some areas of HS2 in early 2023, and the subsequent 2023 announcement meant that some assets in HS2’s infrastructure portfolio that were acquired for the railway will no longer be required and therefore are more appropriately classified under Remaining Estate in 2022-23. Yearly changes are not comparable.
Land portfolio – Improved reporting by Homes England means yearly changes are not comparable, and do not reflect material changes to the estate.
Logistics and Storage Portfolio – In 2022-23 a number of organisations made reclassifications within the portfolio. This included the reclassification of a number of National Highways assets into the Infrastructure portfolio, the reclassification of 2 Tate Modern assets into this portfolio and improvements in HMRC reporting under this portfolio.
Remaining Estate portfolio – Due to the aforementioned reclassification of HS2’s Infrastructure portfolio to Remaining Estate, as well as an improvement in cost reporting by the Maritime and Coastguard Agency, yearly comparisons are not displayed.
Compared to the 2021-22 baseline, there has been an overall 3.9% increase in the running cost of the government estate. The Health, School and Defence portfolios are the main contributing portfolios to this increase. The key reasons for the material changes impacting the running cost of the government estate have been set out in the estate summary section of this report, additional portfolio details are set out below.
The Cultural Assets portfolio has seen an increase of 20.8% in running costs in 2022-23 due to improvement programmes, uplift in costs of materials & labour and rising prices of utilities. The improvement programmes include the Victoria and Albert Museum, where capital project works were completed bringing additional assets into operational budgets; The British Library undertook a major Knowledge Centre rewiring project at St Pancras. The British Library also had the cessation of rates relief for St Pancras during Covid-19, an increase in repairs particularly at St Pancras following Covid-19, as well as substantial increases in electricity, gas and water costs.
The Probation portfolio has had an increase of 15.9% above its baseline as a result of increased rent and rates, additionally fuel and utilities costs in this portfolio have increased by approximately 50%, over the 2022-23 reflective of current energy prices.
The running costs of the Courts and Tribunals portfolio decreased in real terms by 16.2% from £465.2m in 2020-21 to £375.7m in 2022-23. This is due primarily to property exits during the year as part of their estate rationalisation. Office portfolio running costs decreased by 8.5% compared to the baseline. The rationalisation of the estate through exercising lease breaks/exits on expiry has contributed to this saving, e.g. exits made by the Department for Work and Pensions (DWP) as part of a multi-year consolidation programme. Transfers to GPA, together with more efficient use of shared government hubs has reduced the overall size, and therefore cost, of the office portfolio.
Table 7: Government Property Strategy KPIs 2022-23: Reported Freehold Value
| Smaller | |||
|---|---|---|---|
| KPI: Capital value of each portfolio (£) | |||
| Portfolio | 2021/22 | 2022/23 | Change |
| Courts and Tribunals | 3.37bn | 3.40bn | 1.0% |
| Cultural Assets | 5.73bn | 5.86bn | 2.3% |
| Defence | 32.05bn | 33.14bn | 3.4% |
| Health | 59.65bn | 60.00bn | 0.6% |
| Infrastructure | 0.40bn | 0.45bn | – |
| Job Centres | [No freehold assets] | ||
| Land | 4.65bn | 4.77bn | 2.6% |
| Logistics and Storage | 0.08bn | 0.09bn | – |
| Offices | 2.21bn | 1.75bn | -20.7% |
| Overseas | 2.45bn | 2.57bn | 5.1% |
| Prison | 7.87bn | 7.85bn | -0.3% |
| Probation | 0.16bn | 0.17bn | 6.8% |
| Schools | 60.44bn | 63.66bn | 5.3% |
| Science | 2.20bn | 2.47bn | 12.3% |
| Remaining Estate | 0.79bn | 0.88bn | – |
For further information on Table notes, please refer to Appendix F at the end of this document.
Notes:
Infrastructure – Due to reclassifications of assets by National Highways, yearly comparisons are not like-for-like
Logistics and Storage portfolio – Year on year changes are not displayed where comparisons are not like-for-like, and do not represent material changes to the value of the estate. This has been due to reclassifications by the Tate Modern of two assets into this portfolio as well as improvements in HMRC reporting of value under this portfolio.
Remaining Estate portfolios – Due to the aforementioned reclassifications of assets by National Highways, yearly comparisons are not like-for-like
The freehold value of the government estate has increased by 2.8% in 2022-23. This is comparably consistent with the private sector, where the value of commercial property stock at the end of 2022[footnote 20] is less than it was in 2021 and close to 2016 values, which represents a significant fall in real terms for the private sector. The key reasons for the material changes impacting the reported value of the government estate have been set out in the estate summary section of this report, additional portfolio details are set out below.
Despite the overall increase in the reported freehold value of the estate, the Office portfolio’s current evaluation is 20.7% below the 2021-22 baseline, this is a reflection of market and economic uncertainty over the past 12 months. This has impacted the overall valuation of the government estate. In addition to economic uncertainty, NHS Property Services (NHSPS) reported that the reduction in the value of their office estate (accounting for around a fifth of the overall reduction in Office portfolio value), can be predominantly attributed to the NHSPS remit to repurpose or dispose of vacant space held by health providers in order to reinvest into the health estate.
Table 8: Government Property Strategy KPIs 2022-23: Capital Receipts
| Smaller | |
|---|---|
| KPI: Gross unconditional capital receipts from the sale of surplus property and number of sites sold | |
| Progress [2022-23] | Target |
| £1.1 bn | £1.5bn by 2024/25 |
For further information on Table notes, please refer to Appendix F at the end of this document.
The GPS commits to: Develop a pipeline of disposals, aiming to generate gross capital receipts of £500m per annum, to fund investment in the estate we need to keep.
In 2022-23 there were 306 disposals from eight departments in 2022-23. The total gross disposal receipts from confirmed unconditional sales amounted to £1.1bn. Further detail is available within the Disposals section of this report.
Table 9: Government Property Strategy KPIs 2022-23: Whitehall Campus
| Smaller | ||||
|---|---|---|---|---|
| KPI | Baseline [2018‑19] | 2022-23 | Change | Target |
| Progress in exiting from central London offices through the Whitehall Campus Programme – buildings | 79 | 43 | 36 | Reduction to 17 to 20 buildings by 2030 |
| Progress in exiting from central London offices through the Whitehall Campus Programme – accommodation | Accommodation for 92,000 civil servants | Accommodation for 74,000 civil servants | Accommodation for 18,000 fewer civil servants | Accommodation for 40,000 civil servants by 2030 |
| Central London offices floor area | 614,000m2 | 420,000m2 | 194,000m2 | 243,000m2 |
For further information on Table notes, please refer to Appendix F at the end of this document.
The GPA’s Whitehall Campus Programme is consolidating the Government’s Central London Office Portfolio, to meet the commitment of “no more than 20 core buildings”,[footnote 21] with a current target of 17 buildings, to accommodate a maximum of 40,000 civil servants by 2030. The Programme supports the Places for Growth programme initiative to increase the numbers of civil servants in key regional locations in part by reducing the numbers in London.
In 2022-23, a total of 10 buildings had vacated, which provided a reduction of £35.2m in annual running costs. The GPA continues to drive closures of all ‘Non-Core’ office buildings, particularly in Central London, and consolidate the Whitehall estate into 17 core buildings, to save money to the tax-payer and house civil servants in shared government hub buildings with modern facilities.
Government Property Strategy: Condition
Extensive work is underway across government to coordinate a consistent approach to building condition and maintenance. This includes a joined-up approach for how condition is measured across a diverse range of building types, and a cross-government approach to defining and the calculation of backlog maintenance, including specific issues such as Reinforced Autoclaved Aerated Concrete.
As part of the Government Property Strategy we are developing a standard, consistent methodology for building maintenance and risk management. By addressing inherent and emerging risks in this way we will drive improvements at the point of service delivery, enhance our strategic asset plans and improve information reporting for the future to help us deliver a smaller, better and greener public estate.
Table 10: Government Property Strategy KPIs 2022-23: GGCs
| Greener | |
|---|---|
| KPI: Progress against the GGCs | 2022-23 |
| Reduction in direct emissions from government buildings compared with the 2017-18 baseline | 14% reduction |
| Percentage of new acquisitions in the top quartile of energy performance | 44% (22) Upper quartile range 2022-23: [0-46] |
Energy Performance Certificate (EPC): Required as part of the Energy Performance of Buildings Directive (EPBD), EPCs are required for domestic and non-domestic buildings over 50 square metres of floor space when constructed, sold or rented. There are exemptions (e.g. an industrial site, workshop or non-residential agricultural building that doesn’t use much energy). EPCs are valid for 10 years. The EPC records energy efficiency of a property using an A-G rating scale (A most efficient, G least efficient).
Top quartile commitment: A commitment to procure buildings in the upper quartile of energy performance. Originally announced in the Energy Efficiency Action Plan 2004, it is now a requirement of the Climate Change Act 2008.
For further information on Table notes, please refer to Appendix F at the end of this document.
The UK government has committed to all new acquisitions to be in the top quartile of energy performance, unless exemptions apply. For 2022-2023 year; an EPC rating of 0 – 46 met the top quartile of energy performance, any rating above 46 means the building falls outside the upper quartile for energy efficiency. As the energy performance of the UK building stock improves over time, the number of buildings with better ratings increases, resulting in an upward move of threshold to enter the top quartile. Further information is available within the Greener Government Estate section of this report.
In addition to KPIs a number of portfolio specific utilisation targets are measured and monitored:
Table 11: Government Property Strategy Utilisation Metrics 2022/23
| Portfolio | Utilisation Metric | Baseline | 2022-23 | Change | Target |
|---|---|---|---|---|---|
| Offices (note 2) | m2 per FTE | 8.9m2 (note 2) (March 2020 (note 1)) | 8.2m2 | -7.2% | 6m2 by 2030 |
| Probation | Probation staff No. | 17,785 | 19,850 | 11.6% | 18% increase in staff |
| Property holdings | 664 (December 2021) | 500 | -24.7% | 3% reduction in holdings | |
| Primary care | % reduction in void space NHS Property Services | 124,963m2 | 112,500 | -10.0% | Over 20% reduction |
| % reduction in void space Community Health Partnerships | 33,104m2 (March 2021) | 28,132 | -15.0 | ||
| Job Centres | Job Centre Plus m2/Individual on Universal Credit | 0.227 (March 2020) | 0.163 | -0.064 | N/A |
| Job Centre Plus m2/Individual Work Related on Universal Credit | 0.385 (March 2020) | 0.360 | -0.025 | N/A |
For further information on Table notes, please refer to Appendix F at the end of this document.
Note 1: 2019/20 has been used as a baseline as 2020/21 represented the first year of the COVID pandemic when there were short term changes to some organisation operating models. This allows changes in utilisation to be compared to a pre-pandemic baseline.
Note 2: Baseline source: State of the Estate 2019/20
Note: For some portfolios, e.g. schools and cultural assets, utilisation targets are not the most appropriate metric to understand the efficiency of asset use. In these cases progress will be captured through size and cost data.
In 2022-23, the utilisation of office space by full time staff (FTE/m2) has improved by 7.2% compared to the 2020 baseline.
The total number of probation staff has increased from 17,785 to 19,850 (11.6%) when compared to 2021. In conjunction with carrying a number of vacancies, the Probation Service has an updated operating model that requires a greater number of probation officers when compared to their previous model of operation. This has led to increased recruitment.
The probation property holding has decreased by 24.7% compared to the 2021 December baseline i.e. beyond the targeted 3% reduction. In 2022-23 the total number of Probation built assets decreased by 4.2% from 522 to 500. This was the third year of the Probation Reform Programme which delivered a 4-year estate strategy to begin to transform the probation estate.
In 2022-23 there was a 10% and 15% reduction in unused space within NHS Property Services and Community Health Partnerships respectively compared to 2021. This is in line with the proposed target of over 20% reductions.
In 2022-23, there has been a decrease of 0.064m2 per individual on universal credit and additionally a decrease of 0.025m2 per individual work related on universal credit in job centres utilisation. There is a variation in the utilisation driven by changing priorities, change in policies and customer needs. The metric will fluctuate year on year to reflect these conditions.
Running Cost Savings
The GPS makes the following commitment on delivering property efficiencies from the estate: Deliver £500m operating cost savings from the estate, as part of the 5% savings that departments have been asked to make against their operational budgets by 2024/25.
Following publication of the Strategy in August 2022, in 2022-23 the Office of Government Property began collecting preliminary data from across Government to assess progress against this commitment. Provisional figures show that in 2022-23 there were a number of key contributors to savings. NHS England and NHS Improvement reported savings of £179.1m[footnote 22] made by NHS Trusts and NHS Foundation Trusts, with NHS property services reporting an additional £41.9m from their health estate. The DWP reported savings of £34.9m and HMRC reported a further £12.4m. Savings have been delivered through a wide range of estates productivity and efficiency measures including the move to cross government hubs, the introduction of hybrid working, releasing surplus operational property back to the market and smarter FM contracting.
Chapter 3: Size of the Government Estate
Freehold: The freeholder of a property owns it outright, including the land it’s built on.
Leasehold: A temporary ownership linked to a length of time (e.g. 10 years), but still giving ‘exclusive possession’ to a tenant for that period.
Private Finance Investment: A Private Finance Initiative (PFI) is a long-term contract between a private party and a government entity where the private sector designs, builds, finances and operates a public asset and related services. In a PFI contract the private party bears the risks associated with construction and maintenance and management responsibility, and remuneration is linked to performance.
Floor Area
In 2022-23 the estate remained fairly stable in terms of size, covering 159.2 million m2, a reduction of 0.7% from 2021-22 and an increase of 1.3% from 2020-21. The School,[footnote 23] Health and Defence estates continue to represent the majority of the estate by floor area, accounting for 49.5%, 21.6% and 18.9% respectively.
Figure 6: Floor area of the Estate, by Tenure Type 2020/21-2022/23
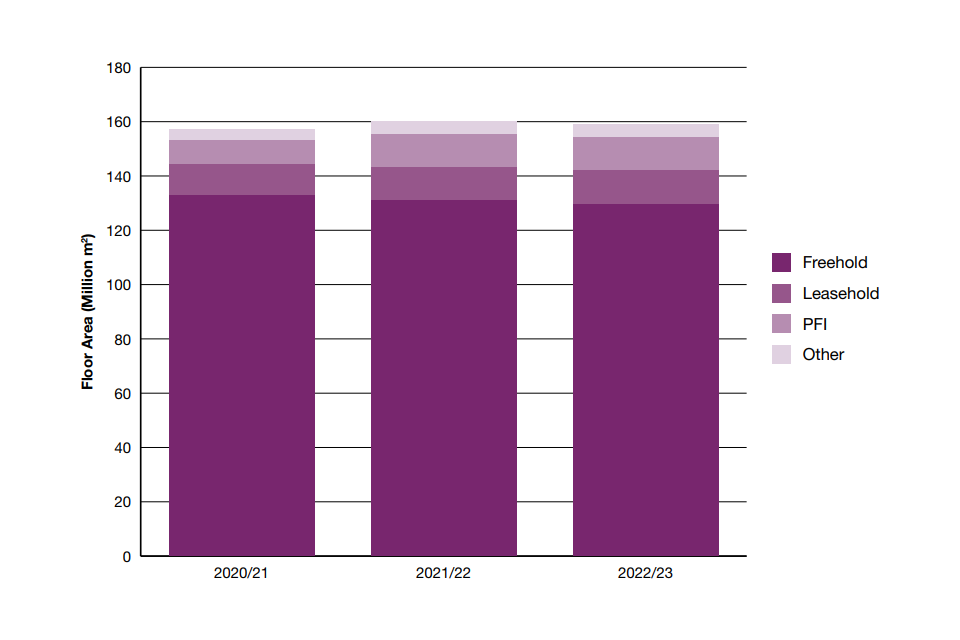
Table 12: Floor area of the Estate, by Tenure Type 2020/21-2022/23
| Tenure Type | 2020/21 | 2021/22 | 2022/23 | Change 2021/22-2022/23 |
|---|---|---|---|---|
| Total Floor Area (a) | 157.2m | 160.3m | 159.2m | -0.7% |
| Freehold (m²) | 132.9m | 130.9m | 129.6m | -1.0% |
| Leasehold (m²) | 11.6m | 12.3m | 12.4m | 0.6% |
| PFI (m²) (k) | 8.7m | 12.2m | 12.2m | – |
| Other (m²) | 4.0m | 4.9m | 5.0m | 1.5% |
For further information on Table notes, please refer to Appendix F at the end of this document.
In terms of floor area, the estate is primarily freehold, 129.6 million m2, equivalent to 81.4% of the estate. The Defence and Health portfolios are primarily freehold, 70.2% and 56.9% respectively. A further 27.9% (8.2 million m2) of the Health estate is held as Private Finance Investment.
Table 13: Floor Area of Government Built Assets, by Portfolio 2020/21-2022/23
| Portfolio | 2020/21 | 2021/22 | 2022/23 | Change 2021/22-2022/23 |
|---|---|---|---|---|
| Total Floor Area (a) | 157.2m | 160.3m | 159.2m | -0.7% |
| Courts and Tribunals | 1.7m | 1.7m | 1.8m | 2.6% |
| Cultural Assets | 1.6m | 1.6m | 1.6m | -1.1% |
| Defence | 33.0m | 35.7m | 34.3m | -3.7% |
| Health | 29.1m | 29.2m | 29.3m | 0.3% |
| Infrastructure | 0.3m | 0.3m | 0.5m | – |
| Job Centres | 0.8m | 1.0m | 1.0m | -3.0% |
| Logistics and Storage | 0.5m | 0.7m | 0.6m | – |
| Offices | 3.4m | 3.0m | 2.8m | -5.0% |
| Overseas | 1.6m | 1.6m | 1.8m | – |
| Prison | 4.0m | 4.0m | 4.0m | -0.1% |
| Probation | 0.3m | 0.3m | 0.3m | -8.0% |
| Schools | 78.7m | 78.7m | 78.7m | 0.0% |
| Science | 1.0m | 1.4m | 1.4m | 2.7% |
| Remaining Estate | 1.0m | 1.0m | 1.0m | – |
For further information on Table notes, please refer to Appendix F at the end of this document. Notes:
Infrastructure portfolio – Year on year changes are not displayed where comparisons are due to the improvements in data reporting and restructuring rather than material changes in the floor area across the estate.
Logistics and Storage portfolio – In 2022-23 a number of organisations made reclassifications within the portfolio. This included the reclassification of a number of National Highways assets into the Infrastructure portfolio, the reclassification of 2 Tate Modern assets into this portfolio and improvements in HMRC reporting under this portfolio.
Overseas portfolio – Year on year changes are not displayed where comparisons are not like for like, in this instance The British Council have reported floor area which was previously unavailable.
Remaining Estate portfolio – Periods are not comparable due to the reclassification of some of the assets previously reported in this portfolio.
Vacant and Surplus Space
Vacant Space: Space within a property that is not currently required by the occupying organisation, which an organisation is prepared to release for another organisation.
Surplus Space: Areas which are no longer required by the organisation and are considered surplus and available for disposal.”
Vacant floor area at 592,800m2 increased by 1.3% in 2022-23. This was driven primarily by the Office portfolio with an increase of 23,300 m2 relating primarily to the Office for National Statistics (ONS). Following an internal review to identify efficiencies and establish how much office space it requires, the ONS identified vacant areas and have taken steps to return parts of its office to the GPA who will consider the best approach and value for this location.
The probation portfolio also reported increasing vacant space which is attributable to the New Probation Reform Programme acquisitions which have not yet been fitted out.
Conversely, there was a decrease in vacant floor area within the health portfolio of 4.3%.
NHS trusts regularly review how they use their space, with service needs and potential capital programmes impacting how it helps to deliver services. The reconfiguration of space aids better utilisation, leading to a reduction in empty floor area.
Surplus floor area and land area reduced in 2022-23 by 18.9% and 63.7% respectively. Reductions in surplus floor area were driven by the Office portfolio (124,000m2 reduction), where a number of Network Rail sites with surplus space closed during 2022 and the Health portfolio (40,500m2 reduction), due to reductions by NHS England and NHS Improvement. Reductions observed in surplus land relate to decreases reported by Defra and the Department for Business, Energy & Industrial Strategy (BEIS) Coal Authority.
Table 14: Vacant and Surplus Floor Area within Government Built Assets, by Portfolio 2020/21-2022/23
| 2020/21 | 2021/22 | 2022/23 | Change 2021/22-2022/23 | |
|---|---|---|---|---|
| Total Vacant Floor Area (a) | 697.5k | 585.2k | 592.8k | 1.3% |
| Courts and Tribunals | ||||
| Cultural Assets | ||||
| Defence | ||||
| Health | 603.0k | 503.0k | 481.5k | -4.3% |
| Infrastructure | 37.0k | 37.0k | 37.0k | 0.1% |
| Job Centres | 1.9k | |||
| Logistics and Storage | 11.6k | 2.6k | 3.3k | 30.7% |
| Offices | 24.2k | 32.8k | 56.2k | 71.0% |
| Overseas | ||||
| Prison | ||||
| Probation | 6.7k | |||
| Schools | ||||
| Science | 4.3k | 3.8k | 3.3k | -12.3% |
| Remaining Estate | 15.4k | 6.0k | 4.8k | -20.0% |
| Total Surplus Floor Area (a) (b) | 830.0k | 673.3k | -18.9% | |
| Courts and Tribunals | 5.8k | 5.8k | 0.0% | |
| Cultural Assets | ||||
| Defence | ||||
| Health | 527.2k | 486.7k | -7.7% | |
| Infrastructure | ||||
| Job Centres | ||||
| Logistics and Storage | 6.3k | 3.9k | -38.6% | |
| Offices | 259.0k | 135.0k | -47.9% | |
| Overseas | ||||
| Prison | 17.8k | 28.0k | 57.5% | |
| Probation | ||||
| Schools | ||||
| Science | 3.1k | 3.1k | 0.0% | |
| Remaining Estate | 10.9k | 10.9k | 0.1% |
For further information on Table notes, please refer to Appendix F at the end of this document.
Built Assets
Built Asset: The definition of a built asset can vary between reporting organisations. A built asset might refer to a building or a group of buildings (but not to infrastructure or land with no buildings). The number of built assets in one portfolio might represent the number of buildings, but in another the approach might be different: for example a prison may comprise one building or multiple buildings, schools have generally counted built assets as whole schools and defence establishments have enumerated individual buildings. With the introduction of the Property Data Standard, work continues to improve reporting and bring greater consistency.
The definition of built asset can vary between organisations, and therefore direct comparisons between portfolios should be made carefully. Although Schools account for the majority of estate floor area, they recorded the second highest proportion of built assets within the estate (15.6%). However schools have generally counted built assets as whole schools, even though they may comprise multiple buildings. The defence portfolio contains the highest proportion of built assets across the estate (67.6%); however the defence establishments tend to enumerate individual buildings. The Health portfolio recorded 7,367 built assets in 2022-23, this accounts for a further 5.2% of built assets across the estate. This portfolio covers three distinct categories and a broad range of assets, for example: Primary Care and Community Health, comprising blood donor centres, health clinics and community hospitals; NHS Trust Hospitals (Secondary Care), including general, specialist, mixed service and Residential and Health Care facilities.
The Overseas portfolio recorded 6,848 built assets (4.8% of the estate) in 2022-23. The government’s overseas estate spans around 180 countries. Almost all (99.2%) of these assets are managed by the Foreign, Commonwealth and Development Office (FCDO). The Home Office (HO), BEIS and Digital, Culture, Media and Sport (DCMS) make up the remaining 0.8%. Overseas defence assets are recorded in the Defence, rather than the Overseas, portfolio.
While, in 2022-23, built assets across the estate decreased by 0.9% driven by disposals and demolitions within the defence estate, increases were observed across the Overseas (relating to the FCDO), Science (relating to UK Research and Innovation) and Health (relating to NHS Property Services) portfolios.
Table 15: Number of Government Built Assets, by Portfolio 2020/21-2022/23
| Portfolio | 2020/21 | 2021/22 | 2022/23 | Change 2021/22-2022/23 |
|---|---|---|---|---|
| Total Built Assets | 143,732 | 142,899 | 141,641 | -0.9% |
| Courts and Tribunals | 362 | 366 | 360 | -1.6% |
| Cultural Assets | 263 | 297 | 287 | -3.4% |
| Defence | 98,497 | 97,512 | 95,750 | -1.8% |
| Health | 7,899 | 7,341 | 7,367 | 0.4% |
| Infrastructure | 1,826 | 1,826 | 729 | – |
| Job Centres | 688 | 831 | 825 | -0.7% |
| Logistics and Storage | 633 | 694 | 585 | – |
| Offices | 1,408 | 1,260 | 1,218 | -3.3% |
| Overseas | 6,597 | 6,597 | 6,848 | 3.8% |
| Prison | 377 | 393 | 383 | -2.5% |
| Probation | 473 | 522 | 500 | -4.2% |
| Schools | 22,031 | 22,031 | 22,031 | 0.0% |
| Science | 491 | 674 | 704 | 4.5% |
| Remaining Estate | 2,187 | 2,555 | 4,054 | – |
For further information on Table notes, please refer to Appendix F at the end of this document.
Notes:
Infrastructure portfolio – Year on year changes are not displayed where comparisons are due to the improvements in data reporting and restructuring rather than material changes in the built assets across the estate.
Logistics and Storage portfolio – In 2022-23 a number of organisations made reclassifications within the portfolio. This included the reclassification of a number of National Highways assets into the Infrastructure portfolio, the reclassification of 2 Tate Modern assets into this portfolio and improvements in HMRC reporting under this portfolio.
Remaining Estate portfolio – The government pause in early 2023 on some areas of HS2, and the subsequent 2023 announcement has meant that some assets that were acquired for the railway will no longer be required and therefore are more appropriately classified under Remaining Estate in 2022-23
Land Area
Land: Land that is either not developed or if previously developed is no longer substantially occupied by buildings. Land assets vary from land for development to agricultural land, woodland, nature conservation, sand dunes, lakes and flood mitigation.
The land portfolio excludes defence training land which is reported under the Defence portfolio.
The government estate includes land that is not directly associated with buildings and is used for a wide variety of different purposes from coach and lorry parking, to forests and lakes.
In 2022-23 Land assets increased by 1.9% with the Defence portfolio accounting for 49.5% of the increase as a result of the Defence Infrastructure Organisation (DIO) Accommodation Capital Purchase Programme.[footnote 24] Defra accounted for a further 28.0% of the increase.
Chapter 4: Running the Government Estate
Value: In this report, this refers to the value of the freehold estate excluding any leasehold (except where an asset is a virtual freehold and has been acquired through an up front capital payment and where only a minimal peppercorn rent/ground rent/service charge is paid).
Freehold property assets are valued on different bases, outlined below:
- Depreciation Replacement Cost (DRC)
- Existing Use Value (EUV)
- Market Value (MV)
- Other – UK Estate
- Other – Non-UK estate
To provide a high level estimate of total value, estimates of different types have been aggregated, so that the total value is an approximation that reflects the limitation of this approach.
DRC:[footnote 25] The current cost of replacing an asset with its modern equivalent asset less deductions for physical deterioration and all relevant forms of obsolescence and optimisation.
EUV:[footnote 26] The estimated amount for which a property should exchange on the valuation date between a willing buyer and a willing seller in an arm’s length transaction after proper marketing and where the parties had acted knowledgeably, prudently and without compulsion, assuming that the buyer is granted vacant possession of all parts of the asset required by the business, and disregarding potential alternative uses and any other characteristics of the asset that would cause its market value to differ from that needed to replace the remaining service potential at least cost.
MV: The estimated amount for which an asset or liability should exchange on the valuation date between a willing buyer and a willing seller in an arm’s length transaction, after proper marketing and where the parties had each acted knowledgeably, prudently and without compulsion.
Freehold Value
The value reported for the freehold estate has increased by 2.8% to £187.1bn since 2021-22. The Health portfolio accounts for £60bn (34.1%) of value, followed by the School (34.0%) and the Defence portfolio (17.7%). The increase was primarily a result of schools previously out of scope of this report, being classified as academies and as a result, now in scope.
Value within the Health and Defence portfolios increased by 0.6% and 3.4% respectively in 2022‑23; these increases are attributable to the impact of inflation and market changes as well as structural realignments across the Health portfolio.
Table 16: Estimated value of the Freeholds across the Estate, by Portfolio, 2020/21-2022/23
| Portfolio | 2020/21 | 2021/22 | 2022/23 | Change 2021/22-2022/23 |
|---|---|---|---|---|
| Total Estate (a) | 177.3bn | 182.1bn | 187.1bn | 2.8% |
| Courts and Tribunals | 3.2bn | 3.4bn | 3.4bn | 1.0% |
| Cultural Assets | 5.4bn | 5.7bn | 5.9bn | 2.3% |
| Defence | 37.5bn | 32.1bn | 33.1bn | 3.4% |
| Health | 54.5bn | 59.7bn | 60.0bn | 0.6% |
| Infrastructure | 0.4bn | 0.4bn | 0.5bn | – |
| Job Centres | 0.0bn | 0.0bn | 0.0bn | |
| Land | 4.6bn | 4.6bn | 4.8bn | 2.6% |
| Logistics and Storage | 0.3bn | 0.1bn | 0.1bn | – |
| Offices | 1.2bn | 2.2bn | 1.8bn | -20.7% |
| Overseas | 2.4bn | 2.5bn | 2.6bn | 5.1% |
| Prison | 7.2bn | 7.9bn | 7.8bn | -0.3% |
| Probation | 0.2bn | 0.2bn | 0.2bn | 6.8% |
| Schools | 58.1bn | 60.4bn | 63.7bn | 5.3% |
| Science | 1.6bn | 2.2bn | 2.5bn | 12.3% |
| Remaining Estate | 0.8bn | 0.8bn | 0.9bn | – |
For further information on Table notes, please refer to Appendix F at the end of this document.
Notes:
Infrastructure portfolio – Year on year changes are not displayed where comparisons are due to the improvements in data reporting and restructuring rather than material changes in the built assets across the estate.
Logistics and Storage portfolio – In 2022-23 a number of organisations made reclassifications within the portfolio. This included the reclassification of a number of National Highways assets into the Infrastructure portfolio, the reclassification of 2 Tate Modern assets into this portfolio and improvements in HMRC reporting under this portfolio.
Remaining Estate portfolio – In 2022-23 Sport England provided data on a number of National centres which were previously not reported.
Disposals
Disposals data collection: Disposal information from 2022-23 is collected by the Office of Government Property, within the Cabinet Office. These reflect gross capital receipts from the sale of land and property at the point where the sale is considered unconditional. An unconditional sale receipt is one received at the point of exchange of an unconditional contract, or at the date when all conditions in a conditional contract have been met – for example the grant of planning permission. This method aligns with that used for the previous Disposals and Public Sector Land Programme that ran between 2015 and 2020.
A wider definition for recording receipts from disposals was used in 2021 and 2022 when the Disposals programme was not active. This wider definition permitted exits from leasehold properties, and as such the data on government disposals is not directly comparable between 2022-23 and the previous two years. Previous years’ data are therefore not presented in this report.
The GPS commits the Government to develop an annual pipeline of at least £500 million of disposals each year between 2022-23 and 2024-25, a total of £1.5bn. The Office of Government Property (OGP) has established an Efficiency & Disposals Programme to ensure effective oversight of disposals and to assure that the target is met. Under the programme, government organisations provide information on their surplus sites to OGP, including forecast and actual sales data. Disposals in this report relate to actual sales data.
There were 306 disposals from eight departments in 2022-23. The total gross disposal receipts from confirmed unconditional sales amounted to £1.1bn.
Table 17: Disposal Receipts by Portfolio, 2022/23
| Portfolio (a) | Disposal Receipts (£) | Total number of Sold Sites | Total Site Area (ha) for sold sites |
|---|---|---|---|
| Courts and Tribunals | 2.8m | 2 | 0.8 |
| Defence | 65.1m | 24 | 34.6 |
| Health – Community, Other Health & Social Care | 3.0m | 3 | 14.1 |
| Health – Primary Care & Community | 10.4m | 3 | 0.5 |
| Health – Secondary Care | 39.0m | 26 | 8.9 |
| Infrastructure | 53.9m | 43 | 25.4 |
| Land | 222.2m | 180 | 513.3 |
| Overseas | 695.0m | 10 | 2.7 |
| Prison | 973.8k | 5 | 0.1 |
| Probation | 300.0k | 1 | 0.1 |
| Remaining Estate | 7.6m | 7 | 0.9 |
| Schools | 4.6m | 2 | 0.9 |
For further information on Table notes, please refer to Appendix F at the end of this document.
In 2022-23, there were 10 overseas disposals that raised £695.0m. These disposals were made by the FCDO. The proceeds from this sale are being reinvested to help fund improvement projects across the FCDO overseas estate.
One hundred and eighty UK land disposals were made from five government organisations. These disposals raised £222.2m. The majority of these land disposals were made by Homes England, who sold 112 land assets, accounting for approximately 500ha. The land sold by Homes England is primarily used to unlock development opportunities for housing construction and to facilitate regeneration projects in our towns and cities.
Additionally, the MoD made 24 disposals which raised £65.1m accounting for approximately 34.6ha. Twenty-one secondary health care disposals were delivered by NHS Trusts/NHS Financial Trusts, these raised £34.3m. In addition, NHS Property Services disposed of 5 secondary health care sites which raised a further £4.6m.
Forty-three infrastructure disposals were made in the reporting period raising £53.9m. These disposals were primarily made by Network Rail, who accounted for approximately 23.5ha.
Running Costs
Rent for leaseholds: The total annual monetary amount paid by the tenant to the landlord, as defined within the terms of the lease or occupancy agreement.
Rates: The annual payment for Business Rates also known as Non-Domestic Rates in the UK or other annual payment to a local or regional authority. Environmental taxes and charges such as parking should be included while any business and sales taxes that are levied on business profits and sales as distinct from the occupation of the building should be excluded.
Soft FM: This covers all non-maintenance costs, such as cleaning, reception, grounds maintenance, catering, and reprographics, and may include utilities (electricity, gas, water, and sewage) and waste management costs.
Hard FM: These costs are fixed in service contracts and would include internal repair & maintenance cost, M&E repair and maintenance cost, and external and structural repair costs
Security Costs: Annual cost of securing the premises. Includes: costs of security contractors and employed staff, as well as the regular costs associated with the maintenance of security systems (usually in the form of a maintenance contract).
Other Costs: These are other service provision costs such as utilities, service charges, waste management etc which do not form part of FM Costs and Security Costs.
Total annual operating cost: The total net cost of operating property per year. Income from subletting and charged use of facilities are subtracted from the total expenditure to give the total annual operating cost. Includes occupation costs, building operation costs, business support costs, property management costs, utilities and capital charges.
In 2022-23 total estate running costs increased by 3.9% to £22.0bn. Key contributing factors include the increased cost of energy and impact of inflation across the estate. The Health portfolio reported the highest running costs between in 2022-23 at £13.0bn, the increase in running costs in this portfolio accounted for 80.5% of the increase in running costs across the estate. Increasing Health portfolio running costs are additionally attributable to an increase in the number of patients passing through the NHS estate (an increase of 1.7m from 2021-22), which directly impacts facilities management costs such as cleaning, catering, portering and linen and laundry. Other contributors include the School portfolio, where previously out of scope academy premises costs are now in scope of the report due to increase in the number of schools classified as academies.
Table 18: Running Cost of the Government Estate, by Portfolio 2022/23
| Portfolio (a)(b) | 2020/21 | 2021/22 | 2022/23 | Change 2021/22-2022/23 (c) |
|---|---|---|---|---|
| Total Running Cost | 20,893.2m | 21,207.9m | 22,038.8m | 3.9% |
| Courts and Tribunals | 465.2m | 448.3m | 375.7m | -16.2% |
| Cultural Assets | 121.4m | 126.6m | 152.9m | 20.8% |
| Defence | 2,975.3m | 2,786.3m | 2,883.8m | 3.5% |
| Health | 11,833.6m | 12,298.9m | 12,967.9m | 5.4% |
| Infrastructure | 34.5m | 36.2m | 38.0m | – |
| Job Centres | 359.3m | 487.0m | 503.4m | 3.4% |
| Land | 7.8m | 7.8m | 26.1m | – |
| Logistics and Storage | 23.6m | 60.4m | 58.7m | – |
| Offices | 1,789.1m | 1,599.5m | 1,454.5m | -9.1% |
| Overseas | 365.1m | 370.4m | 371.5m | 0.3% |
| Prison | 1,076.6m | 1,037.4m | 1,052.6m | 1.5% |
| Probation | 97.1m | 109.3m | 126.7m | 15.9% |
| Schools | 1,398.0m | 1,489.9m | 1,614.0m | 8.3% |
| Science | 183.7m | 190.1m | 201.6m | 6.0% |
| Remaining Estate | 162.9m | 159.6m | 211.3m | – |
For further information on Table notes, please refer to Appendix F at the end of this document.
Notes:
Infrastructure portfolio – Year on year changes are not displayed where comparisons are due to the improvements in data reporting and restructuring rather than material changes in the built assets across the estate.
Land portfolio – Improved reporting by Homes England means yearly changes are not comparable, and do not reflect material changes to the estate.
Logistics and Storage portfolio – Year on year changes are not displayed where comparisons are not like-for-like, and do not represent material changes to the value of the estate. This has been due to reclassifications by the Tate Modern of two assets into this portfolio as well as improvements in HMRC reporting of value under this portfolio.
Remaining Estate portfolio – In 2022-23 running cost reporting improved, this primarily related to an improvement in DfT Maritime and Coastguard Agency reporting of costs as well as increases reported by DfT British Transport Police and BEIS UK Atomic Energy Authority.
For the first time in 2022-23 a further breakdown of running costs was collected. Operational costs which include facilities management as well as security costs made up the majority of running costs, with rents accounting for 10.5% and annual rates accounting for 5.2%. Agricultural land and buildings, infrastructure assets, some cultural assets with charity status and buildings providing welfare facilities are generally exempt from rates. Additionally, empty buildings are eligible for rate relief.
Annual rents for leasehold properties were estimated at £2.3bn, with 46.1% of rents sitting within the Health portfolio followed by 24.7% in the Office portfolio and a further 19.5% across the Job Centre, Overseas and Defence portfolios.
Figure 7: Estate Running Cost by type, 2022-23
- Other costs: £6.6bn
- Soft FM costs: £6.1bn
- Hard FM costs: £3.8bn
- Rents for leaseholds: £2.3bn
- Academy Premises costs: £1.6bn
- Annual rates: £1.1bn
- Security costs: £0.4bn
Table 19: Running Cost of the Estate 2022/23
| Cost (a) | 2020/21 | 2021/22 | 2022/23 | Change 2021/22-2022/23 |
|---|---|---|---|---|
| Total Running Cost (b) (c) (d) | 20.9bn | 21.2bn | 22.0bn | 3.9% |
| Rents for leaseholds | 2.5bn | 2.4bn | 2.3bn | -4.4% |
| Annual rates | 1.1bn | |||
| Academy Premises Costs | 1.6bn | |||
| Total Operational Costs | 17.0bn | |||
| Security costs | 0.4bn | |||
| Soft FM costs | 6.1bn | |||
| Hard FM costs | 3.8bn |
For further information on Table notes, please refer to Appendix F at the end of this document.
Chapter 5: A Greener Government Estate
Greening Government Commitments: The Greening Government Commitments (GGCs) set out high level targets for central government and its agencies to improve the environmental impact of government operations and its estate, whilst promoting greater efficiency and best use of taxpayer money. The current framework[footnote 27] spans the period from 2021-2025; the government aims to have met, or exceeded, the GGCs by the end of the financial year 2024 to 2025.
Introduction
As custodians of the public estate we have a duty to address climate related risks to public services and identify significant opportunities to make a positive environmental impact through proactive management of the estate, with huge potential for the changes we make to be a force for good.
During Financial Year 2022-23 the Government Property Sustainability Strategy (GPSS) was published[footnote 28] providing departments with direction to create a greener public estate.
The GPSS reflects a broadening of ambition from a focus on direct carbon emissions reduction to setting sustainability objectives across 4 key themes: net zero emissions, climate adaptation, natural capital and resource efficiency. This new sustainability strategy will help us achieve our target to reduce direct emissions from public sector buildings by at least 50% by 2032, develop a more resilient estate and contribute to the vision set out in the 25 Year Environment Plan[footnote 29] that this generation will be the first to leave the environment in a better state than we found it. The strategy will build a consistent approach across the Government Property Function to enable delivery of the Greening Government Commitments and facilitate achievement of these targets.
Delivering the Greening Government Commitments
Figure 9: Greening Government Commitments 2022/23 summary
A: Mitigating climate change: working towards net zero by 2050
Headline target
Reduce the overall greenhouse gas emissions from a 2017‑18 baseline and also reduce direct greenhouse gas emissions from estate and operations from a 2017-18 baseline.
By the end of financial year 2022-23 the government’s overall Greenhouse Gas emissions had reduced by 38% compared with the 2017-18 baseline, which is an improvement on the 35% reduction by 2021-22.
Direct emissions from government buildings have reduced by 12% compared with the 2017-18 baseline, an improvement on the 9% reduction by 2021-22, despite more departmental staff returning to their place of work following the Covid-19 pandemic.
Reductions in overall energy consumption saved the government an estimated £163 million compared with the 2017-18 baseline.
B: Minimising waste and promoting resource efficiency
Headline target
Reduce the overall amount of waste generated by 15% from the 2017-18 baseline
Government as a whole reduced total waste by 16% from the 2017-18 baseline, exceeding the 15% target.
On an individual basis the 15% target was met or exceeded by 15/20 departments.
In total 5% of departmental waste was sent to landfill which therefore met the target of 5% maximum.
Only 51% of government waste was recycled, falling short of the 75% target.
In order to better align the scope of waste streams across all departments a reassessment of waste figures was carried out in 2023. This has resulted in updated figures for some departments and the ensuing totals. The figures within this report reflect this new scope in the 2017-18 baseline and the 2022-23 reporting, and supersede those previously published in the SoftE 2021-22 report.
C: Reducing our water use
Headline target
Reduce water consumption by at least 8% from the 2017-18 baseline
The government’s water consumption reduced by 5% in 2022-23 compared to the baseline, missing the 8% reduction target that was previously met in 2021-22 (where water consumption reduced by 9% compared to the baseline).
16 of 20 departments reported they have met or exceeded the target to reduce water consumption by 8% compared to the baseline.
Reductions in water consumption saved the government an estimated £3 million compared with the 2017-18 baseline.
Delivering the Government Property Sustainability Strategy
Smarter working: An approach to organising work that aims for efficiency and effectiveness in achieving desired outcomes through a combination of flexibility, autonomy and collaboration, optimising tools and working environments for employees.
Leesman+: A globally recognised certification that is awarded to top-tier workplaces following rigorous surveying, analysis and testing. To date, only 171 buildings have successfully achieved the certification to this level out of c.7,500 surveyed. Leesman+ certified buildings create an elevated benchmark, and provide valuable insights into the quality of features, services and infrastructure that matter the most to the people who use the building.
Building Research Establishment Environmental Assessment Method (BREEAM): Provides industry recognised certification levels and standards to ensure projects are delivered to high performing and sustainable standards, whilst creating positive environmental and social impact. These standards include sustainable building methods such as utilising natural air flow, building orientation and shading to naturally regulate temperatures and air quality, as well as installation of Building Management Systems (BMS) to intelligently control building conditions based on space utilisation.
Decarbonising the Estate
The 2015 Paris Agreement[footnote 30] saw 195 countries agree on the need to keep the global temperature rise below 2°C, but that below 1.5°C would need to be achieved to avoid the very worst impacts of climate change. In 2019 the UK Government led the way in being the first major economy to commit to achieving net zero greenhouse gas (GHG) emissions by 2050. Public sector buildings account for approximately 9% of UK building emissions.[footnote 31] The 2021 Net Zero Strategy[footnote 32] set out the ambition to reduce direct emissions from public sector buildings by 75% by 2037.
In response to this the Government Property Function continues to prioritise decarbonisation of the estate and capitalise on the opportunity to make a significant contribution to the UK Net Zero target. By reducing the overall size of the estate and raising the quality and sustainability, increasing co-location opportunities, linking whole life maintenance to sustainability improvements and adopting sustainable methods of construction, the government estate is becoming greener.
Building Research Establishment Environmental Assessment Method (BREEAM) is being adopted in both new buildings and retrofit projects across the government estate. These methods help reduce carbon emissions once buildings are operational. Government Buying Standards[footnote 33] mandate the application of BREEAM, or equivalent standards for all new build and major refurbishment projects.
Case study: Birmingham 23 Stephenson Street
Birmingham 23 Stephenson Street Hub accommodates 1,700 FTE from 20 departments sharing a single building with workplace design that supports modern working practices and consistent property technology to enable collaboration. The building repurposed a disused city centre retail site adjacent to New St Station. It achieved EPC B and BREEAM – Very Good, reflecting a high standard of sustainability with running cost savings at £2m pa. The building was recently awarded Leesman+ certification placing it in the top 2% of commercial offices.
This Birmingham Government Hub achieved an impressive score of 76 (out of 100) Leesman+ score. This places it in the top spot in the UK’s public sector for workplace experience – and only the second public sector building globally in history to achieve this.
The Leesman independent external assessment of 23 Stephenson Street, when comparing pre and post occupancy data, reported an:
- Increase in productivity of 21%
- Increase in sense of community 20%
- Increase in pride in the workplace of 57%
- Increase in the support the workplace provides to wellbeing of 38%
Value is delivered not only in cost savings, but also in improved sustainability and productivity, and it also supports the local economy through basing civil servants at the heart of the city maintaining footfall on the high street. The construction and fit out work also supported skilled jobs in the region.
Decarbonising the historic estate
The Government Property Function is responsible for a number of heritage and historic listed buildings. It is largely accepted that historic buildings are not often energy efficient. Due to their cultural importance retrofit is often the only option to ensure they remain viable and useful, now and in the future.
Across Government work is taking place to significantly improve the energy efficiency of historic assets and departments are implementing interventions such as replacing windows and Heating, Ventilation and Air Conditioning systems (HVAC), upgrading lagging on older boiler systems, and installing LED lighting and Building Management Systems (BMS). The GPA continues to review and implement interventions to achieve government Net Zero targets across the office portfolio, despite limited funding, and financed the improvements of the historic building case study shown below.
Case study: Historic England – retrofitting the historic estate.
Prior to the Covid pandemic Historic England had commissioned work to begin to bring one of their offices – at the Fermentation Buildings, Bristol – in line with smarter working standards. The project to refit the building was paused during the pandemic.
When work restarted in 2022, post Covid recommendations to improve air quality required the installation of extraction ductwork and replacement of the 2 existing HVAC units with 1 larger intelligent unit to achieve the necessary standard for air changes per hour. This enabled a BMS system to be added to monitor and improve the zones of the building and manage conditions such as temperature, humidity, air quality, and occupancy.
Other sustainability measures that were taken in the retrofit of the building were the installation of kitchen worktops made from recycled beer bottles (a nod to the building’s former use as a Brewery) and the implementation of an effective recycling system, reducing waste to landfill.
Adapting to the impacts of climate change
Wide reaching and rapid adaptation of the Government estate is required to ensure continued delivery of public services across the UK. The climate is changing, even in reaching the targeted 1.5 degree increase in global temperature we are likely to see more frequent extreme weather, water shortages, drought and wildfires occurring, all of which affect our ability to deliver public services across the government estate.
July 2022 saw the UK experience unprecedented extreme heat,[footnote 34] with temperatures reaching in excess of 40 degrees. The heat brought challenging conditions for the NHS with a spike in 999 calls, disruption to medical services, increased stress on care services supporting the elderly and vulnerable. Many schools ran a shorter day in parts of the country and several fire services declared major incidents after multiple fires broke out, destroying homes and even a nursery.
It was reported that operations at Guy’s and St Thomas’ hospitals were cancelled as IT servers broke down in record heat on 19 July. Chief Operating Officer John Findlay was quoted as saying it was “the most complex” incident at Guy’s and St Thomas’ NHS Foundation Trust “in a very, very long time”. He warned it would take both hospitals a long time to recover.[footnote 35]
Government recognises the importance of climate change adaptation in order for it to minimise disruption to public services as climate change risks increase in line with global temperatures. The successful implementation of climate change adaptation measures often positively impacts other sustainability considerations due to their interconnectivity, for example nature based solutions to prevent flooding can also sequester carbon and improve natural capital in an area.
The introduction of Greening Government Commitment F, adapting to climate change, sets out the requirement for departments to develop an organisational Climate Change Adaptation Strategy across estates and operations by conducting a Climate Change Risk Assessment and developing a Climate Change Adaptation Action Plan. To assist departments identify and prioritise climate change risk across their estate, OGP developed the Estate Adaptation Framework. Departments are in the process of developing these comprehensive documents and have already begun work on prioritising and addressing climate change risks identified through relocation and retrofit.
Case study: DWP – Flood Risk Assessments and Plans
DWP has continued to enhance its position as a sustainable organisation by further improving the resilience of its estate through the delivery of site flood plans.
Following the completion of an in-depth flood risk assessment for the entire estate in 2021/22, 41 sites were identified as having a high risk of flooding and thus required the production of a site-specific flood plan. Risk ratings were based on a range of factors including present value (PV) of damage to the site caused by coastal, fluvial, and surface water flooding and the impact of different climate change scenarios.
The flood plans include:
- Building location and topography information
- Risk of flooding from varying sources and flood history
- Roles and responsibilities
- Capacity building
- ICE pack contents and critical items
- Incident plan, evacuation procedures and muster points
- Resilience recommendations
In parallel with the formation of these flood plans, DWP Business Continuity and Resilience team have incorporated these plans in annual audit schedules and commenced an incident response procedure that includes being signed up to flood warnings.
Increasing Natural Capital
As a large landowner in the UK, government has the opportunity and duty to make a significant impact in protecting and improving the UK’s biodiversity and natural capital.
In 2018, the 25 Year Environment Plan (25YEP) set out the government vision for twenty five years of action to help regain and retain the health of the natural world. The Environmental Improvement Plan[footnote 36] (EIP) was published in January 2023 as the first revision. It builds on the 25YEP, and sets out a plan to deliver on nature restoration, working together with landowners, communities and businesses to deliver on nature restoration.
The 2021-25 GGC framework draws a sharper focus on the natural environment and recognises the crucial role it plays in tackling the climate crisis. The introduction of Greening Government Commitment E, Nature recovery – making space for thriving plants and wildlife, sets out the requirement for departments to develop and deliver Nature Recovery Plans for their land, estates, developments, and operations to improve biodiversity. Most departments are in the development stages of their planning. However government is already taking strides in utilising land and buildings to maximise opportunity for nature recovery across the portfolio.
Examples of work carried out in 2022/23 are:
- Planting trees as part of the Queens Green Canopy
- Installing bird and bat boxes
- Planting hedgerow to replace fencing
- Installing ponds and pollinator friendly planting
- Maintaining Sites of Special Scientific Interest (SSSIs)
- Installing bee hives
As outlined in the Government Property Sustainability Strategy, government is dedicated to improving the natural environment within its gift, which means both increasing biodiversity and improving the condition
Case Study: HMCTS – Improving biodiversity in an urban environment
HM Courts and Tribunals Service (HMCTS) have provided £20,000 to develop circa 100 small garden spaces across their urban and historic estate. The funding, donated by Equans, HMCTS’s FM provider, has helped increase pollinator friendly planting and provides spaces for staff to connect with nature.
The Royal Courts of Justice (RCJ) is another organisation that is driving the improvement and protection of biodiversity. They have formed their own Garden Club, to improve the green spaces across the RCJ Group estate. The club is dedicated to promoting biodiversity and the wellbeing of everyone involved. In addition they have reduced waste by using old wooden pallets to create additional planters, giving them even more space to grow on the historic grounds.
In addition, each year the Facilities Management Team at the RCJ helps the site’s resident peregrine falcons by going to great lengths to set up a breeding site for them. Their dedication has resulted in the magnificent birds, once again, successfully raising chicks.
Resource Efficiency
Improving resource efficiency is key in minimising the impact that government property has on the environment. By making the best use of our assets and resources, committing to sustainable purchase choices and reusing and recycling materials wherever possible, the government is demonstrating its commitment to use the earth’s limited resources in the most sustainable manner possible across its estate.
Water
The Environment Agency predicts that many parts of our country will face significant water deficits by 2050. Government is acutely aware of the scale of the problem and departments are addressing this by reducing demand through installation of water meters, proactively seeking out and addressing leaks and working with water companies to address consumption, as well as installing water saving technology and sustainable drainage systems across its assets.
Case Study: Rainwater harvesting at Westonbirt Arboretum
A new rainwater harvesting and filtering system has been installed at Westonbirt, The National Arboretum. This system will reduce water use, save water costs, and reduce emissions from water supply. This system contributes to Forestry England’s aim to be net carbon zero by 2030,
This completes the facilities that support the new Isolation House in the arboretum’s Propagation Unit. Based on an average year’s rainfall, the system has the capacity to collect 90,000 litres of rainwater per year and its collection tanks can store 26,000 litres.
An old underground rainwater collection tank was discovered in the propagation area, under the existing glasshouses. Helped by CMW Horticulture, an innovative slow sand filter system has been installed to pump, clean and use the rainwater collected in the underground tank. Despite the drought conditions experienced in July and August 2022, with more daily irrigation required to keep the plants hydrated, there was water left in the system which proves its ability to provide sufficient water.
Construction and procurement
Government is committed to sustainable construction methods wherever practicable, both in new build and refurbishment projects, and that contracts awarded are in line with the commercial function’s sustainability standards.
Projects continue to be built with waste reduction a priority. Many departments adopt BREEAM standards for new builds and retrofit projects, which encourages the sustainable management (and reuse where feasible) of construction and operational waste and aims to optimise material reuse, reduce the waste arising from construction as well as through operation of the building, encouraging its diversion from landfill. It is also forward thinking and includes measures to reduce future waste as a result of building alterations required due to future climate change.
Waste and recycling
The Government property function is making a concerted effort to reduce the amount of waste sent to landfill and to increase recycling rates. Departments continue to expand the implementation of effective recycling systems across their assets. These systems influence behaviour change by assisting staff to sort recyclable products easily and effectively, resulting in less waste going to landfill.
However, dedication to recycling is not limited to refuse and departments are applying circular economy principles wherever possible. The reuse of furniture and equipment when consolidating their estates and moving into more efficient buildings is becoming business as usual. Where this is not possible departments are prolonging furniture’s lifecycle by proactively working to recycle cross departmentally or donating to charity organisations.
People
The Government School of Property is committed to driving up sustainability awareness and capability across the Government Property Function. This not only ensures the function has the right skills in the right places to continue to deliver against government targets but educates staff to make sustainable choices and drive positive behaviour change across all areas of business, from switching off monitors at the end of the day to implementing a sustainability strategy across a department.
Carbon Literacy training continues to be delivered across the property function by the Office of Government Property. The training provides an introductory level of climate change learning that leads to action toward reducing carbon emissions. The training is a train the trainer model and many delegates have gone on to become trainers for their own departments, achieving a positive cross function impact on carbon emissions.
New sustainability accreditation opportunities have also been offered as part of Government School of Property, in alignment with the Government Property Career Framework sustainability accreditation model and career paths.
Energy Performance Certificates and New Acquisitions
The legislative requirement for an EPC applies to the sale, rent or construction of buildings (other than dwellings) with a floor area greater than 500m2 that contain fixed services that condition the interior environment. An EPC is not required in certain limited circumstances, further details can be found in Appendix C.
The UK Government has made a commitment that any buildings coming onto the central government estate will meet a target[footnote 37] to achieve a top quartile Energy Performance Certificate (EPC) rating; this objective was retained in the 2022 Government Property Strategy, which requires departments to challenge acquisition of new buildings that are not within the top quartile of energy performance. The Government Functional Standard for Property[footnote 38] recommends that “decision-makers should decline a proposal for a building to become part of their estate that is not within the top quartile of energy performance or that would adversely affect their organisation’s energy efficiency performance”.
The top quartile threshold is updated each year, based on data from EPC ratings issued; as improvements are seen to the energy efficiency of UK buildings overall, the threshold for achieving top quartile performance becomes more stringent. For financial year 2022-23, an EPC rating of 0-46 meets the top quartile of energy performance; a rating greater than 46 means the building falls outside the upper quartile.
In total, there were 284 new acquisitions (all tenure types) across the central government estate during 2022-2023. Fifty (50) of the newly acquired buildings (18%) required an EPC.
Of the 50 buildings in-scope for an EPC, 22 (44%) buildings were rated as within the top quartile for energy performance. Appendix D provides further information on the new acquisitions outside of the upper quartile of energy performance.
Appendices
Appendix A: Climate Change Act 2008 (extract)
Section 86 Report on the civil estate
It is the duty of the Minister for the Cabinet Office to lay before Parliament in respect of each year, beginning with the year 2008, a report containing an assessment of the progress made in the year towards improving the efficiency and contribution to sustainability of buildings that are part of the civil estate.
The report must, in particular, include an assessment of the progress made in the year to which it relates towards:
- reducing the size of the civil estate, and
- ensuring that buildings that become part of the civil estate fall within the top quartile of energy performance.
If a building that does not fall within the top quartile of energy performance becomes part of the civil estate in the year to which the report relates, the report must state the reasons why the building has nevertheless become part of the civil estate.
A report under this section must be laid before Parliament not later than 1st June in the year following the year to which it relates.[footnote 39]
In this section ‘building’ means a building that uses energy for heating or cooling the whole or any part of its interior.
For the purposes of this section, a building is part of the civil estate if it is:
- used for the purposes of central government administration, and
- of a description of buildings for which, at the passing of this Act, the Minister for the Cabinet Office has responsibilities in relation to efficiency and sustainability.
The Minister for the Cabinet Office may by order provide for buildings of a specified description to be treated as being, or as not being, part of the civil estate for the purposes of this section.
Any such order is subject to affirmative resolution procedure.
Appendix B: Data Collection and Analysis Methodology
Data collection on the composition, size and running of the estate is commissioned by the Office of Government Property (OGP), at an aggregated portfolio level on the Government Estate. Data is commissioned from central government departments, executive agencies, executive non- departmental public bodies and government companies. Further information on the collection, assurance and analysis of this information can be found within the Government Portfolio Data Collection and Analysis Methodology section of the Government Estate: Annual Data Publication, 2022-23 on GOV.UK.[footnote 40]
Appendix C: EPC Certification Exemptions
The under the following circumstances EPC certificates are not required
Buildings due to be demolished, provided the seller or landlord can demonstrate that:
- the building is to be sold or rented out with vacant possession
- the building is suitable for demolition and
- the resulting site is suitable for redevelopment
- all relevant planning permissions, listed building consents and conservation area consents exist in relation to the demolition, and
- they believe, on reasonable grounds, that a prospective buyer or tenant intends to demolish the building (e.g. on evidence of an application for planning permission)
Buildings used as places of worship and for religious activities.
Temporary buildings with a planned time of use of two years or less, industrial sites, workshops and residential agricultural buildings with low energy demand and residential agricultural buildings which are in use by a sector covered by a national sectoral agreement on energy performance. Buildings that are industrial sites and workshops with low energy demand include buildings, or parts of buildings designed to be used separately, whose purpose is to accommodate industrial activities in spaces where the air is not conditioned. Activities that would be covered include foundries, forging and other hot processes, chemical process, food and drinks packaging, heavy engineering and storage and warehouses where, in each case, the air in the space is not fully heated or cooled. Whilst not fully heated or cooled these cases may have some local conditioning appliances such as plaque or air heaters or air conditioners to serve people at work stations or refuges dispersed amongst and not separated from the industrial activities.
Stand-alone buildings with a total useful floor area of less than 50m2.
Buildings protected as part of a designated environment or because of their special architectural or historical merit are exempt from the requirements to have an energy performance certificate insofar as compliance with minimum energy performance requirements would unacceptably alter their character or appearance.”
Appendix D: New Acquisitions Outside the Upper Quartile
Rating Number: Each EPC letter rating band spans an associated numerical range e.g. a score in the range of 0-25 is an A rating for non-domestic buildings.
| Department | Building Name | EPC Rating | Rating Number | Reason for Acquisition |
|---|---|---|---|---|
| DCMS – National Portrait Gallery | Pavilion 11a Charring Cross Rd SW2H 0EP | G | Increase Capacity / Revenue | |
| DEFRA – Department for Environment, Food and Rural Affairs | Spalding Priory Lane | C | 65 | Animal & Plant Health Agency holding - required as emergency extra space |
| DHSC – NHSBT | Unit 2 Kembrey Place | B | 47 | The former property was suboptimal and unable to support the operational requirements of the blood donation team. |
| DHSC – NHS Property Services | Whitworth Clinic Medical Centre | D | 76 | Directed to transfer this property from Pennine Care by the Department of Health & Social Care |
| DHSC – NHS Property Services | Durnford Street | D | 83 | Directed to transfer this property from Pennine Care by the Department of Health & Social Care |
| DHSC – NHS Property Services | Ings Lane Clinic | D | 87 | Directed to transfer this property from Pennine Care by the Department of Health & Social Care |
| DHSC – NHS Property Services | Kingsway Clinic | C | 74 | Directed to transfer this property from Pennine Care by the Department of Health & Social Care |
| DHSC – NHS Property Services | Langley Clinic | D | 91 | Directed to transfer this property from Pennine Care by the Department of Health & Social Care |
| DHSC – NHS Property Services | Milnrow Health Centre | D | 88 | Directed to transfer this property from Pennine Care by the Department of Health & Social Care |
| DWP – Department for Work and Pension | Ellesmere Port The HUB Office | C | 56 | New co-location with with Local Authority |
| DWP – Department for Work and Pension | Salford The Alexandra MediaCity | C | 73 | Required following Landlord forced relocation from existing site |
| DWP – Department of Work and Pension | Liverpool (Port of) | C | Relocation required by DWP Health network design | |
| HO – Home Office | Suite 120 The Quorum | B | 48 | The Quorum was acquired as a replacement to the existing Visual Space in Cambridge. Cambridge is the chosen location due to high tech related activity in the area. A search in Cambridge and engagement with the GPA did not yield any alternatives. |
| MOJ – Probation | Fareham Part of Floor 3 Office | E | 122 | Probation – Offender Contact Centre |
| MOJ – Probation | Haydock House | D | 85 | Probation – Offender Contact Centre |
| MOJ – Probation | Queensgate House, Huddersfield, West Yorkshire, HD1 2RR | D | 96 | Previously held on a lease so already in occupation. Purchasing the site provided better value-for-money and security of occupation. |
| BEIS (NDA) – Sellafield Ltd | Unit 18 Leconfield | D | 95 | Support operational activity on Nuclear Licenced Site |
| BEIS (NDA) – Magnox (DSRL) | Unit B13 Forss BP (Sinclair House) | D | 47 (Scottish EPC rating) | Asset identified through improved reporting mechanisms |
| MOD | Cardiff – Furniture Store at Units G6 and G7, Southpoint Industrial Estate, Foreshore Road, Cardiff | F&G (two units) | 126 & 153 | Cardiff - The Hiring of 2 Industrial Units in Cardiff for the purposes of a regional Furniture Storage Facility in support of the MQ Estate |
| MOD | Heston – Unit 2 Airlinks Industrial – Capital Industrial | D | 99 | Storage & Distribution |
| MOD | High Wycombe – WYT00114 – Serviced Office – Stokenchurch Business Park | C | 58 | Obtained for reason other than occupation |
| MOD | London - SAN00128, 7th Floor Empress State Building - Office Accommodation | D | 99 | Obtained for reason other than occupation |
| MOD | Plymouth – PLY00204 – Top Floor, D5‑D10, Drake Building, Research Way, Derriford | C | 53 | Obtained for reason other than occupation |
| MOD | SAN00124 Hiring 5th Floor Offices iHub Imperial College White City Campus London | C | 58 | SAN00124 Hiring 5th Floor Offices iHub Imperial College White City Campus London |
| DESNZ – Coal Authority | 48 Coldcotes Avenue, Leeds, LS9 6NB | E (Domestic EPC rating) | 51 | Coal mining subsidence damage |
| DFT – Maritime and Coastguard Agency | Clydebank CRS | C | Operational requirement | |
| DFT – Maritime and Coastguard | St Ives CRS | D | Floor area rationalised |
Appendix E: GPA Whitehall Campus Programme Office Closures 2022-23
Skipton House, SE1 6LH
21-27 Lambs Conduit Street, WC1N 3GS
75 King William Street, EC4N 7BE
(Part) International House, 1 St Katharine’s Way, E1W 1YL
21 Bloomsbury Street, WC1B 3HF
58 Victoria Embankment, EC4Y 0DS
12 Carthusian Street, EC1M 6EB
13 Clerkenwell Road, EC1M 5PA
Public Hall, 1 Horse Guards Avenue, SW1A 2EP
1 Drummond Gate, SW1V 2QQ
Appendix F: Notes on Data Tables
Table 1, Table 4, Table 12, Table 13, Table 14
(a) Floor area measurements are presented according to the portfolio they belong to: Office and jobcentre portfolios, Measurements are in square metres (m²), Net Internal Area (NIA); Defence portfolio: in m², Gross External Area (GEA); All other portfolios: in m², Gross Internal Area (GIA).
(b) Surplus area is collected from 2021/22.
(c) Freehold value includes values that have been recorded for freehold properties and virtual freeholds which have been acquired through an up front capital payment and where only a minimal peppercorn Rent / ground Rent / service charge is paid.
(d) The previous years’ running costs, and its individual components, have been adjusted for inflation in line with services producer price inflation deflators as at March each year: Services producer price inflation
(e) Where costs cannot be easily separated into Soft and Hard FM, FM costs are reported under Hard FM.
(f) The number of new acquisitions is collected from 2022/23.
(h) Disposal information from 2022-23 is collected through the Efficiency and Disposal programme in OGP. These reflect gross capital receipts from the sale of land and property at the point where the sale is considered unconditional. A wider definition for recording receipts from disposals was used in 2021 and 2022 when the Disposals programme was not active. This wider definition permitted exits from leasehold properties, and as such the data on government disposals is not directly comparable between 2022-23 and the previous two years. Previous years’ data are therefore not presented.
(i) The DfE is not the custodian of the school estate and does not collect a full dataset on land ownership. The responsibility of the school estate is devolved to responsible bodies (RBs) depending on the type or school, who have the legal responsibility for the land and buildings and to those bodies and others who may hold the freehold or leasehold interest in the land or hold it on trust. Because of this annual rent for leaseholds, rates, hard FM, Soft FM, Security and other costs are not available. the sum of these element in this table will therefore not equate to total running costs.
(j) Year on year changes are not displayed where comparisons are not like for like, for example due to improvements in data quality or reporting.
(k) Changes in PFI are not displayed. Within the health portfolio data for sites including those which are part PFI cannot be broken down. Increases in part PFI sites suggest changes occurring in relation to non PFI buildings on the site as no new PFI schemes have gone live.
Table 2
(a) Floor area by region is collected at an organisational level. Floor area measurements are presented according to the portfolio they belong to, As regional information is not further broken down by portfolio, floor area measurement type is not available for regions. To convert the regional floor area breakdown to an appropriate floor area basis, converted floor areas for each organisation by portfolio are used and apportioned between regions based on the proportional split.
Table 17
(a) Disposal information from 2022/23 is collected through the Efficiency and Disposal programme in OGP. This programme records gross capital receipts from the sale of land and property at the point where the sale is considered unconditional. A wider definition for recording receipts from disposals was used in 2021 and 2022 when the Disposals programme was not active. This wider definition permitted exits from leasehold properties, and as such the data on government disposals is not directly comparable between 2022-23 and earlier years’.
Table 18
(a) Total Running costs are comprised of Rents for leaseholds, annual rates and total operational costs. Total Operational costs are comprised in turn of security costs, soft FM, hard FM and other costs.
(b) The previous years’ Running Costs, and its individual components, have been adjusted for inflation in line with services producer price inflation deflators as at March each year: Services producer price inflation
(c) Year on year changes are not displayed where comparisons are not like for like, for example due to improvements in data quality or reporting.
Table 19
(a) Detailed cost breakdowns have are collected from 2022/23 reporting period.
(b) Total Running costs are comprised of Rents for leaseholds, annual rates and total operational costs. Total Operational costs are comprised in turn of security costs, soft FM, hard FM and other costs.
(c) The previous years’ Running Costs, and its individual components, have been adjusted for inflation in line with services producer price inflation deflators as at March each year: Services producer price inflation
(d) The DfE is not the custodian of the school estate and does not collect a full dataset on land ownership. The responsibility of the school estate is devolved to responsible bodies (RBs) depending on the type or school, who have the legal responsibility for the land and buildings and to those bodies and others who may hold the freehold or leasehold interest in the land or hold it on trust. Because of this annual rent for leaseholds, rates, hard FM, Soft FM, Security and other costs are not available. the sum of these element in this table will therefore not equate to total running costs.
Figure 4
Freehold value includes values that have been recorded for freehold properties and virtual freeholds which have been acquired through an up front capital payment and where only a minimal peppercorn Rent/ground Rent/service charge is paid.
Figure 5
The previous years’ running costs, and its individual components, have been adjusted for inflation in line with services producer price inflation deflators as at March each year: Services producer price inflation
-
Appendix A of this report gives an extract of requirements under the Act. The full Climate Change Act 2008 can be found at https://www.legislation.gov.uk/ ↩
-
Appendix A of this report gives an extract of requirements under the Act. The full Climate Change Act 2008 can be found at GOV.UK. ↩
-
Further information on this programme can be found in section 2.3 of the Government Estate: Annual Data Publication, 2022-23 on GOV.UK ↩
-
The infrastructure and Overseas portfolios were newly introduced in the 2021-22 State of the Estate report. The infrastructure portfolio was previously reported as part of the Land and Remaining Estate portfolios. The overseas portfolio was not previously reported as part of any other portfolio. These changes represent continuous improvement in measuring the estate. ↩
-
Making Comparisons between and within portfolios: Further information on the methodology of data collection and analysis across portfolios and impacts on inter portfolio comparison can be found in section 2.3 of Government Estate: Annual Data Publication, 2022-23. ↩
-
NHS England and NHS Improvement savings figures are collected at an aggregate level and include capital receipts from disposals (£213.4m). Disposals (£34.3m) as recorded under the OGP Efficiency and Disposal programme have been removed from this figure to improve consistency with the running cost saving definition. ↩
-
The Schools portfolio consists of state funded primary schools, secondary schools, and sixth form colleges. Only schools located in England are included in this analysis. The DfE is not the custodian of the school estate and does not collect a full dataset on land ownership. The responsibility for the school estate is devolved to responsible bodies (RBs) depending on the type of school, who have the legal responsibility for the land and buildings and to those bodies and others who may hold the freehold or leasehold interest in the land or hold it on trust. The DfE collects schools’ data through its Condition Data Collection (CDC) programme. CDC 1 ran from early 2017 until Autumn 2019. CDC 2 is in progress and runs from 2021 until 2026. CDC 2 involves visiting every government-funded school and further education college in England. CDC 1 data will be updated at the conclusions of CDC 2. ↩
-
Defence Infrastructure Organisation Accomodation Capital Purchase Programme ↩
-
UK greenhouse gas emissions national statistics: 1990 to 2018 ↩
-
Sustainable procurement: the GBS for construction projects and buildings ↩
-
The date in the Act relates to when the SoftE report was produced for the calendar year rather than the financial year. It is now being produced during the following financial year. ↩