Reducing Parental Conflict Programme 2018–2022: An evaluation of the effects of interventions on parental relationships and children
Updated 14 February 2024

© Crown copyright 2024
This publication is licensed under the terms of the Open Government Licence v3.0 except where otherwise stated. To view this licence, visit nationalarchives.gov.uk/doc/open-government-licence/version/3 or write to the Information Policy Team, The National Archives, Kew, London TW9 4DU, or email: psi@nationalarchives.gov.uk.
Where we have identified any third party copyright information you will need to obtain permission from the copyright holders concerned.
This publication is available at https://www.gov.uk/government/publications/reducing-parental-conflict-programme-2018-to-2022-an-evaluation-of-the-effects-of-interventions/reducing-parental-conflict-programme-2018-2022-an-evaluation-of-the-effects-of-interventions-on-parental-relationships-and-children
August 2023
DWP research report 1039
A report of research and analyses carried out by the Department for Work and Pensions.
Crown copyright 2023.
You may re-use this information (not including logos) free of charge in any format or medium, under the terms of the Open Government Licence. To view this licence, visit http://www.nationalarchives.gov.uk/doc/open-government-licence/ or write to the Information Policy Team, The National Archives, Kew, London TW9 4DU, or email psi@nationalarchives.gov.uk.
This document/publication is also available on our website at: https://www.gov.uk/government/organisations/department-for-work-pensions/about/research#research-and-analysis-publications
If you would like to know more about DWP research, email socialresearch@dwp.gov.uk
First published August 2023.
ISBN 978-1-78659-558-4
Views expressed in this report are not necessarily those of the Department for Work and Pensions or any other government department.
Executive summary
International evidence shows that when parents are entrenched in conflict that is frequent, intense, and poorly resolved, it is likely to have a negative impact on themselves and their children. Prior to the 2018-22 Reducing Parental Conflict programme, relatively few relationship and parenting interventions had been tested in the UK. Therefore, very little was known about the type of interventions that would work to reduce parental conflict and improve the mental health and wellbeing of children in workless and disadvantaged families living in the UK.
To begin addressing this evidence gap, up to £50 million was allocated to the Reducing Parental Conflict (RPC) programme between 2018 and 2022. Part of the programme involved testing eight interventions across 31 upper tier local authorities in four geographical areas (Contract Package Areas) to build the evidence on what works to help families in conflict.
The 2018–2022 RPC programme was supported by three strands of evaluation:
-
a commissioned evaluation conducted by DWP research partners, IFF Research,
-
an innovative qualitative study which used diaries to follow parents as they participated in RPC interventions,
-
and this report, an in-depth quantitative study to evaluate the efficacy of these interventions, in improving interparental relationships and children’s wellbeing.
Between 2019 and 2022, 6,110 parents, in 3,810 families, were referred to an intervention. Data was collected from participating parents about different aspects of their relationship with the other parent and the wellbeing of their children. Data was collected at four key stages: once before intervention and up to three times after completion of an intervention (immediately after completion, 6 months after completion, and finally, 12 months after completion). The evaluation involved comparing different measures of the interparental relationship and child mental health / wellbeing to estimate the changes observed post intervention. A nonexperimental, before-and-after study design was used, meaning there was no control group with which to estimate the counterfactual (the changes that would have occurred regardless of intervention).
The evaluation found that:
-
On average, parents who participated experienced statistically significant improvements in their relationship with the other parent after they completed one of the interventions tested. Furthermore, for participating parents with a child aged 2 to 17 years old at the point of referral, parents reported on average these children showed statistically significant improvements in their mental health and wellbeing after their parent(s) completed an intervention.
-
Where it was possible to estimate (i.e. where post intervention sample sizes were sufficient), there was no evidence that interparental relationships or child mental health regressed towards pre-intervention levels in the 12 months after completing an intervention.
-
Families that completed high intensity interventions, which were more expensive, showed slightly greater improvements in both interparental relationships and child wellbeing / mental health than families that completed moderate intensity interventions.
-
Sample sizes were sufficient to support intervention level analyses for six of the seven interventions tested; all six interventions showed significant improvements in both interparental relationships and child mental health. On average, parents who completed Mentalization Based Therapy (MBT) experienced greater improvements in interparental relationships and the mental health of their children, compared to parents who completed other interventions. However, at the time of the test, MBT was considered to be the most expensive intervention, and it was not possible to adjust the effect sizes in this report for the cost of interventions.
-
Where both parents participated, greater improvements were demonstrated in interparental relationships and child mental health, though parents participating alone (without the cooperation of the other parent) still showed statistically significant improvements in interparental relationships and child mental health.
-
Working families experienced slightly better outcomes than families where at least one parent was not working; both family types showed significant improvements (of a similar magnitude) in interparental relationships, but working families saw greater improvements in child mental health.
-
Sample sizes were not sufficient to facilitate comparative analyses between specific ethnic groups. However, when analysing ethnic minority and nonethnic minority families, both showed significant improvements in interparental relationships and child mental health after completing an intervention.
This evaluation focused on the effect on families after completing an RPC intervention and did not account for the higher contract price paid per parent for the high intensity interventions. This report, therefore, does not attempt to make any claims about the value for money of RPC interventions, either in terms of the price paid by the DWP under the 2018-22 programme or the actual market cost of these interventions as of 2022/23.
Authors
This report was written by William Brewin and Matthew Garlick from Income, Families and Disadvantage Analysis Division in the Department for Work and Pensions.
Acknowledgements
This research was conducted by the Department for Work and Pensions with support from 31 local authorities and 3 interventions providers, Relate, Twin Training and Tavistock Relationships. The analysis relied heavily on data collected by IFF Research Ltd, commissioned by DWP to undertake an independent evaluation of the 2018-22 Reducing Parental Conflict programme.
Particular thanks are owed to Gordon Harold, Professor of the Psychology of Education and Mental Health at the University of Cambridge, for his valuable advice on the evaluation of family relationship dynamics and child-adolescent mental health and development throughout the project.
Finally, thank you to all the parents who participated in this research, for giving up their valuable time to complete lengthy questionnaires and respond to the many evaluation surveys conducted by IFF Research Ltd.
Glossary
Contract Package Area (CPA)
Delivery of RPC interventions took place across 31 local authorities, which were clustered in 4 geographic areas known as Contract Package Areas. These are Westminster, Gateshead, Hertfordshire, and Dorset.
Domestic abuse
Imbalance of power or control in a relationship, and one parent may feel fearful of the other.
Early Intervention Foundation (EIF)
The Early Intervention Foundation was an independent charity established in 2013 to champion and support the use of effective early intervention to improve the lives of children and young people at risk of experiencing poor outcomes. In 2023 the EIF merged with the What Works Centre for Children’s Social Care to form ‘Foundations’.
Parental conflict
Harmful parental conflict behaviours in a relationship which are frequent, intense and poorly resolved can lead to a lack of respect and a lack of resolution. Behaviours such as shouting, becoming withdrawn or slamming doors can be viewed as destructive. Parental conflict is different from domestic abuse. This is because there is not an imbalance of power, neither parent seeks to control the other, and neither parent is fearful of the other.
Reducing Parental Conflict (RPC) programme
The Reducing Parental Conflict programme is the subject of this evaluation. It aims to help avoid the damage that parental conflict causes to children through the provision of evidence-based parental conflict support, training for practitioners working with families and enhancing local authority and partner services.
Subscale
An academically established measure of a different aspect of the relationship between parents, or a different aspect of the wellbeing / mental health of a child.
(Ex-)partner
The term is used throughout the report where findings are in relation to both intact and separated parents regarding their partner or former partner. Therefore, for intact parents who responded, it refers to their current partner, and for separated parents who responded, they are responding in relation to their former partner.
Chapter 1: Introduction and background information
This chapter provides the background to the 2018–2022 Reducing Parental Conflict programme, with a particular focus on the interventions that were tested between 2019 and 2022.
1.1 Background
Parents play a critical role in giving children the experiences and skills they need to succeed. However, studies have found that children who are exposed to parental conflict can be negatively affected in the short and longer term (Harold et al., 2016).
Disagreements in relationships are normal and not problematic when both people feel able to handle and resolve them. However, when parents are entrenched in conflict that is frequent, intense, and poorly resolved, it is likely to have a negative impact on the parents and their children (Acquah et al, 2017)[footnote 1]. This type of conflict can impact on children’s early emotional and social development, their educational attainment and later employability, limiting their chances to lead happy, fulfilling lives.
The government wants every child to have the best start in life and reducing harmful levels of conflict between parents, whether they are together or separated, can contribute to this. Sometimes separation can be the best option for a couple, but even then, continued cooperation and communication between parents is better for their children.
In response to the evidence of the negative effects of entrenched conflict, between 2019 and 2021, up to £39 million was allocated to the Reducing Parental Conflict programme, with an additional £11 million funding for an extension through to 2022. Eight interventions were tested across 31 upper tier local authorities in four geographical areas (Contract Package Areas) to help families in conflict.
The 2018-22 Reducing Parental Conflict (RPC) programme aimed to minimise the damage that interparental conflict causes to children through the provision of evidence-based parental conflict support, training for practitioners working with families and enhancing local authority and partner services. The programme sought to address conflict between parents where there was no evidence of domestic violence or abuse.
The eight interventions tested and evaluated between 2019 and 2022 were chosen following consultation with a subject matter expert. Local authorities were also consulted on which interventions would be suitable and would work alongside other local support available for families. As the table below shows, these interventions targeted a range of family types; some were for intact couples, some were for separated or separating parents, and others could support both family types. One intervention was specifically for parents with children aged between 7 and 11 years old.
Each intervention involved a combination of relationship and parenting support. Generally, Mentalization Based Therapy, Within My Reach, Enhanced Triple P and Family Transitions Triple P focused more on relationship problems between parents. The rationale was that improved interparental relationships would benefit children via improved parent-child relationships, which reduce conduct problems and improve emotional adjustment. By contrast, Incredible Years, 4Rs and 2Ss, Family Check-up and Parenting When Separated focus more on parenting practices, which have a more direct effect on children’s wellbeing and emotional adjustment. Further details of the interventions can be found in table 1.1 below.
Evaluation was central to the RPC programme, with findings designed to build the UK-specific evidence base and contribute to the wider international evidence on what works to reduce parental conflict and improve outcomes for children. The aim was for this evidence to be used by local authorities and their partners to embed successful parental conflict focused practice and service organisation into their services for families. The evaluation design aligned with the three main strands of the programme:
-
integration of parental conflict focused practice and services into local area family services across England,
-
training for frontline family practitioners and other professionals who come into regular contact with families, to help them identify parental conflict and in some cases to deliver support to help reduce it, and
-
interventions for parents in conflict, commissioned centrally by DWP to find out which interventions work best to improve interparental relationships and child outcomes.
The analyses covered in this report focuses specifically on the interventions strand by measuring changes in various aspects of parents’ relationships with each other and the wellbeing / mental health of their children after parents completed one of the interventions on offer.
Table 1.1 – Details of the interventions tested
Note: Three third party providers (Relate, Tavistock Relationships and Twin Training) delivered across four Contract Package Areas: Dorset, Gateshead, Hertfordshire, and Westminster. [Refer to Annexe 1.1 for the full list of local authorities covered by each CPA]
| Intervention Name | Delivery structure | Intervention aims | Intact or separated parents | Provider and Contract Package Areas | Intensity |
|---|---|---|---|---|---|
| Mentalization Based Therapy – Parenting Under Pressure | 10 sessions of therapeutic work, one practitioner delivers sessions to intact couples; with separated couples each parent completes sessions with a separate practitioner. In some cases, parents complete the final session together with both practitioners. | Aims to help separated or intact couples experiencing high levels of interparental conflict to gain more perspective in order that they can start to put the needs of their children first. It is based on a model which comprises an initial phase of preparation and assessment, followed by sessions that target both parents’ capacity for reflective thought and challenges the assumptions parents make about each other’s intentions behind their actions. | Both | − Gateshead (Relate) − Hertfordshire (Tavistock) | High |
| Triple P Family Transitions | 5 2-hour sessions delivered individually or in groups of c.8 parents over 5-13 weeks. | The intervention focuses on developing skills to resolve conflicts with former partners and learning how to cope positively with stress. These 5 sessions are delivered in conjunction with Triple P Level 4 (approximately 10 hours). | Separated | − Dorset (Twin Training) − Westminster (Tavistock) | High |
| Incredible Years ADVANCED | 12-20 sessions as part of the ‘Basic’ course, with an additional 9- 11 session for ‘Advanced’ (average of up to 20 weeks) | The focus is on parents’ and children’s communication and problem-solving skills, knowing how and when to get and give support to family members and recognising feelings and emotions. The Advanced programme focuses on parents’ interpersonal issues such as effective communication and problem-solving skills, anger, depression management, and ways to give and get support. | Both | − Dorset (Twin Training − Gateshead (Relate) | High |
| Enhanced Triple P | Four modules delivered to families in 3-8 individualised consultations. Parents attend 8-12 hours consultation individually, over 8-15 weeks. | This is a targeted selective intervention, which aims to address family factors that may impact upon and complicate the task of parenting, such as parental mood and partner conflict, and problem child behaviours. Parents completing Enhanced Triple P also need to complete a Level 4 Triple P parenting programme (approximately 10 hours). | Both | − Westminster (Tavistock) | High |
| Family Check-up | 3-4 sessions, each lasting 50-60 minutes | This is a strengths-based, family-centred intervention that motivates parents to use parenting practices to support child competence, mental health, and risk reduction. The intervention is delivered in two phases. The first is a brief, three-session intervention based on motivational interviewing. The second involves the delivery of Everyday Parenting, a family management training intervention that builds parents’ skills in positive behaviour support. | Both | − Dorset (Twin Training) − Westminster (Tavistock) | Moderate |
| Parenting When Separated (Parents Plus) | Six 2.5-hour sessions, delivered over a six-week period by two practitioners to groups of 12 parents | This intervention highlights practical steps parents can take to help their children cope and thrive as well as coping successfully themselves, where the parents are preparing for, going through, or have gone through separation or divorce. | Separated | − Gateshead (Relate) − Hertfordshire (Tavistock) | Moderate |
| Within My Reach | 15 sessions, each lasting one-hour | This is a targeted selective intervention, for low-income single parents, who may or may not be in a relationship. The intervention therefore targets relationship outcomes in general, rather than focusing on parenting or parental conflict. It covers 3 key themes: Building Relationships, Maintaining Relationships and Making Relationship Decisions | Separated | − Dorset Twin Training) − Westminster (Tavistock) | Moderate |
| 4Rs 2Ss Strengthening Families Programme [RECEIVED NO REFERRALS] | 16 sessions delivered weekly to groups of 12-20 parents. | This intervention is targeted at families that have a child between 7 and 11 years old who is diagnosed with a disruptive behaviour disorder. It is designed to support family-level influences on disruptive child behaviour disorders, as well as to target factors that potentially impact child mental health service use and outcomes (e.g. parental stress, use of emotional and parenting support resources, and stigma associated with mental health care). | Both | − Hertfordshire (Tavistock) | High |
For more information on these interventions, please see the Early Intervention Foundation commissioner guide for reducing the impact of interparental conflict on children.
Chapter 2: Evaluation aims and research questions
This section sets out the main aims of the study, and the primary, secondary and tertiary research questions that the evaluation of the interventions strand of the programme seeks to address.
2.1 Evaluation aims
A key aim of the 2018-22 RPC programme was to build UK-specific evidence on the types of support that improve interparental relationships, parenting and child outcomes, especially for for workless and other disadvantaged families. Interventions of the kind tested under the programme had been tested over the previous decade, mainly in the United States EIF, 2016)[footnote 2], but no previous comparable UK studies had been conducted on this scale, and previous studies usually focused on middle-income families. The aim was therefore to help shape future UK government policy decisions around the provision of relationship and parenting support for workless and other disadvantaged families where domestic violence or abuse was not a factor.
2.2 Research questions
The analyses covered in this report are designed to answer the following primary, secondary and tertiary research questions:
2.2.1 Primary research questions
The main evaluation aim is met by answering the following primary research questions:
-
To what extent did parents report improvements in interparental relationships after attending an intervention?
-
To what extent did parents report improvements in their children’s mental health/wellbeing after attending an intervention?
-
Which interventions were associated with the greatest improvements in interparental relationships and children’s mental health?
2.2.2 Secondary research questions
In support of the primary research questions above, the analyses herein seek to answer the following secondary research questions:
-
To what extent did intact and separated families experience different levels of improvement in interparental relationships and children’s wellbeing?
-
To what extent did parents participating alone experience different levels of improvement in interparental relationships and children’s mental health to those participating together?
-
To what extent did families where both parents work experience different levels of improvement in interparental relationships and children’s mental health to those where at least one parent is out of work?
-
To what extent did ethnic minority families experience different levels of improvements in interparental relationships and children’s mental health, when compared non-ethnic minority families?
-
To what extent did younger children experience different levels of improvements in their mental health, when compared with adolescents?
2.2.3 Tertiary research questions:
In addition to the above core research questions, the report includes analyses exploring parent engagement and retention as they participated in the interventions to help identify difficulties and challenges that any organisations involved in delivering these interventions in the future should remain alert to:
- Were parents from different subgroups (e.g. those participating alone) more or less likely to drop out of an intervention early?
2.3 Outline evaluation timeline
Although the first RPC programme started in 2018, the interventions test officially began in April 2019. The first referrals to interventions were made in May 2019, with referrals ceasing on 31 March 2022. This final cohort of parents completed interventions in July 2022 with data collection ceasing in September 2022.
Delivery was disrupted by the onset of the Coronavirus pandemic, which initially interrupted delivery and then permanently changed the way that most parents experienced the interventions. Though all the interventions were designed and developed to be delivered face to face, all interventions were experienced online using software such as Zoom from April 2020 until face-to-face delivery was resumed in October 2021. Thereafter, parents were usually given a choice about whether to participate online or in-person at home or at a venue. The result of this is that 80 percent of parents participated virtually/online.[footnote 3]
The pandemic also had several important effects on families. Emerging evidence suggests different impacts on relationship distress for families with/without children and those experiencing loss of income. Similarly, there is evidence to show that school closures, and both the imposition and relaxation of social distancing, affected children differently depending on factors such as neurodiversity (see the Oxford CoSpace Study, 2023 – http://cospaceoxford.org/about/).
These impacts present risks to the internal validity of this part of the evaluation, which are discussed in Chapter 3. Mitigation of these risks is also discussed.
Chapter 3: Methodology
This section explains the study design and methodology used to evaluate whether parents accessing one of the interventions experienced improvements in their relationship with the other parent and whether the wellbeing/mental health of at least one of their children improved.
3.1 Study design
Each of the interparental relationship measures was chosen because they are associated with emotional development and mental health and long-term outcomes for children, these outcomes are highlighted in the theory of change for the eight tested interventions.[footnote 4]
3.1.1 Relationship measures
The questionnaires focused on the two main outcomes that the interventions are designed to improve, interparental relationships and child mental health. To measure changes in the interparental relationship, the evaluation used nine academically established measures, each assessing different aspects of the relationship between intact or separated parents, hereafter referred to as ‘subscales’. Some of these subscales have been used in the study of relationships since the early 1980s.
As separated parents have different relationship issues to intact parents, the measures used were different for parents who were together (intact) and parents who were not together (separated) at the point of referral, so the analysis for these parent groups was conducted separately.
The selected subscales for intact parents were chosen from the ‘Dyadic Adjustment Scale’, ‘the Iowa Youth and Families Warmth-Hostility Subscale’, and the ‘O’Leary Porter Hostility Scale’. The selected measures for separated parents were chosen from Ahrons (1981)[footnote 5], Kramer & Washo (1993)[footnote 6], and Morrison & Coiro (1999)[footnote 7]. The full list of subscales, and corresponding sources, can be found in Annexe item 3.2. These subscales were chosen because they closely matched the components of relationships that interventions of the type tested were/are designed to target (i.e. they focus on aspects of relationship quality that indicate relationship distress and areas of parental conflict which the evidence suggests are harmful to children, especially if they take place in front of the children).
The interparental relationship questions were asked in four questionnaires:
-
the pre-intervention questionnaire, reported at the point of referral before parents attend an intervention
-
the post-intervention questionnaire, reported immediately following the completion of an intervention
-
a post-intervention questionnaire, reported 6 months following the completion of an intervention
-
a second post-intervention questionnaire, reported 12 months following the completion of an intervention
The 6 relationship measures used for separated parents were:
-
conflict when communicating (i.e. anger and argumentative behaviour between parents)
-
frequency of conflict (i.e. how often parents argue)
-
breadth of conflict (i.e. the range of issues argued about)
-
co-parenting support (i.e. helping each other as parents)
-
satisfaction with custody arrangements
-
co-parental communication (i.e. communicating well about the children)[footnote 8]
The four relationship measures for intact parents were:
-
relationship warmth (i.e. care, support and understanding)
-
hostility (i.e. anger and argumentative behaviour between parents)
-
relationship satisfaction (i.e. happiness within relationship)
-
overt hostility (i.e. arguing in front of their children)
-
relationship agreement (i.e.’ having similar relationship values, goals, and beliefs)[footnote 9]
Details of the specific questions asked, and associated scoring system, for both separated and intact parents for the relationship measures can be found in Annexe item 3.3.
3.1.2 Measures of child behaviour and wellbeing
The second main area of outcome analysis focused on children’s wellbeing and mental health using the Strengths and Difficulties Questionnaire (SDQ). The SDQ is a brief emotional and behavioural screening questionnaire for children and young people between 2 and 17 years old. The SDQ comprises 25 questions on the psychological attributes of children, divided between 5 subscales. The questions asked in relation to 2- to 4-year-olds differ slightly to the questions asked in relation to children aged 5 or more, so the analysis of these age groups was conducted separately.
SDQ questions are commonly used by researchers, clinicians, and educationalists and are typically asked of: parents in relation to their children; teachers in relationship their pupils; and directly to children (older ages groups only). This evaluation involved only parents reporting about their children (parent report) before and after their parents participated in one of the interventions.
The SDQ questions were asked to parents in three questionnaires:
-
the pre-intervention questionnaire, reported before the parents attend an intervention
-
a post-intervention questionnaire, reported 6 months after the completion of an intervention
-
a second post-intervention questionnaire, reported 12 months after the completion of an intervention
The five SDQ subscales were/are:
-
emotional problems
-
conduct problems
-
hyperactivity
-
peer problems
-
prosocial behaviour
The SDQ also allows for a Total Difficulties Score, calculated by summing scores from all the scales except prosocial behaviour.
Details of the specific questions asked, and associated scoring system, for the child wellbeing measures can be found in Annexe 3.4.
Below is a flow chart that details when each questionnaire is asked, for both interparental relationships and child wellbeing measures:
| Data collection | (1) Screening & referral | (2) Pre-intervention assessment | RPC intervention | (3) Post-intervention assessment | (4) Follow-up surveys +6 months | (4) Follow-up surveys +12 months |
|---|---|---|---|---|---|---|
| Focus of data collection | Parental conflict | Child behaviour | RPC intervention | Parental conflict | Child behaviour & Parental conflict | Child behaviour & Parental conflict |
| Questionnaires | Pre intervention questionnaire (at referral) | Pre intervention questionnaire (before starting) | RPC intervention | Post intervention questionnaire (upon completion) | Post intervention questionnaire (6 months after completion) | Post intervention questionnaire (12 months after completion) |
Each parent answered the questionnaires separately. However, as questionnaires were not always completed by both parents, the analysis was conducted at family level so that responses relating to the same child were not duplicated. Where only one parent responded, this was taken to be the family response. Where both parents responded, the family score was the average of the two responses.
3.1.3 Sample size targets
Each of the four CPAs provided an estimate of the number of eligible participants that they expected to refer to an RPC intervention. They also estimated the proportion of those referrals that would start an intervention over the initial RPC programme lifetime (2019-2021, before the programme was extended by one year). These estimates assumed an even split between high and moderate intensity interventions would be achieved in each CPA.
Table 3.0 outlines the forecast number of referrals, starts and completers expected in each CPA:
Table 3.0: Forecast programme volume of parents
| Westminster | Hertfordshire | Gateshead | Dorset | Total | |
|---|---|---|---|---|---|
| Referred | 2,400 | 3,150 | 2,830 | 1,630 | 10,010 |
| Retention rate (referral to start) | 75% | 60% | 75% | 65% | - |
| Start | 1,800 | 1,890 | 2,120 | 1,060 | 6,870 |
| Retention rate (start to complete) | 66% | 69% | 80% | 70% | - |
| Complete | 1,190 | 1,300 | 1,700 | 740 | 4,930 |
The minimum acceptable sample size should be large enough that the statistical power would be adequate for all statistical tests relating to the primary research questions. The projected sample sizes were deemed large enough to generate statistically significant results, using the uncovered effect sizes in previous studies to estimate the minimum sample.
3.2 Evaluation methodology
This study employed a non-experimental before-and-after evaluation design, commonly used when measuring outcomes of a group of participants before attending an intervention, and again afterwards. A before-and-after design assumes that, in the absence of the intervention, the outcomes of the treatment group would have remained unchanged between the pre and post intervention periods. Therefore, any changes in the outcomes are attributed to the effect of the interventions (Before-and-after study: comparative studies - GOV.UK (www.gov.uk)) .
The evaluation involved comparing the mean scores across the range of interparental relationship and child wellbeing subscales described above, before and after parents completed one of the interventions tested.
A before-and-after design was deemed a suitable evaluation design because population level relationship distress and SDQ scores remain relatively stable in normal times. Although the option of delaying support for some parents to create a control group to estimate the counterfactual was considered, the uncertainty around programme volumes and the ethical issues around withholding support from parents and children in need created an overall lack of appetite for this approach, especially from the providers being contracted to deliver the interventions.
Although this type of evaluation design is subject to threats to internal validity (as discussed below), given the paucity of UK-based evidence for these types of relationship and parenting interventions, it should provide important initial evidence on intervention effectiveness, thus fulfilling a key aim of the RPC programme: to build the UK evidence base for what improves interparental relationships and parenting. Prior to this study the main evidence base relied upon non-UK studies which, due to the pitfalls of international policy transfer,[footnote 10] do not provide reliable evidence for what works in the UK.
3.2.1 Threats to internal validity
There are several threats to internal validity associated with before-and-after studies, outlined in the table below. The threats that are most relevant to this study are the history, regression-to-the-mean and drop-out threats. Each of these was considered, and attempts were made to mitigate these risks where possible.
Table 3.1 – Internal validity threat analysis
| Threat to internal validity | Description of threat | RAG rating for this study |
|---|---|---|
| History | Some other influential event(s) which could affect the outcome, occurs during the intervention. | Amber |
| Instrumentation/reporting | Validity of measurement method changes over the course of the intervention. | Green |
| Regression-to-the-mean | Change in outcome measure might be explained by a group with a onetime extreme value naturally changing towards a normal value. | Red |
| Testing | Taking measurement (e.g. through the questionnaires) could affect the outcome. | Amber |
| Placebo | Intervention could have a nonspecified effect on the outcome, independent of key intervention components. | Green |
| Hawthorne effect | Parents’ awareness of being studied could affect their behaviour and therefore the outcome, independent of key intervention components. | Amber |
| Maturation | Intervention group develops in ways independent of the intervention (e.g. aging, increase experience, etc.), possibly affecting the outcome. | Green |
| Drop-out | The overall characteristics of the intervention group change due to some participants dropping out, possibly affecting the outcome. | Amber |
Adapted from: Robson et al (2001)[footnote 11]
History
A history threat arises when a phenomenon external to the intervention could affect the outcome and occurs between the ‘before’ and ‘after’ measurements are taken. Before the study, this risk was assumed to be low. However, the coronavirus pandemic occurred during the lifetime of the study. Therefore, any effect of the pandemic on relationships between parents presents a history threat. The 2023 Oxford Co-Space study suggests that in relation to children:
Overall, both parent/carer reported behavioural difficulties and restless/attentional difficulties consistently increased through March to June and have decreased since July [2020]. Reported emotional difficulties were relatively stable through March to June, but have also decreased over time after the lockdown was eased in June [2020].
For children whose parents completed an intervention, 17% of referrals occurred before the pandemic, 15% were referred between 20 March 2020 and 1 September 2020 and 65% were referred once the majority of schools had reopened. To estimate whether those participants referred during the lockdown period, as defined in the CoSpace study, experienced different levels of wellbeing, a one-way analysis of variance (ANOVA) test was conducted to determine whether the child wellbeing scores were statistically similar for children referred during lockdown to those referred either before lockdown, or after schools reopened. For total difference score in all three child wellbeing surveys (pre-intervention questionnaire, 6- and 12-month postintervention questionnaires), the mean score of each group was not statistically different. Therefore, it is reasonable to conclude that the effect of lockdown and the resultant history threat on the SDQ scores of children in this study is small. Annexe 3.5 details the findings of the ANOVA tests.
Regression-to-the-mean
A regression-to-the-mean threat typically arises when the basis for choosing the intervention group is a greater need for the intervention. The RPC programme targeted families experiencing high levels of conflict, so the regression-to-the-mean risk was high. Providing RPC interventions to families with higher-than-average levels of conflict meant that families may be selected when conflict was at its worst, and that it may regress towards the average level of conflict seen in the wider population, regardless of effect of the intervention. The same principle applies to child wellbeing, where children experiencing greater behavioural and emotional difficulties typically improve over time without intervention (youth in mind, 2009). There was no natural counterfactual, so it was not possible to mitigate the regression-to-the-mean threat.
Testing
A testing threat to internal validity exists when taking a before measurement may affect the outcome evaluated in the study. This may exist in the RPC programme, where parents were asked detailed questions about their interparental relationship and their children’s wellbeing before attending an intervention. This may facilitate improvements in relationships and wellbeing by raising awareness about parental conflict and its impact on children. To assess the testing risk definitively, an experimental or quasi-experimental design is necessary. However, this risk was assumed to be small because interventions such as MBT include a pre-assessment as part of the provision as standard. It is therefore reasonable to include any pre-test questionnaire effect in the overall effect of the intervention.
Hawthorne effect
The Hawthorne Effect arises when the act of involving researchers influences the evaluated outcomes. The act of being observed or the research participant knowing they were part of a test might modify the behaviour of participating parents or those delivering the interventions to enhance the likelihood of a positive outcome. However, throughout the test period, researchers’ contact with parents was limited, and surveys and qualitative interviews with parents were conducted ex-post. Furthermore, participant agreements that were signed by parents before referral made no mention of them being part of a trial or test.[footnote 12] Parents simply agreed for their information to be collected for DWP and its partners to evaluate the success of the programme.
Except for the follow-up surveys, conducted by IFF Research, the other questionnaires were completed as routine by participants, either as part of the screening, referral, induction and exit processes, with the assistance of a trained practitioner or alone.
However, the outcomes of 45 parents who participated in Diary Research,[footnote 13] conducted by DWP researchers whilst they went through interventions were more likely to be subject to the Hawthorne Effect because contact with the researcher was relatively frequent, with parents prompted to reflect on recent sessions and family life and make appropriate uploads made to a diary app. These parents also participated in two one-hour interviews, once near the time of referral and again at the end of the intervention.
In summary, whilst some Hawthorne Effect may have existed, especially for the 45 parents participating in the diary research, its overall influence over the outcomes measured by this part of the evaluation was considered small.
Drop-out
A drop-out threat arises when the characteristics of the intervention group alter because people leave the study without completing it. As a result, those completing the intervention differ from those who drop out, thereby introducing selection bias. Fifty-six per cent of referrals to RPC interventions in this test dropped out before completing an intervention. To assess the risk of drop-out threat to the evaluation, the characteristics of parents who completed interventions and those who did not complete were compared. Annexe 3.6 shows there was little difference in the characteristics of both groups. The responses to the ‘before’ surveys were only included in the study if an ‘after’ response was also present for that family, so it was not possible to account for unobservable factors that made people drop-out. If this would have not allowed for a sufficient sample size, an Intention-To-Treat (ITT) approach would have been explored. This would have allowed the ‘before’ responses of drop-outs to be included in the analysis, provided that no systematic differences were identified between those that completed an intervention and those that dropped out without completing.
All other threats to internal validity in Table 2.1 were considered but not determined to be relevant to the evaluation of the programme.
Overall, the chosen evaluation design cannot account for the possibility that something other than the intervention may have caused a change (Before-and-after study: comparative studies - GOV.UK (www.gov.uk)). The non-experimental before-and-after approach is the primary reason that the regression-to-the-mean and history threat cannot be completely mitigated. Experimental methods, such as Randomised Control Trials (RCTs), are thought to be the most reliable evaluation method. An RCT was considered in the implementation of this evaluation but not deemed to be viable due to ethical and delivery considerations.
3.2.2 Before-and-after method & statistical tests
Statistically significant differences between the before-and-after measures were determined using paired t-tests for each relationship and child wellbeing subscale. Paired t-tests determine whether the mean difference between the ‘before’ score and the ‘after’ score for each family is zero or not. A p-value of 0.05 or lower is considered to be statistically significant.
For comparisons between different subgroups (e.g. participating alone or participating together) a two-tailed, two sample t-test was employed to determine whether the mean difference between the score for each family type was zero or not. As with paired t-tests, a p-value of 0.05 or lower demonstrates a statistically significant difference. In this evaluation significance is reported at the 1% and 5% level.
This evaluation required testing the effect of an intervention against multiple outcome variables. To correct for the increase in probability that one of the apparent outcomes could have occurred by chance, a Bonferroni correction was applied, which divides the desired significance by the number of outcomes. This means that any conclusions around any differences observed pre and post intervention are more conservative.
Statistical tests are performed on the raw scores, not the standardised scores. A standardised measure of effect size, Cohen’s d, was used. It is the difference between two means, measured in standard deviations. This is a commonly used measure of the effect size of a treatment or intervention, where subscales are scored differently. Cohen’s d allows for comparison across different relationship and child wellbeing measures, and different interventions. It also allows the results of this study to be compared with estimated effect sizes found in other studies of these types of intervention. Cohen’s d has a theoretical range of 0 - ∞, but when interpreting the effect size of interventions, it is generally accepted that:
| Effect size | Cohen’s d |
|---|---|
| Small | 0.20 |
| Medium | 0.50 |
| Large | 0.80 or greater |
Cohen’s d values are not considered robust when the sample contains fewer than 50 observations. Where this was the case, Cohen’s d was not reported.
Effect sizes are reported for the ‘before’ and first ‘after’ period. For both relationship and child wellbeing measures, pre-intervention questionnaire answers are compared with post-intervention questionnaire answers. The post-intervention questionnaires, conducted via two telephone surveys by IFF Research (IFF), were used to determine whether any changes in interparental relationships and child outcomes were sustained for up to 12 months following the completion of an intervention. Paired ttests were used to determine whether there were statistically significant differences between the three post-intervention measures for each interparental relationship subscale used. The same test was also used to compare differences between the two post-intervention measures of child wellbeing.
3.3 Key programme issues and events
This section summarises several key events during the lifetime of the trial that had an impact on data quality, integrity, or completeness, and, in some cases, the sample sizes that were achieved (either as a whole or for individual interventions. Although these events help show how the test was implemented, not all implementation issues are mentioned; the focus is on issues which had an impact on the evaluation.
3.3.1 Outline timeline of events
Table 3.2 provides a chronological account of all key issues during the delivery of the test that had a significant impact on the evaluation. Annexe 3.8 details the key implementation issues identified during this evaluation.
Table 3.2: A summary of key implementation issues
| Key event | Date |
|---|---|
| Go-live date of the first provider contract | May 2019 |
| Date after which all provider contracts were live | July 2019 |
| Eligibility criteria relaxed to allow a higher proportion of working parents/lower proportion of disadvantaged families | October 2019 |
| Allowing parents assessed as in high intensity conflict to start moderate intensity interventions | Various reasons from December 2019 |
| Coronavirus: face-to-face delivery paused | March 2020 |
| Pre-intervention questionnaires and parental relationships post-intervention questionnaires issued via PDF | February – October 2020 |
| Virtual delivery established: referrals resumed | April 2020 |
| MS Excel database export/ingest problems | 2019 – Jan 2021 |
| Incredible Years eligibility criteria relaxed | March 2021 |
| Programme extended by 1 year | April 2021 |
| Reluctance of some parents to provide a name and DoB of their children on the pre-intervention questionnaire | Identified/addressed in June 2021 |
| Option to offer FTF intervention resumed | October 2021 |
3.3.2 Accounting for implementation issues
Each of the implementation issues that affected the integrity of the data was accounted for in this evaluation, by excluding questionnaire responses to subscales that were corrupted, and questionnaires were only included where all answers to questions were recorded in full for the relevant analysis. This reduces the number of questionnaires used in the analysis and is the reason that the base population is not the same for every strand of analysis in this report. However, it greatly improves the reliability of the results and allows confidence in the findings of this evaluation to be maintained.
Chapter 4: Analysis and findings
This section presents and explains the findings in relation to the primary and secondary research questions outlined in section 2.2 above. The tertiary research question is addressed separately at the end of this section. Each research question is answered directly below, before explaining the findings in detail.
During the tests, 6,110 parents (in 3,810 families) were referred to an intervention; 4,800 parents (in 3,000 families) started an intervention; and 2,700 parents (in 1,690 families) completed an intervention. 880 parents responded to a survey conducted 6 months after they completed an intervention, 370 of whom responded to a second survey conducted 12 months after completion. The analysis reflected in the three reports is based on research with these parents, bringing both parents responses together, wherever possible. Annexe 4.0 outlines the number of parents, and families, that were referred to, started, and completed an intervention in each CPA/subgroup. Annexe 4.0 also contains the cumulative number of parents starting an intervention through time, and a flow chart depicting the attrition rate throughout the programme lifetime.
Notes to aid understanding of the charts
The scores assigned to each relationship measure were scaled differently, with different absolute maximum and minimum scores. To compare fairly across relationship measures, all scales were standardised on a scale between 0 (zero) and 1 (one). 1 represents the maximum possible score for that measure, for example, arguing all the time, whilst zero would represent never arguing. The same approach was taken for the SDQ measures of child wellbeing/mental health.
Mean scores are reported in this section, however not all families experienced improvements, and some experienced greater improvements than the average. This variation is expected, and further details of the experiences of individuals can be found in the diary research.
4.1 To what extent did parents report improvements in interparental relationships after attending an intervention?
On average, both separated and intact parents reported statistically significant improvements in interparental relationships after attending an intervention, with medium-large improvements seen across the majority of relationship measures.
4.1.1 Separated parents
Figure 4.1 shows, for separated families, the mean scores for each relationship measure at the pre-intervention questionnaire, post-intervention questionnaire, and both the 6- and 12-month post-intervention questionnaires. For the precise figures for this chart, see Annexe 4.1.
Figure 4.1: Relationship changes for separated parents
| Measure | Standardised relationship score (1.0 represents the maximum possible negative score; 0.0 represents the best possible score) | Standardised relationship score (1.0 represents the maximum possible negative score; 0.0 represents the best possible score) | Standardised relationship score (1.0 represents the maximum possible negative score; 0.0 represents the best possible score) | Standardised relationship score (1.0 represents the maximum possible negative score; 0.0 represents the best possible score) |
|---|---|---|---|---|
| Before intervention | Immediately after intervention | 6 months after completion | 12 months after completion | |
| Conflict when communicating | 0.71 | 0.54 | 0.53 | 0.53 |
| Frequency of conflict | 0.43 | 0.27 | 0.22 | 0.18 |
| Breadth of conflict | 0.44 | 0.29 | 0.22 | 0.18 |
| Co-parenting satisfaction | 0.53 | 0.49 | 0.42 | 0.43 |
| Satisfaction with custody arrangements | 0.54 | 0.49 | 0.44 | 0.46 |
Analysis of the outcomes for the 568 separated families (for all 6 interventions aimed at separated parents combined) that completed both the pre-intervention questionnaire and the post-intervention questionnaire between January 2019 and May 2022 showed:[footnote 15]
-
improvements across all 5 relationship measures for separated parents, significant at the 1% level
-
medium-large reductions in the frequency and breadth of conflict, and conflict when communicating
-
small-medium sized improvements in co-parenting support, satisfaction with custody arrangements and communication
Table 4.1 (below) outlines the effect size for each separated parent relationship measure, comparing the pre intervention questionnaire with the first post intervention questionnaire.
Table 4.1: Effect sizes for each relationship measure (separated parents)
| Relationship measure | Cohen’s d |
|---|---|
| Conflict when communicating | 0.71 |
| Frequency of conflict | 0.74 |
| Breadth of conflict | 0.63 |
| Co-parenting support | 0.22 |
| Satisfaction with custody arrangements | 0.23 |
This illustrates that after completing an intervention, separated parents’ relationships improved across the full range of measures used. These improvements were statistically significant at the 1% level, meaning that it is 99% likely that this result would not occur if there was no change in interparental relationships. The magnitude of change was smaller for co-parenting support and satisfaction with custody arrangements because these subscales are traditionally less responsive to change and require a mutual change in the relationship between parents (i.e. the behaviour and views of both parents needs to shift).
214 separated families completed a 6-month post-intervention questionnaire. Of these, 105 also completed a 12-month post-intervention questionnaire. Analysis of these responses showed:
-
For all 5 relationship measures, there was no statistically significant regression towards pre intervention levels of interparental conflict both 6 and 12 months after the intervention.
-
Frequency and breadth of conflict showed further improvements in the 6 months following an intervention (significant at the 1% level). These subscales also show further improvements up to 12 months after an intervention (significant at the 5% level).
-
Co-parenting support also exhibited improvements in the 6 months following an intervention (significant at the 1% level).
-
Satisfaction with custody arrangements showed improvements in the 6 months following an intervention (significant at the 5% level).
The analysis of separated parents up to 12 months after completing an intervention suggests that improvements in interparental relationships seen immediately after intervention were either sustained at the same level, or further improvements were made after the 6-month point. This is in line with the theory of change, where improvements in interparental relationships often take time to be fully consolidated; with parents needing time to build on the support and advice received via the intervention. This is especially true of custody arrangements, which may take time to broker and for changes to be implemented.
4.1.2 Intact parents
Figure 4.2 shows, for intact families, the mean scores for each relationship measure at the pre-intervention questionnaire, post-intervention questionnaire, and both the 6- and 12-month post-intervention questionnaires. For the precise figures for this chart, see Annexe 4.1.
Figure 4.2: Relationship changes for intact parents
| Measure | Standardised relationship score (1.0 represents the maximum possible negative score; 0.0 represents the best possible score) | Standardised relationship score (1.0 represents the maximum possible negative score; 0.0 represents the best possible score) | Standardised relationship score (1.0 represents the maximum possible negative score; 0.0 represents the best possible score) | Standardised relationship score (1.0 represents the maximum possible negative score; 0.0 represents the best possible score) |
|---|---|---|---|---|
| Before intervention | Immediately after intervention | 6 months after completion | 12 months after completion | |
| Relationship warmth | 0.54 | 0.38 | 0.39 | 0.41 |
| Hostility | 0.56 | 0.39 | 0.33 | 0.34 |
| Relationship satisfaction | 0.44 | 0.31 | 0.31 | 0.30 |
| Overt Hostility | 0.47 | 0.34 | 0.32 | 0.32 |
Analysis of the outcomes for the 390 intact families (for all five interventions aimed at intact parents combined) that completed at both the pre-intervention questionnaire and the post-intervention questionnaire between January 2019 and May 2022 showed:[footnote 16]
-
medium-large improvements for all 4 relationship measures for intact parents, significant at the 1% level; and
-
greater improvements, on average, for intact families when compared with the effect sizes for separated parents.
Table 4.2 (below) outlines the effect size for each intact parent relationship measure, comparing the pre intervention questionnaire with the first post intervention questionnaire:
Table 4.2: Effect sizes for each relationship measure (intact parents)
| Relationship measure | Cohen’s d |
|---|---|
| Relationship warmth | 0.70 |
| Hostility | 0.69 |
| Relationship satisfaction | 0.73 |
| Overt hostility | 0.77 |
The findings demonstrate that after completing an intervention, intact couples’ relationships improved. It is 99% likely that this result would not occur if there was no change in interparental relationships. The effect sizes for all relationship measures for intact parents were broadly similar and expressed a lower variance than the measures used for separated parents, which means there was more consistent improvements across the subscales for intact parents.
167 intact families completed the 6-month post-intervention questionnaire. Of these, 79 families also completed the 12-month post-intervention questionnaire. Analysis of these responses showed:
-
for all 4 relationship measures, these improvements were sustained for up to 12 months after completion of an intervention – i.e. there was no statistically significant regression towards pre-intervention levels of interparental conflict
-
the overt hostility measure showed further improvements up to 6 months after completing an intervention (significant at the 1% level), which was then sustained in the subsequent 6 months
-
relationship satisfaction and hostility showed further improvements up to 6 months after completing an intervention, though this was not significant at the 5% level
4.2 To what extent did parents report improvements in their children’s wellbeing after attending an intervention?
On average, the parents who completed an RPC intervention reported improvements in their children’s mental health and wellbeing, with small-medium, statistically significant, improvements seen across the majority of SDQ measures.
The parents of 424 children from different families completed both the preintervention questionnaire, and the first post-intervention questionnaire (reported 6 months after completing an intervention). The parents of 2-4-year-old and 5-17-yearold children were asked different versions of the SDQ, so the analysis was carried out separately for each age group.
Boe et al. (2016)[footnote 17] investigated the internal consistency of SDQ scales to identify any difficulties associated with analysing the five individual subscales that make up the SDQ separately. Annexe item 4.2 details the internal consistency tests carried out for this study, to determine how well related questions within each subscale are. In summary, these show that, in this study, all subscales exhibit an acceptable level of reliability and, as such, can be interpreted individually as well as together through the total difficulties score.
4.2.1 5-17-year-olds
Figure 4.3 shows, for children aged 5-17, the mean scores for each child wellbeing measure at the pre-intervention questionnaire, and both the 6- and 12-month postintervention questionnaires. The dotted line depicts the national average score for children aged 4-15 in Britain (Meltzer et al., 2000). For the precise figures for this chart, see Annexe 4.1.
Figure 4.3: Wellbeing changes for children aged 5-17 years old
| Strengths and Difficulties measure | Standardised behavioural score (1.0 represents the maximum possible negative score; 0.0 represents the best possible score) | Standardised behavioural score (1.0 represents the maximum possible negative score; 0.0 represents the best possible score) | Standardised behavioural score (1.0 represents the maximum possible negative score; 0.0 represents the best possible score) |
|---|---|---|---|
| Before intervention | 6 months after completion | 12 months after completion | |
| Emotional problems | 0.46 | 0.34 | 0.33 |
| Conduct problems | 0.34 | 0.26 | 0.23 |
| Hyperactivity | 0.56 | 0.50 | 0.48 |
| Peer problems | 0.29 | 0.23 | 0.23 |
| Pro-social behaviour (lack of) | 0.27 | 0.23 | 0.20 |
| Total difficulties score | 0.41 | 0.33 | 0.32 |
Analysis of the outcomes for the 350 children aged 5-17 (for all interventions combined) who completed at least the pre-intervention questionnaire and the 6-month post-intervention questionnaire between January 2019 and May 2022 showed:
-
Initially, the children of parents participating in RPC interventions exhibited much greater difficulties than the national average across the full range of scales that make up the SDQ. These difficulties fell after the intervention was delivered but remained above the national average. [footnote 18]
-
Improvements across all 5 measures used in the SDQ and reductions in total difficulties overall, significant at the 1% level.
-
Medium-sized reductions in emotional and conduct problems, as well as total difficulties scores.
-
Small (but significant) reductions in hyperactivity and peer problems, and small (not significant) improvements in prosocial behaviours.
Table 4.3 outlines the effect size for each child wellbeing measure, for 5-17-year-old children, comparing the pre-intervention questionnaire with the first post-intervention questionnaire:
Table 4.3: Effect sizes for each SDQ measure (5-17-year-olds)
| Child wellbeing measure | Cohen’s d |
|---|---|
| Emotional problems | 0.50 |
| Conduct problems | 0.37 |
| Hyperactivity | 0.22 |
| Peer problems | 0.23 |
| Prosocial behaviour | 0.17 |
| Total difficulties | 0.48 |
The findings demonstrate that after the parents completed an intervention, children aged between 5 and 17 years old showed wellbeing improvements across the full range of SDQ measures. It is 99% likely that this result would not occur if there was no change in children’s wellbeing. The effect sizes range from 0.17 to 0.5, which constitute small to medium sized improvements. Emotional and conduct problems showed greater improvements than hyperactivity, peer problems and prosocial behaviour.
The parents of 135 children aged 5-17 completed a 12-month post-intervention questionnaire. Analysis of these responses showed:
-
for all 5 wellbeing measures, children showed no statistically significant regression towards pre-intervention levels of difficulties 12 months after their parents completed an intervention; and
-
5-17-year-olds showed further improvements in conduct up to 12 months after an intervention, though this was not significant at the 5% level.
4.2.2 2-4-year-old children
Figure 4.4 shows, for children aged 2-4, the mean standardised scores for each child wellbeing measure at the pre-intervention questionnaire and the 6-month postintervention questionnaire. For the precise figures for this chart, see Annexe 4.1.
Figure 4.4: Wellbeing changes for children aged 2-4 years old
| Strengths and Difficulties measure | Standardised behavioural score (1.0 represents the maximum possible negative score; 0.0 represents the best possible score) | Standardised behavioural score (1.0 represents the maximum possible negative score; 0.0 represents the best possible score) |
|---|---|---|
| Before intervention | 6 months after completion | |
| Emotional problems | 0.28 | 0.23 |
| Conduct problems | 0.33 | 0.25 |
| Hyperactivity | 0.47 | 0.39 |
| Peer problems | 0.23 | 0.13 |
| Pro-social behaviour (lack of) | 0.23 | 0.17 |
| Total difficulties score | 0.33 | 0.26 |
Analysis of the outcomes for the 74 children aged 2-4 (for all interventions combined) that completed at least the pre-intervention questionnaire and the 6-month postintervention questionnaire between January 2019 and May 2022 shows:
-
improvements across all five child wellbeing measures used in the SDQ and reductions in total difficulties overall, significant at the 1% level for all but emotional problems and prosocial behaviour which are significant at the 5% level;
-
a medium-sized reduction in the total difficulties score; and
-
medium-small reductions in conduct and emotional problems, hyperactivity, peer problems and prosocial behaviours.
Table 4.4 outlines the effect size for each child wellbeing measure, for 2-4-year-olds, comparing the pre intervention questionnaire with the first post intervention questionnaire:
Table 4.4: Effect sizes for each SDQ measure (2-4-year-olds)
| Child wellbeing measure | Cohen’s d |
|---|---|
| Emotional problems | 0.24 |
| Conduct problems | 0.39 |
| Hyperactivity | 0.32 |
| Peer problems | 0.34 |
| Prosocial behaviour | 0.30 |
| Total difficulties | 0.48 |
The findings demonstrate that after the parents of 2-4-year-olds completed an intervention, their child’s wellbeing improved for the full range of SDQ measures. It is at least 95% likely that this result would not occur if there was no change in children’s wellbeing. The effect sizes range from 0.30 to 0.48, with emotional and conduct problems showing greater improvements than hyperactivity, peer problems and prosocial behaviour.
Only 24 parents of children aged 2 to 4 years old completed a 12-month post-intervention questionnaire. Therefore, it was not possible to conduct robust analysis of sustained improvements in the wellbeing of these children.
4.3 To what extent did younger children experience different levels of improvements in their wellbeing, when compared with older children?
On average, whilst both age groups showed different effect sizes for individual subscales, they expressed a similar reduction in total difficulties after their parents completed an intervention.
The parents of 2-4-year-olds were asked slightly different questions, that are more applicable to younger children. However, only three of the 25 SDQ questions were different for 2-4-year-olds and 5-17-year-olds. The question on reflectiveness was softened, and two questions on antisocial behaviour were replaced by questions on oppositionality. The different questions are part of the conduct problems and hyperactivity scales:
Table 4.5: Strengths and Difficulties Questionnaire question differences
| Child wellbeing measure | 5-17-year-old question | 2-4-year-old question |
|---|---|---|
| Conduct problems | Often lies or cheats | Can be spiteful to others |
| Conduct problems | steals from home, school or elsewhere | Often argumentative with adults |
| Hyperactivity | Thinks out before acting | Can stop and think things out before acting |
The mean scores for these scales were therefore not directly compared, however, Cohen’s d comparisons are valid across different scales, so effect sizes are compared. Additionally, large population-based surveys in the UK suggest slightly different population norms for 2–4-year-olds compared to older children.
Analysis shows that:
-
on average, before intervention children aged 5-17 showed greater difficulties across the full range of comparable child wellbeing measures than 2-4-yearolds;
-
the effect sizes for peer problems, hyperactivity and prosocial behaviour were slightly larger for 2-4-year-olds;
-
children aged 5-17 showed greater reductions in emotional problems; and
-
children aged 2-4 and 5-17 experienced the same reduction in total difficulties, with a medium effect size for both groups.
Both 2-4-year-olds and 5-17-year-olds showed statistically significant improvements in child wellbeing up to 6 months after their parents completed an intervention. Whilst the two age groups experienced different effect sizes for each individual measure within the SDQ, they showed the same reduction in total difficulties. This was driven by a generally higher effect size for 2-4-year-olds, but a far larger effect size for emotional problems in 5-17-year-olds.
It was not possible to compare the sustained improvements up to 12 months after intervention because only 24 parents of children aged 2-4 completed a 12-month post-intervention questionnaire.
4.4 To what extent did intact and separated families experience different levels of improvement in interparental relationships and children’s wellbeing?
On average, both intact and separated families showed improvements in interparental relationships and children’s wellbeing. However, this was generally larger for intact families.
Both intact and separated parents showed medium-large improvements in interparental relationships after completing an intervention. As separated parents have different relationship issues to intact parents, the evaluation used different measures, comprising different questions for each parent group. Consequently, it was not possible to make direct comparisons. However, using Cohen’s d allows a broad comparison, which showed that intact couples experienced greater improvements across the range of relationship measures.
The average effect size for intact parents was 0.72, compared with 0.51 for separated parents. It is notable that interventions provided to separated parents targeted different relationship problems, so it is not necessarily expected that the effect sizes are comparable. The difference in average effect size was driven primarily by the small effect sizes for co-parenting support (0.22) and satisfaction with custody arrangements (0.23) or separated parents. Co-parenting support and satisfaction with custody arrangements focus on similar themes, such as flexibility with visiting arrangements and financial support and are not as easily comparable with the measures for intact parents. Excluding these measures from the comparison, the average effect size for separated parents was 0.69. This is close to the average effect size for intact parents and suggests that whilst intact parents do show greater interparental relationship improvements, it may be as a result of the relationship measures chosen and the specific behaviours measured.
4.4.1 Children’s wellbeing
Figure 4.5 shows, for children aged 5-17, the mean scores for each child wellbeing measure at the pre-intervention questionnaire and the 6-month post-intervention questionnaire broken down by whether their parents were intact or separated.
Figure 4.5: Wellbeing changes for children aged 5-17 years old from intact and separated families
| Strengths and Difficulties measure | Standardised behavioural score (1.0 represents the maximum possible negative score; 0.0 represents the best possible score) | Standardised behavioural score (1.0 represents the maximum possible negative score; 0.0 represents the best possible score) | Standardised behavioural score (1.0 represents the maximum possible negative score; 0.0 represents the best possible score) | Standardised behavioural score (1.0 represents the maximum possible negative score; 0.0 represents the best possible score) |
|---|---|---|---|---|
| Intact parents | Intact parents | Separated | Separated | |
| Before intervention | 6 months after completion | Before intervention | 6 months after completion | |
| Emotional problems | 0.45 | 0.29 | 0.46 | 0.36 |
| Conduct problems | 0.39 | 0.28 | 0.32 | 0.26 |
| Hyperactivity | 0.60 | 0.56 | 0.53 | 0.47 |
| Peer problems | 0.31 | 0.22 | 0.28 | 0.24 |
| Pro-social behaviour (lack of) | 0.32 | 0.28 | 0.24 | 0.21 |
| Total difficulties score | 0.44 | 0.34 | 0.40 | 0.33 |
111 intact families, and 239 separated families with children aged 5-17 completed both a pre-intervention questionnaire and a 6-month post-intervention questionnaire. Additionally, 28 intact, and 46 separated, families with 2-4-year-olds also completed these questionnaires. Unlike comparing interparental relationships between intact 43 and separated families, the child wellbeing measures used for both family types are the same. This allows for a more direct comparison between groups.
Table 4.6 outlines the effect size for each child wellbeing measure for intact and separated families, for 5-17-year-olds, comparing the pre-intervention questionnaire with the first post-intervention questionnaire. The following conclusions are based on comparing measures from the pre-intervention questionnaire with the first postintervention questionnaire:
-
children of both intact and separated parents showed significant improvements across the full range of wellbeing measures, significant at the 1% level for all scales, but prosocial behaviour (5% level) and hyperactivity (not significant at the 5% level for intact, but significant at the 1% level for separated); and
-
children with intact parents experienced greater improvements across the full range of child wellbeing measures, excluding hyperactivity.
Table 4.6: Effect sizes for each SDQ measure (separated v intact parents)
| Child wellbeing measure | Intact Cohen’s d | Separated Cohen’s d |
|---|---|---|
| Emotional problems | 0.62 | 0.44 |
| Conduct problems | 0.55 | 0.33 |
| Hyperactivity | 0.18 | 0.23 |
| Peer problems | 0.36 | 0.17 |
| Prosocial behaviour | 0.19 | 0.16 |
| Total difficulties | 0.61 | 0.42 |
The greater improvements in wellbeing for children with intact parents was driven mainly by larger effect sizes for emotional, conduct and peer problems. Different interventions were delivered in each CPA, therefore in addition to an ordinary area effect, an intervention effect may be captured by the area in which the family lived. If the proportion of separated/intact parents was sufficiently different in each CPA, it may have influenced the effect sizes for intact and separated parents. For example, if intact parents predominantly lived in an area where more high intensity interventions were delivered, this may have accounted for the larger improvements seen in the children of intact parents. However, as Annexe 4.3 shows, the percentage of families that were separated was similar across all CPAs, and as such does not undermine the reliability of these findings. Intact and separated families may also participate in different types of intervention, which may explain differences in mean wellbeing scores and levels of improvement.
45 intact families and 92 separated families with children aged 5-17 also completed a 12-month post-intervention questionnaire. For both family types there was no statistically significant regression towards pre-intervention levels of child wellbeing.
4.5 To what extent did parents participating alone experience different levels of improvement to families where both parents participated?
On average both groups showed improvements in interparental relationships and children’s wellbeing. However, improvements were generally larger for families where both parents attended an intervention.
4.5.1 Key programme numbers
As the evaluation relied on at least one parent per family to have completed both preintervention and post-intervention questionnaires, the analysis is based on the responses from:
-
parents in 345 intact and 387 separated families, where both parents were known to have participated; and
-
181 separated parents and 45 intact parents who participated without the cooperation of the other parent.
This means that a greater proportion of intact families participated together[footnote 19] (85% of intact families compared with 68% of separated families).
Changes in interparental relationships are reported for intact and separated parents separately because they were asked different questions.
4.5.2 Separated families and joint participation
Table 4.7 (below) shows the effect sizes for each relationship measure for families where both parents participated, or just one parent participated. The following conclusions are based on comparing measures from the pre-intervention questionnaire with the first post-intervention questionnaire:
-
All families showed significant improvements across all five measures of interparental relationships (significant at the 1% level), regardless of whether both parents, or only one parent, participated.
-
The effect sizes were, on average, larger for families where both parents participated.
-
Effect sizes were larger for conflict when communicating, frequency and breadth of conflict for both groups.
Table 4.7: Effect sizes for each relationship measure for separated parents
| Relationship measure | Alone - Cohen’s d | Both parents - Cohen’s d |
|---|---|---|
| Conflict when communicating | 0.56 | 0.81 |
| Frequency of conflict | 0.60 | 0.84 |
| Breadth of conflict | 0.53 | 0.69 |
| Co-parenting support | 0.25 | 0.21 |
| Satisfaction with custody arrangements | 0.30 | 0.19 |
4.5.3 Intact families and joint participation
Table 4.8 shows the effect sizes for each intact parent relationship measure, for families where both parents participated, or just one parent participated. The following conclusions can be made, based on comparing measures from the preintervention questionnaire with those from the first post intervention questionnaire:
-
All intact families showed significant improvements across all four measures of interparental relationships (significant at the 1% level), regardless of whether both parents or just one parent, participated.
-
Although the effect sizes were, on average, larger for intact families where both parents participated, the difference in effect sizes between the two groups was less for intact parents than separated parents.
Table 4.8: Effect sizes for each relationship measure for intact parents
| Relationship measure | Alone - Cohen’s d | Both parents - Cohen’s d |
|---|---|---|
| Relationship warmth | 0.70 | 0.70 |
| Hostility | 0.58 | 0.71 |
| Relationship satisfaction | 0.66 | 0.74 |
| Overt hostility | 0.82 | 0.77 |
For both intact and separated families, greater improvements in interparental relationships were seen when both parents completed an intervention. This may be explained by the possibility that, as result of participation, both parents would be better equipped to resolve conflict. It may also be affected by the nature of the questions used to evaluate the effects on relationships, many of which ask one parent about the other parent’s behaviour. For example, the extent to which they are supportive or willing make changes to accommodate the other parent. Positive answers would be less likely if the other parent is not participating.
A further consideration is that a greater proportion of intact parents attended interventions together. This may mean that the difference in outcomes for intact and separated parents can be attributed to the improved outcomes when both parents attend an intervention. However, the analyses cannot conclusively determine whether the difference was because of differing parental dynamics, or because both parents attended.
4.5.4 Children’s wellbeing
Figure 4.6 shows, for children aged 5-17, the mean scores for each child wellbeing measure at the pre-intervention questionnaire and the 6-month post-intervention questionnaire broken down by whether both parents participated in the intervention or not.
Figure 4.6: Wellbeing changes for children aged 5-17 years old (both parents participated v one parent participated)
| Strengths and Difficulties measure | Standardised behavioural score (1.0 represents the maximum possible negative score; 0.0 represents the best possible score) | Standardised behavioural score (1.0 represents the maximum possible negative score; 0.0 represents the best possible score) | Standardised behavioural score (1.0 represents the maximum possible negative score; 0.0 represents the best possible score) | Standardised behavioural score (1.0 represents the maximum possible negative score; 0.0 represents the best possible score) |
|---|---|---|---|---|
| Both parents participated | Both parents participated | One parent participated | One parent participated | |
| Before intervention | 6 months after completion | Before intervention | 6 months after completion | |
| Emotional problems | 0.47 | 0.34 | 0.44 | 0.34 |
| Conduct problems | 0.35 | 0.27 | 0.33 | 0.25 |
| Hyperactivity | 0.58 | 0.52 | 0.51 | 0.45 |
| Peer problems | 0.29 | 0.24 | 0.27 | 0.23 |
| Pro-social behaviour (lack of) | 0.28 | 0.24 | 0.24 | 0.20 |
| Total difficulties score | 0.42 | 0.34 | 0.39 | 0.32 |
The analysis is based on measures from families where at least one parent completed both pre-intervention and post-intervention questionnaires, the analysis is based on the responses from:
-
108 families where only one parent in the family attended an intervention;
-
and 468 families with children aged 5-17 where both parents attended an intervention and completed both a pre-intervention questionnaire and a 6- month post-intervention questionnaire; and
-
104 families with 2-4-year-old children where both parents participated, and 21 families where only one parent participated, where both questionnaires were completed.
Table 4.9 compares the effect sizes for each child wellbeing measure for children from families where both parents attended an intervention and families where only one parent participated, based on measures from the pre-intervention questionnaire with those from the first post-intervention questionnaire. Comparisons show that:
-
All children, regardless of whether one or both parents participated, experienced statistically significant improvements across the full range of children’s wellbeing measures[footnote 20] except for prosocial behaviour and peer problems where only one parent participated.
-
Children from families where both parents participated showed larger reductions in total difficulties than those from families where only one parent participated.
These findings are in line with the conclusions for interparental relationships.
Table 4.9: Effect sizes for each child wellbeing measure comparing families where both parents participated with families where one parent participated
| Child wellbeing measure | Child aged 5-17 where one parent participated - Cohen’s d | Child aged 5-17 where both parents participated - Cohen’s d | Child aged 2-4 where both parents participated - Cohen’s d |
|---|---|---|---|
| Emotional problems | 0.34 | 0.57 | 0.36 |
| Conduct problems | 0.36 | 0.38 | 0.38 |
| Hyperactivity | 0.21 | 0.23 | 0.38 |
| Peer problems | 0.15 | 0.28 | 0.32 |
| Prosocial behaviour | 0.18 | 0.19 | 0.27 |
| Total difficulties | 0.41 | 0.51 | 0.56 |
Across all subscales, improvements in wellbeing for the children are greater in families where both parents participated, although marginally for some measures. As mentioned above, it is possible that the CPA/intervention effect influenced the findings for this subgroup analysis. This risk is exacerbated when the distribution of the subgroups is not consistent across each CPA. Annexe item 4.3 shows that the percentage of families where only one parent participated is similar across three of the four CPAs, this is likely due to the nature of the support offered in each CPA. To assess the robustness of these findings, parents from the CPA with a higher proportion of couples participating together were removed for sensitivity checks. Annexe 4.4 shows the results after excluding this CPA.
There was a small effect on the results. Improvements for 5-17-year-olds were larger and improvements for 2-4-year-olds were smaller. However, the children of parents who both attended RPC interventions showed larger improvements in wellbeing than those where only one parent attended and, as such, it is reasonable to conclude that these findings are not sensitive to the CPA effect.
There were 39 families where only one parent participated, and 186 families where both parents participated, with children aged 5-17 that also completed a 12-month post-intervention questionnaire. There were too few children where only one parent attended to make robust conclusions. However, for the 186 children where both parents completed an intervention there was no statistically significant regression towards pre-intervention levels of child wellbeing. Conduct problems and prosocial behaviour showed further improvements in the six months after the first postintervention questionnaire was completed, significant at the 1% and 5% level respectively.
4.6 To what extent did families where both parents were in work, experience different levels of improvement in interparental relationships and children’s wellbeing to those where at least one parent was not in work?
On average, families from both groups showed statistically significant improvements across most of the subscales used. Families where both parents were in work saw slightly larger improvements in their children’s wellbeing/mental health than families where at least one parent was not working, but both groups saw similar improvements in interparental relationships.
Where it was possible to determine using the survey data, families were split into ‘both-working’ and ‘other’ groups. Working families are defined as those where both parents were in work, and ‘other’ refers to families where either one or both parents were not in work at the point of referral.
211 separated, and 285 intact, families consisted of parents who were both in work, and completed both the pre-intervention questionnaire and post-intervention questionnaire. 176 separated, and 77 intact, families consisted of parents where at least one parent was out of work and completed both the pre-intervention questionnaire and post-intervention questionnaire. Initially, the programme aimed to prioritise support for workless/disadvantaged families, however, this was relaxed due to limited uptake, as outlined in Chapter 3. As a result, 75% of intact families were working, and 55% of separated families were working. Changes in interparental relationships are reported for intact and separated parents independently.
4.6.1 Effects for separated families by work status
Table 4.11 outlines the effect size for each separated parent relationship measure, for families where both parents were in work and families where one parent was not working. The following conclusions can be made from comparing the pre intervention questionnaire with the first post intervention questionnaire:
-
Both working and ‘other’ families showed significant improvements in all five measures of interparental relationships, significant at the 1% level, aside from satisfaction with custody arrangements for families where at least one parent was not working
-
Effect sizes, on average, marginally greater for working families
Table 4.11: Effect sizes for each relationship measure for separated parents (both-working v other families)
| Relationship measure | Both-working - Cohen’s d | Other - Cohen’s d |
|---|---|---|
| Conflict when communicating | 0.88 | 0.75 |
| Frequency of conflict | 0.85 | 0.83 |
| Breadth of conflict | 0.70 | 0.68 |
| Co-parenting support | 0.19 | 0.22 |
| Satisfaction with custody arrangements | 0.31 | 0.07 |
4.6.2 Effects for intact families by work status
Table 4.12 outlines the effect size for each intact parent relationship measure, for both family types. The following conclusions can be made from comparing the pre intervention questionnaire with the first post intervention questionnaire:
-
Both family types showed significant improvements in all four measures of interparental relationships, significant at the 1% level
-
Effect sizes, on average, were marginally greater for ‘both-working’ families
Table 4.12: Effect sizes for each relationship measure for intact parents (both working v other parents)
| Relationship measure | Working – Cohens’d | Other - Cohen’s d |
|---|---|---|
| Relationship warmth | 0.77 | 0.50 |
| Hostility | 0.72 | 0.69 |
| Relationship satisfaction | 0.78 | 0.65 |
| Overt hostility | 0.77 | 0.76 |
Similar effect sizes were seen for families where both parents were in work and families where at least one parent did not work. This suggests that the interventions work equally well for both family types.
4.6.3 Children’s Wellbeing
Figure 4.7 shows the mean scores for each child wellbeing measure (for children aged 5-17) at the pre-intervention questionnaire and the 6-month post-intervention questionnaire broken down by other and both-working families.
Figure 4.7: Wellbeing changes for children aged 5-17 years old by work status
| Strengths and Difficulties measure | Standardised behavioural score (1.0 represents the maximum possible negative score; 0.0 represents the best possible score) | Standardised behavioural score (1.0 represents the maximum possible negative score; 0.0 represents the best possible score) | Standardised behavioural score (1.0 represents the maximum possible negative score; 0.0 represents the best possible score) | Standardised behavioural score (1.0 represents the maximum possible negative score; 0.0 represents the best possible score) |
|---|---|---|---|---|
| Working | Working | Other | Other | |
| Before intervention | 6 months after completion | Before intervention | 6 months after completion | |
| Emotional problems | 0.48 | 0.34 | 0.44 | 0.34 |
| Conduct problems | 0.37 | 0.28 | 0.30 | 0.26 |
| Hyperactivity | 0.58 | 0.51 | 0.58 | 0.54 |
| Peer problems | 0.29 | 0.23 | 0.30 | 0.25 |
| Pro-social behaviour (lack of) | 0.29 | 0.25 | 0.25 | 0.22 |
| Total difficulties score | 0.43 | 0.34 | 0.40 | 0.35 |
311 working and 157 other families with children aged 5-17 completed both the preintervention questionnaire and the 6-month post-intervention questionnaire. 63 working families and 41 other families with children aged 2-4 also completed these questionnaires.
Table 4.13 outlines the effect size for each child wellbeing measure for children whose parents are working, and those whose parents are other. The following conclusions can be made from comparing the pre intervention questionnaire with the first post intervention questionnaire:
- children aged 5-17 from working families saw improvements across the full range of child wellbeing measures, significant at the 1% level
- children aged 5-17 from working families saw improvements across the majority of child wellbeing measures. Reductions in total difficulties emotional and peer problems were significant at the 1% level. Improvements in conduct and prosocial behaviour were significant at the 5% level. Hyperactivity showed no significant improvement
- children whose parents both work showed larger reductions in total difficulties than those in families where at least one parent is not working
- these findings are in line with the conclusions for interparental relationships
Table 4.13: Effect sizes for each child wellbeing measure (both-working v other)
| Child wellbeing measure | Other (5-17) - Cohen’s d | Both-working (5-17) - Cohen’s d | Working (2-4) - Cohen’s d |
|---|---|---|---|
| Emotional problems | 0.49 | 0.62 | 0.31 |
| Conduct problems | 0.20 | 0.49 | 0.33 |
| Hyperactivity | 0.13 | 0.28 | 0.33 |
| Peer problems | 0.23 | 0.31 | 0.60 |
| Prosocial behaviour | 0.16 | 0.20 | 0.32 |
| Total difficulties | 0.36 | 0.59 | 0.53 |
The family stress model (EIF) suggests that job loss and economic pressure affect the quality of interparental relationships, which in turn negatively effects child outcomes. All parents in this study exhibited similarly high levels of conflict before attending an intervention, so it is unsurprising that the mean level of total difficulties was similar for children in both family types. However, children aged 5-17 in working families experienced greater improvements in wellbeing across the full range of measures, implying that although they initially showed a similar level of difficulties, they experienced fewer barriers to improvement and as such improved to a greater extent, once their parents completed an intervention.
The proportion of families where at least one parent is not working, shown in Annexe item 4.3, is relatively consistent across CPAs. 38% of families that participated in the RPC programme are other. At CPA level the lowest proportion of other parents is 29% in Hertfordshire, the highest is 46% in Gateshead. It is reasonable, therefore, to conclude that the CPA effect on these findings is small.
56 other families, and 132 both-working families with children aged 5-17 also completed a 12-month post-intervention questionnaire. For both subgroups, there was no statistically significant regression towards pre-intervention levels of child wellbeing. Children in working families showed further improvements in, significant at the 5%.
4.7 To what extent did ethnic minority families experience different levels of improvements in interparental relationships and children’s wellbeing when compared with non-ethnic minority families?
It was not possible to conclusively compare the effect sizes for non-ethnic minority and ethnic minority groups. However, both ethnic minority and non-ethnic minority families showed improvements in interparental relationships and children’s mental health and wellbeing.
Where it was possible to determine using the survey data, families were split into non-ethnic minority and ethnic minority groups. Non-ethnic minority families are defined as those where both parents identify as non-ethnic minority, and ethnic minority refers to families where either one or both parents identify as being from an ethnic minority.
116 separated, and 110 intact, families identified as an ethnic minority, and completed both the pre-intervention questionnaire and post-intervention questionnaire. 271 separated, and 235 intact, families consist of parents where neither identified as ethnic minority, completed both the pre-intervention questionnaire and post-intervention questionnaire.
4.7.1 Separated families
Table 4.14 outlines the effect size for each separated parent relationship measure, for non-ethnic minority and ethnic minority families. The following conclusions can be made from comparing the pre intervention questionnaire with the first post intervention questionnaire:
- Non-ethnic minority families showed improvements in interparental relationships across all five relationship measures, significant at the 1% level.
- Ethnic minority families showed improvements in the frequency and breadth of conflict, and conflict when communicating, significant at the 1% level. They showed improvements in satisfaction with custody arrangements and coparenting support, though these results were not significant at the 5% level.
- Non-ethnic minority families showed slightly larger reductions in conflict when communicating, and the frequency of conflict.
Table 4.14: Effect sizes for each relationship measure for separated parents (ethnic minority v non-ethnic minority parents)
| Relationship measure | Ethnic minority - Cohen’s d | Non-ethnic minority - Cohen’s d |
|---|---|---|
| Conflict when communicating | 0.71 | 0.85 |
| Frequency of conflict | 0.77 | 0.87 |
| Breadth of conflict | 0.70 | 0.69 |
| Co-parenting support | 0.16 | 0.23 |
| Satisfaction with custody arrangements | 0.19 | 0.19 |
4.7.2 Intact families
Table 4.15 outlines the effect size for each intact parent relationship measure, for non-ethnic minority and ethnic minority families. The following conclusions can be made from comparing the pre intervention questionnaire with the first post intervention questionnaire:
-
both ethnic minority and non-ethnic minority families showed improvements in interparental relationships across all four relationship measures, significant at the 1% level
-
non-ethnic minority families showed larger reductions in all relationship measures for intact parents
-
a large proportion of ethnic minority families in this programme attended interventions in the Westminster CPA, which reduces the reliability of these results
Table 4.15: Effect sizes for each relationship measure for intact parents (ethnic minority v non-ethnic minority parents)
| Relationship measure | Ethnic minority - Cohen’s d | Non-ethnic minority - Cohen’s d |
|---|---|---|
| Relationship warmth | 0.49 | 0.82 |
| Hostility | 0.50 | 0.82 |
| Relationship satisfaction | 0.54 | 0.86 |
| Overt hostility | 0.59 | 0.85 |
Annexe item 4.3 shows the proportion of RPC families where at least one parent that identifies as an ethnic minority in each CPA. The highest proportion of ethnic minority families was in Westminster, where 83% of families were ethnic minority families. The spread between the three remaining CPAs was also large, with the lowest proportion seen in Gateshead, where only 10% of RPC families were ethnic minority. The geographical skew towards Westminster means that the CPA effect is likely large and means this study cannot reliably compare the effect sizes for non-ethnic minority and ethnic minority families. However, these findings suggest that the interventions tested under the RPC programme significantly improve interparental relationships in both ethnic minority and non-ethnic minority families.
4.7.3 Children’s wellbeing
Figure 4.8 shows, for children aged 5-17, the mean scores for each child wellbeing measure at the pre-intervention questionnaire and the 6-month post-intervention questionnaire broken down by non-ethnic minority and ethnic minority families.
Figure 4.8: Wellbeing changes for children aged 5-17 years old, non-ethnic minority and ethnic minority families
| Strengths and Difficulties measure | Standardised behavioural score (1.0 represents the maximum possible negative score; 0.0 represents the best possible score) | Standardised behavioural score (1.0 represents the maximum possible negative score; 0.0 represents the best possible score) | Standardised behavioural score (1.0 represents the maximum possible negative score; 0.0 represents the best possible score) | Standardised behavioural score (1.0 represents the maximum possible negative score; 0.0 represents the best possible score) |
|---|---|---|---|---|
| EM families | EM families | Non-EM families | Non-EM families | |
| Before intervention | 6 months after completion | Before intervention | 6 months after completion | |
| Emotional problems | 0.42 | 0.26 | 0.50 | 0.37 |
| Conduct problems | 0.36 | 0.25 | 0.36 | 0.30 |
| Hyperactivity | 0.55 | 0.48 | 0.59 | 0.56 |
| Peer problems | 0.24 | 0.20 | 0.31 | 0.26 |
| Pro-social behaviour (lack of) | 0.29 | 0.22 | 0.29 | 0.26 |
| Total difficulties score | 0.39 | 0.30 | 0.44 | 0.37 |
317 non-ethnic minority and 73 other families with children aged 5-17 completed both the pre-intervention questionnaire and the 6-month post-intervention questionnaire. 64 non-ethnic minority families and 18 ethnic minority families with children aged 2-4 also completed these questionnaires.
Table 4.16 outlines the effect size for each child wellbeing measure for children from non-ethnic minority and ethnic minority families. The following conclusions can be made from comparing the pre intervention questionnaire with the first post intervention questionnaire:
-
children aged 5-17 from non-ethnic minority families showed improvements in wellbeing across all measures, significant at the 1% level;
-
children aged 5-17 from ethnic minority showed improvements in wellbeing across all measures, significant at the 1% level for all measures except hyperactivity and peer problems which were significant at the 5% and not significant at the 5% level respectively; and
-
children aged 2-4 from non-ethnic minority families also showed improvements in wellbeing across all measures, significant at the 1% level for Conduct, prosocial behaviours, and total difficulties. Emotional problems, peer problems, and hyperactivity were significant at the 5% level.
Table 4.16: Effect sizes for each child wellbeing measure (ethnic minority v non-ethnic minority)
| Child wellbeing measure | Ethnic minority (5-17) Cohen’s d | Non-ethnic minority (5-17) Cohen’s d | Non-ethnic minority (2-4) Cohen’s d |
|---|---|---|---|
| Emotional problems | 0.77 | 0.55 | 0.28 |
| Conduct problems | 0.58 | 0.33 | 0.42 |
| Hyperactivity | 0.31 | 0.16 | 0.30 |
| Peer problems | 0.21 | 0.28 | 0.31 |
| Prosocial behaviour | 0.33 | 0.18 | 0.36 |
| Total difficulties | 0.65 | 0.46 | 0.52 |
Annexe item 4.3 shows the proportion of RPC families where at least one parent that identifies as ethnic minority in each CPA. As explained earlier in this section, the geographical skew towards Westminster means that the CPA effect is likely large and means this study cannot reliably compare the effect sizes for Non-ethnic minority and ethnic minority families. However, these findings imply that RPC provisions significantly improved the wellbeing of children from both non-ethnic minority and ethnic minority family backgrounds.
4.8 Which interventions were associated with the greatest improvements in interparental relationships and children’s wellbeing?
On average, high intensity interventions are associated with the greatest improvements in both interparental relationships and children’s mental health and wellbeing. This was somewhat expected, because they were the most expensive, and typically involved a greater number of sessions.
4.8.1 Intervention details
A major component of this evaluation was to assess the relative efficacy of the RPC interventions tested between 2019-2022. The number of families that completed each intervention was sufficient (n > 50) to conduct robust analysis of interparental relationships for the following interventions:
Interventions for separated parents
- Mentalization Based Therapy – Parenting Under Pressure (high intensity)
- Triple P Family Transitions (high intensity)
- Parents Plus – Parenting When Separated (moderate intensity)
- Within My Reach (moderate intensity)
Interventions for intact parents
- Mentalization Based Therapy – Parenting Under Pressure (high intensity)
- Enhanced Triple P (high intensity)
- Family Check-up for Children (moderate intensity)
The sample was sufficient to conduct robust analysis of child wellbeing measures, for children aged 5-17, for the following interventions:
- Mentalization Based Therapy – Parenting Under Pressure (high intensity)
- Triple P Family Transitions (high intensity)
- Parents Plus – Parenting When Separated (moderate intensity)
4.8.2 Intervention level findings for separated parents
Figure 4.9 shows, for separated parents, the mean scores for each relationship measure at the pre-intervention questionnaire and the first post-intervention questionnaire broken down intervention intensity.
Figure 4.9: Relationship changes for separated parents, high and moderate intensity interventions
| Measure | Standardised relationship score (1.0 represents the maximum possible negative score; 0.0 represents the best possible score) | Standardised relationship score (1.0 represents the maximum possible negative score; 0.0 represents the best possible score) | Standardised relationship score (1.0 represents the maximum possible negative score; 0.0 represents the best possible score) | Standardised relationship score (1.0 represents the maximum possible negative score; 0.0 represents the best possible score) | Standardised relationship score (1.0 represents the maximum possible negative score; 0.0 represents the best possible score) | Standardised relationship score (1.0 represents the maximum possible negative score; 0.0 represents the best possible score) |
|---|---|---|---|---|---|---|
| High intensity | High intensity | High intensity | Moderate intensity | Moderate intensity | Moderate intensity | |
| Before intervention | 6 months after completion | 12 months after completion | Before intervention | 6 months after completion | 12 months after completion | |
| Conflict when communicating | 0.78 | 0.57 | 0.56 | 0.65 | 0.52 | 0.50 |
| Frequency of conflict | 0.46 | 0.30 | 0.23 | 0.40 | 0.25 | 0.21 |
| Breadth of conflict | 0.48 | 0.32 | 0.23 | 0.41 | 0.26 | 0.22 |
| Co-parenting satisfaction | 0.57 | 0.52 | 0.43 | 0.49 | 0.46 | 0.40 |
| Satisfaction with custody arrangements | 0.61 | 0.53 | 0.46 | 0.48 | 0.47 | 0.41 |
Table 4.17 details the number of separated families that completed a pre-intervention questionnaire, a post-intervention questionnaire, a 6-month and a 12-month postintervention questionnaire, by intervention type:
Table 4.17: Number of questionnaire responses - separated families
| Intervention | Pre and post intervention | 6-month post-intervention | 12-month post-intervention |
|---|---|---|---|
| Mentalization-Based Therapy - Parenting Under Pressure | 167 | 58 | 31 |
| Triple P Family Transitions | 116 | 60 | 28 |
| The Incredible Years School Age ADVANCED | 4 | 0 | 0 |
| 4Rs 2Ss Strengthening Families Programme | 0 | 0 | 0 |
| Enhanced Triple P | 14 | 6 | 3 |
| Family Check-up for Children | 7 | 3 | 1 |
| Parents Plus – Parenting When Separated | 155 | 41 | 20 |
| Within My Reach | 74 | 29 | 13 |
268 (300) separated families attended a high (moderate) intensity intervention, and completed both a pre-intervention questionnaire and a post-intervention questionnaire. Table 4.18 shows the effect sizes for high and moderate intensity interventions for these families, comparing the pre intervention questionnaire with the first post intervention questionnaire. The following conclusions can be made from comparing the pre intervention questionnaire with the first post intervention questionnaire:
- separated parents who completed high intensity interventions showed improvements in interparental relationships across the full range of measures, significant at the 1% level
- separated parents who completed moderate intensity interventions show improvements in interparental relationships across the full range of measures, significant at the 1% level for all but satisfaction with custody arrangements which did not show statistically significant improvements
- high intensity interventions showed larger effect sizes than moderate, for all relationship measures
Table 4.18: Effect sizes for each relationship measure for separated parents (high v moderate intensity)
| Relationship measure | High intensity | Moderate intensity |
|---|---|---|
| Conflict when communicating | 0.87 | 0.58 |
| Frequency of conflict | 0.75 | 0.74 |
| Breadth of conflict | 0.64 | 0.61 |
| Co-parenting support | 0.27 | 0.17 |
| Satisfaction with custody arrangements | 0.39 | 0.09 |
High intensity interventions were usually more expensive and involved a greater number of sessions than moderate intensity interventions. These findings suggest that, as expected, parents who attend high intensity interventions show greater improvements than parents who attend moderate interventions. However, parents who completed moderate interventions still showed medium-large improvements in the frequency and breadth of conflict, and conflict when communicating. This study measured the relative effect sizes irrespective of intervention cost, and less expensive interventions were still shown to be effective.
66 (77) families that attended a high (moderate) intensity intervention also completed a 6-month post-intervention questionnaire, and 35 (30) also completed a 12-month post-intervention questionnaire. There was no evidence that interparental relationships return to pre-intervention levels in the six months after parents completed either a high or moderate intensity intervention. For families that completed high intensity interventions, co-parenting support (1% level), breadth of conflict, frequency of conflict and satisfaction with custody arrangements (5% level) all improved in the 6 months after completing an intervention. For moderate intensity interventions, breadth of conflict and frequency of conflict (1% level) both improved in the 6 months after completing an intervention.
Table 4.19 shows the effect sizes for each intervention, where sample sizes allowed for robust estimates, comparing the pre intervention questionnaire with the first post intervention questionnaire. The following conclusions can be made from comparing the pre intervention questionnaire with the first post intervention questionnaire:
- all interventions showed statistically significant improvements in frequency and breadth of conflict, and conflict when communicating, significant at the 1% level
- Mentalization Based Therapy, Triple P Family Transitions and Parenting When Separated show improvements in co-parenting support and satisfaction with custody arrangements, significant at the 1% level for MBT, but not significant at the 5% level for Triple P Family Transitions or Parenting When Separated
- Mentalization Based Therapy showed the greatest improvements in interparental relationships for separated parents, on average across all relationship measures
Table 4.19: Effect sizes for each relationship measure for separated parents (intervention level)
| Relationship measure | MBT Cohen’s d | FTTP Cohen’s d | PWS Cohen’s d | WMR Cohen’s d |
|---|---|---|---|---|
| Conflict when communicating | 0.96 | 0.70 | 0.69 | 0.31 |
| Frequency of conflict | 0.67 | 0.95 | 0.63 | 0.86 |
| Breadth of conflict | 0.65 | 0.65 | 0.60 | 0.63 |
| Co-parenting support | 0.31 | 0.16 | 0.15 | 0.18 |
| Satisfaction with custody arrangements | 0.38 | 0.24 | 0.14 | 0.14 |
Within My Reach is the only moderate intervention for separated parents included in this comparison because it was the only moderate intervention where more than 50 families completed at least a ‘before’ and one ‘after’ survey. It is unsurprising, therefore, that Within My Reach showed smaller improvements on average than the other three interventions. Similarly, at the time of the test, Mentalization Based Therapy was generally considered to be the most expensive intervention included in this study, at the, where up to 20 hours of therapeutic work may be delivered to separated families, whose parents attend sessions individually.
These findings suggest that all the tested interventions for separated parents successfully improved interparental relationships. Local authorities with limited resources may wish to offer a range of these tested interventions across intensities for separated parents, offering higher intensity interventions to families experiencing higher levels of conflict.
4.8.3 Intervention level findings for intact parents
Figure 4.10 shows, for separated parents, the mean scores for each relationship measure at the pre-intervention questionnaire and the first post-intervention questionnaire broken down by intervention intensity.
Figure 4.10: Relationship changes for intact parents, high and moderate intensity interventions
| Measure | Standardised relationship score (1.0 represents the maximum possible negative score; 0.0 represents the best possible score) | Standardised relationship score (1.0 represents the maximum possible negative score; 0.0 represents the best possible score) | Standardised relationship score (1.0 represents the maximum possible negative score; 0.0 represents the best possible score) | Standardised relationship score (1.0 represents the maximum possible negative score; 0.0 represents the best possible score) |
|---|---|---|---|---|
| High intensity | High intensity | Moderate intensity | Moderate intensity | |
| Before intervention | Immediately after intervention | Before intervention | Immediately after intervention | |
| Relationship warmth | 0.56 | 0.38 | 0.49 | 0.36 |
| Hostility | 0.59 | 0.40 | 0.49 | 0.37 |
| Relationship satisfaction | 0.45 | 0.31 | 0.41 | 0.31 |
| Overt Hostility | 0.48 | 0.34 | 0.44 | 0.33 |
Table 4.20 details the number of intact families that completed a pre-intervention questionnaire, a post-intervention questionnaire, a 6-month and a 12-month postintervention questionnaire, by intervention type.
Table 4.20: Number of questionnaire responses - intact families
| Intervention | pre & post intervention | six month follow-up | twelve month follow-up |
|---|---|---|---|
| Mentalization-Based Therapy - Parenting Under Pressure | 207 | 91 | 39 |
| Triple P Family Transitions | 6 | 4 | 2 |
| The Incredible Years School Age ADVANCED | 10 | 6 | 1 |
| 4Rs 2Ss Strengthening Families Programme | 0 | 0 | 0 |
| Enhanced Triple P | 56 | 43 | 20 |
| Family Check-up for Children | 62 | 7 | 7 |
| Parents Plus – Parenting When Separated | 2 | 0 | 0 |
| Within My Reach | 33 | 3 | 2 |
286 intact families attended a moderate intensity intervention, and 104 intact families attended a high intensity intervention, that completed both a pre-intervention questionnaire and a post-intervention questionnaire.
Table 4.21 shows the effect sizes for high and moderate intensity interventions for these families, comparing the pre intervention questionnaire with the first post intervention questionnaire. The following conclusions can be made from comparing the pre intervention and post intervention questionnaire:
-
intact parents who attend both high and moderate intensity interventions showed improvements in interparental relationships across the full range of measures, significant at the 1% level
-
high intensity interventions showed larger effect sizes than moderate intensity interventions, for all relationship measures
-
73% of intact families completed a high intensity intervention, compared with 47% of separated parents
Table 4.21: Effect sizes for each relationship measure for intact parents (high v moderate intensity)
| Relationship measure | High intensity | Moderate intensity |
|---|---|---|
| Relationship warmth | 0.72 | 0.64 |
| Hostility | 0.74 | 0.56 |
| Relationship satisfaction | 0.78 | 0.61 |
| Overt hostility | 0.78 | 0.74 |
These findings suggest that, as expected, intact parents who completed high intensity interventions showed greater improvements than intact parents who attend moderate interventions. However, parents attending moderate interventions still show medium-large improvements across the full range of relationship measures for intact families. This study measured the relative effect sizes irrespective of intervention cost, and less expensive interventions were still shown to be effective for intact families.
101 (8) families that completed a high (moderate) intensity intervention also completed a 6-month post-intervention questionnaire, and 59 (7) also completed a 12-month post-intervention questionnaire. There were too few observations for robust analysis of sustained improvements of intact families that completed moderate intensity interventions. For intact families that completed high intensity interventions, there was no statistically significant change in the level of conflict for at least 12 months across all relationship measures. This indicates that improvements in interparental relationship were sustained for up to 12 months after completing an intervention.
Table 4.22 shows the effect sizes for each intervention, where sample sizes allowed for robust estimates, comparing the pre intervention questionnaire with the first post intervention questionnaire. The following conclusions can be made from comparing the pre intervention and post intervention questionnaire:
- intact families that completed all three of these interventions showed mediumlarge improvements in all relationship measures, significant at the 1% level; and
- Mentalization Based Therapy showed the greatest improvements in interparental relationships for intact parents, on average across all relationship measures.
Table 4.22: Effect sizes for each relationship measure for intact parents (intervention level)
| Relationship measure | MBT - Cohen’s d | FCU – Cohen’s d | EPPP – Cohen’s d |
|---|---|---|---|
| Relationship warmth | 0.82 | 0.68 | 0.41 |
| Hostility | 0.82 | 0.53 | 0.43 |
| Relationship satisfaction | 0.90 | 0.55 | 0.43 |
| Overt hostility | 0.82 | 0.71 | 0.62 |
Family Check-up is the only moderate intervention for separated parents included in this comparison because it was the only moderate intervention where more than 50 families completed at least a ‘before’ and one ‘after’ survey. Families that completed Family Check-up experienced similar improvements to those that attended the higher intensity interventions, suggesting that it may offer larger improvements in interparental relationships, relative to cost. However, this study measured the relative effect sizes irrespective of intervention cost, so this could not be tested.
These findings suggest that all the tested interventions for intact parents successfully improved interparental relationships, so local authorities with limited resources may wish to offer a range of these tested interventions across intensities for intact parents, offering higher intensity interventions to families experiencing higher levels of conflict.
4.8.4 Intervention level findings for 5-17-year-old children
Figure 4.11 shows, for children aged 5-17 years old, the mean scores for each child wellbeing measure at the pre-intervention questionnaire and the 6-month postintervention questionnaire broken down intervention intensity.
Figure 4.11: Wellbeing changes for children aged 5-17 years old, high and moderate intensity interventions
| Strengths and Difficulties measure | Standardised behaviour score (1.0 represents the maximum possible negative score; 0.0 represents the best possible score) | Standardised behaviour score (1.0 represents the maximum possible negative score; 0.0 represents the best possible score) | Standardised behaviour score (1.0 represents the maximum possible negative score; 0.0 represents the best possible score) | Standardised behaviour score (1.0 represents the maximum possible negative score; 0.0 represents the best possible score) |
|---|---|---|---|---|
| High intensity | High intensity | Moderate intensity | Moderate intensity | |
| Before intervention | Immediately after intervention | Before intervention | Immediately after intervention | |
| Emotional problems | 0.48 | 0.34 | 0.42 | 0.34 |
| Conduct problems | 0.35 | 0.27 | 0.31 | 0.25 |
| Hyperactivity | 0.57 | 0.52 | 0.52 | 0.47 |
| Peer problems | 0.30 | 0.24 | 0.26 | 0.23 |
| Pro-social behaviour (lack of) | 0.28 | 0.25 | 0.23 | 0.20 |
| Total difficulties score | 0.43 | 0.34 | 0.38 | 0.32 |
Table 4.23 details the number of children aged 5-17 whose parents completed a preintervention questionnaire, a 6-month, and a 12-month post-intervention questionnaire, by intervention type.
Table 4.23: Number of questionnaire responses – children’s wellbeing (5-17- year-olds)
| Intervention | Pre & 6- month postintervention | 12-month post-intervention |
|---|---|---|
| Mentalization-Based Therapy - Parenting Under Pressure | 146 | 61 |
| Triple P Family Transitions | 66 | 24 |
| The Incredible Years School Age ADVANCED | 15 | 2 |
| 4Rs 2Ss Strengthening Families Programme | 0 | 0 |
| Enhanced Triple P | 37 | 13 |
| Family Check-up for Children | 18 | 12 |
| Parents Plus – Parenting When Separated | 50 | 20 |
116 families with 5-17-year-old children attended a moderate intensity intervention, and 234 families with 5-17-year-old children attended a high intensity intervention, that completed both a pre-intervention questionnaire and a 6-month post-intervention questionnaire.
Table 4.24 shows the effect sizes for high and moderate intensity interventions for these children, comparing the pre intervention questionnaire with the first post intervention questionnaire. The following conclusions can be made from comparing the pre intervention and post intervention questionnaire:
- Children whose parent(s) completed a high intensity intervention showed improvements in wellbeing across the full range of measures, significant at the 1% level.
- Children whose parent(s) completed a high intensity intervention showed improvements in wellbeing across the full range of measures, significant at the 1% level for emotional and conduct problems, prosocial behaviour, and total difficulties. The reduction in hyperactivity and peer problems are significant at the 5% and not significant at the 5% level respectively.
- Children whose parent(s) attend high intensity interventions showed larger improvements in wellbeing, across all measures, than those whose parent(s) attended moderate intensity interventions
Table 4.24: Effect sizes for each child wellbeing measure (high v moderate intensity)
| Child wellbeing measure | High Cohen’s d | Moderate Cohen’s d |
|---|---|---|
| Emotional problems | 0.57 | 0.35 |
| Conduct problems | 0.39 | 0.34 |
| Hyperactivity | 0.24 | 0.18 |
| Peer problems | 0.28 | 0.13 |
| Prosocial behaviour | 0.19 | 0.13 |
| Total difficulties | 0.54 | 0.37 |
This suggests that the more expensive, high intensity interventions resulted in greater improvements in the wellbeing of children aged 5-17. This is expected, and whilst these children show medium reductions in total difficulties, children whose parent(s) attend moderate intensity interventions also showed small-medium reductions in total difficulties. These findings align with the analysis of interparental relationships, where both intact and separated parents who completed high intensity interventions showed larger improvements than those who completed moderate intensity interventions.
90 (47) families, with children aged 5-17, that attended a high (moderate) intensity intervention also completed a 12-month post-intervention questionnaire. For both high and moderate intensity interventions, there was no significant difference between the scores at the 6-month and 12-month post-intervention questionnaire. This means that the improvements in child wellbeing were sustained for at least 12 months after parents complete an intervention.
Table 4.25 shows the effect sizes for each intervention, where sample sizes allowed for robust estimates, comparing the pre intervention questionnaire with the first post intervention questionnaire. The following conclusions can be made from comparing the pre intervention and post intervention questionnaire:
- children whose parent(s) completed Mentalization Based Therapy showed improvements in wellbeing across all measures, significant at 1% the level
- children whose parent(s) completed Triple P Family Transitions showed reductions in emotional problems and total difficulties, significant at the 1% level. Reductions in hyperactivity and peer problems were significant at the 5% level. There was no significant improvement in conduct or prosocial behaviour
- children whose parent(s) completed Parents Plus – Parenting When Separated showed reductions in conduct problems and total difficulties, significant at the 1% level. The reduction in emotional problems and improved prosocial behaviours were significant at the 5% level. There was no significant improvement in hyperactivity or peer problems
Table 4.25: Effect sizes for each child wellbeing measure (intervention level)
| Child wellbeing measure | MBT Cohen’s d | FTTP Cohen’s d | PWS Cohen’s d |
|---|---|---|---|
| Emotional problems | 0.65 | 0.73 | 0.32 |
| Conduct problems | 0.47 | 0.19 | 0.47 |
| Hyperactivity | 0.26 | 0.27 | 0.14 |
| Peer problems | 0.30 | 0.25 | 0.22 |
| Prosocial behaviour | 0.22 | -0.02 | 0.30 |
| Total difficulties | 0.59 | 0.55 | 0.44 |
These findings suggest that all the tested interventions successfully improved child wellbeing. Parenting When Separated was the only moderate intensity intervention with sufficient sample size to analyse individually, so it is unsurprising that the reduction in total difficulties is greater for the children of parents who attended both Mentalization Based Therapy and Triple P Family Transitions - the more expensive, involved provisions. The findings for children’s wellbeing corroborate those for interparental relationships.
4.8.5 Intervention level findings for 2-4-year-old children
18 families with 2-4-year-old children attended a moderate intensity intervention, and 56 families with 2-4-year-old children attended a high intensity intervention, and completed both a pre-intervention questionnaire and a 6-month post-intervention questionnaire. For families with children aged 2-4 there were too few questionnaire responses for moderate intensity interventions to compare the outcomes of children whose parents attend high and moderate interventions. Likewise at intervention level, there are too few 2-4-year-olds whose parents attended individual interventions to compare the efficacy of each intervention in improving the wellbeing of children aged 2-4.
4.9 Were parents from different subgroups (e.g. those participating alone) more or less likely to drop out of an intervention early?
There is no conclusive evidence that employment status, ethnicity, or participating with your (ex-)partner affected the likelihood that a family would either not start, or not complete, an intervention.
For intervention provider payment purposes, parents who attended 50% of a moderate intensity intervention, or 80% of a high intensity intervention[footnote 21], were deemed to have ‘completed’ an intervention. Separate research with parents who families to complete an intervention[^]22 outlines the reasons that parents gave for failing to start or complete an intervention. Another separate study[footnote 23] outlines what worked to prevent drop-out. This report focuses on the different types of dropouts and the characteristics of parents who either did not start, or did not complete, an intervention.
Table 4.27 shows the number, and percentage, of families that were referred to, started, and completed, an RPC intervention, by various characteristics:
Table 4.27: Number of families were referred, started, and completed provisions
Note: percentages shown are as a proportion of referrals for each group
| - | Total | Working | Workless | Ethnic minority | Non-ethnic minority | Participating alone | Participating together |
|---|---|---|---|---|---|---|---|
| Referrals | 3,814 | 1,596 | 2,218 | 348 | 3,466 | 1,239 | 2,575 |
| Starters | 2,995 (79%) | 1284 (80%) | 1,711 (77%) | 296 (85%) | 2,699 (78%) | 948 (77%) | 2,047 (79%) |
| Completers | 1685 (44%) | 750 (47%) | 935 (42%) | 194 (56%) | 1,491 (43%) | 570 (46%) | 1,115 (43%) |
Of the 3,814 families that were referred to an RPC intervention, 21% dropped out before starting the intervention and 56% of families referred dropped out without completing an intervention.
4.9.1 Employment status
20% of families where both parents worked at the point of referral dropped out before starting an intervention, compared with 23% for families where at least one parent is out of work. 53% of working families dropped out without completing an intervention, compared with 58% of other families.
4.9.2 Ethnicity
15% of families where at least one parent identified as an ethnic minority dropped out before starting an intervention, compared with 22% for families where neither parent identified as ethnic minority. 44% of ethnic minority families dropped out without completing an intervention, compared with 57% of non-EM families. As with the above analysis comparing ethnic minority and non-EM families, the area effect reduces the reliability of these statistics.
4.9.3 Participating with or without (ex-)partner
21% of families where both parents were referred to an intervention dropped out before starting the intervention, compared with 23% for families where only one parent was referred to an intervention. 54% of parents participating alone dropped out without completing an intervention, compared with 57% pf parents participating together.
Table 4.28 shows the number, and percentage, of families that were referred to, started, and completed, an RPC intervention, by CPA:
Table 4.28: Number of families were referred, started and completed provisions (CPA level)
| Total | Westminster | Gateshead | Hertfordshire | Dorset | |
|---|---|---|---|---|---|
| Referrals | 3,814 | 586 | 940 | 1,084 | 1,168 |
| Starters | 2,995 (79%) | 498 (85%) | 710 (76%) | 847 (78%) | 940 (80%) |
| Completers | 1,685 (44%) | 397 (68%) | 287 (31%) | 596 (55%) | 405 (35%) |
Westminster retained the greatest proportion of families, with 68% of families referred completing an intervention, followed by Hertfordshire (55%), Dorset (35%) and Gateshead (31%) respectively. Different providers, and CPAs, used different strategies to both ensure that the appropriate parents were referred and keep parents engaged in the provision. However, this report does not explore this.
Chapter 5: Key findings and discussion
This chapter summarises the key findings from Chapter 4 and summarises the success of the interventions’ component of the 2018-22 RPC programme. It discusses the wider implications for local decision making on Early Help interventions and how this evaluation contributes to the UK evidence base on what improves interparental relationships, parenting, and child emotional adjustment and wellbeing, especially for disadvantaged groups.
5.1 Other reports
Alongside this evaluation, the 2018–2022 RPC programme was supported by two other strands of evaluation:
An independent evaluation conducted by IFF Research Ltd, which examined how local authorities had integrated elements of parental conflict support into their services for families, and how the training of practitioners and relationship support professionals had influenced practice on the ground.[footnote 24] This research also explored the experiences of parents accessing the seven RPC interventions evaluated in this study.
An innovative qualitative study which used diary research to follow 45 parents as they participated in RPC interventions.[footnote 25] This study provides a detailed picture of how participation impacted day-to-day family life, including parental and child wellbeing, child access and custody arrangements, finance, household composition and wider networks.
This evaluation builds on existing evidence held in the EIF guidebook.
5.2 Limitations and further research
This section reflects on the evaluation design and discusses possible improvements that may further improve the evidence base on what works to improve interparental relationships and children’s mental health and wellbeing.
5.2.1 Identifying reasons for early disengagement
A small number of parents who did not start interventions, and parents who started but did not complete interventions, submitted questionnaire responses. There were too few respondents to conduct robust quantitative analysis of these groups. Researchers conducting similar trials may wish to pursue responses more actively from these groups, because it would provide a more reliable picture of why some parents either drop out of interventions without starting or disengage early. Some analysis of these groups is reported in the final evaluation report.[footnote 26]
5.2.2 Establishing a counterfactual
This evaluation was a non-experimental design and as such there is no counterfactual. To establish the impacts on families of RPC interventions more conclusively, a robust counterfactual would be required.
Researchers conducting analysis in this field may look to delay the provision of interventions for some parents who are referred. It was not deemed possible in this study; however, these parents may suitably act as a counterfactual if further research is conducted.
5.2.3 Monetising improvements in interparental relationships and children’s mental health and wellbeing
This evaluation did not estimate the benefits experienced by families in monetary terms, it focussed instead on the size of the improvements in relationships and wellbeing. In order to monetise improvements in wellbeing, questions such as those in the WELLBY approach could be incorporated into the surveys.
5.3 Summary of key findings
2,694 parents, in 1,685 families, completed an intervention between 2019 and 2022. On average, these parents showed statistically significant improvements in interparental relationships after they completed an RPC provision. These 2,694 parents also reported statistically significant improvements in their children’s mental health and wellbeing after they completed a provision. Where it was possible to estimate, there was no evidence that interparental relationships and child wellbeing regressed towards pre-intervention levels in the 12 months after completing an intervention. This suggests that the improvements after parents completed an intervention were sustained and, for some relationship and child wellbeing measures, further improvements were seen in the 12 months following completion of an intervention. These statistically significant improvements are likely to substantively improve parents’ relationships, children’s later life outcomes, and may reduce demands for other services such as the Child Maintenance Service.
Families that completed both high and moderate intensity interventions showed statistically significant improvements in interparental relationships and their children’s mental health and wellbeing. This suggests that local authorities may benefit from providing a range of high and moderate intensity interventions, to meet the needs of parents in their area. Families that completed the more expensive, high intensity, interventions showed greater improvements in both interparental relationships and their children’s mental health than the families that completed moderate intensity interventions.
Where it was possible to carry out intervention level analysis, all interventions showed significant improvements in both interparental relationships and child wellbeing. In terms of effect size, parents who completed Mentalization Based Therapy showed greater improvements in interparental relationships and child wellbeing, on average, than other interventions. However, as of 2022, MBT was generally considered to be the most expensive intervention, and it was not possible to adjust the effect sizes in this report for the cost of the interventions. Therefore, this report cannot make any claim about the relative value for money of each intervention.
Intact families showed larger improvements in interparental relationships and child wellbeing than separated families. This this may be influenced by the fact that a greater proportion of intact families participated together than parents in separated families, because parents who participated together experienced greater improvements in interparental relationships and child wellbeing. It should be noted that parents participating alone still showed statistically significant improvements in interparental relationships and their children’s wellbeing.
Families that completed RPC provisions reported significant improvements in interparental relationships and child wellbeing, irrespective of parents’ employment status, though working families saw greater improvements in child wellbeing. The magnitude of improvement in interparental relationships was similar for both family types.
Both ethnic minority and non-EM families showed significant improvements in interparental relationships and child wellbeing after completing an intervention, which suggests that improvements are seen, irrespective of parents’ ethnicity. The majority of ethnic minority families that completed an intervention were situated in the Westminster CPA, which means that this study could not reliably compare the effect sizes for non-EM and ethnic minority families.
5.4 Discussion and conclusion
5.4.1 Comparisons to the international evidence
A key aim of the 2018-22 RPC programme and its evaluation was to build the UKcentric evidence to support the use of interventions of this kind with other and/or disadvantaged families; prior to this study, there was no comparable UK-based evidence of this quality.
In 2016, the Early Intervention Foundation published a systematic review of existing literature on what works to enhance interparental relationships and improve outcomes for children.[footnote 27] They found 28 international studies which evaluate the impact of interventions to support couples experiencing or at risk of conflict. The international evidence suggests similar findings to those in this evaluation and includes a number of rigorously implemented RCTs and other robust methodologies.
Both Mentalization Based Therapy (MBT) and Family Transitions Triple P have been tested internationally, with effect sizes calculated for comparable interparental relationship and child wellbeing and mental health measures among specific family groups.
In the UK, MBT has been implemented to help foster families understand their foster child’s needs and feelings, with Midgley et al (2019)[footnote 28] employing a RCT design to investigate the efficacy of MBT for children in foster care. The parents of 15 children were allocated to MBT, with 21 children used as a control group. Hertzmann et al (2019)[footnote 29] also examined the efficacy of MBT. They identified parents experiencing high levels of conflict, using a hierarchical linear modelling approach with 15 pairs of coparents (30 parents). Effect sizes are not directly reported in this study, but can be calculated using Cohen’s d. Both studies demonstrated positive impacts on a number of relationship and child wellbeing measures, shown in table 5.1 below.
Table 5.1: Effect sizes for international studies on MBT
| Study | Measures | Cohen’s d |
|---|---|---|
| Midgley et al (2019) | Parent distress (Parenting Stress Index) | 0.26 |
| Midgley et al (2019) | Parent-child interactions (Parenting Stress Index) | 0.63 |
| Midgley et al (2019) | Emotional problems (SDQ) | 0.39 |
| Midgley et al (2019) | Conduct problems (SDQ) | 0.39 |
| Hertzmann et al (2016) | Parenting alliance | 0.14 |
| Hertzmann et al (2016) | Total difficulties (SDQ) | 0.71 |
Both studies employ SDQ measures that are also used in this evaluation. Results suggest small-medium effect sizes shown in emotional problems, conduct problems, and total difficulties and are in keeping with the findings in this evaluation. Although the parenting and relationship measures are different in these studies to the measures used in this evaluation, they exhibit similar effect sizes to those found in this evaluation.
Family Transitions Triple P was evaluated in Australia (Stallman & Sanders, 2014). 138 parents were offered the intervention, half attending the standard provision and half attending an enhanced version of the provision. 67 parents on a waitlist were used as a control group. Similar to this evaluation, effect sizes are calculated in this study for immediately after intervention, and again in a 12 month follow up questionnaire. The results are shown in table 5.2 below.
Table 5.2: Effect sizes for Stallman & Sanders (2014) on Family Transitions Triple P
| Time period | Measures | Cohen’s d |
|---|---|---|
| Immediately after intervention | Child behaviour problems (ECBI) | 0.28-0.43 |
| 12 months after intervention | Child behaviour problems (ECBI) | 0.44-0.56 |
| Immediately after intervention | Parental adjustment (DASS) | 0.17-0.40 |
| 12 months after intervention | Parental adjustment (DASS) | 0.06-0.22 |
Stallman & Sanders (2014) assessed child outcomes using the Eyberg Child Behavior Inventory (ECBI), which is different to the SDQ measures used in this evaluation. However, the effect sizes are comparable across both studies. The continued improvement in child behaviour for up to 12 months following intervention is also reported in both studies. This is somewhat expected, where children’s behavioural adjustment may take longer than improvements in interparental relationships, noting the link between improved interparental relationship quality and improved mental health and other outcomes for children evidenced in past international longitudinal and intervention studies.
Parental adjustment was assessed using the Parental adjustment questions in the Depression Anxiety Stress Scale (DASS). Although these were not employed in this study, effect sizes are of a similar magnitude to the findings of this evaluation. They saw further improvements in the 12 months following intervention, though these were smaller than the improvements in child behaviour, also reported in this evaluation.
This implies that the magnitude of improvement is seen in both interparental relationships and children’s mental health and wellbeing after their parents complete Mentalization Based Therapy and Family Transitions Triple P in the UK is similar to the improvements shown in international evidence. This increases confidence in these findings, where studies that employed an experimental design with a counterfactual reported similar improvements.
5.4.2 Contribution to the international evidence base
The Early Intervention Foundation’s review of existing literature highlights the lack of UK based interventions tests, and the issue of external validity with results from RCTs, explaining the importance of testing the efficacy of these interventions in the UK before these interventions are implemented at scale.
There is substantial, established evidence to suggest, for example, that supporting parents during separation (whether parents were living together or not) improves multiple areas of relationship quality post separation, which in turn improves mental health and wellbeing outcomes for children and adolescents.30 The evidence presented in this report contributes significantly to the developing international evidence in the field of interparental relationships and child psychopathology. Supporting parents at the level of the interparental relationship also reduces poor adult mental health outcomes, reduces substance misuse and related problems, and reduces the inter-generational transmission of interpersonal violence, substantively reducing long term negative outcomes (DWP, 2017[footnote 31]; Harold & Sellers, 2018[footnote 32]).
Annexe 1.1 – Full list of local authorities involved
| Contract Package Area | Local Authority |
|---|---|
| Dorset | Bournemouth, Christchurch and Poole |
| Dorset | Devon |
| Dorset | Dorset |
| Dorset | Plymouth |
| Dorset | Somerset |
| Dorset | Torbay |
| Dorset | Wiltshire |
| Gateshead | Durham |
| Gateshead | Gateshead |
| Gateshead | Hartlepool |
| Gateshead | Middlesbrough |
| Gateshead | Newcastle Upon Tyne |
| Gateshead | Northumberland |
| Gateshead | Redcar and Cleveland |
| Gateshead | South Tyneside |
| Gateshead | Stockton-on-Tees |
| Gateshead | Sunderland |
| Hertfordshire | Buckinghamshire |
| Hertfordshire | Cambridgeshire |
| Hertfordshire | Essex |
| Hertfordshire | Hertfordshire |
| Hertfordshire | Peterborough |
| Hertfordshire | Southend-On-Sea |
| Hertfordshire | Thurrock |
| Westminster | Brent |
| Westminster | Camden |
| Westminster | Croydon |
| Westminster | Hammersmith and Fulham |
| Westminster | Kensington and Chelsea |
| Westminster | Lambeth |
| Westminster | Westminster |
Annexe 3.1 – Theory of change for interventions
Inputs & assumptions → →
Effective identification and referral processes
- Correctly assessing and identifying intensity/nature of conflict
- Identifying parents and children who are experiencing domestic abuse and directing them to more appropriate support
Comprehensive initial assessment and developing a corresponding action plan
- Identifying relationship problems and goals
- Identifying problem behaviour from children
- Developing a sound treatment plan
Ensuring intervention delivery and success
- Parents understand how the interventions can help
- Parents are motivated and make an active choice to participate (i.e. they do not feel coerced)
- Parents can get to the venue or participate virtually/digitally
- Service providers offer good quality logistics and communicate the time and place of sessions
- Where appropriate, both parents are willing to participate in the intervention (sometimes with the other parent)
- Parents are willing to participate without the cooperation of the other parent
- Parents are willing to participate in group sessions, where this is appropriate
- Parents develop good rapport with the professionals who deliver the interventions
- Parents and practitioners communicate effectively
- Parents know what to expect
- Parents are willing to discuss difficult topics
- Parents put their learning into practice during and after intervention completion
- External influences and life events do not interrupt or prevent participation
Outputs (immediate outcomes for parents) →
Relationship skills
- Better problem solving and conflict resolution
- Improved family cohesion
- Appropriate and proactive limit-setting
- Ability to recognise issues/barriers and address them
- Positive inter-personal interactions
- Giving and responding to constructive feedback
- Increased empathy and appreciation of each other’s views
- Improved decision making and communication
- Proactive strategies for respectful talking and listening
- Being motivated to improve their relationship(s)
- Parents work as a team to nurture and support each other
- Parents able to recognise and communicate issues/expectations
- Parents start planning for the future
Understanding and managing emotions & behaviour
- Parents more able to manage their own stress and reduce its negative effects on their relationships
- Lower levels of family stress
- Better understanding of the family’s challenges
- Better capacity for reflection
- Improved emotional awareness and regulation
- Better ability to defuse tense situations and lower levels of anger
- Increased resilience and self-awareness
- Awareness and understanding of family dynamics
Parenting skills
- Understanding the impact of conflict on children
- Ability to apply positive parenting approaches
- Improved co-parenting, cooperation and parental planning
- Improved parental and child-parent communication
- Improved confidence/ability to address children’s problems
- Parents delivering the same story about divorce/separation
- Children are more able to manage their emotions
- Parents able to work with teachers for the child’s best interest
- Parents able to recognise the child’s point of view
- More consistency in parenting styles and approach
Medium-long term outcomes
Parental outcomes
- Improved interparental communication
- Better relationship satisfaction
- Improved separated interparental relationships
- Better satisfaction with custody arrangements (separated parents only)
- Increased parent-child contact (separated parents only)
- Improved relationships (familial and beyond)
- Better self-esteem and improved mental health
- Improved parenting practice
- Enhanced family collaboration and cohesion
- Improved resilience to stress and negative events
- Lower family stress
- Stronger parent-child relationships
- Improved parental mental and physical health
Child outcomes
- Stronger parent-child relationships
- Better emotional development (e.g. empathy and resilience)
- Better conduct and reduced criminal, violent and/or anti-social behaviour
- Less hyperactivity / better concentration
- Improved child mental and physical health
- Improved school attendance and educational attainment
Later-life outcomes
- Improved mental and physical health
- Better employment outcomes
- Improved relationship skills as adults
- Better parenting skills as adults
- Reduced use of health, welfare and other government services (e.g. family courts, criminal justice, etc.)
Annexe 3.2 – Source of relationship measures
Relationship measures for intact families:
| Name | Description | Source |
|---|---|---|
| Relationship warmth | Care, support and understanding | Iowa Youth and Families warmth-Hostility subscale |
| Hostility | Anger and argumentative behaviour between parents | Iowa Youth and Families Warmth-Hostility subscale |
| Relationship satisfaction | Happiness within relationship | Dyadic Adjustment scale (DAS-32, Satisfaction) |
| Relationship agreement[footnote 33] | Having similar relationship values, goals, and beliefs | Dyadic Adjustment scale (DAS-7) |
| Overt hostility | Arguing in front of their children | O’Leary Porter Scale |
Relationship measures for separated families:
| Name | Description | Source |
|---|---|---|
| Conflict when communicating[footnote 34] | Anger and argumentative behaviour between parents | Ahrons (conflict) |
| Frequency of conflict | How often parents argue | Morrison & Coiro (frequency of conflict) |
| Breadth of conflict | The range of issues argued about | Morrison & Coiro (breadth of conflict)[footnote 35] |
| Co-parenting support | Helping each other as parents | Ahrons (co-parenting)[footnote 36] |
| Satisfaction with custody arrangements | Happiness with parenting arrangement (e.g. joint parenting) | Kramer & Washo[footnote 37] |
| Co-parental communication[footnote 38] | Communicating well about the children | Kramer & Washo |
Annexe 3.3 – Questions in each relationship measure
Interparental relationship measures for separated parents
The conflict when communicating measure involves asking 5 questions:
1. When you & your former partner/spouse discuss parenting issues, how often does it lead to an argument?
2. How often is the atmosphere one of hostility and anger?
3. How often are your conversations stressful and tense?
4. Do you and your former partner/spouse have basic differences of opinion about issues related to raising your child / parenting?
The answering scale is:
-
1 (always)
-
2
-
3
-
4
-
5 (never)
5. How well do you agree when making decisions about your child / children?[footnote 39]
The answering scale is:
-
1 (very poorly)
-
2
-
3
-
4
-
5 (very well)
The items are summed to produce an overall score where the minimum score (max conflict) is 4 and the maximum score (min conflict) is 25.
The frequency and breadth of conflict measures involve asking four questions:
How frequently do you and your former spouse/partner argue about each of the following nine topics:
Children
Money
Chores and responsibilities
Showing affection to each other
Religion
Leisure time
Drinking
New partners
Relatives
The answering scale is:
-
0 (never)
-
1 (hardly ever)
-
2 (sometimes)
-
3 (often)
To assess the frequency of conflict, items are summed (possible range 0 to 27). To assess breadth, each item is coded as yes (1 = often or sometimes) or no (0 = hardly ever or never) and then summed the number of content areas reported arguing about (possible range 0-9).
The co-parenting support relationship measure involves asking six questions:
1. When you need help regarding the children, do you ask for it from your former partner/spouse?
2. Is your former partner/spouse helpful to you in raising your child / children?
3. Would you say that you are helpful to your former partner/spouse in raising your children?
4. If your former partner/spouse needs to make a change to visiting arrangements, do you make a real effort to accommodate (make this work)?
5. Does your former partner/spouse make a real effort to accommodate any changes you need to make visiting arrangements?
6. Do you feel that your former partner/spouse understands and is supportive of your needs as a parent (whether your children live with you or not)?
The answering scale is:
-
1 (always)
-
2
-
3
-
4
-
5 (never)
Minimum score (most supportive) is 6; maximum score (least supportive) is 30.
The satisfaction with custody arrangements relationship measure involves asking five questions:
How satisfied are you with:
-
The amount of time your child / children spend with their other parent
-
How your child / children spend this time with the other parent.
-
Arrangements for child custody (who your child lives with).
-
Arrangements for visitation (with the other parent and relatives).
-
Arrangements for child support (financial).
The answering scale is:
-
1 (very dissatisfied)
-
2
-
3
-
4
-
5 (very satisfied)
Minimum score (least satisfied) is 5; maximum score (most satisfied) is 25.
Interparental relationship measures for intact parents
The warmth relationship measure involves asking five questions:
Please indicate how often your spouse/partner acted in the following ways with you:
1. Let you know they really care about you
2. Was loving and / or affectionate towards you
3. Let you know that they appreciate your ideas or the things you do
4. Help you to do something that is important to you
5. Be supportive and understanding towards you
The answering scale is:
-
1 (always)
-
2
-
3
-
4
-
5
-
6
-
7 (never)
Minimum score (most warmth) is 5; maximum score (least warmth) is 35.
The hostility subscale involves asking four questions:
Please indicate how often your spouse/partner acted in the following ways with you:
1. Criticise you
2. Argue with you when you disagreed about something
3. Get angry at you
4. Shout at you because they were upset with you
The answering scale is:
-
1 (always)
-
2
-
3
-
4
-
5
-
6
-
7 (never)
Minimum score (most hostility) is 4; maximum score (least hostility) is 28.
The relationship satisfaction subscale involves asking four questions:
1. How often do you discuss or have you considered divorce, separation or ending your relationship?
2. Do you ever regret that you married? (or lived together)
3. How often do you and your spouse / partner argue?
4. How often do you and your spouse / partner “get on each other’s nerves”?
The answering scale is:
-
0 (all the time)
-
1
-
2
-
3
-
4
-
5 (never)
Minimum score (least satisfaction) is 0; maximum score (most satisfaction) is 36.
The overt hostility subscale involves asking eight questions:
-
Sometimes it is difficult to keep financial discussions to specific times and places. How often would you say you and your spouse/partner argue over money in front of this child?
-
Children often go to one parent for money or permission to do something after having already been refused by the other parent. How often would you say this child approaches you or your spouse/partner in this manner?
-
Parents disagree on the subject of discipline. How often do you and your spouse/partner argue over disciplinary problems in front of this child?
-
How often does your spouse/partner complain to you about your behaviour in the home (e.g. drinking or smoking, nagging, sloppiness, etc.) in front of this child?
-
In every normal relationship there are arguments. How often do you complain to your spouse/partner about their behaviour in front of this child?
-
How often do you and your spouse/partner argue in front of this child?
-
How often do you and/or your spouse/partner display verbal hostility in front of this child?
-
How often do you and your spouse/partner show affection for each other in front of this child?
The answering scale is:
-
1 (never)
-
2
-
3
-
4
-
5 (very often)
Minimum score (least overt hostility) is 8; maximum score (most overt hostility) is 40.
Annexe 3.4 – Questions in each children’s wellbeing measures
The second strand is the Strengths and Difficulties Questionnaire, a brief behavioural screening questionnaire about 2–17-year-olds. It exists in several versions to meet the needs of researchers, clinicians, and educationalists.]. The SDQ questions were asked in three questionnaires:
-
The pre-intervention questionnaire, reported before the parents attend an intervention
-
A post-intervention questionnaire, reported six months after the completion of an intervention
-
A second post-intervention questionnaire, reported 12 months after the completion of an intervention
All measures consist of 5 questions, the answering scale is:
-
Not True
-
Somewhat True
-
Certainly True
Emotional problems scale:
-
Often complains of headaches, stomach-aches, or sickness
-
Many worries, often seems worried
-
Often unhappy, downhearted, or tearful
-
Nervous or clingy in new situations, easily loses confidence
-
Many fears, easily scared
Conduct problems scale:
-
Often has temper tantrums or hot tempers
-
Generally obedient, usually does what adults request
-
Often fights with other children or bullies them
-
Often lies or cheats
-
Steals from home, school or elsewhere
Hyperactivity scale:
-
Restless, overactive, cannot stay still for long
-
Constantly fidgeting or squirming
-
Easily distracted, concentration wanders
-
Thinks things out before acting
-
Sees tasks through to the end, good attention span
Peer problems scale:
-
Rather solitary, tends to play alone
-
Has at least one good friend
-
Generally liked by other children
-
Picked on or bullied by other children
-
Gets on better with adults than with other children
Prosocial scale:
-
Considerate of other people’s feelings
-
Shares readily with other children (treats, toys, pencils etc.)
-
Helpful if someone is hurt, upset, or feeling ill
-
Kind to younger children
-
Often volunteers to help others (parents, teachers, other children)
Total difficulties score:
This is generated by summing scores from all the scales except the prosocial scale. The resultant score is counted as missing of one of the four component scores is missing.
Annexe 3.5 – Comparing the scores of referrals during the Coronavirus lockdown
An ANOVA test was conducted to determine whether the child wellbeing scores were statistically similar for children referred during lockdown to those referred either before lockdown, or after schools reopened. The two groups are those referred in lockdown, and those referred either before or after lockdown. The total difficulties subscale is a combination of four SDQ subscales so this was the subscale tested in this strand of analysis.
The distribution is non-normal for the three groups, however ANOVA is not very sensitive to moderate deviations from normality. Simulation studies, using a variety of non-normal distributions, have shown that the false positive rate is not affected very much by this violation of the assumption (Glass et al. 1972, Harwell et al. 1992, Lix et al. 1996). Therefore, it is still useful to conduct the test.
Null hypothesis: The mean difficulties score of each group is different
Alternative hypothesis: The mean difficulties score of each group is not different
Decision: If the p-value is greater than 0.05 then reject the null hypothesis
| Questionnaire | Variable | Pr > F |
|---|---|---|
| Pre-intervention | Total difficulties | 0.817 |
| 6 months post-intervention | Total difficulties | 0.1402 |
| 12 months postintervention | Total difficulties | 0.1086 |
For the total difficulties subscale, in all three child wellbeing surveys (pre-intervention questionnaire, 6- and 12-month post-intervention questionnaires), the mean score of each group was not statistically different. Therefore, it is reasonable to conclude that the effect of lockdown and the resultant history threat on the SDQ scores of children in this study is small.
Annexe 3.6 – Characteristics of parents who completed interventions and those that did not complete
The table below outlines the number of completers and non-completers that were referred to an RPC intervention between 2019-2022, at family level.
| Total | Working | Workless | Ethnic minority | Non-ethnic minority | Participating alone | Participating together | |
|---|---|---|---|---|---|---|---|
| Completers | 1,685 | 750 | 935 | 194 | 1,491 | 570 | 1,115 |
| Non-completers | 1,947 | 783 | 1,164 | 135 | 1,812 | 589 | 1,358 |
The table below shows the proportion of completers and non-completers that are workless, Ethnic minority, and participating alone, at family level.
| Workless | Ethnic minority | Participating alone | |
|---|---|---|---|
| Completers | 55% | 12% | 34% |
| Non-completers | 60% | 7% | 30% |
These proportions are sufficiently similar that it was concluded that the drop-out threat to internal validity was small in this evaluation.
Annexe 3.7 – Example participation agreement
Building Relationships for Stronger Families Programme
Participation Agreement
The Building Relationships for Stronger Families Programme is for parents who are experiencing difficulties in their relationship with their co-parent, whether they are together or separated.
On this program you will take part in:
-
activities that aim to help you to address the relationship difficulties you have identified; and
-
research to find out how to best support parents who are experiencing relationship difficulties.
Support available through this programme is paid for by Department for Work and Pensions (DWP) who are working with your local authority and Tavistock Relationships and a limited number of places are available for parents who meet the eligibility criteria.
The information you give us will help us to make sure you are eligible for the programme.
Eligibility Criteria:
I am a parent. This means at least one of the following:
-
I am a parent of at least one child aged 18 years or younger
-
I am a parent of a disabled child (under the Equality Act 2010) aged 25 years or younger
-
I or my partner/ex-partner are expecting a child and a MATB1 form has been issued
I live in one of the boroughs listed below (please tick one):
-
Westminster
-
Brent Lambeth
-
Hammersmith & Fulham
-
Camden
-
Kensington & Chelsea
-
Croydon
-
I am experiencing difficulties in my relationship with my partner / ex-partner.
-
I am happy to complete a Pre-intervention Questionnaire which will assess which activities will help me.
-
I understand that the information collected from me will be shared with the DWP and its Partners to enable them to monitor the performance of the contracts and evaluate the success of the programme.
Part of the research for the programme will investigate what support works best for families in different circumstances. For that reason, please tell us if you live in a household where:
-
No one is in work
-
someone is working
What will you do with the data you collect about me?
We will use the information that you give us to decide how to support you to address your relationship difficulties. We will also use your information to measure how effective the support you will receive has been. We will share this information with the programme evaluators, IFF and Tavistock Institute of Human Relations (TIHR). The results of the research are expected to form part of a DWP research publication. Individuals will not be identified in the research. The data will be kept by DWP until 2025.
To find out more about our purposes, how we use personal information for those purposes and your information rights, including how to request a copy of your information, please see www.gov.uk/dwp/personal-information-charter and www.westminster.gov.uk/fair-processing-notice
Please read and complete the next section to progress your referral
Statement of Participation
-
I understand that personal information is held about me by DWP and its Partners and will be used to assess the success of the programme.
-
I have had the opportunity to discuss the implications of sharing or not sharing information about me.
-
I understand that during my participation in the programme I will be asked to complete a questionnaire at the start and the end of the programme so that the success of the programme can be evaluated.
-
At the end of the programme I may be contacted by IFF and TIHR (via phone) so that I can give further feedback about the programme. If contacted, I may decline to participate although I understand my feedback will be appreciated.
-
DWP may contact me to ask me some questions about the programme so that they can make sure the payments they make to Tavistock Relationships are accurate.
-
To provide me with this support DWP will share the information I have given with their delivery partners. The delivery partners are DWP, Tavistock Relationships, Westminster Local Authority and the Provider in your area.
-
Tavistock Relationships needs your information to ensure that you are on the best programme for you/your partner or ex-partner. They will use your information to tailor support for you.
-
DWP are sponsoring this support as part of a trial. They need your information to see which of the types of support are most effective and so they can pay for the support. DWP may make use of information already held about you and your family by DWP and other public bodies, such as ‘The Department for Education’ and ‘The Children and Family Court Advisory and Support Service’, to help them do this. They will not use the information you give us as part of this trial in any other way.
-
If your partner/e-partner is taking part in the programme, DWP will link your information together. - The person who gave you this form will receive information back from Tavistock Relationships. This is so they know what support you are being given and whether you have completed the programme. - Westminster Local Authority are helping DWP to administer the trial. They will not use your information for any other purpose.
-
I understand my participation in this Programme is entirely voluntary and I may withdraw from it at any time.
I agree to a referral being made to Tavistock Relationships to support my needs as part of the Building Relationships for Stronger Families Programme. I understand that DWP/ Westminster Local Authority may hold information gathered about me from the various agencies and as such my rights under the Data Protection Act will not be affected.
Name …………………………………………………………………..…………….…………………………………………………………
Address ………………………………………………………………………………..……………………………………………………… ………………………………………………………………………………..………………………………………………………
Post code ………………………………………………………………
Date of Birth ……………………..…………
Signature ……………………………………………………………….
Date ………………………………………
Should you have any questions about this process, or what to stop getting the support at any time, please contact the person who supplied you with this document.
To be completed by referring professional:
I have explained the eligibility criteria for the programme to the parent and can confirm that they are eligible for the programme.
I realise that DWP may contact me about my experience in administering this programme.
Signature of Practitioner ……………………………………………………….…………………………………………………………………
Annexe 3.8 – Key implementation issues
Programme go-live: a slow start
Not all intervention delivery contracts went live from April 2019. Contracts became capable of receiving referrals of parents at different stages between May and July 2019. This led to a much slower start than anticipated, with a knock-on impact on number of parents who could participate and smaller sample sizes across the seven/eight interventions being tested. This was a key reason why the programme was extended beyond March 2021 (to March 2022).
Completion of key pre- and post-intervention questionnaires not mandatory at the outset
A key oversight during the agreement of the intervention delivery contracts was that completion and return to DWP of child wellbeing pre-intervention questionnaires and parental relationships post-intervention questionnaires was not a contractual requirement. The importance of these questionnaires to the evaluation was therefore underplayed. This led to a small shortfall in child wellbeing pre-intervention questionnaires opening up in the early months of the test that it was impossible to close (because parents had started an intervention).
However, programme communications soon stressed that it was imperative that parents participating in the programme completed a child wellbeing pre-intervention questionnaire prior to starting (where they had a child aged 2-17 years of age) and a parental relationships post-intervention questionnaire on completion (including leaving early).
Eligibility criteria relaxed in relation to workless and disadvantaged families
It was initially anticipated that 80% of families referred to the interventions would be parents from workless households, and around 20% would be from disadvantaged families. This was based on evidence that children living in workless families were three times more likely to experience parental conflict than families where both parents worked.
Due to the slow start and lower than anticipated referral volumes, the expectation for 80% of parents to be workless was relaxed from October 2019. The policy was softened so that any parent could be referred if the local authority identified them as being ‘disadvantaged’ regardless of being in work or not, based on their assessment of need. The impact of this change was that just 16% of families that participated in (i.e. started) an intervention were from families where both parents were workless at the point of referral.
Allowing parents in high conflict relationships to access moderate intensity interventions
At various stages from December 2019, parents who had been assessed using the pre-intervention questionnaire as experiencing high intensity conflict were allowed to be referred to moderate intensity interventions. Reasons for this included:
-
not meet the eligibility criteria for the available high intensity intervention within that CPA;
-
there being a significant risk that the parent/s were unlikely to start or complete the intervention (e.g. the provider was waiting for sufficient referrals to be received to make group sessions viable); and/or
-
where the provider had a series of group sessions that would benefit the parent
The impact of this policy change was that there was a significant group of parents experiencing high intensity conflict accessing moderate intensity interventions, thus reducing potential selection bias within the test. Although average baseline (preintervention questionnaire) conflict scores were higher for parents accessing high intensity interventions, this policy change led to being able to make fairer comparisons between the effects of high and moderate intensity interventions.
Face-to-face delivery paused due to Coronavirus
In March 2020, due to the need for social distancing during the Coronavirus pandemic, delivery of the interventions was paused until virtual/digital methods of delivery could be implemented (May 2020). Although all eight of the interventions being tested had been designed to be delivered face to face, the move to online delivery within two months was generally deemed to be a success. Some parents preferred to participate face-to-face/in-person, but this afforded more flexibility for other parents to attend sessions and fit them around their (work) schedule. In relation to this test, it is thought that this allowed more fathers to participate.
In October 2021, following the relaxation in social distancing requirements, eligible parents were given the option of choosing to participate in interventions virtually or in person. This meant that the families included in the evaluation will have experienced a mixture of modes of delivery. It was not possible to assess precisely what proportion of the total number of sessions were delivered online / face-to-face. However, for parents who completed an intervention, 80% of those who responded to the 6-month post-intervention survey reported that these were experienced virtually/online rather than face to face at home or another venue.
Although it was initially feared that the evaluation of the interventions would be undermined by a lack of fidelity (because the interventions were designed to be conducted face to face), the analyses in this report should be representative of how these interventions are likely to be delivered in the future – through a mixture of online and in-person sessions, driven by the personal preferences of parents.
Child wellbeing and parental relationships questionnaires issued via email
Once intervention delivery had switched from face-to-face to online modes, some providers started sending the questionnaires to parents via email, asking them to complete them without the support of a qualified practitioner. The immediate impact of this was that that the RPC Referral Team received questionnaires in PDF format that could not be ingested automatically to the evaluation database. DWP staff had manually input almost 1,000 questionnaires to the database. The full impact of the manual input process is unknown.
A more significant impact was on data completeness. Analysis of the raw data from the questionnaires showed that many records from this period of the programme had missing values for individual questions, presumably where parents did not know how to answer the question or simply missed the question (the Excel forms of the electronic questionnaires included validation to check for missing answers). The impact on the analyses covered in this report is that sample sizes used for certain subscales differ; to preserve data and maximise sample sizes, only subscales with missing questions were excluded from the analyses.
MS Excel database export/ingest problems
A key issue affecting all versions of the parental conflict pre-intervention questionnaire from the start of the test involved the questionnaire designers confusing two questions for separated parents. This meant that the co-parental communication subscale could not be constructed to provide a pre-intervention measure. The relationship agreement subscale for intact parents was also excluded due to data integrity issues.
At various points throughout the test, possibly due to Microsoft updates to Excel or sub-optimal Visual Basic code, the macros used to export the answers from questionnaires in CSV format for ingest to the evaluation database broke. Although these issues were addressed very quickly, this led to a small number of child wellbeing pre-intervention questionnaires and parental relationships post-intervention questionnaires being not ingested, either partly or completely.
Incredible Years eligibility criteria relaxed
Until March 2021, Incredible Years Advanced could only be accessed by parents who had previously completed the Basic Incredible Years course. This led to many parents not being able to participate, which may underpin the very low numbers of families that started and completed this intervention, making it impossible to deliver robust analyses of the effectiveness of this intervention.
Programme extension
In early 2021, a one-year extension was granted, partly to make up for the slow start and Coronavirus related pause in delivery. The final year of referrals between April 2021 and March 2022 accounted for 32% of the referrals made over the lifetime of the test, thus making the analyses reported here viable.
Parents reluctant to provide child’s name and date of birth
Purely for validation purposes, the child wellbeing pre-intervention questionnaire included two fields for the name and date of birth of the child the parent was describing when completing the questionnaire. This was purely so that analysts could check whether the child whose data was gathered prior to intervention was the same child whose data was captured post intervention. This has made this validation check unreliable.
Annexe 4.0 – Key programme numbers
Table A4.1: CPA statistics (parent level)
Number of parents who were referred to, started, and completed an intervention, broken down by CPA:
| Stage | All | Westminster | Gateshead | Hertfordshire | Dorset |
|---|---|---|---|---|---|
| Referrals | 6,110 | 850 | 1,800 | 1,670 | 1,740 |
| Starts | 4,800 | 720 | 1,360 | 1,310 | 1,410 |
| Completers | 2,690 | 560 | 570 | 920 | 640 |
Table A4.2: key subgroup statistics (parent level)
| All parents | Separated | Intact | Participated together | Participated alone | |
|---|---|---|---|---|---|
| Referred | 6,110 | 3,520 | 2,590 | 4,870 | 1,240 |
| Started | 4,800 | 2,690 | 2,120 | 3,850 | 950 |
| Completed | 2,690 | 1,520 | 1,180 | 2,120 | 570 |
Table A4.3: CPA statistics (family level)
Number of families that were referred to, started, and completed an intervention, broken down by CPA:
| Stage | All | Westminster | Gateshead | Hertfordshire | Dorset |
|---|---|---|---|---|---|
| Referrals | 3,810 | 590 | 940 | 1,080 | 1,170 |
| Starts | 3,000 | 500 | 710 | 850 | 940 |
| Completers | 1,690 | 400 | 290 | 600 | 410 |
Table A4.4: key subgroup statistics (family level)
| All parents | Separated | Intact | Participated together | Participated alone | ||
|---|---|---|---|---|---|---|
| Referred | 3,810 | 2,330 | 1,490 | 2,580 | 1,240 | |
| Started | 3,000 | 1,800 | 1,200 | 2,050 | 950 | |
| Completed | 1,690 | 1,020 | 670 | 1,120 | 570 | 96 |
Figure A4.1: cumulative intervention starts during the lifetime of the tests
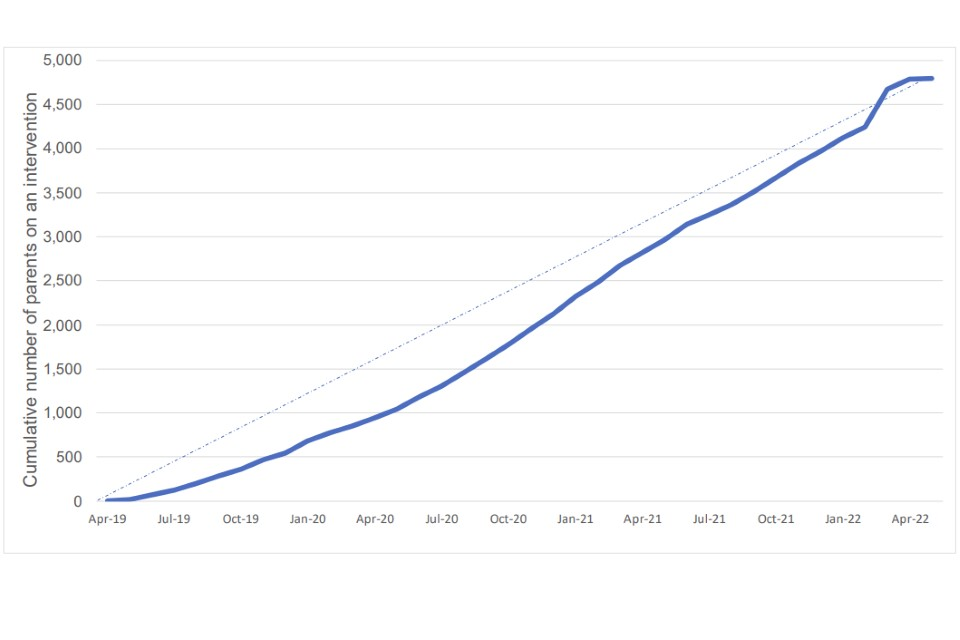
This illustrates a slow start to the tests in 2019, followed by a gradual increase in starts as a result of increased referrals from April 2020 onwards.
Figure A4.2: the number of parents and families flowing through the programme to illustrate the completion rates of the interventions and key evaluation questionnaires.
Total referred: 6,110 parents (3,814 families)
Total failed to start: 1,308 parents (819 families)
Key findings/observations:
-
Key reasons for not starting included the other parent not wanting to participate, thinking the service wouldn’t help, ongoing legal proceedings with their (ex)partner and not feeling that they needed RPC support.*
-
The referral to start ratio compares very well with other studies or DWP programmes.
-
In the final year of the test, the proportion of parents referred who started was much higher due to the gradual upskilling of the practitioners who made the referrals (i.e. referrals became more suitable as RPC embedded).
Total started: 4,802 parents (2,995 families)
Total failed to complete: 2,108 parents (1,310 families)
Total completed: 2,694 parents (1,685 families)
Key findings/observations:
-
Failure to complete was not always a bad thing – the main reasons for not completing was that parents felt the sessions were no longer helping* and some felt the sessions had already met their needs, so at least a third of parents who attended some sessions but left early will have benefitted to some extent.
-
This completion ratio compares very well with other studies/programmes.
-
Completion rates improved over the lifetime of the test following intensive input from DWP performance managers and RILs
-
‘Non-completers’ had similar characteristics to those who completed, giving us more confidence in the results.
Post intervention questionnaires completed: 2,005 parents (1,257 families)
Comments on data completeness:
-
Not every parent who completed an intervention completed a post-intervention questionnaire. This mainly affected earlier cohorts of parents when systems were not fully established and running smoothly.
-
Questionnaire completion rates improved over the lifetime of the test with input from DWP performance managers.
-
It was not possible to retrospectively fill the gap of uncompleted questionnaires that opened up in the first few months.
6 month survey responses: 878 parents
12 month survey responses: 374 parents
Comments on the surveys:
-
To get around a third of parents who completed an intervention to respond to a survey conducted 6 months later is a very good response rate, which gives us more confidence in our results because they are unlikely to be biased and are therefore more likely to represent the views and outcomes of all ‘completers’.
-
The 12-month survey was added to the evaluation after the one-year programme extension starting in 2021. Nevertheless, to get almost half of completers to respond to this survey (a year after they finished attending) is a very positive feature, and novel in studies of this kind.
Annexe 4.1 – Main pre- and post-intervention relationship and child wellbeing scores
Table for Figure 4.1
| Subscale | Conflict when communicating | Frequency of conflict | Breadth of conflict | Co-parenting support | Satisfaction with custody arrangements |
|---|---|---|---|---|---|
| Pre intervention | 0.71 | 0.43 | 0.44 | 0.53 | 0.54 |
| Post-intervention | 0.54 | 0.27 | 0.29 | 0.49 | 0.49 |
| 6 months post intervention | 0.53 | 0.22 | 0.22 | 0.42 | 0.44 |
| 12 months post intervention | 0.53 | 0.18 | 0.18 | 0.43 | 0.46 |
Table for Figure 4.2
| Subscale | Relationship warmth | Hostility | Relationship satisfaction | Overt hostility |
|---|---|---|---|---|
| Pre intervention | 0.54 | 0.56 | 0.44 | 0.47 |
| Post-intervention | 0.38 | 0.39 | 0.31 | 0.34 |
| 6 months post intervention | 0.39 | 0.33 | 0.31 | 0.32 |
| 12 months post intervention | 0.41 | 0.34 | 0.3 | 0.32 |
Table for Figure 4.3
| Subscale | Emotional problems | Conduct problems | Hyperactivity | Peer problems | Lack of prosocial behaviours | Total difficulties |
|---|---|---|---|---|---|---|
| Pre intervention | 0.46 | 0.34 | 0.56 | 0.29 | 0.27 | 0.41 |
| 6 months post intervention | 0.34 | 0.26 | 0.5 | 0.23 | 0.23 | 0.33 |
| 12 months post intervention | 0.33 | 0.23 | 0.48 | 0.23 | 0.2 | 0.32 |
Table for Figure 4.4
| Subscale | Emotional problems | Conduct problems | Hyperactivity | Peer problems | Lack of prosocial behaviours | Total difficulties |
|---|---|---|---|---|---|---|
| Pre intervention | 0.28 | 0.33 | 0.47 | 0.23 | 0.23 | 0.33 |
| 6 months post intervention | 0.23 | 0.25 | 0.39 | 0.13 | 0.17 | 0.26 |
Annexe 4.2 – Reliability analysis using Cronbach’s alpha
The relationship and child wellbeing measures combine individual question responses to generate a subscale. They are established measures which are theoretically related to one another, so should exhibit internal consistency. To ensure that analysis of these measures is appropriate in this study, standardized Cronbach’s alpha is used as a test of internal consistency. Standardized Cronbach’s alpha is used rather than ordinary Cronbach’s alpha because subscales are made up of questions with different scales. An alpha between 0.6 to 0.8 is considered acceptable (Shi et al., 2012)[footnote 40]. All measures used in this study score above 0.6 and as such have an acceptable level of internal consistency. The table below shows the standardized alphas for all 9 relationship measures, and the 6 child wellbeing measures:
| Analysis strand | Relationship measure | Standardized Cronbach’s alpha |
|---|---|---|
| Interparental relationships (separated) | Conflict when communicating | 0.78 |
| Interparental relationships (separated) | Frequency of conflict | 0.72 |
| Interparental relationships (separated) | Breadth of conflict | 0.65 |
| Interparental relationships (separated) | Co-parenting support | 0.65 |
| Interparental relationships (separated) | Satisfaction with custody arrangements | 0.71 |
| Interparental relationships (intact) | Relationship warmth | 0.92 |
| Interparental relationships (intact) | Hostility | 0.84 |
| Interparental relationships (intact) | Relationship satisfaction | 0.75 |
| Interparental relationships (intact) | Overt hostility | 0.79 |
| Child wellbeing | Emotional problems | 0.75 |
| Child wellbeing | Conduct problems | 0.74 |
| Child wellbeing | Hyperactivity | 0.79 |
| Child wellbeing | Peer problems | 0.64 |
| Child wellbeing | Prosocial behaviour | 0.79 |
| Child wellbeing | Total difficulties | 0.70 |
Annexe 4.3 – Subgroup breakdown by CPA
| CPA | % Ethnic minority* | % Workless** | % participating alone | % separated*** |
|---|---|---|---|---|
| Westminster | 83% | 38% | 47% | 64% |
| Gateshead | 10% | 46% | 6% | 54% |
| Hertfordshire | 30% | 29% | 37% | 61% |
| Dorset | 15% | 37% | 42% | 65% |
* at least 1 parent in family is ethnic minority
** at least 1 parent in family is workless
*** excluding expecting parents
Annexe 4.4 – Sensitivity checks for the CPA effect
The percentage of families where only one parent participated is similar across three of the four CPAs. The exception to this is Gateshead, where only 6% of families consisted of one participant compared with an average of 42% across Westminster, Hertfordshire, and Dorset. To assess the robustness of these findings, participants in Gateshead were excluded for sensitivity checks. Once Gateshead was excluded, there were 107 children of parents participating alone. There were 332 children aged 5-17, and 68 aged 2-4 where both parents participated in an RPC intervention.
The table below shows the effect sizes for each child wellbeing measure, for the remaining families, comparing the pre intervention questionnaire with the first post intervention questionnaire:
Effect sizes for each child wellbeing measure – excluding Gateshead (alone v together)
| Child wellbeing measure | Participating alone (5-17) Cohen’s d | Participating together (5-17) Cohen’s d | Participating together (2-4) Cohen’s d |
|---|---|---|---|
| Emotional problems | 0.35 | 0.56 | 0.30 |
| Conduct problems | 0.41 | 0.39 | 0.37 |
| Hyperactivity | 0.25 | 0.25 | 0.37 |
| Peer problems | 0.17 | 0.29 | 0.19 |
| Prosocial behaviour | 0.20 | 0.22 | 0.24 |
| Total difficulties | 0.45 | 0.53 | 0.50 |
Excluding participants from Gateshead has a small effect on the results. Improvements for 5-17-year-olds were larger and improvements for 2-4-year-olds were smaller, however the children of parents who both attended RPC interventions still showed larger improvements in wellbeing than those where only one parent attended and, as such, it is reasonable to conclude that these findings are not sensitive to the CPA effect.
Annexe 4.5 – Code of Practice for Statistics compliance statement
Trustworthiness
Key parts of this research were drawn from surveys conducted by IFF Research Ltd. These surveys were carried out impartially and in accordance with the Market Research Society Code of Conduct.
Data used in the analyses relates to families and is sensitive, so it was not possible to make raw data publicly available. This report provides a non-disclosive summary of the underlying research.
Research findings were shared with ministers and other officials before publication to promote the value of the research to the DWP, other central government departments and local government. Ministers played no editorial role.
Quality
This report has been developed in accordance with the Government Social Research Code to ensure that the analysis was rigorous, relevant and valued.
Quality assurance processes were conducted at the following levels during the analytical process through to reporting:
- source data was checked by a central Referral Team in DWP to ensure that parent records were valid and complete, and duplicate records were eliminated from the referral database;
- the integrity of data export processes was checked at key stages to ensure that answers to specific questions in the questionnaires resulted in appropriate values under the correct variables in the evaluation database;
- the methodology and approach, including statistical tests, were guided and reviewed by Prof. Gordon Harold at the University of Cambridge, with appropriate input other leading experts on the evaluation of relationship and parenting interventions;
- analysis was conducted primarily using SAS – SAS code was checked, cleaned and streamlined by at least three experienced DWP analysts to ensure high quality, accurate outputs; and
- the report was written and quality reviewed in line with DWP standards, and peer reviewed by the DWP Methods Advisory Group, an external panel of academics, commissioned to provide methodological advice to DWP analysts.
Value
The report provides evidence on the effects of the programme on parents and their children. Findings will be of particular interest to local authorities and other organisations involved in commissioning and delivering support for families in conflict.
-
Acquah, D., Sellers, R., Stock, L. & Harold, G. (2017) Interparental conflict and outcomes for children in the contexts of poverty and economic pressure, EIF ↩
-
Harold, G., Acquah, D., Chowdry, H. and Sellers, R. (2016) What works to enhance interparental relationships and improve outcomes for children? Early Intervention Foundation: UK. ↩
-
DWP (2023) Reducing Parental Conflict programme 2018-2022: Final evaluation report, London: Department for Work and Pensions ↩
-
Annexe 3.1 contains a condensed theory of change for RPC interventions. ↩
-
Ahrons, C.R. (1981). The continuing coparental relationship between divorced spouses. American Journal of Orthopsychiatry, 51, pp415–428. ↩
-
Kramer, L., & Washo, C. A. (1993) Evaluation of a court-mandated prevention program for divorcing parents: The children first program. Family Relations, Vol 42, No 2, pp179-186. ↩
-
Morrison, D. R., & Coiro, M. J. (1999). Parental conflict and marital disruption: Do children benefit when high-conflict marriages are dissolved? Journal of Marriage and the Family, Vol 61, No 3, pp626– 637. ↩
-
Not included, due to data integrity issues, outlined in Annexe 3.9. One question from this subscale was included in the conflict when communicating subscale. ↩
-
Not included, due to data integrity issues, outlined in Annexe 3.9. ↩
-
Hudson, J and Lowe, S (2004) Understanding The Policy Process: Analysing Welfare Policy And Practice, Bristol: The Policy Press. ↩
-
Robson, L.S., Shannon H.S., Goldenhar, L.M. and Hale, A.R. (2001) Guide to Evaluating the Effectiveness of Strategies for Preventing Work Injuries: How to Show Whether a Safety Intervention Really Works, National Institute for Occupational Safety and Health: USA ↩
-
Annexe 3.7 shows an example of a participation agreement. ↩
-
DWP (2023) Reducing Parental Conflict programme 2018-2022: Diary research with parents accessing interventions, London: Department for Work and Pensions ↩
-
Tests have been carried out to check the strength of the relationships between the answers of similar groups of questions to ensure that there is a high level of consistency in parents’ responses (i.e. questions on similar aspects of relationships are similar rather than random). This was done using Cronbach’s alpha. Details of these tests can be found in Annexe 4.2. ↩
-
Bøe T., Hysing M., Skogen J.C and Breivik K. (2016) The Strengths and Difficulties Questionnaire (SDQ): Factor Structure and Gender Equivalence in Norwegian Adolescents. PLoS One. 2016 May 3;11(5):e0152202. doi: 10.1371/journal.pone.0152202. PMID: 27138259; PMCID: PMC4854391. ↩
-
The standardized national average is 0.21 for total difficulties, adapted from Meltzer, H., Gatward, R., Goodman, R., and Ford, F. (2000) Mental health of children and adolescents in Great Britain. London: The Stationery Office. ↩
-
‘Participating together’ is where both parents attended the same intervention, but they did not necessarily attend sessions with the other parent. However, some joint sessions may have been held, especially for intact couples. ↩
-
Improvements were significant at the 1% level for all measures except for hyperactivity (where only one parent participated) which was significant at the 5% level. ↩
-
This may partly explain why families that attended high intensity interventions reported greater improvements on average. However, it was not possible to isolate this effect. ↩
-
DWP (2023) Reducing Parental Conflict programme 2018-2022: Diary research with parents accessing interventions, London: Department for Work and Pensions ↩
-
DWP (2023) Reducing Parental Conflict programme 2018-2022: Final evaluation report, London: Department for Work and Pensions ↩
-
DWP (2023) Reducing Parental Conflict programme 2018-2022: Diary research with parents accessing interventions, London: Department for Work and Pensions ↩
-
DWP (2023) Reducing Parental Conflict programme 2018-2022: Final evaluation report, London: Department for Work and Pensions ↩
-
Harold, G., Acquah, D., Chowdry, H. and Sellers, R. (2016) What works to enhance interparental relationships and improve outcomes for children? Early Intervention Foundation: UK. ↩
-
Midgley, N., Cirasola, A., Austerberry, C., Ranzato, E., West, G., Martin, P., Redfern, S., Cotmore, R. and Park, T. (2019) Supporting foster carers to meet the needs of looked after children: A feasibility and pilot evaluation of the Reflective Fostering Programme. Developmental Child Welfare, Vol 1, No 1, pp41–60. ↩
-
Hertzmann, L., Target, M., Hewison, D., Casey, P., Fearon, P. and Lassri, D. (2016) Mentalizationbased therapy for parents in entrenched conflict: A random allocation feasibility study, Psychotherapy, Vol 53, No 4, pp 388-401. ↩
-
DWP (2017) Improving lives: helping workless families (publishing.service.gov.uk) ↩
-
Harold, G.T. and Sellers, R. (2018) ‘Interparental conflict and youth psychopathology: an evidence review and practice focused update’, Journal of Child Psychology and Psychiatry, Vol 59, No 4, pp 374–402 ↩
-
Not used due to data integrity issues. ↩
-
An unused question from the co-parental communication subscale was included in this scale, to make use of all available data. More detail can be found in Annexes 3.3 and 3.8. ↩
-
Morrison, D. R., & Coiro, M. J. (1999). Parental conflict and marital disruption: Do children benefit when high-conflict marriages are dissolved? Journal of Marriage and the Family, Vol 61, No 3, pp626– 637. ↩
-
Ahrons, C.R. (1981). The continuing coparental relationship between divorced spouses. American Journal of Orthopsychiatry, 51, pp415–428. ↩
-
Kramer, L., & Washo, C. A. (1993) Evaluation of a court-mandated prevention program for divorcing parents: The children first program. Family Relations, Vol 42, No 2, pp179-186. ↩
-
Not used due to data integrity issues. ↩
-
This question is from the, unused, co-parental communication subscale ↩
-
Shi Y-f, Wang Y, Cao X-y, Wang Y, Wang Y-n, Zong J-g, et al. (2012) Experience of Pleasure and Emotional Expression in Individuals with Schizotypal Personality Features. PLoS ONE 7(5): e34147. https://doi.org/10.1371/journal.pone.0034147 ↩