Heat mortality monitoring report: 2022
Updated 29 February 2024

© Crown copyright 2024
This publication is licensed under the terms of the Open Government Licence v3.0 except where otherwise stated. To view this licence, visit nationalarchives.gov.uk/doc/open-government-licence/version/3 or write to the Information Policy Team, The National Archives, Kew, London TW9 4DU, or email: psi@nationalarchives.gov.uk.
Where we have identified any third party copyright information you will need to obtain permission from the copyright holders concerned.
This publication is available at https://www.gov.uk/government/publications/heat-mortality-monitoring-reports/heat-mortality-monitoring-report-2022
The UK Health Security Agency (UKHSA) has published annual statistics on the impact of adverse heat episodes since 2016. Previous reports are available on GOV.UK (for 2020 and 2021) and the National Archives (for reports from 2016 to 2019).
This UKHSA report is the final assessment of summer 2022, following the interim analysis, which was jointly published with the Office for National Statistics (ONS).
The summer of 2022 saw the highest recorded temperature in England at 40.3°C, which prompted the first ever Level 4 Heat-Health Alert (HHA) and Red National Severe Weather Warning Service (NSWWS) Extreme Heat warnings to be issued. In addition, 2022 had the highest number of days on which an HHA was issued since the alerting system was introduced in 2004. Summer 2022 was also the joint hottest on record.
A full seasonal summary of summer 2022 is available from the Met Office.
Methods
Defining episodes of heat
As with previous years, heat episodes are defined as any day on which a Level 3 HHA was issued in at least one region or the mean central England temperature (CET) was at least 20°C. A day either side of the alert or mean temperature was also included to allow for lagged effects of temperature on mortality. Where episodes overlapped, they were counted as one episode.
Episode 1 (E1)
The first episode lasted 4 days (16 June to 19 June), during which time the East of England, South East England and London were at a Level 3 HHA.
Episode 2 (E2)
This was a prolonged period of heat which lasted 16 days (10 July to 25 July). Over this period the alert level fluctuated, but eventually all regions reached a Level 3 HHA, with all regions being escalated to the first Level 4 HHA since the alerting system was introduced, which lasted 2 days (18 and 19 July). Towards the end of this period, there were days on which there were no Level 3 HHAs in place; however, CET reached 20°C.
Episode 3 (E3)
This lasted 7 days (30 July to 5 August) in which no region was issued a Level 3 HHA, although CET reached the 20°C definition threshold.
Episode 4 (E4)
This was another relatively prolonged period of heat which lasted for 10 days (8 August to 17 August) during which time all regions in England were issued a Level 3 HHA.
Episode 5 (E5)
This late season episode of heat lasted 3 days (23 August to 25 August), during which time no HHAs were issued, despite the 20°C CET threshold temperature being reached.
As in previous years, all-cause mortality was calculated by comparing the observed number of all-cause deaths obtained from General Registry Office (GRO) (corrected for delays in registration) on the episode days with the average from the combination of the 14 non-episode days preceding and subsequent to the study period (forming a baseline level), having subtracted the estimated number of deaths attributed to coronavirus (COVID-19) on those days (defined as deaths within 28 days of a positive test).
In addition, this year’s assessment also estimates heat associated excess mortality based on the observed regional temperature-mortality relationships from 2018 to 2022. Mortality data for this advanced analysis was obtained from the ONS, with deaths with a mention of COVID-19 removed, and temperature data from the Met Office (HadUK-Grid). This analysis allows further exploration and comment on how the above-baseline excess mortality estimates compare to estimates from models that account for confounding factors. Full details on the methodology used are available.
Observed excess all-cause mortality
During summer 2022, there were an estimated 2,985 (2,258 to 3,712) all-cause excess deaths associated with 5 heat episodes, the highest number in any given year. E1 observed only a small excess in all-cause deaths which were significant in the 65 years and over group only, while during E3 and E5 no significant excess deaths were observed in any age group or region.
E2 observed an estimated 1,256 (729 to 1,784) all-cause excess deaths over the whole period, with significant all-case excess mortality observed in the 65 years and over group only and significant excess deaths occurring in the Yorkshire and Humber, West Midlands, South East England and London regions. E2 was biphasic, with an initial period of elevated temperatures, followed by a secondary surge in temperatures which resulted in the issuing of a Level 4 HHA and Red NSWWS Extreme Heat warning. While not included in the analysis or estimation of all-cause excess deaths, it is worth noting that a spike in daily COVID-19 deaths was also observed during the Level 4 period.
During E4, an estimated 1,633 (1,247 to 2,018) excess deaths occurred. Significant excess deaths were observed in the 45 to 65 years group and 65 years and over groups and with significant excess occurring in all regions except for North East England and the East Midlands.
Figure 1. Daily all-cause excess mortality in the 65 years and over age group during the Heat-Health Alerting season 2022 (1 June to 15 September) in England
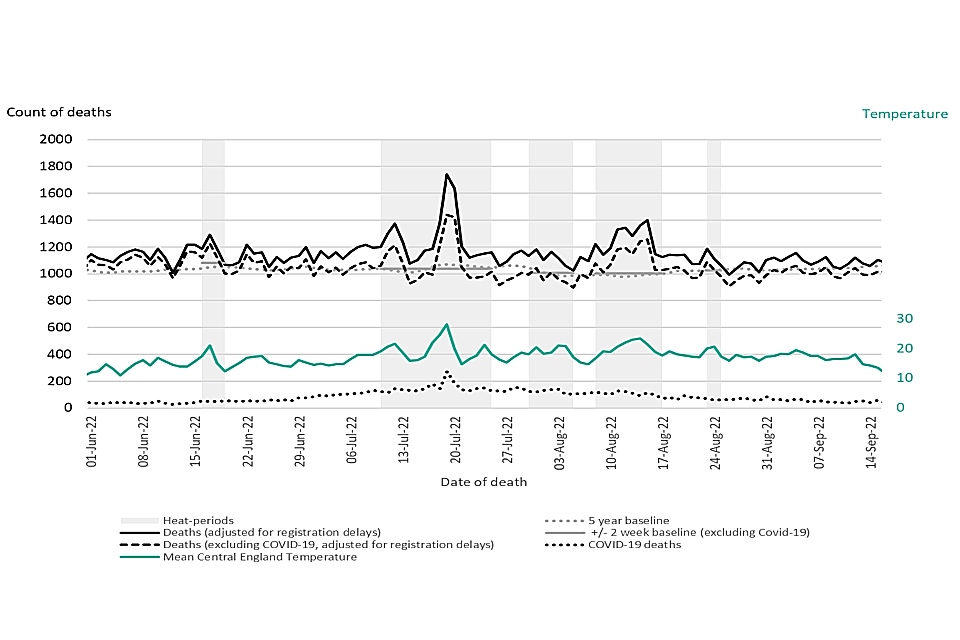
Shaded areas on Figure 1 highlight periods that meet UKHSA criteria for estimating heat excess mortality and were analysed by age and region. All other aspects of Figure 1 are described below:
- daily all-cause deaths adjusted for registration delay (solid black line)
- daily all-cause deaths adjusted for registration delay and with COVID-19 deaths removed (dashed black line)
- 5-year mean daily deaths baseline (grey dotted line)
- +/- 2 week baseline (solid grey line)
- COVID-19 deaths (dotted black line)
- mean central England temperature (solid green line)
Table 1. Estimated all-cause excess mortality by region
Estimated all-cause excess mortality by region for each individual heat period and total cumulative excess mortality across all heat periods. Statistically significant values are indicated by an asterisk (*) and 95% confidence intervals are in brackets.
| Heat period | 16 to 19 June | 10 to 25 July | 30 July to 5 August | 8 to 17 August | 23 to 25 August | Total |
|---|---|---|---|---|---|---|
| North East | 1 (-49-52) | 8 (-119-135) | -5 (-80-71) | -37 (-125-52) | 15 (-29-58) | -17 (-189-155) |
| North West | 38 (-43-119) | 30 (-167-227) | -6 (-124-112) | 304 (156-452)* | 20 (-49-89) | 386 (112-661)* |
| Yorkshire and the Humber | -21 (-88-47) | 236 (63-409)* | 20 (-80-120) | 137 (15-258)* | 18 (-40-76) | 391 (156-625)* |
| West Midlands | 35 (-38-107) | 193 (17-369)* | 10 (-97-116) | 209 (78-339)* | -17 (-76-41) | 429 (184-674)* |
| East Midlands | 14 (-45-73) | 96 (-48-239) | -54 (-138-30) | 70 (-32-172) | 25 (-24-75) | 152 (-45-348) |
| East of England | 20 (-42-82) | 144 (-10-298) | 26 (-64-116) | 188 (76-301)* | 0 (-52-52) | 378 (166-590)* |
| South East | 58 (-37-154) | 270 (33-507)* | -82 (-221-57) | 324 (152-497)* | -34 (-112-44) | 536 (211-862)* |
| London | 38 (-30-107) | 184 (19-349)* | 1 (-96-99) | 174 (53-295)* | -11 (-67-45) | 387 (158-615)* |
| South West | -2 (-74-70) | 101 (-78-281) | -57 (-163-50) | 243 (108-377)* | 49 (-15-114) | 335 (85-585)* |
Please note, the overall column and row totals in Table 1 may not align due to rounding of mortality estimates.
Table 2. Estimated all-cause excess mortality for each individual heat period
Estimated all-cause excess mortality for each individual heat period and total cumulative excess mortality across all heat periods by age group. Statistically significant values are indicated by an asterisk (*) and 95% confidence intervals are in brackets.
| Heat period | 16 to 19 June | 10 to 25 July | 30 July to 5 August | 8 to 17 August | 23 to 25 August | Total |
|---|---|---|---|---|---|---|
| All persons | 187 (-27-401) | 1,256 (729-1,784)* | -157 (-469-154) | 1,633 (1,247-2,018)* | 67 (-113-247) | 2,985 (2,258-3,712)* |
| 65+ | 212 (14-410)* | 1,189 (703-1,675)* | -124 (-410-162) | 1,469 (1,114-1,823)* | 93 (-73-259) | 2,839 (2,170-3,508)* |
| 0 to 24 | 16 (-7-39) | 15 (-36-65) | -6 (-38-26) | 19 (-20-58) | -9 (-26-7) | 34 (-39-106) |
| 25 to 44 | -18 (-48-12) | -18 (-97-61) | -41 (-88-7) | 6 (-54-66) | -2 (-30-25) | -72 (-182-37) |
| 45 to 64 | -24 (-97-50) | 71 (-114-255) | 12 (-99-123) | 135 (2-269)* | -13 (-76-49) | 181 (-73-434) |
| 65 to 74 | 42 (-45-129) | 104 (-108-316) | -79 (-203-46) | 260 (104-415)* | 10 (-63-82) | 337 (45-629)* |
| 75 to 84 | 67 (-50-184) | 272 (-13-557) | 15 (-154-184) | 458 (252-665)* | 2 (-95-98) | 814 (422-1,206)* |
| 85+ | 103 (-31-237) | 813 (481-1,144)* | -59 (-252-135) | 754 (512-996)* | 81 (-33-194) | 1,692 (1,236-2,149)* |
Please note, the overall column and row totals in Table 2 may not align due to rounding of mortality estimates.
Modelled excess mortality
Regional temperature-mortality associations were established using daily all-cause deaths (excluding COVID-19 deaths) which occurred in late spring and summer (May to September) between 2018 and 2022 and regional daily average temperatures. These associations were then applied to the observed temperatures during the specific heat episodes to model the number of heat associated excess deaths. This approach allows for the comparison between the number of deaths we might expect to see based on temperatures alone with what was observed during summer 2022.
When these modelled estimates were compared to the estimates using observed mortality (Table 1), there were no statistically significant differences in the England totals except for E3, where the model provided a larger estimate than was observed (Figure 2, below). The confidence intervals for the observed estimates for all episodes are very large, indicating large uncertainty. In comparison, the modelled estimates based on modelling techniques and recent observations are more constrained.
Considering only the best estimates, there is a degree of misalignment of the estimates for E2, E3, E4 and the total excess across all episodes. For example, the modelled estimate was higher for the total heat-excess deaths over summer 2022 by 904 deaths (23%) and E2 by 596 deaths (32%). Conversely, the modelled estimate for E4 was lower than observed value by 414 deaths (34%). None of these differences are statistically significant considering the confidence intervals. For E1 and E5, the estimates of both methods are comparable.
Figure 2. Comparison of total all-cause excess mortality estimates using observed deaths and modelled excess all-cause mortality by heat episode and total estimate across all episodes in England summer 2022
Black dots indicate estimate values, and lines indicate the 95% confidence intervals.

Discussion
Summer 2022 was an exceptional summer with a record temperature of 40.3°C reached in July, the first ever Level 4 HHA and record-breaking number of days on which an HHA was issued for at least one region in England. Unsurprisingly then, 2022 observed the highest heat mortality since the introduction of the Heatwave Plan for England and the HHA system in 2004 with 2,985 excess deaths observed.
The number and impact of the heat events in 2022, as well as the experience of the last 5 years, demonstrates the need for the HHA system to transition to a more flexible system which will allow more nuanced information on the potential impacts from high temperatures to be communicated. This additional information can be used at local level and feed into local risk assessments and prioritisation of resources during the response. England’s HHA system will fully transition to impact-based alerting in summer 2023.
As has been observed since the start of the COVID-19 pandemic, shifting mortality baselines and underlying patterns in mortality (for example increasing trend in COVID-19 deaths in summer months, general increased trend in cardiovascular disease deaths and more deaths occurring at home) mean analysis and interpretation of heat related excess mortality is more complex than it was pre-pandemic. Therefore, it’s important that caution is taken when interpreting these results.
Explanations for the spike observed in daily COVID-19 deaths during the Level 4 (Figure 1) remain unclear. Potentially this could indicate that the heat played a role in some of the COVID-19 deaths, and therefore the estimate provided here may be a slight underestimation. In addition, an increasing trend in COVID-19 was visible throughout the summer, which suggests that COVID-19 is not strictly a seasonal illness like the common cold and influenza, but something that will need to be considered throughout the year. The relationship between COVID-19 deaths and temperature requires more research.
For the first time, UKHSA has employed 2 methodologies to assess heat-associated excess mortality to compare the estimated mortality based on temperature with the mortality observed during the summer period. Using multiple lines of evidence to explore the impacts of high temperatures on health allows for more nuanced information to be distilled and fed into planning for future heat events. No statistically significant difference was observed overall between the estimates produced by the 2 methods.
Point estimates for 3 out of the 5 episodes and the totals were misaligned, with the observed estimate lower than modelled during the period in which the Level 4 HHA occurred, but higher during the late season period of heat. There are a number of potential reasons for the differences in the modelled and observed estimates. These include methodological differences in the 2 approaches, but it is also plausible that the enhanced response, including issuing of a Level 4/Red NSWWS warning and increased communications during prolonged hot conditions may have also contributed.
More work is required to assess the effectiveness of the HHA system and associated activities in reducing the number of heat associated excess deaths, as this has not been explored within this analysis. The methods employed by UKHSA will be developed further in the future.
During the first ever Level 4 and red extreme heat warning to be issued, there were increased communications to the public and professionals of the potential risks as part of the coordinated response that may have led to increased action. Met Office user engagement research suggests that 98% of the public took some level of action to protect themselves or their families over this period.
It is plausible that prolonged exposure of the population to higher temperatures than normal as well as clear public messaging could have resulted in subtle behaviour changes meaning that when extreme temperatures arrived, people may have already started to adapt their behaviours to prevent illness.
There is strong evidence that heat episodes in England are becoming more intense, longer and more frequent, with an associated impact on the estimated heat mortality. Therefore, it is increasingly important that organisations ensure they have heat response plans in place – aligned with recently published Adverse Weather and Health Plan – as well as longer-term adaptation strategies to mitigate the impacts across all sectors to reduce the number of avoidable deaths during adverse heat events in the coming years.