Crumbs! Understanding Data: a Dstl biscuit book
Published 6 October 2021

© Crown copyright 2021
This publication is licensed under the terms of the Open Government Licence v3.0 except where otherwise stated. To view this licence, visit nationalarchives.gov.uk/doc/open-government-licence/version/3 or write to the Information Policy Team, The National Archives, Kew, London TW9 4DU, or email: psi@nationalarchives.gov.uk.
Where we have identified any third party copyright information you will need to obtain permission from the copyright holders concerned.
This publication is available at https://www.gov.uk/government/publications/crumbs-understanding-data-a-dstl-biscuit-book/crumbs-understanding-data-a-dstl-biscuit-book
Foreword
For as long as people have been recording things data has been important, but it has not always been as appreciated as it should be. As digital technologies have developed rapidly from the middle of the last century, the amount of data accumulated is staggering. However, it has often not been treated with respect; if data were biscuits a lot of them would be broken and there’d be crumbs everywhere.
With the development of Artificial Intelligence (AI) and Data Science techniques our ability to extract information and act upon it has increased. Such advances require good quality, accessible data and this is often not the case. Part of the problem is that data is generally not considered an exciting topic and there are hidden complexities. Data is often misunderstood and undervalued.
This short guide aims to ensure data is better understood and valued – if not loved!
Glen Hart, Siân Clark, Hassan Zaidi, Ellie Hargreaves, Mike Standish, Corinne Jeffs and Stuart Mantell.
Introduction
This guide is what we call a Biscuit Book, something you can pick up and dip into with a tea and biscuit. The Biscuit Book is arranged as a series of easily digestible chunks that each cover a topic. It aims to provide the essential information, without ever being too technical.
We hope you find the Biscuit Book informative and digestible, although we do not suggest dunking it in your tea!
Defence Science and Technology Laboratory
The Defence Science and Technology Laboratory (Dstl) is one of the principal government organisations dedicated to science and technology (S&T) in the defence and security field. Dstl supplies specialist services to the Ministry of Defence, the Home Office and wider government. We work collaboratively with external partners in industry and academia worldwide, providing expert research, specialist advice and operational support.
Data is critical to Dstl. How we collect, manage, use and hold data, are areas where we continually strive to improve. Data is also critical to the nation as a whole, and Dstl recognises the need to raise awareness of its importance, and the need to treat it as a valuable asset.
You can find out more about Dstl here.
What is data?
In this book it’s worth saying that we are only dealing with data in the digital sense and are not delving into the weeds; as this is only a small book and we need to draw the line somewhere.
Data: a dictionary definition
Information, especially facts or numbers, collected to be examined and considered and used to help decision-making, or information in an electronic form that can be stored and used by a computer:
- The data was/were collected by various researchers.
- Now the data is/are being transferred from magnetic tape to hard disk.
(Definition source: Cambridge Dictionary)
One data or lots of data?
Is data plural or singular? Ah, you say, datum is singular so data must be plural, QED. So true of Latin but English is about as well-organised and well-constructed as the average Excel spreadsheet (for those who rarely, if ever, use Excel, the answer is not very). So in general usage, it can be used as singular and plural. The term ‘data’ tends to be applied to whole data sets or groups of data.
Types of data
There are lots of different ways to talk about the various data types and how to crumble the cookie. These various types and ways to talk about data makes data just plain complicated and we’re not even going right down into the weeds to talk about data types – things like integers, strings and floating point. We are going to talk about broad categories of data, which may be thought of or handled differently, and it’s still complicated!
Qualitative and quantitative
You have to have your teeth in to pronounce these with ease!
Quantitative data, as its name implies, is about data that can be clearly quantified, such as the number of people working for a company, or the day’s temperature. The first of these examples is known as discrete, as each value is distinct; you can’t really have half a person working for a company (and which half, the top half?). The latter is known as continuous because things like temperature are continuous and 20.5°C makes perfect sense.
Qualitative data is data that cannot be represented numerically. For example we might be interested in different categories of fish: cod, herring and trout, or about sizes of clothes: xxs, xs, s,m,l,xl and xxl. It can also be just plain text.
If we intend to perform statistical tests on data it is important to know whether the data is quantitative or qualitative because different tests are used.
Structured and unstructured
Another way to think about data is to consider whether the data is structured or unstructured. Actually, all data has some structure - it wouldn’t be data without some structure - so this distinction is really a computer’s view of data.
Structured data conforms to a data model, a very well defined way of organising the data that makes the data easy to search and manipulate by a computer.
Of course, because we are dealing with data, it gets more complicated in that there are many different ways of organising data in a structured way. Data held within a database such as a relational database or a graph database is structured data, as is data held in CSV files (comma-separated values). This is because the data is organised in a consistent manner that a computer can easily access.
Unstructured data is everything that is not structured, of which the most obvious is natural language (and before you say “well natural language does have some structure,” we remind you that it is unstructured from a computer’s point of view).
To help a computer extract some useful information out of unstructured data it can be tagged or marked up in some way so some elements are easily machine readable, this is known as semi-structured data.
Some data that clearly has some structure, but which is not easily searchable by a computer, is also classed as unstructured and sometimes as semi-structured. An example of such data would be a digital photograph where there is a clear structure in that the image is arranged into well-defined and orderly image cells – pixels – but a computer will find it hard to meaningfully search within it. The definition of semi-structured data can be a bit ambiguous and subjective – it’s just another demonstration of how complicated data is.
Metadata
Metadata is data that describes data. It’s really very important if you want to understand the data you want to use. We say more about metadata when we talk about documenting data later on.
And then, there’s all these other ways of thinking about data
Big data
When the term was first used, big data was really any data where there was a lot of it. Then it got complicated. So we have a separate section further on.
Geospatial data
The rather grandly titled geospatial data is any data that contains locational information. Location can be expressed in terms of coordinates or textual references such as postal addresses.
Geospatial data is sometimes known as geographic information.
Whatever you call it, it has added layers of complication compared to many non-geospatial datasets. We won’t bore you with too much detail on why it’s more complicated but give you just a quick example.
Much geospatial data will contain coordinates that locate where things are, but there are lots of different coordinate systems – latitude and longitude being just one and converting between them can be very complicated.
Temporal data
Just as geospatial data is organised around the notion of location, so temporal data is that which has a date or time component – no surprises there.
One form of temporal data is longitudinal data that is collected from the same people or process over time. Such data is useful for looking for and tracking trends.
There are lots of datasets and types that can be described as temporal, though often that is not how we think of it. The temporal element of data may not be the most important element, but for some data sets it will be, such as an event log.
Dates and times are generally messy as there are many different ways of expressing them – think of all the different ways a date can be written. It’s quite complicated even before you start to think about time zones, leap years and other time-related peculiarities.
Real-time data and streaming data
This is data generated as something occurs or in continuous streams. It can (but doesn’t have to) be processed as the data is generated. Examples of streaming data include sensor data associated with a car’s engine and live video.
Relational data
Relational data is held in a relational database. As explanations go, this may not be the most helpful. A relational database holds data in a series of tables where the tables are linked through relationships.
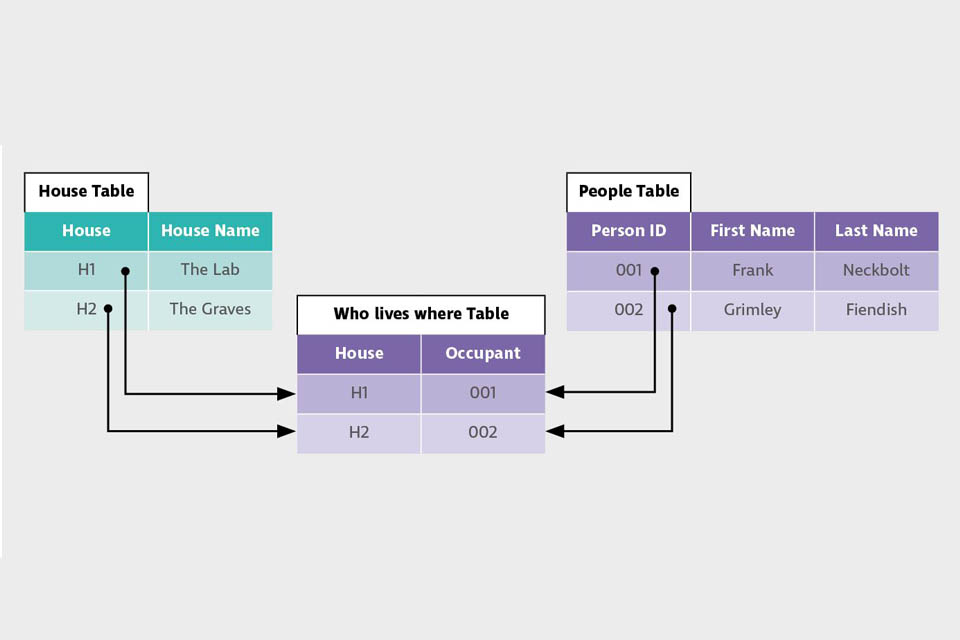
Three tables, each holding specific data, are shown. They can be related to each other through shared identifiers or keys.
Relational data is therefore well structured and thus easy to search using a standardised Structured Query Language called SQL (usually pronounced “sequel”). However, its design is inflexible. Changing the design can be difficult and costly.
We could go on. In fact, we will…
Tidy data
Tidy data is a set of simple rules that enable tabular data (often held in spreadsheets) to be organised in a way that makes analysis easier.
One problem with spreadsheets is that they give the user a lot a freedom, including freedom to do things badly. Without guidance plenty of people take up the “do things badly” challenge. The tidy data rules reduce the scope for doing things badly (although plenty of other opportunities will still exist).
So what are the rules?
- Each variable must have its own column;
- Each observation must have its own row;
- Each value must have its own cell.
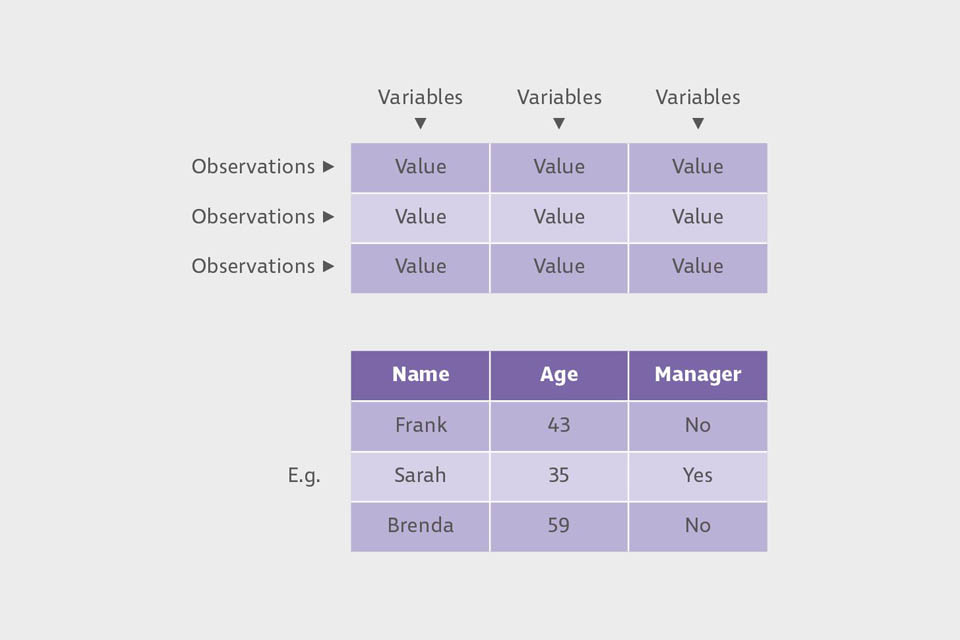
Two tables providing a simple demonstration of how data can be organised in a tidy way.
That’s it! Easy really. For those people with experience of using relational databases these are most of the rules that are used for structuring tables within such databases, too.
Linked data
Linked data is organised as a series of “triples” linked together.
A triple has the form: subject-predicate-object, examples being “Jo (subject) is the mother of (predicate) Fred (object)”.
Another triple could tell us a little more about Fred: “Fred likes Oasis”.
All these are interlinked (see what we did there) triples that form a network (also known as a graph).
The advantage of linked data is that all the relationships, expressed as links through the predicates, are explicit. It is also a very flexible form of data since it’s very easy to add new data of any kind.
The big disadvantage is that the data tends to be much more voluminous than other forms of data. However, its flexibility makes it ideal for reuse by others.
Open data
Open Data is freely available to use and pass on without having to worry about copyright, other licensing restrictions or privacy. Well, this isn’t strictly true as there may be some restrictions such as the requirement to properly recognise the originators.
This makes it very easy to access, though doesn’t indicate how good the data is to use.
It’s also worth noting that open data isn’t always completely open and may come with terms attached, such as ‘free to use for non-commercial purposes’.
Dark data
Although you might have visions of illegal data being traded in shady fog-filled alleys in the more squalid corners of the Web, dark data is in fact the belly button fluff of the data world.
Dark data is data that is collected (often unknowingly) and just sits there doing nothing. Most often, it comprises lots of computer related data such as error logs, but really it can be any data that is collected and never analysed.
High-dimensional data
Dimensions in data reflect the number of attributes or values that are collected about a certain thing. An example is that we could record a number of things about a person: their name, age, height, address and so on. Each of these attributes is a dimension.
High-dimension data is simply data that has a very high number of dimensions, sometimes a ridiculously high number. There isn’t a magic number whereby going over it and you move from normal to high-dimensional data – it’s more a case of if you feel you can no longer cope, you’ve probably got high-dimensional data.
Self-describing data
This is data that contains within it the ability to identify the nature of the data fields, such that they can be interpreted automatically by a computer.
One example of such data is JSON (JavaScript Object Notation – don’t worry what that means!), a standard data format that enables a value to be associated with a data type (such as integer or floating point) and values to be grouped together to form a record.
This type of description is limited in that it still does not say exactly what the value means in a machine-interpretable way.
Safety-critical data
This is data where the consequences of it being wrong, or not there at all, can have serious repercussions to life and limb. There is more on safety-critical data later in the Biscuit Book.
Synthetic data
The pedant could argue that all data is synthetic as it is made directly, or indirectly by people. We’ll side step that one as we didn’t come up with the term and instead we will explain what it means in popular use.
Although we are all told that the World is now awash with data, and so it is, that doesn’t mean the data is usable or available for your needs.
Synthetic data is data that tries to replicate the data you would have used if you could. So it’s not the same as having the real data but it might still give you reasonable results.
One area where synthetic data is useful is if your data is sensitive in some way, perhaps holding personal information when anonymising the data won’t work.
But, (and this is a big but) if you don’t really understand the characteristics of your real data, you will not be able to accurately emulate it with synthetic data.
Troubles with data
Not all data is good data: it has a dark side. Data can be bad, or bad in some circumstances and good in others.
Ever taken a first bite of a delicious chocolate chip cookie, only to realise the horrible betrayal when it turns out to be raisins? You can have a similar experience with data, although we’re not suggesting you try to eat it. The point is you needed one thing but what you got didn’t meet your need.
There are certain aspects of a dataset which one simply must take ownership of. Just like the shopper is responsible for making sure you pick chocolate over raisin, or that the cookies are within date, the analyst should always check the dataset against common issues that arise, such as missing values, type, errors etc.
This does not make data bad, rather the data may be used inappropriately. This in itself is an important observation – you really need to be sure the data you use is appropriate for your purpose.
It may be hard to establish if the data documentation is poor or simply doesn’t exist. Bad documentation is as bad as bad data – you checked the packet, it said choc chip but you got raisins! It can also have serious implications – what if you are allergic to raisins?
Recently, there was a state-of-the-art AI model (an AI program if you like) which can take any picture of a person’s face, and convert it into a painting in the style of a famous historical artist from the Renaissance. The data used to train the model comprised of a collection of Renaissance portraits.
The results were incredible. Take a face, and out comes a brilliant picture as if it was an oil painting from the Renaissance, except… if the person in the picture was smiling, the oil paintings had glaring gaps where the teeth should be. Somewhat amusing. It was a result of the fact that Renaissance paintings rarely show people smiling so the AI had no idea about teeth! The data used was not sufficient to enable smiles. The first raisin among choc chips.
In this case the dataset was carefully curated, built accordingly, and processed properly. Yet there were unintentional adverse consequences from the fact the data was biased (more on bias later).
The lesson is, that no matter how well a dataset is tested against standard measures, there may be something inherently skewed in some aspect of the data, in this case a lack of teeth. The importance therefore is to understand the problem area and test rigorously any inferences being made on the data.
Bad data
There are of course times when the data is genuinely bad. This can show itself in a number of different ways. The most common are:
Missing data
This can manifest itself in 2 ways: individual values or whole records can be missing (there is a third case when entire datasets can go AWOL, but these are usually easier to spot).
In the former case (individual values) this can appear as null values, a default value, which is typically zero. Such absences have resulted in an awful lot of things being located off the coast of Ghana in the Atlantic Ocean because the longitudinal and latitudinal coordinates are absent and default to (0,0). We’ve not been there, but satellite imagery shows a lot of water and nothing else.
In other cases there may be entire records missing. Take data being recorded from an engine’s sensors to measure engine performance, where, for a period, a sensor loses power and two minutes of data is not recorded. It could appear that the engine was not working for this time, because of the lack of data.
Some datasets may have deliberately lost records, potentially to remove sensitive data such as classified data or personal data. You need to be aware of this to make a judgement on whether the data is still suitable for your use.
Incorrect values
This can occur when, for example, height is entered as metres but should have been in feet. Issues like this have resulted in a Mars spacecraft crashing, and people being classified as obese as they appear to be only 6.2cm tall and therefore are called early for a COVID vaccination.
There are of course many different ways values can be just plain wrong, especially, if they are entered by people. The difficulty is spotting them. This may be easier if the bad values are obviously wrong and out of range – for example a person’s weight being recorded as 6000kg - but much harder if they could be valid: 80kg rather than 60kg.
Inconsistencies
Where the data recorded is either inconsistent with itself, inconsistent over time or inconsistent with other data.
In the first instance we might have records that due to a data entry problem, show that someone is their own parent.
In another example, a dataset might have been recording temperature in Fahrenheit, which is switched to recording in Celsius. All records before the date of the switch will, therefore, be incompatible with those after the switch and you need to be aware of this to adjust the values.
Incomplete dataset
Incomplete datasets have chunks that are missing. This could be when a sensor has failed and no data is available after the failure, or where the data has been truncated accidentally in processing or for any other reason. The point is, that the data won’t cover the whole range that you need it to.
Poisoning data
It’s bad enough to have data that is just naturally bad, but what if an adversary deliberately corrupts the data? In AI and Data Science this is known as data poisoning.
Now, what if someone in a villainous mood, had access to the dataset of stop signs, speed limits and photos of pedestrians used by the AI in a driverless car, so they labelled the speed signs as stop signs or stop signs as pedestrians. A funny joke, no harm, right? However, cars will now speed through junctions, crash into other cars and endanger lives. Preventing this means regular testing and checking that the outcomes are as expected.
Given that good data is hard to come by, how about creating your own perfect data? But we’re not talking about good synthetic data, we’re talking about data created to tell the story you want. A psychologist at Harvard University fabricated data in 6 government-funded studies to get the results they wanted. Another senior academic lied and manipulated data in 58 publications.
It’s healthy to have a critical view on results and findings, especially if it seems too good to be true. If you can, always go back to the data, and check that it is real!
Bias in data
Just when you’ve got to grips with bad data, even good data has one last card to play: it’s called bias. All data is biased in one way or another; the important thing is to understand what those biases are and whether they are relevant to what you are trying to achieve.
Bias within data works in a very similar way to how we would perceive bias in everyday life. The bias creates a misunderstanding in the data you’re looking at, often impacting a specific group or category in either a positive, or negative way.
Understanding if any bias has crept into your data is vitally important, as without these checks you could be reinforcing negative prejudices, or creating decisions – expecting one result but getting another.
Types of bias
Confirmation bias
Confirmation bias occurs when someone introduces a preconceived idea or notion into the analysis. Usually, confirmation bias happens at the point someone is interpreting the data; instead of taking a fresh view they’re likely to put more emphasis on the information that supports their idea. This is also known as p-hacking or hypothesis hacking.
One way to mitigate against this is to outline a hypothesis at the beginning of the project, rather than looking for data to support your idea.
Good to know: p-hacking is not the selection of data to match your ideas, but rather it is looking at all possible combinations for a significant result so that you can report something – even if was not your initial expectation. H-hacking is when you change your hypothesis to match your findings.
Selection bias
Selection bias occurs when a piece of analysis uses an unrepresentative sample of an entire population. For example, when sampling people’s favourite biscuits to understand the UK’s favourite biscuit, a sample in rural Scotland would have very different results to the centre of London.
Ways to mitigate against this include using random sampling and ensure the results reflect the entire population in all variables; or you can keep your smaller sample, but state the findings only reflect that subset of the population.
Outlier bias
This is when an outlier, an extreme data point, skews the rest of the dataset. This is particularly relevant when taking averages.
This problem appears a lot in financial analysis. If someone wanted to know the average salary of someone in the US, the average calculation would be heavily skewed by the number of billionaires. In this case it would be better to use a different statistical summary, like the median.
When exploring a dataset always make sure you note any outliers and then pick the most accurate statistical summaries when looking to answer a question. You may decide to remove the outliers if you believe they are not representative or reflect an error in data collection.
Survivor bias
Survivor bias appears when analysis only takes into consideration the ‘survivors’. This is similar to selection bias in that only a sub-set of the population is being considered. Survivor bias is a type of selection bias.
The most famous example is from World War Two. The US military asked a mathematician, Abraham Wald, what the best way to protect an aeroplane from being shot down was. Initially the analysis looked at those planes that had come back from war analysing the worst hit areas and looking to add more armour. This is survivor bias.
Abraham realised their mistake: the planes that returned didn’t need extra armour, as even after being shot, they’d still returned. In fact it was the planes that didn’t return that were most important to this analysis; the areas that were shot meant the aircraft did not return. Those were the areas that needed extra protection.
Data wrangling
Data wrangling (sometimes known as data processing) is, in essence, the idea of taking messy and unclean data and going through a number of cleansing and transformative processes to achieve a desired insight or visual.
Wrangling data is often the activity an analyst will spend the most time on. It improves the data and opens up many doors to gathering insights from your data. It’s easy to underestimate the amount of time it takes, as it is often a voyage of discovery. You fix one part of the dataset only to find this makes problems in another part more obvious.
| Type | Description | An Example |
|---|---|---|
| Data Structuring | Understanding your data and the structure of it. Data documentation helps here – if only someone had bothered to produce it! | What data type is each column in your dataset? |
| Data Cleaning | Tidying up any issues with your dataset and remove commonly found issues. | Address any duplication within your dataset. |
| Data Transformation | The point at which you would change the structure of your data. | Pivoting a dataset between horizontal and vertical format to make analysis easier. |
| Validating | Time to check whether your data wrangling is correct! | Checking your outputs against real life data – do your results make sense? |
| Data Conflation | Joining two or more datasets together. A small book could be written about this! | Adding person data from one dataset to another based on people’s names (this can of course go horribly wrong if more than one person shares a name!) |
Safety-critical data
We can, very broadly, define what a safety-critical system is: if it fails or malfunctions it could lead to an unacceptable consequence such as death or serious injury, loss or severe damage to equipment or property, or environmental harm. All bad things. Examples of such systems include engine control systems and railway signalling.
Safety-critical data is data which, if incorrect or used incorrectly, can result in bad things happening.
Data’s contribution to safety
Traditionally, data has been used to configure a system, for example setting engine parameters. (We define ‘data’ within this context in keeping with that of the Data Safety Initiative Working Group, that is ‘data’ having multiple diverse categories such as requirements, staffing/training data, compiled software, and so on.)
This is still very much the case - but things are changing. Data is now key to the decisions that systems (and people) make on an ongoing basis and so the scope for things to go wrong due to bad data is now much bigger. The amount of data is also growing, although not necessarily the accuracy of the data. Data doesn’t do anything, so it can only indirectly cause harm by being wrong or being misused.
Understanding the properties of data is necessary to establish which aspects of the data need to be guaranteed for a system to operate safely.
There also needs to be consideration of the context of the system (e.g. medical devices) and how the data is used within the system.
Examples of data properties include (but are not limited to):
- integrity (data is correct, true, and unaltered)
- accuracy (sufficient detail)
- fidelity (extent to which data represents the real world)
- verifiability (properties demonstrated to be correct)
Note that in statistics this accuracy would be referred to as ‘precision’ with ‘accuracy’ used to describe what we term here as ‘fidelity’.
It should also be noted that the data properties presented here are just 4 of the 20 mentioned in the Data Safety Guidance. You’ll need to read the guide to fully appreciate the nuances of the definitions in totality.
Data safety failures are all too common!
Unfortunately, there are many examples where things have gone wrong. Here are just 2:
Case 1
Two Boeing 737 MAX 8 accidents in 2018 and 2019 resulted in nearly 350 lives being lost.
In each accident a single sensor failed (2 sensors were available but the design only read one) and this resulted in incorrect data being reported to an augmentation system. This led to the augmentation system repeatedly initiating the aircraft into forced erroneous manoeuvres. The data did not adhere to the properties of integrity, accuracy, and fidelity.
Case 2
In a second case, a drugs trial gave 2 participants 100 times the intended dosage of caffeine. This resulted in them both being admitted to intensive care, although fortunately they survived. The participants’ heights and weights were recorded correctly but it was during calculations of how much caffeine should be provided per body mass kilo that a mistake with the mathematics was made – a decimal point was put in the wrong place. Integrity and verifiability data properties were not upheld.
These 2 examples illustrate the importance of data safety in systems which span from supposedly ‘simple’ to ‘complicated’ and where the data can lead to significant and fatal outcomes. When it comes to data safety nothing can be taken for granted.
The outlook
A key point to note is that data safety should be a key consideration within any system which relies on data (especially those that are deemed safety-critical) – however, it is only by understanding how the data is used in practise within a system can you understand the associated risks. Easier said (or typed!) than done!
Positively, the maturity of the processes to consider such data safety risks is growing with more and more domains (such as defence, health and rail) becoming ‘data safety aware’.
The important thing about safety-critical data is that it must be right and used correctly. Whatever checks you would normally do, you do them in spades. It is self-evident, but it can’t be said enough as the criticality of the data might not be immediately apparent.
What makes data ‘big data’?
We are in a world where almost every organisation seems to be involved in using data for analytics. Deriving new information and then using this information for a competitive edge over the rest of the market. Boardrooms worldwide have drawn on the notion that, with more data, they can derive more information through analytics, and ultimately get more of an edge over rivals. If they have a really large amount of data, it becomes big data and is thus more important and valuable.
Ah, the age old question – is size the only thing that counts!? Big data has often been referred to as requiring ‘three Vs’ or combinations thereof: volume (the amount of data), variety (number of types of data) and velocity (speed of data processing).
Through all of this we are left wondering, what is this ‘big data’ thing? What does it really mean? And is it really important? Furthermore, is having big data all that matters, or is it what you do with it? Could you have big data, but by not exploiting it adequately, it stops being ‘big’?
Imagine you decide to perform a multi-phrase query on a 100 petabyte (1PB is 1000TB) database with over 30 trillion rows. You’d probably say that yes, this is big data, and the query counts as ‘big data analytics’. However, what you could actually be doing is just running a Google search for “Why isn’t 11 pronounced Onety One?” while drinking tea. So why don’t we count running a Google search as using big data and performing big data analytics? (We’ll leave you to find out why it’s not onety one.)
Or, imagine having 100TB of genetic sequences for a rare medical condition. This would be valuable data, which companies would like to get hold of. The data is hard to come by, potentially unlocking medical breakthroughs and business opportunities. They would say that they are applying big data analytics, to their big data. Is it the 100TB that makes it big data, or is it the perceived value from data of that size?
Furthermore, what about the actual calculations being done, if you have a trillion rows of two columns, A and B, and the analysis being done is simply to add the two numbers together to give a new column C, are these calculations still big data and big data analytics? Or is running an advanced artificial intelligence model on 1,000 medical images which takes hours for a single image to compute count as big data?
It is always worth questioning and reviewing data. If the term big data is used, an easy and relevant point is to ask why; what do the users think constitutes big, and whether you’d agree those qualities actually exist for the dataset.
Fundamentally, the idea of big data is ill-defined – as you may well have worked out by now. It is used less often now people talk more about AI, data science or machine-learning. The big data balloon may be slowly deflating but it is a term you will still hear. Our view is that it is best to avoid the term, as it doesn’t really add anything to a description and comes with a lot of baggage and erroneous connotations. It is very much a catchphrase, a way people can say, “we can do it too”.
Documentation
Every dataset should be accompanied with documentation. If you’ve never seen or heard of data documentation, you won’t be alone. Data documentation can often be overlooked and is seen as time consuming – often an afterthought, but it shouldn’t be, it’s very important.
Metadata and data
To make life a little bit more confusing, we’ll talk about metadata. Metadata is data about your data – starting to feel like Inception?
Let’s walk through an example, to see if we can make sense of metadata. Let’s say it’s your best friend’s birthday and you want to treat them to their favourite chocolate, one that you both got in Paris that time. When you’re looking to buy that exact chocolate you want proof that it’s from the exact chocolate store or supplier (we call the origin of the chocolate its provenance). And you might wish to check it’s made with the same ingredients, in the same proportions (a little obsessive I know but this is chocolate); you’ll look for information to evidence that. If the chocolate was data all that information is metadata.
There are different types of metadata and a lot of it may be specific to the datasets you’re labelling, some basic information could be:
- Metadata
- Title
- Description
- Data owners/provenance
- Classification
- Usage rights
- Methodology
- Keywords/tags
- Time stamp
- Quality statements
- References
Instead of having to go into each dataset, rummage around for a while and then realise it’s not what you need, you could instead check the metadata. Metadata is beneficial, but becomes even more powerful when combined with other documentation methods.
Data dictionaries
Data dictionaries are specific to each dataset. The aim is to take each field within the dataset and describe it using a range of fields such as:
- Field name
- Data type (such as integer, character string, and so on)
- Value / range
- Meaning
- Usage
- Classification
- Comments
An analyst can use a data dictionary to setup checks that will highlight any unexpected changes, such as errors from human input. A data dictionary can also highlight which fields to use to join datasets together, this is incredibly useful when you’re building complex data systems.
Tagging data files
The modern age has brought about the idea of tagging, most prominently the #s we use in social media. Hashtags assign the social media post to a particular group, so if you looked up the group you would find the post. This is the exact same concept with tagging data files, a function that is available in most operating systems.
For example, if you had a dataset that contained information on the prices of biscuits in the UK, you might want to tag: #biscuits #finances #UK. This way a quick search for any of those hashtags will flag this dataset, alongside any other relevant datasets.
Data management
A business could have all their datasets properly documented, with good accessibility processes, and strong best practice for analytical pipelines, but there is one factor we haven’t considered yet: data management. Good data management streamlines processes, whilst bad data management can lead to serious failings.
Poor data management can happen at every level. The individual may mismanage an Excel spreadsheet, perhaps overwriting the latest version with an older one, and a large organisation may systematically corrupt corporate records following a mismanaged system upgrade. In fact the way data can be mismanaged is limitless and a credit to the imagination of the human race to make terrible mistakes.
The scope of data management covers the following areas:
| Data management | Description |
|---|---|
| Data architecture | Data architecture is the first step in data management and is constructed by a data architect. This element results in a data management plan for a company or goal. |
| Data models | There are numerous types of data models but at their core, they all look to define how to link datasets within your data storage. |
| Databases | A storage system for datasets from one source. Works best with business data and real-time applications. |
| Data warehouses | A centralised storage system for datasets from multiple sources, again best for business data. Data warehouses build a historical view for extra insights over time (consider it the big brother of databases). |
| Data lakes | A centralised repository for multiple datasets from any source, where data can be both structured and unstructured. Data lakes work really well for big data and raw data. They encourage machine learning and predictive analysis techniques. |
| Data governance | Data governance is the process outlined by a business to police their data. |
Wrapping up
We hope all that is left of your tea and biscuits is a few crumbs. Data is more often than not very messy, which is why “crumbs” is used in the title.
In this Biscuit Book we have highlighted this messy nature, given you an overview of the many different ways data can be viewed and the common pitfalls. Mostly, we have tried to emphasise the importance of being careful about data. You need to beware the dataset you’ve just been given and make sure you understand it and all its pitfalls before you decide to use. We also hope that you will take every care to make your own data yummy not crummy, through careful design, documentation, collection and management.