Universal Credit statistics, 29 April 2013 to 14 January 2021
Published 23 February 2021
Applies to England, Scotland and Wales

© Crown copyright 2021
This publication is licensed under the terms of the Open Government Licence v3.0 except where otherwise stated. To view this licence, visit nationalarchives.gov.uk/doc/open-government-licence/version/3 or write to the Information Policy Team, The National Archives, Kew, London TW9 4DU, or email: psi@nationalarchives.gov.uk.
Where we have identified any third party copyright information you will need to obtain permission from the copyright holders concerned.
This publication is available at https://www.gov.uk/government/statistics/universal-credit-statistics-29-april-2013-to-14-january-2021/universal-credit-statistics-29-april-2013-to-14-january-2021
The latest release of these statistics can be found in the Universal Credit statistics collection.
These statistics show:
- people on Universal Credit up to 14 January 2021 (until the next monthly release on 23 March 2021)
- claims made and starts up to 14 January 2021 (until the next quarterly release on 18 May 2021)
- households including payments for Universal Credit up to 12 November 2020 (until the next quarterly release on 18 May 2021)
For the latest statistics after these dates, follow the links on the Universal Credit statistics collection page.
This bulletin contains statistics on claims made, starts, and people on Universal Credit and households including payments for Universal Credit for England, Scotland and Wales (Great Britain). Other Universal Credit statistics are available for sanctions, the benefit cap and Northern Ireland.
Status
Universal Credit statistics are official statistics that are experimental. This is due to the ongoing development of the data systems that are used to support Universal Credit.
Guidance
Guidance on these statistics is available in the background information and methodology document. Information on the timeliness of the statistics is provided in the background quality report.
New statistics in households on Universal Credit
From this release, the households on Universal Credit series includes new measures on:
- households on Universal Credit affected by Removal of Spare Room Subsidy
- whether local housing allowance covers the rent and broad rental market areas
Additionally, the limited capability for work (LCW) entitlement has been expanded. It now includes a breakdown of households where at least one member of the household is in receipt of the higher limited capability for work and work related activity (LCWRA) allowance. This additional breakdown only shows households with a LCW payment entitlement in their award and does not measure households or individuals assessed as having limited capability for work.
Statistics for the new measures for Removal of Spare Room Subsidy and Local Housing Allowance can be found in separate ODS tables accompanying this release. Methodology for all the new measures is included in the background information and methodology document.
1. Data tools accompanying this release
This bulletin presents commentary on the latest Universal Credit statistics. Alternative ways to view Universal Credit statistics are available:
- Stat-Xplore allows users to explore Universal Credit data and build their own tables – it also contains some ready-made tables
- Universal Credit claimants at Jobcentre Plus office level in an interactive map
- Households on Universal Credit at local authority level in an interactive map
- An interactive dashboard of the latest Universal Credit household statistics by region
2. Main stories
The headline statistics for Universal Credit are:
- 6.0 million people on Universal Credit at 14 January 2021. This is a 98% increase since 12 March 2020
- 4.9 million households on Universal Credit for monthly assessment periods covering the 12 November 2020, of which 85% (4.2 million) received a payment
- 91% of new claims and 97% of all claims received their payment in full and on time for the assessment period covering 8 October 2020, compared with 86% and 95% respectively in March 2020
- 4.5 million claims made for Universal Credit between 13 March 2020 and 14 January 2021
- 4.3 million starts to Universal Credit between 13 March 2020 and 14 January 2021
3. Things you need to know
What is Universal Credit?
Universal Credit is a single payment for each household to help with living costs for those on a low income or out of work. It is replacing 6 benefits, commonly referred to as the legacy benefits.
Support for housing costs, children and childcare costs are integrated into Universal Credit. It also provides additions for people with a disability, health condition, or caring responsibilities which may prevent them from working.
Universal Credit has been rolled out in stages:
- March 2013 to December 2017: Universal Credit was available to new claimants in a limited group, mostly to 18 to 60 year old single people with no children, unemployed (typically people who would have claimed income-related Jobseeker’s Allowance) where the Universal Credit live service was available. If their circumstances changed, they could remain on Universal Credit
- May 2016 to December 2018: Gradual roll out of Universal Credit full service. Where available, Universal Credit is available to new claims and people on legacy benefits whose circumstances change
- December 2018: Universal Credit full service is available in every area of Great Britain
Read the background information and methodology document for a more detailed timeline.
Data sources and limitations
These official statistics have been compiled using data in systems used by the department in the administration of Universal Credit and records of Universal Credit benefit payments made by the department.
While every effort is made to collect data to the highest quality, as with all administrative data it is dependent on the accuracy of information entered into the system. Checks are made throughout the process from collection of the data to producing the statistics, but some data entry or processing errors may filter through to the data used to produce the statistics. For more information on the quality of the administrative data, refer to the background quality report and quality assurance of administrative data.
As Universal Credit continues to develop, caution should be used when interpreting statistics over long time periods. Administrative system changes could cause discontinuities in the time series that were not the result of a policy decision or the economic environment.
There are inherent differences in the data for People on Universal Credit and Households on Universal Credit, thus it is not possible to cross-tabulate between the two measures. More information is provided in the relationship between people and households on Universal Credit section of these differences between the 2 datasets.
A full discussion of strengths and limitations is in the background information and methodology
Count date
Statistics for people on Universal Credit are based on the count of people on the second Thursday of each month, referred to as the count date. This date is determined by the date used for the Claimant Count which some of these data feed into. For this publication the latest count date is the 14 January 2021.
Claims and starts are based on the total flow between the day after the count date for the previous month up to the count date.
Household statistics are based on the assessment periods that overlap the count date. A longer time period is required before publishing statistics for households than statistics for people, claims and starts because data for payment information for households is subject to more retrospection.
The background and methodology document provides more information on the process of producing these statistics.
4. Claims made to Universal Credit
Making a claim is the first step an individual will need to do to receive Universal Credit.
There have been 4.5 million claims made to Universal Credit between 13 March 2020 and 14 January 2021.
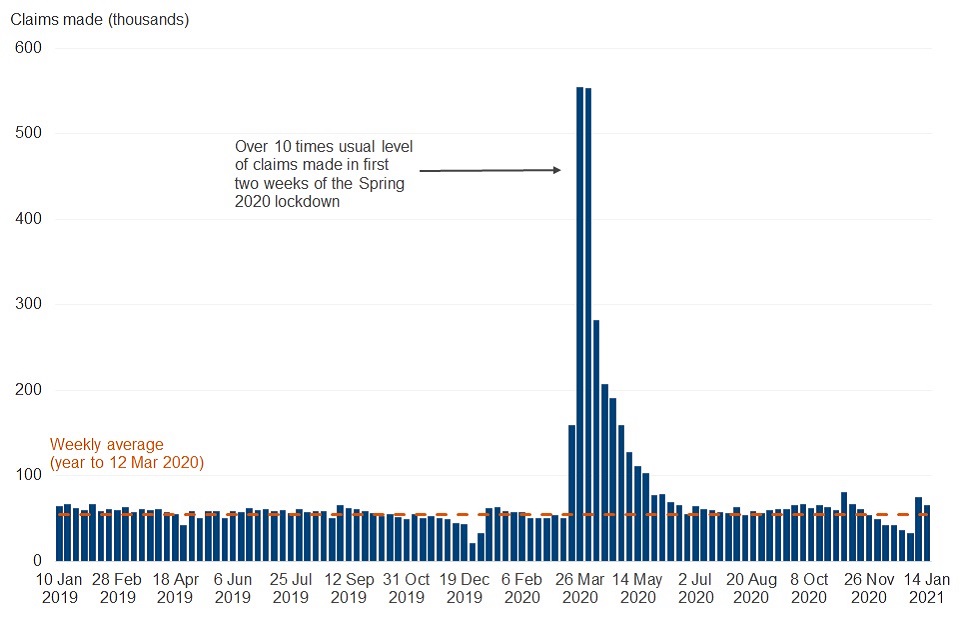
Claims made return to pre-pandemic levels following a large increase at the beginning of the coronavirus (COVID-19) pandemic
Claims made (weekly), Universal Credit, Great Britain, 10 January 2019 to 14 January 2021
Note: (p) provisional. See Stat-Xplore for the full data series.
Source: DWP Stat-Xplore, Claims on Universal Credit, weekly
Restrictions were introduced throughout the country in March 2020 as a result of the coronavirus pandemic. These led to a large increase in the number of claims for Universal Credit. In the two weeks between 20 March 2020 and 2 April 2020 there were 1.1 million claims made to Universal Credit. Each of these weeks is more than 10 times the weekly average for the year to 12 March 2020 of 54,000 claims.
In total, since the 13 March 2020 when claims to Universal Credit started to increase in response to restrictions caused by the coronavirus pandemic, there have been 4.5 million claims made to Universal Credit. This is nearly two-fifths (39%) of the 11.4 million claims made to Universal Credit since its introduction in April 2013.
Since October 2020, there have been several events and responses to the coronavirus pandemic that may have affected the number of claims made for Universal Credit. These include the original end date of the Coronavirus Job Retention Scheme, often referred to as ‘furlough’, on 31 October 2020 but which was extended to 30 April 2021. There have also been several instances of stronger local, regional and national lockdowns.
The week leading up to 5 November 2020 saw the number of claims made to Universal Credit rise to 80,000 from 59,000 the previous week, a 35% increase. This increase coincides with the original end date of ‘furlough’, and the second national lockdown in England.
Claims made to Universal Credit fell to 32,000 for the week leading up to 31 December 2020. This is a usual seasonal pattern. Claims made increased to 75,000 claims in the first week of 2021 coinciding with the start of further lockdowns in England and Scotland.
Not all claims that are made will go on to start on Universal Credit. This can be because, for example, the circumstances of some people who have made a claim may change before they start on Universal Credit, and they may close their claim before starting.
5. Starts to Universal Credit
Following making a claim, a claimant is counted as starting on Universal Credit statistics when they have agreed their commitment requirements and had their identity verified among other criteria. For the full definition of what is regarded as a start on Universal Credit refer to the background and methodology document.
There have been 4.3 million claims starting on Universal Credit since the 13 March 2020. Of these, 2.4 million were between 13 March and 14 May 2020.
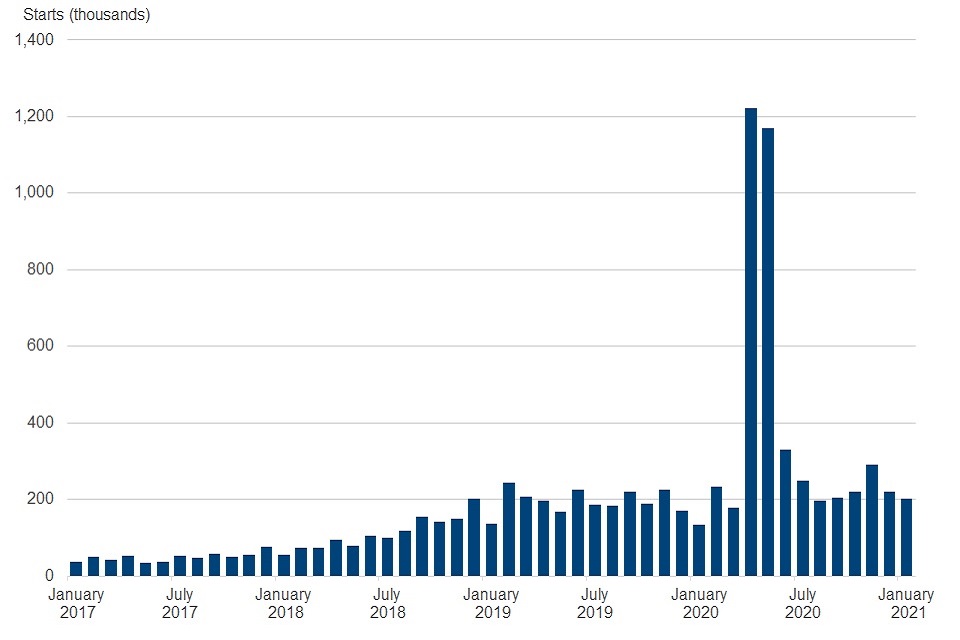
Starts return to normal levels after a high number of starts in April and May 2020
Starts on Universal Credit (monthly), Great Britain, January 2017 to January 2021
Note: (p) provisional. See Stat-Xplore for the full data series.
Source: DWP Stat-Xplore, Starts on Universal Credit, month
There were 290,000 starts to Universal Credit in the 5 weeks to 12 November 2020. This is a higher number of starts compared with July to October. In the 5 weeks to 12 November further lockdowns in England and Wales started.
There were 200,000 starts to Universal Credit in the 5 weeks to 14 January 2021, compared with 130,000 starts to Universal Credit in the 4 weeks to 9 January 2020.
The UK government made a number of changes to Universal Credit to support people through the coronavirus (COVID-19) pandemic in March 2020. These changes, together with the changes in people’s circumstances caused by the coronavirus pandemic, resulted in a large increase to the number of starts to Universal Credit between 13 March 2020 and 14 May 2020. In total between these dates there were 2.4 million starts to Universal Credit. This contributes to a total of 4.3 million claims for Universal Credit having started between 13 March 2020 and 14 January 2021.
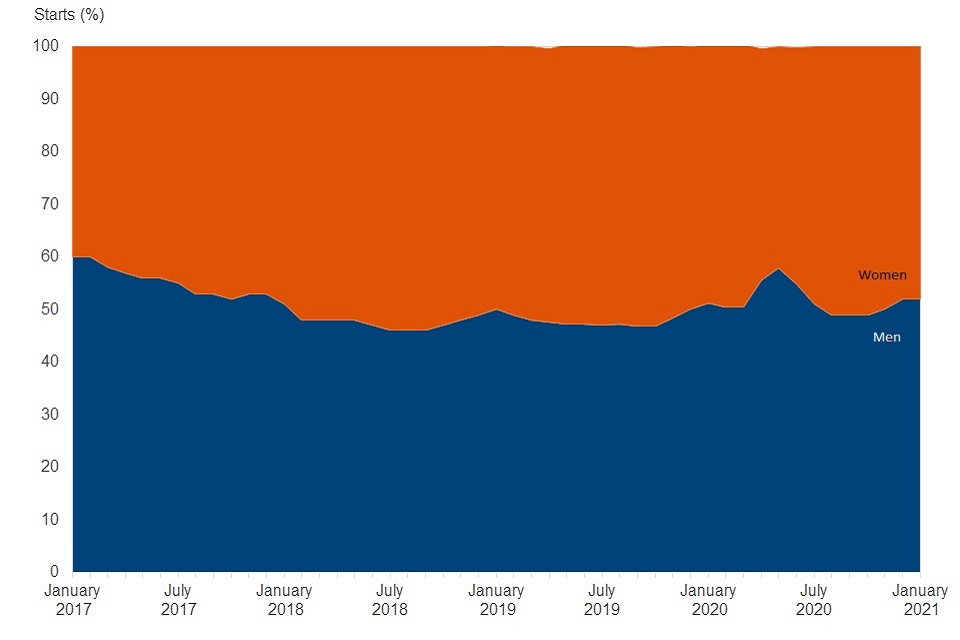
More men are starting on Universal Credit than women
Starts on Universal Credit by gender, Great Britain, January 2017 to January 2021
Note: (p) provisional. See Stat-Xplore for the full data series.
Source: DWP Stat-Xplore, Starts on Universal Credit, gender by month
Since February 2018, in general more women than men have started on Universal Credit each month. However, in the 5 weeks up to 14 January 2021, men (52%) are a higher proportion of the starts on Universal Credit than women (48%). A similar trend was observed during the first lockdown at the beginning of the coronavirus pandemic when 55% of starts were men in the 4 weeks to 9 April 2020.
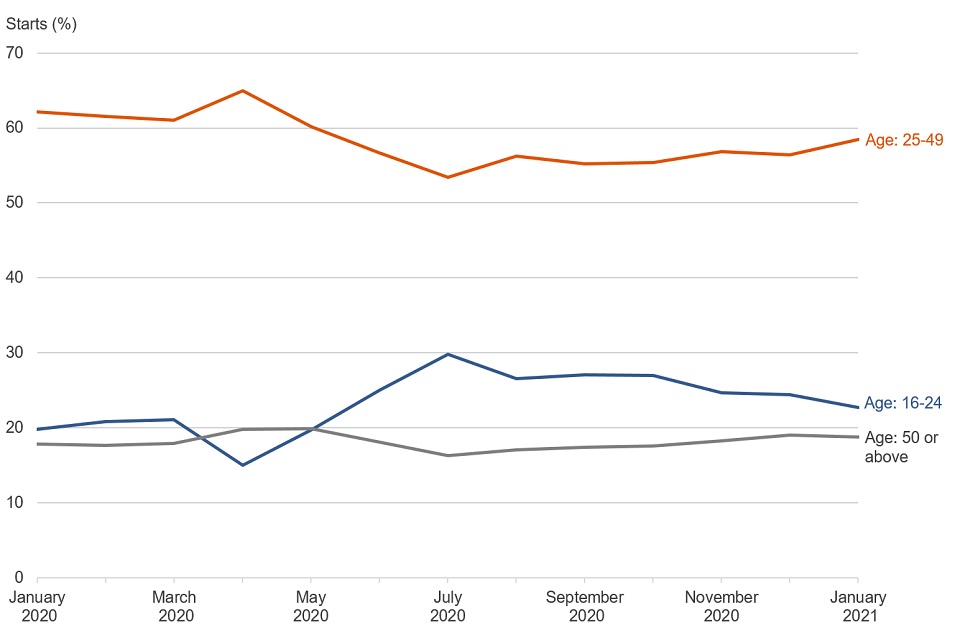
Under 25s and over 50s make up a higher proportion of starts to Universal Credit than before the coronavirus pandemic
Starts on Universal Credit by age group, Great Britain, January 2020 to January 2021
Note: (p) provisional. See Stat-Xplore for the full data series.
Source: DWP Stat-Xplore, Starts on Universal Credit, gender by month
The proportion of Universal Credit claimants who are under 25 has increased when compared to pre-pandemic levels. In the 5 weeks to 14 January 2021, the proportion of Universal Credit claimants who were aged between 16 and 24 was 22.7%, compared with 21.1% in the 4 weeks to 12 March 2020. This age range peaked in July 2020 with a proportion size of 29.8%.
This contrasts with the early stages of the coronavirus pandemic following the lockdown when the age group fell as a proportion of those starting on Universal Credit. In April 2020, claimants who were aged between 16 and 24 fell to a proportion size of 15.0%.
Claimants starting on Universal Credit who are 50 or above make up a higher proportion than before the pandemic. In the 5 weeks to 14 January 2021, the proportion of Universal Credit claimants who were aged 50 or above was 18.8%, compared with 17.9% in the 4 weeks to 12 March 2020. It had fallen to 16.3% proportion size in July 2020, coinciding with the peak in proportion size for under 25s.
6. People on Universal Credit
People on Universal Credit counts the number of people with an open claim on the count date who had accepted a claimant commitment and verified their identity. Not every person on Universal Credit on the count date will go on to receive a calculated entitlement or payment for the assessment period.
There were 6.0 million people on Universal Credit on 14 January 2021. This is a 98% increase since 12 March 2020.
Number of people on Universal Credit nearly doubles since beginning of coronavirus (COVID-19) pandemic
People on Universal Credit, Great Britain, January 2016 to January 2021
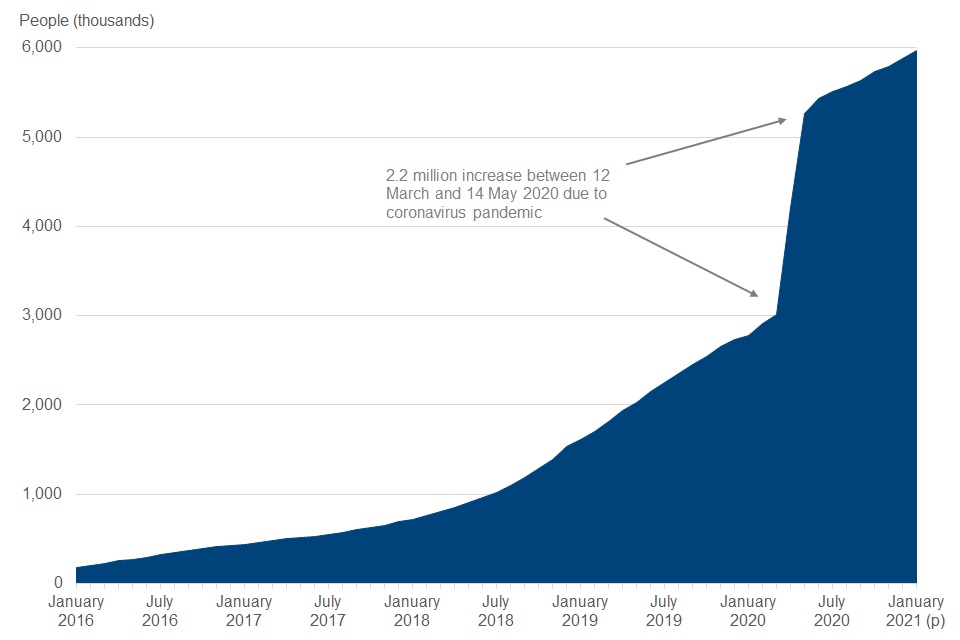
Note: (p) provisional. See Stat-Xplore for the full data series.
Source: DWP Stat-Xplore, People on Universal Credit, month
The number of people on Universal Credit was 6.0 million on 14 January 2021, up 2% from 10 December 2020. There has been a 98% (3.0 million) increase in the number of people on Universal Credit from 3 million on 12 March 2020, the last count date before the coronavirus pandemic.
The increase in the number of people on Universal Credit since 12 March 2020 should be considered in the context of:
-
changes in the level of income or employment status resulting from the coronavirus pandemic
-
changes announced to support people through the coronavirus pandemic, including a temporary £1,040 a year increase to the standard allowance and an increase to local housing allowance rates
-
a temporary policy change of £0 payment awards being open for up to 6 assessment periods of £0 awards
These are briefly explained in the following paragraphs.
A temporary £1,040 a year increase to the standard allowance for 1 year from April 2020 was introduced as part of a support package for people through the coronavirus pandemic.
Additionally, local housing allowance rates were increased to the 30th percentile of local rents from April 2020.
These changes had the effect of bringing more people with higher earnings on to Universal Credit. This is because the more Universal Credit entitlement a household has, the more earnings the household can have before their award reduces to zero by the taper rate. Consequently, there are more people in employment who are eligible for Universal Credit than without the temporary increase. The background information and methodology document has more information on the calculation of a Universal Credit award.
A temporary administrative policy change was made to £0 award claims at the beginning of the coronavirus pandemic. When a Universal Credit claim is reduced to a £0 award due to earnings being too high, the claim is normally considered to be closed. A household can “reclaim” Universal Credit if their earnings fell again within 6 months using the same details as their previous, closed, claim.
Because of the evolving nature of the coronavirus pandemic, there was a temporary change to this policy and claims reduced to £0 because earnings were too high would remain open for up to 6 assessment periods of £0 awards. This has led to a higher number of people with an open claim on Universal Credit that are not “in payment” than would otherwise be the case.
The people on Universal Credit series does not include an in payment breakdown as, at the time the data was taken to produce these statistics, awards had not been calculated for the assessment period relevant to the count date. However, as a guide, as later discussed in the households chapter, 85% of households on Universal Credit received a payment in November 2020, a decrease from 94% before the coronavirus pandemic in February 2020.
52% of people on Universal Credit are women
People on Universal Credit by gender, Great Britain, January 2016 to January 2021
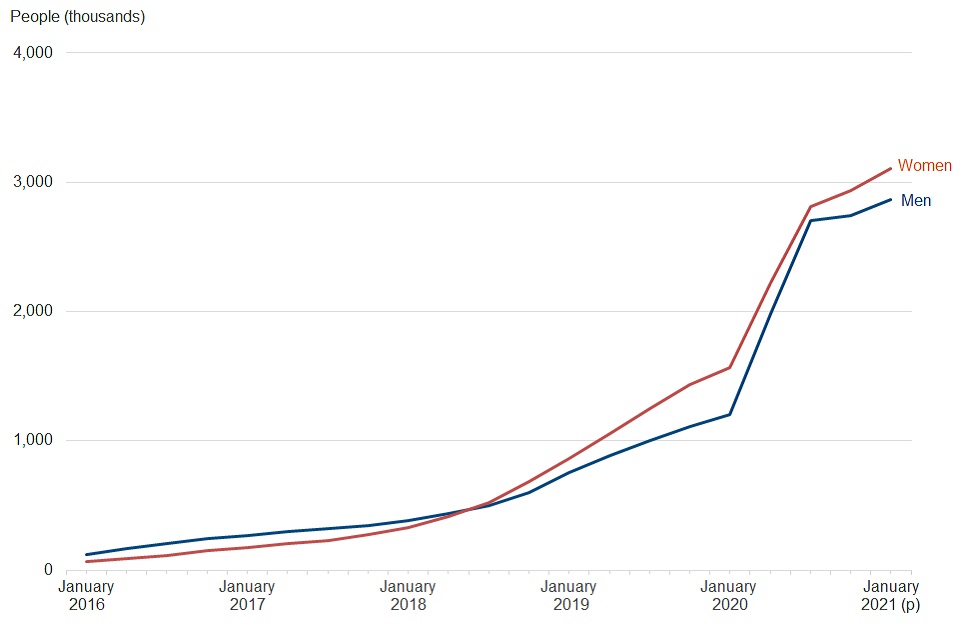
Note: (p) provisional. See Stat-Xplore for the full data series.
Source: DWP Stat-Xplore, People on Universal Credit, sex by month
Women account for 52% of people on Universal Credit on 14 January 2021. During the early months of the coronavirus pandemic more men than women were coming on to Universal Credit. This resulted in the proportion of people on Universal Credit that were men increasing to 48% by October 2020 from 44% in March 2020. Since October 2020, the proportion of Universal Credit claimants who are men has stabilised at 48%.
From the introduction of Universal Credit up until June 2018, men on Universal Credit outnumbered women on the benefit. Since June 2018, this has changed to women outnumbering men. This change is explained by Universal Credit being only available to working age individuals with no children and who were seeking employment in the initial introduction of Universal Credit. This group of people are those that would have claimed income related Jobseeker’s Allowance, which is a benefit that has been typically claimed by men more than women (source: Stat-Xplore).
The broadening of Universal Credit to the people who would have claimed the other legacy benefits has led to more women than men claiming Universal Credit. These benefits, which include Income Support and Child Tax Credit, tended to have been claimed by women.
20 to 24 year olds and over 40s on Universal Credit have increased in proportion since the start of the coronavirus pandemic
People on Universal Credit by age group, Great Britain, March 2020 compared to January 2021
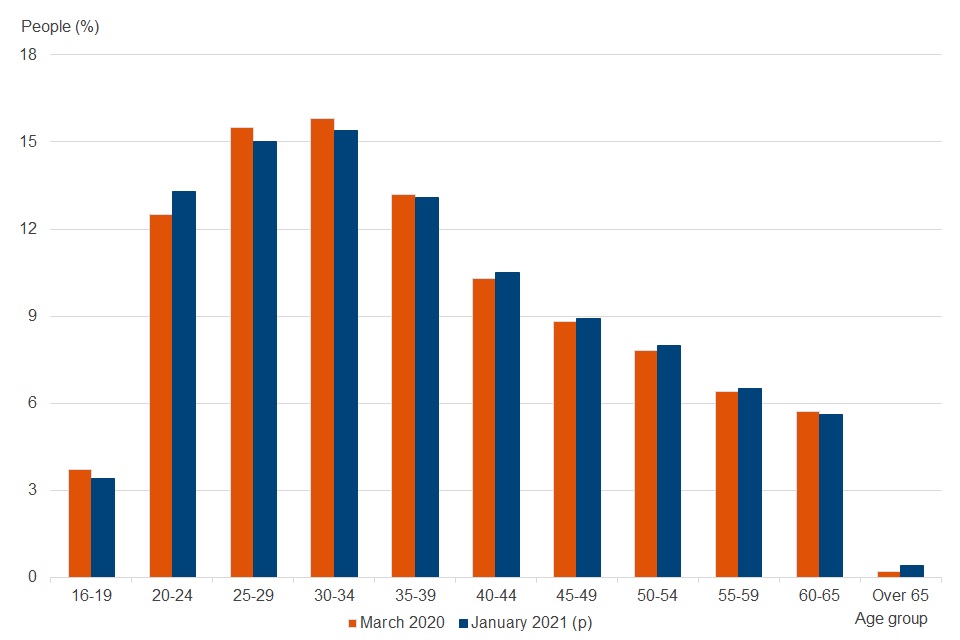
Note: (p) provisional. See Stat-Xplore for the full data series.
Source: DWP Stat-Xplore, People on Universal Credit, age by month
The proportion of claimants aged 20 to 24 increased steadily since the start of the coronavirus epidemic, from 12.5% on 12 March 2020 to 13.3% on 13 August 2020. It has remained broadly stable since, with 13.3% on 14 January 2021.
Number of people on the ‘searching for work’ regime has remained broadly unchanged since May 2020
Claimants are required to do certain work-related activities to receive Universal Credit. These activities are determined by which of the 6 conditionality regimes the claimant is placed in. The conditionality regime also determines the level of contact with the claimant, and the support that they will receive.
Conditionality regime is used in Universal Credit statistics instead of terms ‘conditionality group’ and ‘labour market regime’. To help users understand the different regimes more easily, this bulletin uses different terms to the official terms for the labour market regimes. The definitions section of this bulletin provides more information on the different conditionality regimes, and their associated conditionality groups and labour market regimes.
Different members of the same household may be subject to the same or different requirements. As circumstances change claimants will also transition between different levels of conditionality. This means that there is a ‘flow’ of claimants between these groups, that is the number of claimants in each group is constantly changing in our published statistics, month to month.
Conditionality regime, Universal Credit, Great Britain, January 2017 to January 2021
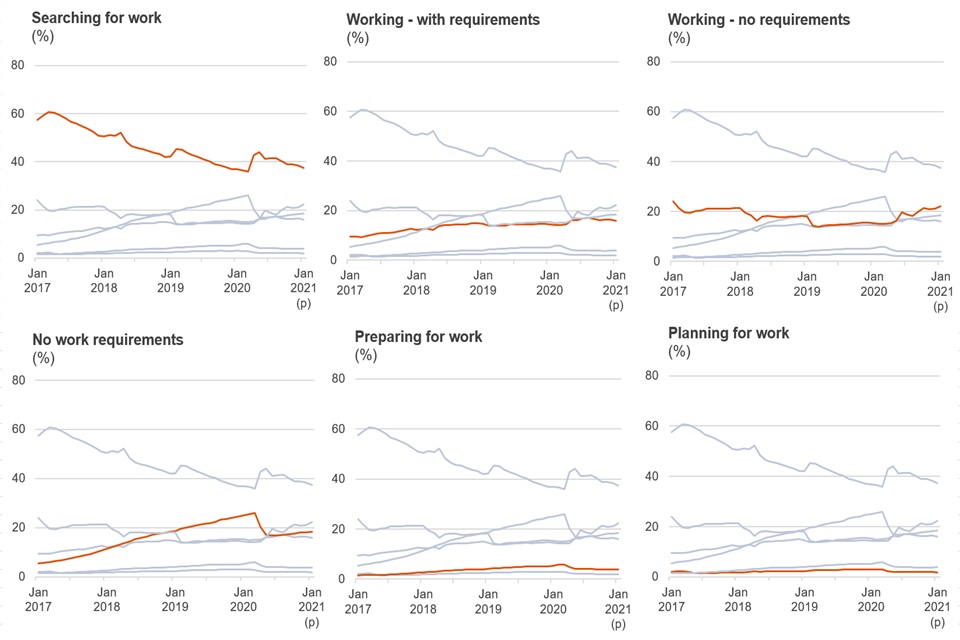
Note: (p) provisional. See Stat-Xplore for the full data series.
Source: DWP Stat-Xplore, People on Universal Credit, conditionality regime by month
The proportions of people on Universal Credit on each of the conditionality regimes has changed as a result of the new claimants to Universal Credit during the initial period of the coronavirus pandemic.
The proportion of all people on Universal Credit who were not working or on low earnings and required to search for work as a condition of their claim (‘searching for work’) was 37% on 14 January 2021. This has almost returned to the level it was before the coronavirus pandemic, when it was 36% on 12 March 2020. In the early months of the coronavirus pandemic, it increased to a peak of 44% on 14 May 2020.
The actual number of people in the ‘searching for work’ conditionality regime has stayed relatively constant, remaining between 2.2 and 2.3 million since the initial increase at the beginning of the coronavirus pandemic in April and May 2020.
Until the start of the coronavirus pandemic, the ‘searching for work’ conditionality regime was on a long-term downward trend. It fell from 62% in October 2016 to 36% in March 2020. This was because Universal Credit was initially only offered to jobseekers. As the benefit broadened to other eligible groups, and more people transferred from legacy benefits, the share of people in ‘searching for work’ has fallen.
During the coronavirus pandemic, a claimant’s requirement to search for work is tailored towards their individual circumstances. This considers their personal circumstances, government health advice and their ability to work. Through an easement, work-related requirements can be ‘turned off’ either by a legal requirement or on a discretionary basis in response to the claimant’s particular circumstances.
The proportion of people on Universal Credit whose circumstances mean they have no requirements to work (‘no work requirements’) has fallen to 18% in January 2021 from 26% in March 2020. This is following an increase of new claimants being in employment since the beginning of the coronavirus pandemic and therefore increasing the relative proportion of those whose circumstances mean they have requirements to work. Examples of the circumstances which place people in this conditionality regime are provided in the definitions section.
Over the same period, the proportion of people on Universal Credit who were working and earning enough not to have any work-related requirements as a condition of their claim (‘working – no requirements’) has increased to 22% from 15% in March 2020. This is because a greater proportion of employees are entitled to claim Universal Credit with higher earnings due to the increase in standard allowance.
The conditionality regime measures which regime an individual is in on the count date. This may not be representative of their entire assessment period. Conditionality regime figures are not the same as the employment measures, which show whether an individual has had earnings during their assessment period. The two measures should only be used together with caution. The background information and methodology document provides more information on this.
Employment rate higher than before the coronavirus pandemic
Universal Credit is available to people who are in work and on a low income, as well as to those who are out of work. Most claimants on low incomes will still be paid Universal Credit when they start a new job or increase their hours.
Universal Credit statistics measure employment as receiving earnings during the assessment period which is active on the count date.
As earnings for this period can be received up to 1 month after the count date, this data is not available for processing at the time that other data for people on Universal Credit is available. The later availability of this data means that statistics on employment for people on Universal Credit are published a month later than other statistics for people on Universal Credit.
People on Universal Credit in employment, Great Britain, December 2015 to December 2020
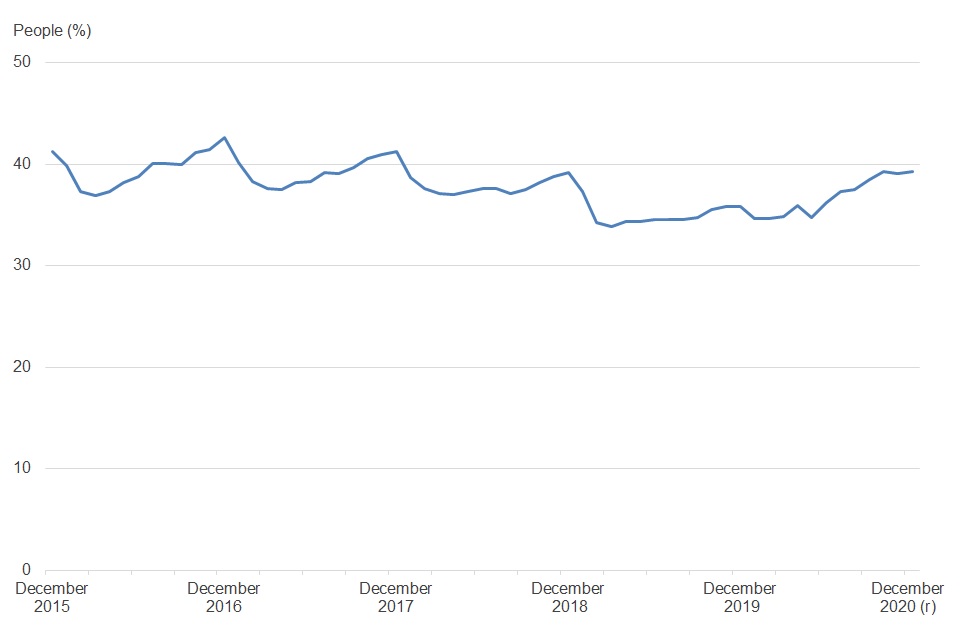
Note: (r) revised. See Stat-Xplore for the complete data series.
Source: DWP Stat-Xplore, People on Universal Credit, employment indicator by month
The composition of Universal Credit claimants has changed since before the coronavirus pandemic as there is a higher proportion of people on Universal Credit being recorded as in employment. This is because keeping £0 awards open and the increase in the standard allowance has allowed people with higher earnings to be eligible for Universal Credit, relative to before the coronavirus pandemic.
The employment rate has increased for all people on Universal Credit to 39% (2.3 million) on 10 December 2020 from 35% (1 million) on 12 March 2020, the last count date before the coronavirus pandemic.
The increase in the employment rate, and that it is higher than the pre-pandemic rate, should not be interpreted as increasing employment. This increase may seem contradictory to other statistics on the labour market, but it should be considered in the context of the policy changes to Universal Credit to support people through the coronavirus pandemic.
Not all people in ‘searching for work’ conditionality are unemployed
People on Universal Credit in employment by conditionality regime, Great Britain, December 2019 to December 2020
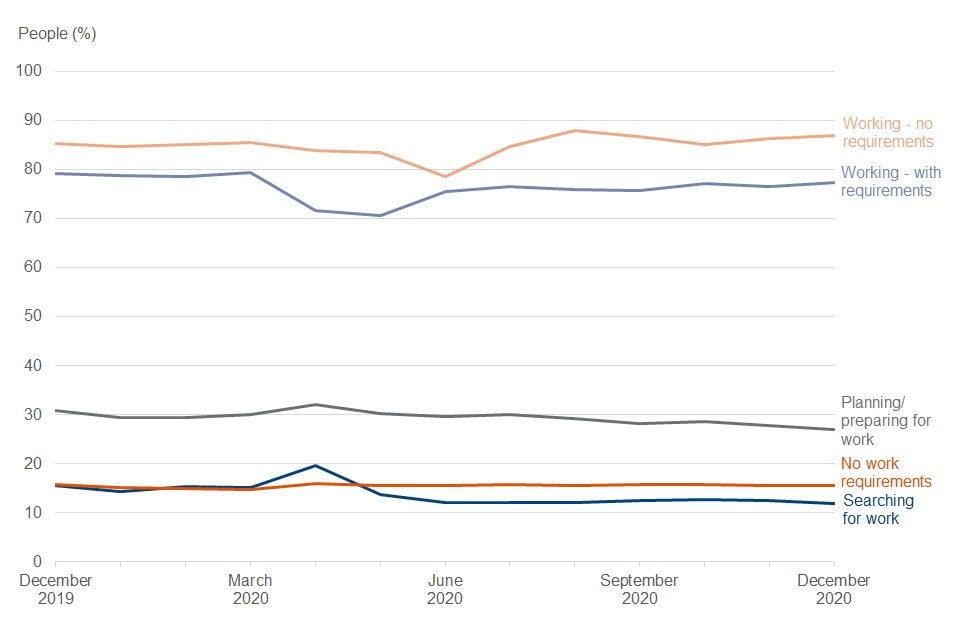
Note: See Stat-Xplore for the complete data series.
Source: DWP Stat-Xplore, People on Universal Credit, employment indicator by conditionality regime and month
A claimant’s conditionality regime may not be apparent from their employment status. There are differences between how conditionality regime and employment status are measured that means the conditionality regime is a measure of the regime the claimant is on the count date.
Employment status measures whether a claimant has received any (PAYE) earnings during the assessment period that covers the count date. For this reason, a claimant may not necessarily be in employment on the count date.
In the ‘searching for work’ conditionality regime, 88% of claimants received no earnings and are recorded as not in employment for the assessment period covering 10 December 2020. Typically, around 85% of claimants received no earnings and were recorded as not in employment in the months before the coronavirus pandemic.
This means that 12% are recorded as having received earnings and being in employment. These claimants will include those whom are in work with earnings below £338 per month, or with earnings below this level and household earnings below £541 per month. These amounts are known as the Administrative Earnings Level (AET).
In the ‘working – no requirements’ regime there are 87% of claimants in employment. There are 13% of claimants who are recorded as not having received earnings and not in employment. These include claimants who are not in work, but who are in a household with earnings above the household Conditionality Earnings Threshold (CET). The CET is the amount of the National Minimum Wage for the claimant’s expected hours of work.
In a couple household, if one of the adults is earning above the household CET, then the claimant is placed in the ‘working – no requirements’ regime regardless of the individual employment status. The household CET is a combination of both adults individual CETs.
The number of people on Universal Credit in London and surrounding regions has doubled since the beginning of the coronavirus pandemic
Percentage increase of people on Universal Credit by region, Great Britain, March 2020 to January 2021
| Region | % |
|---|---|
| North East | 67 |
| North West | 82 |
| Yorkshire and The Humber | 87 |
| East Midlands | 100 |
| West Midlands | 89 |
| East of England | 110 |
| London | 134 |
| South East | 118 |
| South West | 96 |
| Wales | 80 |
| Scotland | 83 |
Note: See Stat-Xplore for the complete data series.
Source: DWP Universal Credit statistics.
There have been regional disparities in the growth of the number of people on Universal Credit during the coronavirus pandemic. London (134%), the South East (118%) and the East of England (110%) have seen the largest growth between 12 March 2020 and 14 January 2021. This has more than doubled the number of people on Universal Credit in those regions. The North East has seen the smallest growth with a 67% increase in the number of people on Universal Credit.
Claimants from London and the North West make up a greater proportion of people on Universal Credit
People on Universal Credit by region, Great Britain, March 2020 compared to January 2021
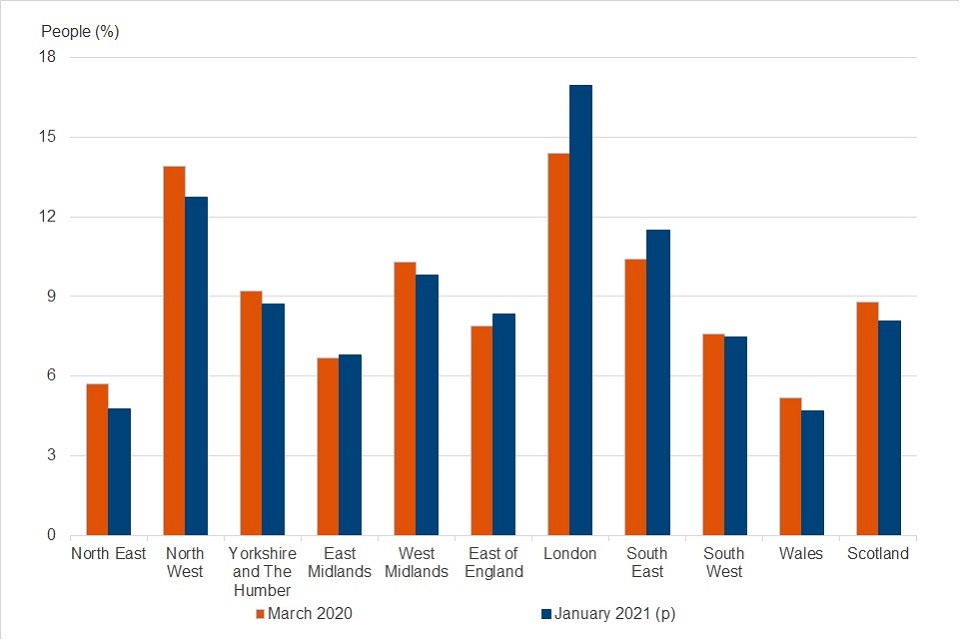
Note: (p) provisional. See Stat-Xplore for the full data series.
Source: DWP Stat-Xplore, People on Universal Credit, region by month
The proportion of people on Universal Credit from London increased to 16.9% on 14 January 2021 from 14.4% on 12 March 2020.
The disparities in growth in people on Universal Credit between regions are reflected in how the proportions of people on Universal Credit in each region has changed since the beginning of the coronavirus pandemic. London has had the biggest increase in proportion of people on Universal Credit between March 2020 and January 2021, followed by the South East, East of England and the East Midlands. All other regions have had a decrease or very little change in proportion of people on Universal Credit since the beginning of the coronavirus pandemic.
For more regional and local level information see the map for claimants on Universal Credit at Jobcentre Plus office level
7. Households on Universal Credit
In Universal Credit statistics a household is a single person or couple living together with or without dependent children. This is sometimes referred to as a benefit unit in other statistics. To be counted in the ‘households on Universal Credit’ series, a household needs to have had their entitlement calculated for the assessment period covering the count date.
Statistics for ‘households on Universal Credit’ are produced 3 months in arrears. For more information and the timeliness of these statistics, refer to the background information and methodology document.
There were 4.9 million households on Universal Credit in November 2020 This is an increase of 2.2 million since March 2020.
Of these households, 85% (4.2 million) received a payment. This compares to 94% (2.5 million out of 2.7 million) in March 2020.
Total households on Universal Credit by in payment and not in payment, Great Britain, November 2016 to November 2020
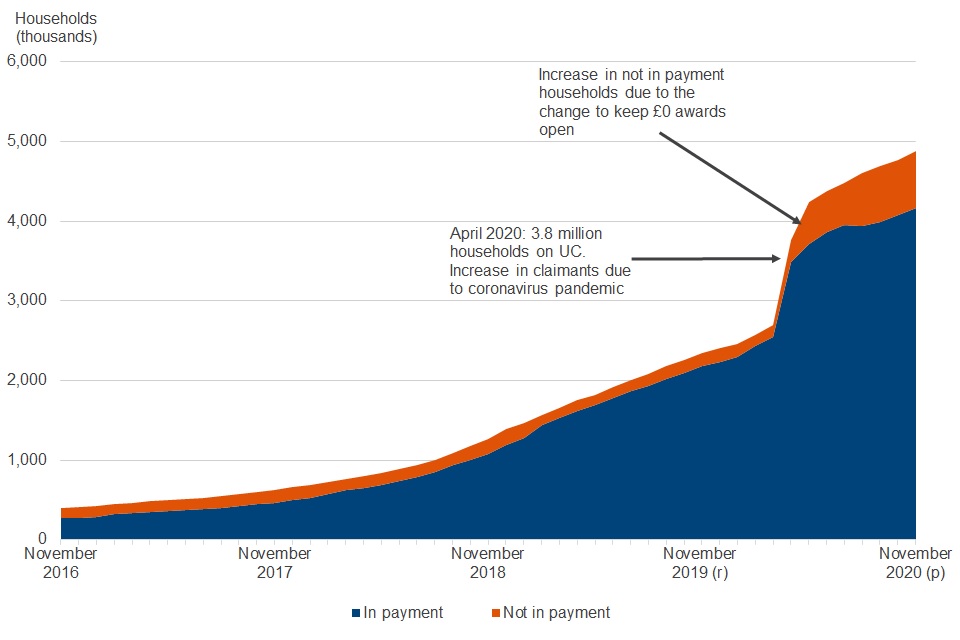
Note: (p) provisional. (r) revised. See Stat-Xplore for the full data series.
Source: DWP Stat-Xplore, Households on Universal Credit, payment indicator (yes)
The number of households on Universal Credit has increased to 4.9 million for assessment periods covering the 12 November 2020. It had been increasingly steadily before the coronavirus (COVID-19) pandemic to 2.7 million in March 2020 from 760,000 in March 2018.
Fewer households in payment, proportionally, than before the coronavirus pandemic.
Although the number of households on Universal Credit continues to increase, the proportion of households in payment has fallen to 85% in November 2020. Before the coronavirus pandemic, the proportion of households in payment had gradually increased to 94% by February 2020.
Households on Universal Credit in payment, Great Britain, November 2016 to November 2020
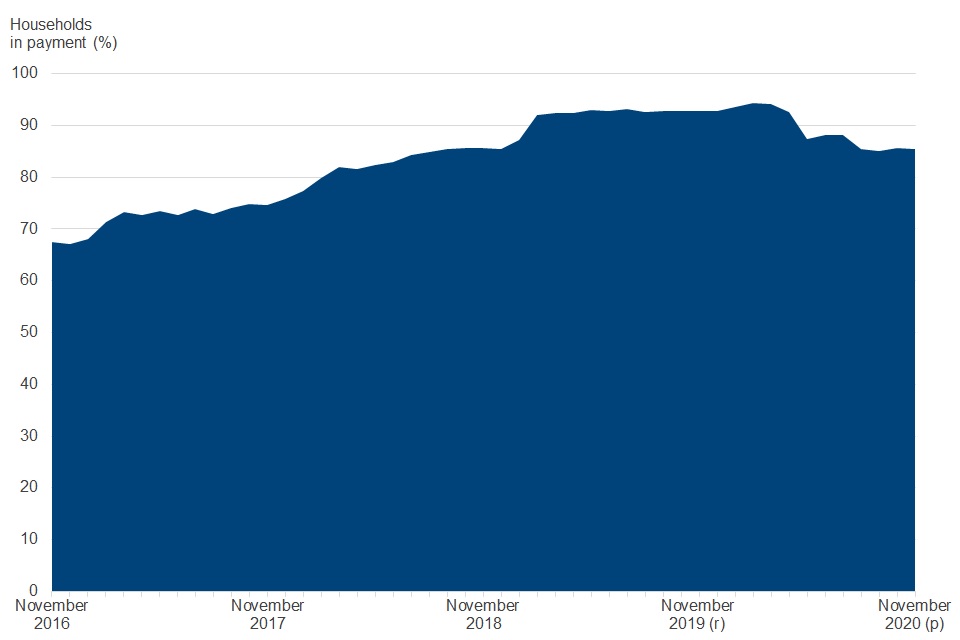
Note: (p) provisional. (r) revised. See Stat-Xplore for the full data series.
Source: DWP Stat-Xplore, Households on Universal Credit, payment indicator (yes)
There are several reasons why a household may not be in receipt of a payment. For example, when someone moves into work and their level of earnings means that they no longer receive a payment.
Claims with a £0 award are normally considered to be closed if the claimant’s earnings reduce their award to £0. However, as a temporary process change during the coronavirus pandemic where a claim would normally be closed as a result of high earnings, these claims are being kept open for up to 6 assessment periods of a £0 award.
In addition, households would have claimed Universal Credit at the beginning of the coronavirus pandemic before other support measures were announced. As the Coronavirus Job Retention Scheme and other support measures were announced and came into effect, their earnings may not have fallen as much as the claimant initially anticipated when making a claim for Universal Credit. Consequently, their award was tapered down to £0 by their earnings.
The average (mean) Universal Credit payment is higher than before the coronavirus pandemic
The amount of Universal Credit a household receives is based on the standard Universal Credit entitlement plus additional entitlements that they are eligible for.
Above these entitlements households may also receive additional payments for a:
- loan advance
- hardship payment
- severe disability payment
- mortgage interest payment
The payments will be lower than their Universal Credit entitlements where the household is:
- making a loan repayment
- has been sanctioned
- limited by the benefit cap
- having benefit or tax credit overpayments being recovered
- earning above the threshold and the payment is reduced by the taper
Average (mean) Universal Credit payment for in payment households, Great Britain, November 2016 to November 2020
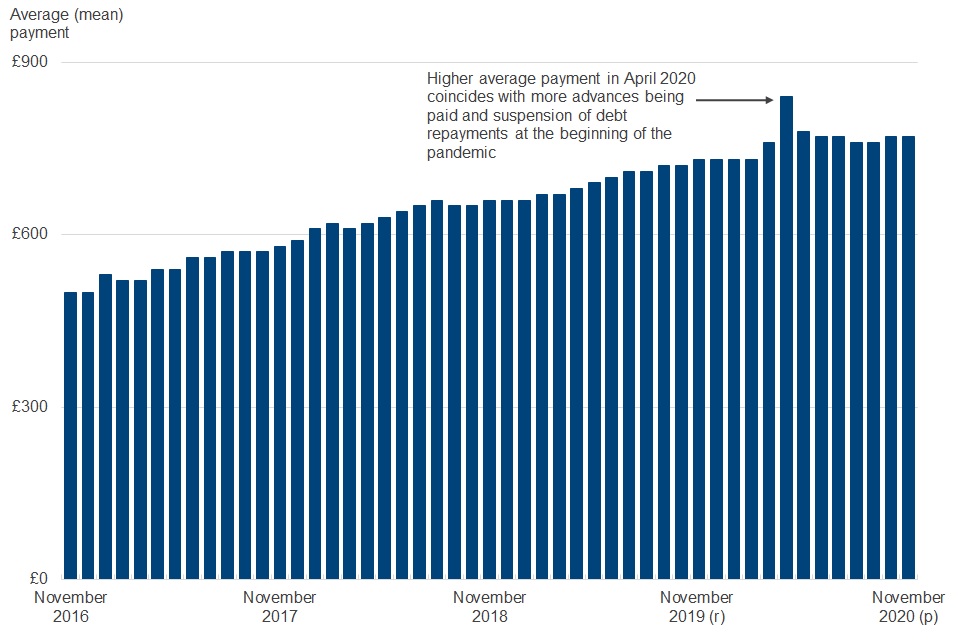
Note: (p) provisional. (r) revised. See Stat-Xplore for the full data series.
The average (mean) amount of Universal Credit paid to households on Universal Credit was £770 per month in November 2020. This is an increase of £40 from £730 in February 2020, before the coronavirus pandemic. It is also £40 higher than the £730 in November 2019.
The higher average payment of Universal Credit since March 2020 is due to annual uprating of Universal Credit entitlements. A temporary, £1,040 a year increase (£20 a week) to the standard allowance in response to the coronavirus pandemic was also put in place.
There was a spike in the average payment for assessment periods covering the 9 April 2020, with the average payment of £840. Management information shows that there was an increase in the number of advances being paid in the early weeks of the coronavirus pandemic.
Additionally, some payments would have increased from a suspension of the recovery of debts for benefit overpayments, Social Fund loans and third-party debts. The recovery of these debts was suspended until early May 2020, when recoveries were re-introduced gradually.
Moreover, requirements for work search and work availability were suspended from 30 March 2020 at the beginning of the coronavirus pandemic and have been gradually reintroduced from 1 July 2020. This suspension would have led to fewer reductions from sanctions than normal, increasing the average payment amount. See the Benefit sanction statistics for more information on sanctions.
Although claimants will fully benefit from the annual benefit uprating and the £20 a week temporary increase to the standard allowance, this does not show in the increase to the average (mean) payment since February 2020. This is due to:
- a higher proportion of single people without children
- a higher proportion of claims made without the housing element in new claims
- people returning to work since 1 June 2020 on a flexible-working basis as allowed by the coronavirus Job Retention Scheme
The average payment is influenced by large payments. Nearly 8% of households where Universal Credit is in payment were paid more than £1,500. The average (mean) payment is increased by these large payments, which are largely caused by households receiving payments in addition to their standard entitlements.
In November 2020, the median payment (£690) – the amount where 50% of households are paid more, and 50% of households are paid less – was lower than the average (mean) payment of £770.
Average (mean) payment is influenced by the number of high payments
In payment households by payment band, Great Britain, November 2020
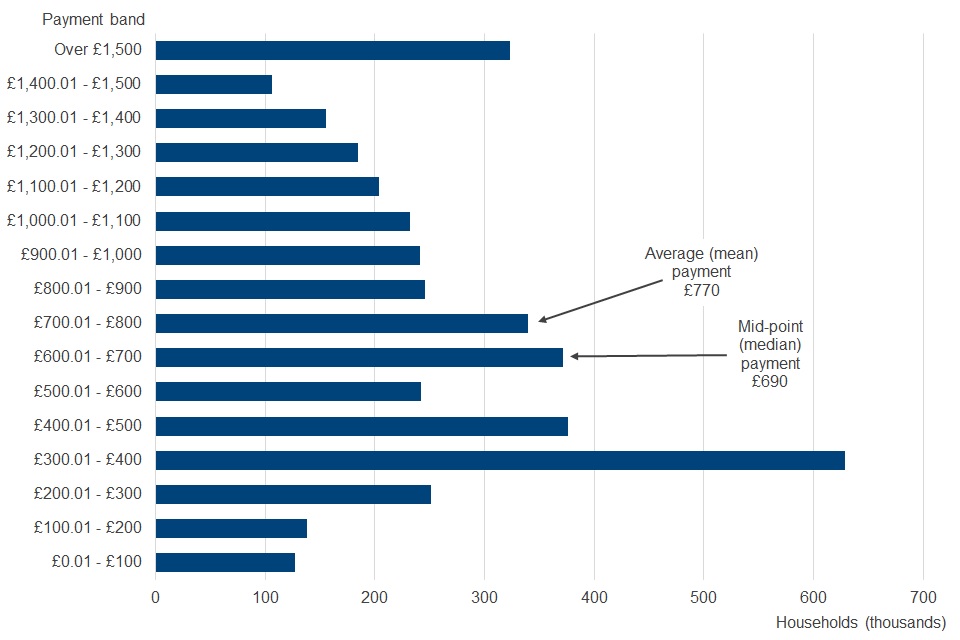
Note: (p) provisional. (r) revised. See Stat-Xplore for the full data series.
More households received a payment in the £300.01 to £400 payment band than any other payment band. Nearly 90% of claimants in this payment band were single claimants without children. In contrast, in the over £1,500 payment band, 93% were households with children (Source: Stat-Xplore).
For regional data, refer to the household dashboard and household maps at region and local authority level
Increased proportion of households in payment are without children since beginning of coronavirus pandemic
In payment households by family type, Great Britain, November 2016 to November 2020
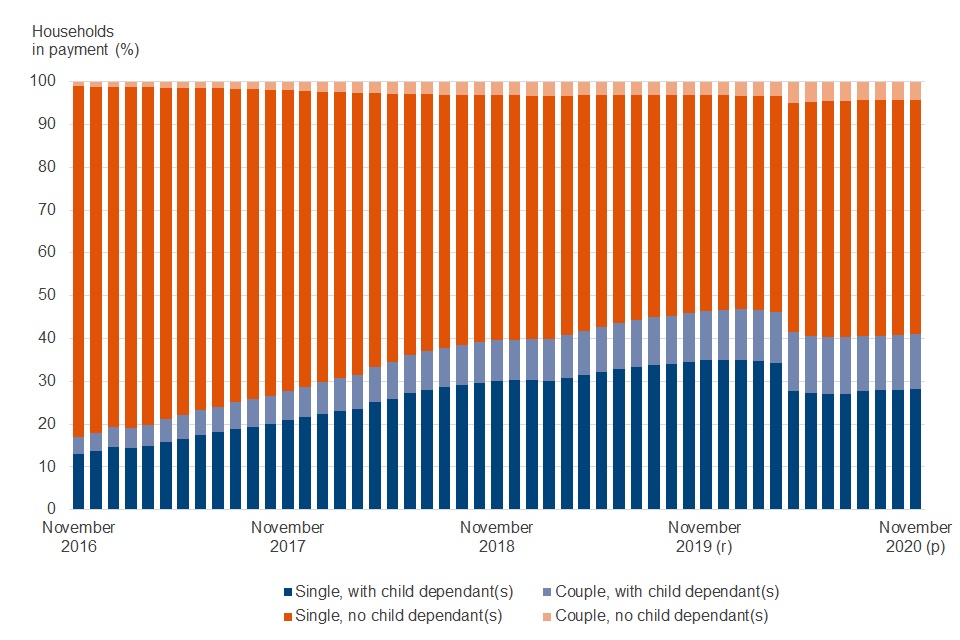
Note: (p) provisional. (r) revised. See Stat-Xplore for the full data series.
Source: DWP Stat-Xplore, Households on Universal Credit, payment indicator (yes), family type
Households without children have increased to 59% of households on Universal Credit in payment in November 2020. Before the coronavirus pandemic, they were 54% in March 2020.
Prior to the coronavirus pandemic there was a long-term upward trend for the proportion of households with children on Universal Credit claims in payment. This was due to Universal Credit replacing legacy benefits and tax credits for new claims and migration from legacy benefits and tax credits due to a change in circumstances.
All additional entitlements have fallen as a proportion of households in payment since beginning of coronavirus pandemic
Entitlements for in payment households, Great Britain, November 2017 to November 2020
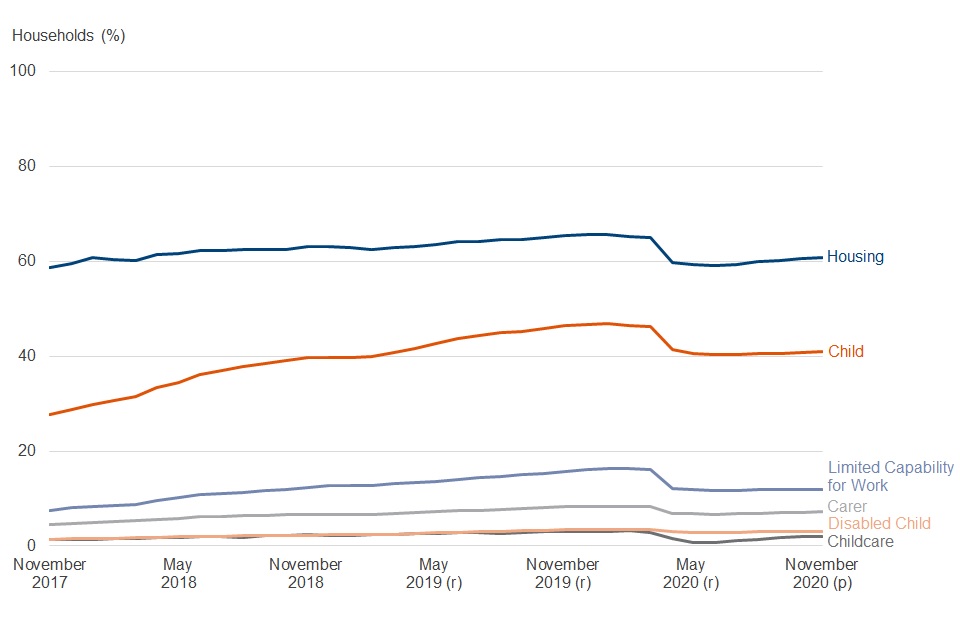
Note: (p) provisional. (r) revised. See Stat-Xplore for the full data series.
Source: DWP Stat-Xplore, Households on Universal Credit, Entitlements
There are a range of additional entitlements in Universal Credit payments for children, health and disabilities, housing, and carers.
The proportion of Universal Credit payments with each of these entitlements began to decrease as a result of an increase in claimants from the coronavirus pandemic. This suggests a greater proportion of new claimants were not claiming additional entitlements. Previously, the proportion of claimants with additional entitlements was on an increasing trend as Universal Credit gradually replaced legacy benefits for new claims.
Support for rental housing costs (housing entitlement) was included in 61% of households receiving a payment in November 2020. This is down from a peak of 66% in January 2020.
Payments that included an amount to help with the costs of looking after children (child entitlement) was included in over two in five households in payment. Child entitlement was included in 41% of these payments in November 2020, compared with 46% in November 2019 and 28% in November 2017.
One in five households with a housing entitlement affected by Removal of Spare Room Subsidy
Households on Universal Credit in payment with housing entitlement in their payment may receive a reduction to their payment due to the Removal of Spare Room Subsidy (RSRS) scheme. This is where tenants in social housing whose accommodation is deemed to be larger than they need may lose part of their Universal Credit payment.
In November 2020, the proportion of households on Universal Credit in payment with housing entitlement in their payment to receive a reduction due to the RSRS scheme was 20% (240,000). The average (mean) monthly reduction amount was £70 and the median reduction amount was £60.
A higher proportion of households have their rent covered by Local Housing Allowance since April 2020
The percentage of private rental sector households on Universal Credit in payment that have their rent covered by the Local Housing Allowance was 46% in November 2020. This increased from 31% in February 2020. There were 54% of private rented sector households on Universal Credit that did not have their rent covered by the Local Housing Allowance. This has decreased from 69% in February 2020. In April 2020 in response to the coronavirus pandemic, Local Housing Allowance was aligned with the 30th percentile of local rents.
97% of households in payment received their full payment on time in October 2020
Statistics on payment timeliness are produced 4 months in arrears to avoid large revisions to provisional figures caused by retrospection. This is to allow for more accurate and higher quality statistics.
Payment timeliness (all claims), Universal Credit, Great Britain, October 2017 to October 2020
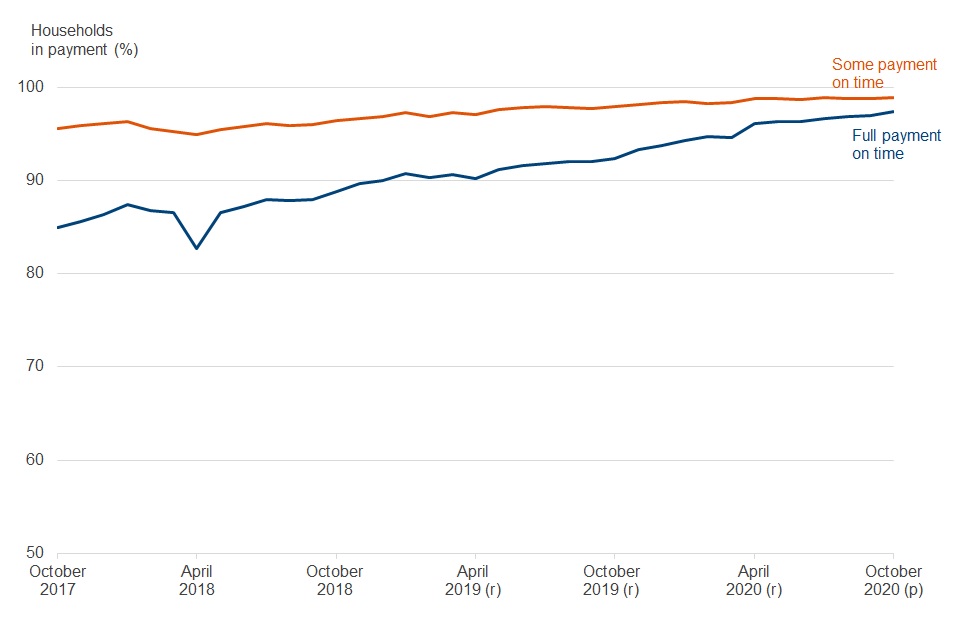
Note: Payment timeliness statistics are available in Stat-Xplore from April 2019 onwards. To allow sufficient time for information to be gathered on all payments, figures are not included for the latest month in the series. Payment timeliness statistics for January 2017 to March 2019 for Universal Credit full service can be found in table 1.1 in the ODS table accompanying this bulletin. Figures prior to April 2019 are Universal Credit full service only. Figures marked (p) are provisional; figures marked (r) have been revised since the previous release. Source: Stat-Xplore, Households on Universal Credit, Payment Timeliness
Payment timeliness for all claims in payment has continued an upward trend throughout the coronavirus pandemic. Of households in payment, 97% received all their payment on time in October 2020. This is an increase from 95% in March 2020.
Around 99% of all households in payment were paid all or some payment on time, compared to 98% in October 2019.
A higher proportion of new claims are receiving all or some of their payment on time than before the coronavirus pandemic
Payment timeliness (new claims), Universal Credit, Great Britain, October 2017 to October 2020
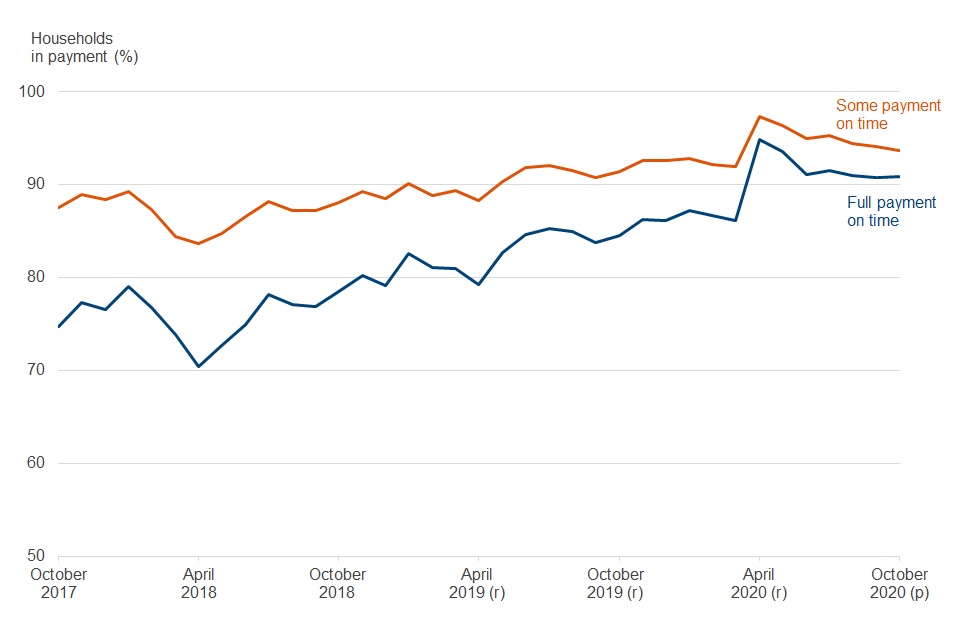
Note: Payment timeliness statistics are available in Stat-Xplore from April 2019 onwards. To allow sufficient time for information to be gathered on all payments, figures are not included for the latest month in the series. Payment timeliness statistics for January 2017 to March 2019 for Universal Credit full service can be found in table 1.1 in the ODS table accompanying this bulletin. Figures prior to April 2019 are Universal Credit full service only. Figures marked (p) are provisional; figures marked (r) have been revised since the previous release.
Source: Stat-Xplore, Households on Universal Credit, Payment Timeliness
Payment timeliness is lower for new claims in comparison to all claims. There are several one-off verification processes that must be completed by the claimant and by DWP at the start of the claim. These are to confirm the current circumstances of the claimant (or both claimants in a joint claim) and their entitlement to Universal Credit. Delays to completion of these processes can cause payments to not be made on time.
The proportion of new claims – that is claims in their first assessment period on the count date – receiving all the first payment on time in October 2020 was 91%. This is lower than the 95% of new claims receiving all their first payment on time in April 2020, the first month of the coronavirus pandemic.
However, it is higher than the 86% of new claims receiving all their first payment on time in March 2020 before the coronavirus pandemic.
Nearly 94% of households received some or all their first payment on time in October 2020. This compares with 91% in October 2019 and 88% in October 2017.
Before the coronavirus pandemic, payment timeliness for new claims had been on a general upward trend for households receiving some or all of their award on time. In March 2020, the month containing the last count date before the coronavirus pandemic, around 92% of new claims received all or some their first payment on time. This compares with 97% in the following month, April 2020, which was the first month of the coronavirus pandemic.
Payment timeliness is higher during the coronavirus pandemic because of temporary operational and policy changes. This includes redeploying staff within DWP to handle Universal Credit claims, and changes to some verification processes due to the closure of Jobcentres.
8. About these statistics
Purpose
These statistics provide the primary official source of information about people and households on Universal Credit, and claims and starts to Universal Credit.
They enable a variety of users to be informed about different elements of the benefit including politicians, policy and administrative staff in central and local government, academics, the voluntary sector and journalists. They use the statistics for a range of purposes from monitoring and accountability to research and policy development. The background information and methodology document includes more details on the users and uses of these statistics.
Release schedule
The bulletin is published quarterly in February, May, August and November, supplemented by monthly data updates for people on Universal Credit in Stat-Xplore.
-
Next release of people on Universal Credit: 23 March 2021
-
Next release for claims, starts and households on Universal Credit: 18 May 2021
All releases for Universal Credit statistics can be found in the Universal Credit statistics collection.
User engagement and development of these statistics
These official statistics have been compiled using data from systems within local offices and records of Universal Credit benefit payments made by the department.
These and other new data sources will, in time, allow a progressively broader range of breakdowns to be published as data sources are developed. The methodology used and definitions of the official statistics may be updated within subsequent releases, along with information on the impact of any changes to the time series already released.
A strategy for the release of official statistics on Universal Credit was first published in September 2013 and last updated in January 2018 following consultation with users.
In July 2020 a user engagement survey was carried out to understand the needs users of Universal Credit statistics. It was also to identify possible areas of improvement. Following analysis of the responses from this survey, we have published the findings of the survey and the actions we will be taking.
Compliance check against the Code of Practice for Statistics
These statistics have been developed using guidelines set out by the UK Statistics Authority and are official statistics that are experimental.
A compliance check was conducted on Universal Credit statistics by the Office for Statistics Regulation (OSR) in May 2019. They welcomed many aspects of the release and made several recommendations to support the development of these experimental statistics.
Since that compliance check we have introduced a number of developments. The background information and methodology contains more details on these.
Users are invited to comment on the content, relevance, accessibility and timeliness of these statistics by sending an email to team.ucos@dwp.gov.uk or on the Welfare and Benefits statistics board of StatsUserNet.
Rounding
Volumes and amounts have been rounded as detailed in the background information and methodology document. Percentages are calculated using numbers prior to rounding and rounded to the nearest whole percentage point.
Additional information
Geography data for People on Universal Credit and Households on Universal Credit
Geography data used in People on Universal Credit and Households on Universal Credit in this publication is based on the address information held by DWP before the coronavirus pandemic. An update to the address held in the central data source from which geography information is taken has been deferred until changes can be verified. This is most likely to affect new claimants who did not have recent contact with DWP before the coronavirus pandemic.
This does not affect the address information held on the Universal Credit full service that the claimant has declared on their claim. Postcode area on the Claims made to Universal Credit and Starts to Universal Credit data are not affected by this issue as they are obtained from the Universal Credit full service data.
Postcode district for claims and starts to Universal Credit remains withdrawn
This is due to an issue with the underlying data. Postcode districts (for example, E5) will be restored when a new methodology is developed. This does not affect postcode area (for example, ‘E’ in the postcode E5) for claims and starts which remains available.
Revisions
Universal Credit statistics are subject to scheduled revisions as detailed in the background information and methodology document.
9. Related statistics
This publication complements other statistics bulletins that, together, provide a more coherent view of Universal Credit claimants and awards, and other benefits.
Universal Credit statistics for Northern Ireland are published by the Department for Communities (Northern Ireland).
Benefit sanctions includes statistics on people having their award stopped or reduced for not meeting their agreed conditions.
Benefit Cap includes statistics on people who have had their Universal Credit award capped because their total amount received in benefits is higher than the maximum amount of benefits a person can receive.
DWP benefits provides statistics for benefits that Universal Credit is replacing.
Fraud and error in the benefit system provides estimates of the number of households that may have been paid too much Universal Credit or not enough. These overpayments and underpayments happen as a consequence of fraud; claimant error; and official error (processing errors or delays by DWP, a Local Authority, or Her Majesty’s Revenue and Customs). ‘Fraud and error in the benefit system’ estimates how much money the department incorrectly pays.
Claimant Count is a measure of the number of people claiming benefits principally for the reason of being unemployed, based on administrative data from the benefits system. It includes people on Universal Credit in the searching for work conditionality regime for the UK. Universal Credit statistics uses the same data excluding Northern Ireland.
Alternative Claimant Count statistics measure the number of people claiming unemployment related benefits by modelling what the count would have been if Universal Credit had been fully available from when Universal Credit was introduced in 2013 with the broader span of people this covers. Under Universal Credit, a broader span of claimants are required to look for work than under Jobseeker’s Allowance. This is a feature of the design of Universal Credit and has the effect of increasing the Claimant Count irrespective of how the economy performs. For this reason, the Office for National Statistics have stated that the Claimant Count figures are no longer a reliable indicator of the labour market. The Alternative Claimant Count attempts to address this.
European Social Fund (ESF) 2014 to 2020 (ESF 14 to 20) programme is an EU-funded employment, skills and social inclusion programme across England aimed at providing the help people need to achieve their potential. This publication uses Universal Credit data to show how many people who started on the programme were on Universal Credit.
10. Definitions
Claim made
A claim made is when an individual submits an application for Universal Credit.
Start
A person has started on Universal Credit when their identity has been verified and they have agreed their claimant commitment.
People
A person is counted on Universal Credit when they have met the definition to start, they have a National Insurance number recorded and there is no record of a closure of the claim.
Household and in payment
A household is a single person or co-habiting couple with or without dependant children. A household is counted when their assessment period overlaps the count date. An in payment household is one that has received a Universal Credit payment of £0.01 or more after deductions, sanctions and the benefit cap during that assessment period.
Conditionality Regimes
All people on Universal Credit are placed into one of four conditionality groups, depending on their personal circumstances. Which of these groups they are placed into will determine what activities they are required to do (if any) as part of their claim. Universal Credit statistics uses the term conditionality regime in place of ‘conditionality group’ and ‘labour market regime’. The table below shows the circumstances of individuals for each conditionality regime and the associated group and labour market regime.
| Conditionality regime | Description | Conditionality Group | Labour Market Regime |
|---|---|---|---|
| Searching for work | Not working, or with very low earnings. Claimant is required to take action to secure work - or more or better paid work. The Work Coach supports them to plan their work search and preparation activity. Typical examples of people in this regime include jobseekers and self-employed in start-up period. Claimants are only in this regime if they do not fit into one of the other regimes. | All work related requirements | Intensive Work Search |
| Working – with requirements | In work, but could earn more, or not working but has a partner with low earnings. | All work related requirements | Light touch |
| No work requirements | Not expected to work at present. Health or caring responsibility prevents claimant from working or preparing for work. Examples of people on this regime include those in full time education, over state pension age, has a child under 1 and those with no prospect for work. | No work related requirements | No work related requirements |
| Working – no requirements | Individual or household earnings over the level at which conditionality applies. Required to inform DWP of changes or circumstances, particularly at risk of earnings decreasing or job loss. | No work related requirements | Working enough |
| Planning for work | Expected to work in the future/ Lead parent or lead carer of child aged 1 (aged 1 to 2, prior to April 2017). Claimant required to attend periodic interviews to plan for their return to work. | Work focused interview | Work focused interview |
| Preparing for work | Expected to start work in the future even with limited capability to work at the present time or a child aged 2 (aged 3 to 4, prior to April 2017). Claimant expected to take reasonable steps to prepare for working including Work Focused Interview. | Work preparation | Work preparation |
Universal Credit live service
The original service offering Universal Credit. Initially restricted to mostly single working age people with no children, seeking work. It was available throughout Great Britain by May 2016. It closed to new claims from 1 January 2018 and all remaining claimants were moved to full service by March 2019.
Universal Credit full service
Full service is the digital system that offers Universal Credit to the full range of claimant groups. New claims are made on gov.uk and most accounts are managed only through an online account. It was gradually introduced to Jobcentres from 2016 and was available in every Jobcentre across Great Britain and Northern Ireland by December 2018. When full service became available in a Jobcentre, existing Universal Credit claimants on live service were transferred to full service within 3 months.
A glossary for further terms used in Universal Credit statistics is included in the background and methodology document.
11. Contacts
Feedback on the content, relevance, accessibility and timeliness of these statistics and any non-media enquiries should be directed to:
Statistician: Stephen Slater
Email: team.ucos@dwp.gov.uk
For media enquiries on these statistics, please contact the DWP press office
For statistics enquiries only. These contact details are unable to provide any information or assistance with claiming Universal Credit.
ISBN: 978-1-78659-198-2