DCMS Sectors Economic Estimates 2019: Regional GVA - Headline Release
Published 26 August 2021

© Crown copyright 2021
This publication is licensed under the terms of the Open Government Licence v3.0 except where otherwise stated. To view this licence, visit nationalarchives.gov.uk/doc/open-government-licence/version/3 or write to the Information Policy Team, The National Archives, Kew, London TW9 4DU, or email: psi@nationalarchives.gov.uk.
Where we have identified any third party copyright information you will need to obtain permission from the copyright holders concerned.
This publication is available at https://www.gov.uk/government/statistics/dcms-sectors-economic-estimates-2019-regional-gva/dcms-sectors-economic-estimates-2019-regional-gva-headline-release
1. Details
Release date: 26 August 2021
Next release: 2022
Geographic Coverage: United Kingdom and ITL1 regions
Responsible statistician: Emma Scholey
Annual estimates of gross value added (GVA) for DCMS sectors and subsectors by UK region. Estimates are available in current price (nominal or value) and in chained volume measures.
The results are unaffected by the coronavirus (COVID-19) pandemic in 2020, as the latest year for which data is reported is 2019.
The time lag between the latest year of data (2019) and publication is due to the lag of regional data published by the Office for National Statistics, which is used in production of these estimates. This lag reflects the size and complexity of the survey data and compilation of regional accounts.
These regional GVA estimates are used by DCMS and other government departments to formulate and monitor economic policy and allocate resources. The GVA statistics inform the general public about the state of DCMS sectors and how they contribute to different UK regions.
2. Headline findings
The following findings report the current price estimates for DCMS sectors by UK region; all GVA figures that follow are in current prices and are not adjusted for inflation.
2.1 Regional distribution of DCMS sectors
-
DCMS sectors (excluding Tourism and Civil Society) contributed £212.0 billion to the national economy in 2019, with London making the largest contribution by region. London contributed 40.1% of national DCMS GVA in 2019, up from 39.5% in 2018. This was the largest year-on-year change for any UK region. By comparison, only 23.7% of GVA for the whole economy was generated in London in 2019 (see Figure 1).
-
The regional distribution varies by DCMS sector. Sport and Gambling GVA were the most evenly distributed across the UK regions; 20.7% of total Sport GVA was generated in London in 2019, followed by 17.2% in South East, 12.3% in North West, and 8.8% in East of England. By comparison, Cultural Sector GVA was mainly generated in London (70.2% in 2019), followed by 6.7% of total GVA generated in the South East, 3.7% in Scotland, and 3.3% in the South West. (see Figure 1). Overall, the regional distribution of GVA for DCMS sectors in 2019 was very similar to the pattern in 2018.

A percentage stacked bar chart showing how the regional distribution of GVA for All industries, DCMS Sector total (excluding Tourism and Civil Society) and each individual DCMS sector, for 2019.
2.2 Contribution of DCMS sectors to individual regions
-
DCMS sectors (excluding Tourism and Civil Society) account for a relatively large proportion of the economy in London and the South East, accounting for 18.2% and 12.9% of total GVA in those regions respectively. This was followed by the East of England and North West; DCMS sectors (excluding Tourism and Civil Society) accounted for 8.6% of the economy in the East of England, and 8.3% of the economy in the North West. For all other UK regions, DCMS sectors accounted for less than 8% of the whole economy in that region. DCMS sectors accounted for only 6.4% of total GVA in Wales, the lowest of any region (see Figure 2). This is a similar pattern to 2018.
-
The Digital Sector was the largest DCMS sector across all UK regions except for London, where Creative Industries was the largest (contributing 13.0% to London’s economy compared to 12.6% for the Digital Sector) (see Figure 2). The Creative Industries was the second largest sector in all other UK regions, except for the North East. Telecoms (which sits wholly within the Digital Sector) was the second largest DCMS sector in the North East, contributing 3.3% to the North East economy. Gambling was the smallest DCMS sector for the majority of regions, contributing less than 1% of the economy in each region. The exception to this was in the North East, East Midlands and West Midlands, where the Cultural Sector was the smallest DCMS sector (contributing less than 1%).
-
Users should be aware that there is overlap between DCMS sectors. Some large industries are found within multiple sectors and are likely to drive trends in the same way for both sectors (see ‘Measuring the Data’ section).

A dot plot showing how much each DCMS sector contributes to each UK region in 2019, measured by the proportion of gross value added.
2.3 Regional growth (adjusted for inflation)
The following findings report the real-terms growth for DCMS sectors by UK region; all GVA figures that follow are in chained volume measures and adjusted for inflation
-
Between 2018 and 2019, there was real-terms growth in DCMS Sectors (excluding Tourism and Civil Society) across all UK regions . The region that saw the highest actual and relative growth was London, with DCMS GVA increasing by 6.3% (£5.0 billion) between 2018 and 2019 in this region. This is compared with growth of 2.4% in London for the economy as a whole. The DCMS growth in London was driven by growth in the Digital Sector (+8.6%, an increase of £4.6 billion), Creative Industries (+6.3%, £3.6 billion), and the Cultural Sector (+10.0%, £2.2 billion).
-
In Northern Ireland, Scotland and Wales, the GVA for DCMS Sectors (excluding Tourism and Civil Society) has grown faster than the respective countries’ economies as a whole between 2010 and 2019. DCMS GVA in real terms has grown by 25.9% in Northern Ireland (compared to 15.3% for the Northern Ireland economy as a whole), 25.2% in Wales (compared to 14.5%) and 20.3% in Scotland (compared to 13.6%) between 2010 and 2019. Notably, Northern Ireland has seen large increases in DCMS Sector GVA between 2018 and 2019, increasing by 5.7% (a gain of £151 million). This is largely driven by growth of 9.7% (£114 million) in the Creative Industries in Northern Ireland between 2018 and 2019.
-
These regional data can add to our understanding of UK-level trends. Between 2018 and 2019, at the total national level, there was strong growth in Cultural Sector GVA (+9.5%, £3.0 billion). Whilst most of this Cultural Sector growth was driven by London (+10.0%, £2.2 billion), the growth was also supported across the UK, with annual growth rates of over 6% for all regions except the West Midlands. Gambling GVA at the total national level shrank by 2.7% between 2018 and 2019, and the regional results indicate that this was widespread across the UK, with Gambling GVA shrinking in 10 out of 12 UK regions.
3. Data
DCMS Economic Estimates - Regional GVA 2019
Released 26 August 2021.
Estimates of gross value added for ITL1 regions of the United Kingdom as current price and ‘real’ (chained volume) measures, for DCMS sectors and subsectors, the Audio Visual sector and Computer Games sector (which do not form part of the DCMS Sector total).
4. Measuring the data
4.1 Data sources, quality and methodology
Information on data sources, sector definitions and how the data were produced is available in the technical report.
This release uses data provided by the Office for National Statistics (ONS). ONS bears no responsibility for the further analysis and interpretation of the data used in this release.
All figures may change when the regional accounts are updated in 2022. The 2019 figures are provisional (shown by “p” in tables and charts) and will be revised in the next annual update of these statistics.
The DCMS Sector Economic Estimates were designated as National Statistics on 26 June 2019. This affirms that the statistics have met the requirements of the Code of Practice for Statistics.
Other organisations, including some of DCMS’ arm’s length bodies, produce alternative GVA measures of DCMS sectors. These alternative measures can be found in the technical report.
4.2 Sector definitions and overlap
The DCMS sectors covered in this release are:
- Creative Industries
- Cultural Sector
- Digital Sector
- Gambling
- Sport
- Telecoms
Regional GVA estimates are currently not available for Civil Society and Tourism. Any references to ‘DCMS sectors’ in this report excludes Tourism and Civil Society.
The definition of Sport used in this release is based on the core statistical Vilnius definition, rather than the wider definition used in the Sports Satellite Account.
Some large industries are found within multiple sectors and are likely to drive trends in the same way for both sectors. For example, 27.4% of national DCMS Sector GVA in 2019 was within both the Creative Industries and the Digital Sector. These overlaps include activities such as computer programming and software publishing. Industries are only counted once towards the DCMS sector total, which due to the overlaps between sectors is lower than the sum of the individual sectors. This overlap between DCMS sectors is illustrated in Figure 3.
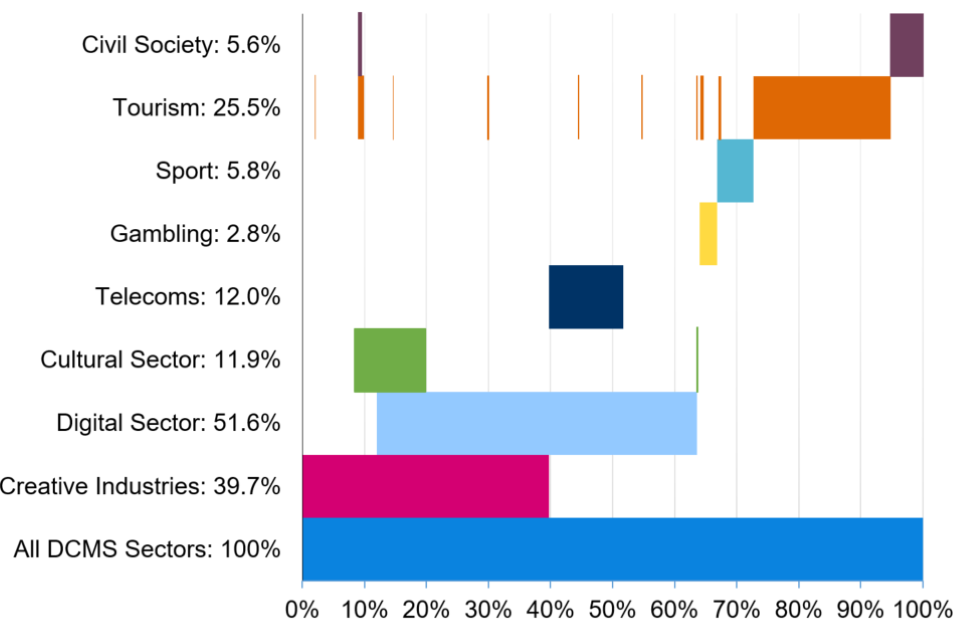
A bar chart showing the proportion of national DCMS GVA for each sector, and the proportion of these sectors that overlap with one another.
Whilst sectors can overlap, subsectors within a sector are mutually exclusive.
For more information, Chapter 2 of the technical report visually outlines the overlap between SIC codes in DCMS sectors, but not the value of GVA within these overlaps.
4.3 Regions
We have adopted the new UK classification of International Territorial Levels (ITL) in place of the Nomenclature of Units for Territorial Statistics (NUTS) classification. This has not changed the names of regions, or the areas covered by them; it is simply a change to the codes used. Users should refer to the Open Geography Portal for more information on this change.
5. Further information
DCMS has developed a suite of economic estimates to understand the economic impact its sectors have on the UK economy. Upcoming work in the DCMS Economic Estimates series include:
- Business Demographics
- Employment
- Trade
For general enquiries contact: Department for Digital, Culture, Media and Sport, 100 Parliament Street, London, SW1A 2BQ or enquiries@dcms.gov.uk. For media enquiries contact: 020 7211 2210.
DCMS statisticians can also be followed on Twitter via @DCMSInsight.