SPI-M-O Chairs: Statement on COVID-19, 19 December 2021
Published 23 December 2021

© Crown copyright 2021
This publication is licensed under the terms of the Open Government Licence v3.0 except where otherwise stated. To view this licence, visit nationalarchives.gov.uk/doc/open-government-licence/version/3 or write to the Information Policy Team, The National Archives, Kew, London TW9 4DU, or email: psi@nationalarchives.gov.uk.
Where we have identified any third party copyright information you will need to obtain permission from the copyright holders concerned.
This publication is available at https://www.gov.uk/government/publications/spi-m-o-chairs-statement-on-covid-19-19-december-2021/spi-m-o-chairs-statement-on-covid-19-19-december-2021
SPI-M-O Chairs: Statement on COVID-19
Date: 19 December 2021
All probability statements are in line with the framework given in Annex.
Summary
1. Omicron is outcompeting delta in the UK very quickly. A key consideration for decision making is how to avert unsustainable pressure on health and care settings that might be created by a rapid, large wave of hospital admissions and occupancy.
2. Further modelling has been conducted at significant pace by academic groups from LSHTM and the University of Warwick to investigate further sensitivities to variation in omicron parameters and timing of possible measures. SPI-M-O chairs have collated this evidence and highlighted the key points that can and cannot be inferred from these additional analyses.
3. Several important parameters remain highly uncertain – these uncertainties are not going to resolve quickly. Different possible outcomes cannot be given prior probabilities, and decisions (either to do nothing or something) will therefore need to be made before these uncertainties are resolved.
4. Key sensitivities include omicron’s intrinsic severity, the realised severity, and the impact of boosters on the realised severity. These uncertainties and their implications for outcomes (infections, hospital admissions and occupancy, and deaths) means it is not possible to say which modelling scenarios are most likely. It is possible, however, to consider whether the impacts of a wave (both peak and total levels) of infections and hospitalisations are manageable or not under different scenarios for the timing of implementation of mitigating measures.
5. If the coming wave rises comparatively slowly, then a short intervention for, say, a few weeks’ can prolong the wave’s duration and reduce its peak so that admissions and hospital occupancy remain below levels that would compromise quality of care. The sooner such an intervention is implemented, the lower the pressures on health and care whilst it is in place and the more time is available to assess whether it has had sufficient impact.
6. It is also possible, however, that the coming wave will grow so fast that a short intervention cannot keep admissions and occupancy below a tolerable threshold. In these circumstances, enacting an intervention early would give time to detect whether such an intervention is insufficient to avoid a compromise of quality of care and adjust accordingly. If measures are implemented only later, “in an emergency”, when hospitals are already struggling, the measures would need to be in place for longer and might be too late to avert very high admissions (and hence hospital occupancy) for an extended period with associated compromises in the quality of care.
The intrinsic and realised severity of omicron is unknown
7. Intrinsic severity considers how many people would go into hospital in two groups with individuals matched in every way (vaccine status, prior infection history, age) with the only difference being that one group is infected with omicron and the other with delta – this is very difficult to observe. Realised severity, by contrast, considers how many would go to hospital from two representative groups (not matched) that get infected, one group with omicron and the other with delta. If the group infected with omicron includes many more people who develop second infections and vaccine breakthroughs, it would be expected that many fewer of the omicron infections would go to hospital, and realised severity for omicron infections would be lower. If, however, the group infected with omicron experienced many more infections in older people because of omicron’s vaccine escape, realised severity could in contrast be higher in the omicron group. Furthermore, even if realised severity is lower, the total number of hospitalisations could be larger if any increase in number of infected people was proportionately larger than the reduction in realised severity.
8. Academic groups have approached the modelling of omicron severity in two different ways. LSHTM assume that omicron’s intrinsic severity is the same as delta’s. As shown below, this leads to realised severity that is roughly halved in younger age groups with a smaller fall in older age groups. Note the different scales on the y axis for each age group.
Figure 1: Realised severity in LSHTM modelling: infection hospitalisation ratio by SARS-CoV-2 variant (Delta and Omicron) and age group for England. Note the different scales on the y axis for each age group.
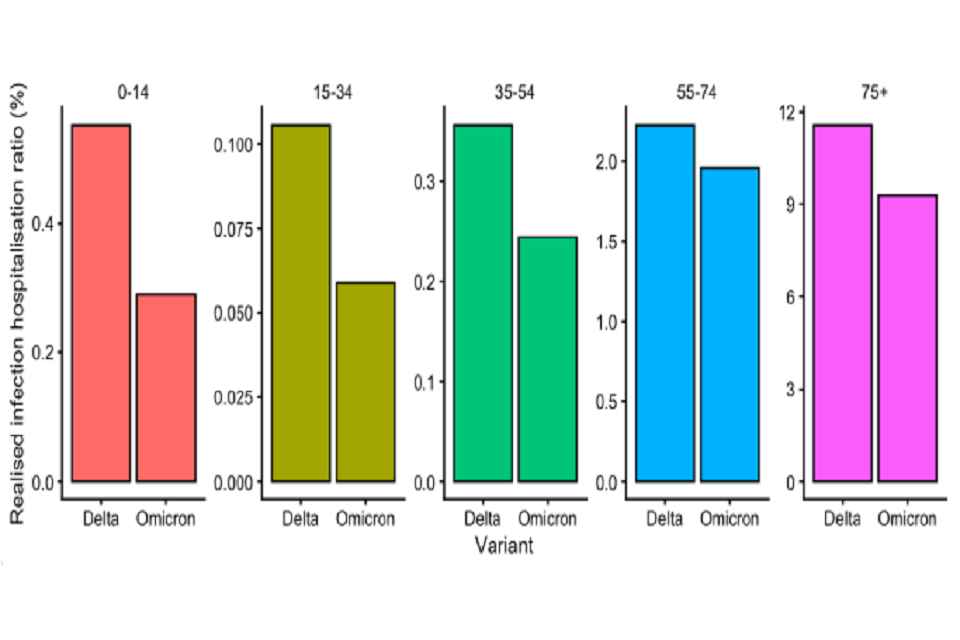
Five bar charts showing the estimated proportion of omicron infections which are hospitalised is lower than that for delta across all age groups. Infection hospitalisation rates are significantly higher for those aged 75+ and lowest for those aged 15-34.
9. Warwick varies both the intrinsic severity of omicron and vaccine effectiveness to produce four different levels which they label “severity”. For example, “50 per cent severity” in Warwick’s analyses could be caused by either omicron leading to 50 per cent intrinsically less severe infections than delta, or the vaccine protection could increase to half-way between 100 per cent effectiveness against severe disease and the omicron baseline [85 per cent], or some combination of these two.
10. Notice that in the 100 per cent severity scenario, about twice as many people progress from infection to hospital in a winter omicron wave than have done during a summer and autumn delta wave (that is the realised severity for omicron is higher, even though the assumed level of intrinsic severity are the same for delta and omicron in this scenario). This is because the winter omicron wave assumes a change broadly equivalent to a vaccine effectiveness drop that effectively doubles the susceptible population available to omicron, including many elderly people who are well protected by vaccines against delta.
11. The figure below shows realised severity for omicron and delta in Warwick’s modelling under these different parameter combinations and three omicron NPI scenarios (20 per cent: highly effective Plan B; 60 per cent: approximately equivalent to estimated impact seen in Step 2 of the Roadmap; 100 per cent: approximately equivalent to estimated impact seen in Step 1 of the Roadmap). Please note that these are proportions, and not absolute numbers of hospitalisations. As such, it should not be interpreted as showing a similar number of hospital admissions across differing NPI scenarios.
Figure 2: Realised severity in Warwick modelling: infection hospitalisation ratio (IHR) for delta and omicron SARS-CoV-2 infections in the UK across four severity scenarios for omicron (10 per cent, 20 per cent, 50 per cent and 100 per cent that of delta) and three omicron NPI scenarios (20 per cent: highly effective Plan B; 60 per cent: approximately equivalent to estimated impact seen in Step 2 of the Roadmap; 100 per cent: approximately equivalent to estimated impact seen in Step 1 of the Roadmap). This compares the estimated IHR for delta infections between July and November 2021, with that modelled for omicron between December 2021 and April 2022. Please note that these are proportions, and not absolute numbers.
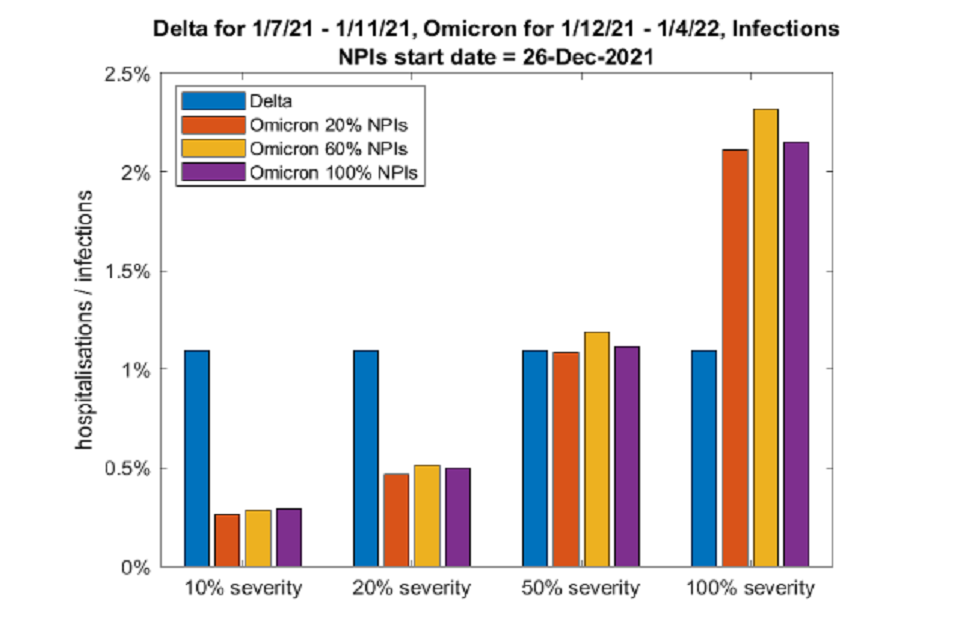
Bar graph showing the estimated proportion of omicron infections which are hospitalised (IHR) rises with omicron’s assumed level of severity. Omicron and delta IHR are similar when omicron severity is assumed to be 50% of delta.
12. Even if omicron’s severity is 20 per cent that of delta (set of bars second from left), Warwick’s trajectories suggest there would still be waves of hospitalisations that would put the NHS under pressure without further measures (confidence interval of 3,000 to 9,000 peak daily hospital admissions in England – see Annex B). If intrinsic severity is that low, then the transmissibility of omicron must be much higher to account for the observed growth rate in omicron, and so would still lead to large numbers of hospitalisations.
Length of stay
13. Modelling from Warwick and LSHTM has used the most recent available data on length of stay in hospital in their analyses. These data remain very similar, with no significant difference in current estimates of length of stay to those for January 2021.
14. Reductions in hospital length of stay for an omicron wave would affect the hospital occupancy scenarios, but the health and care system would still have the same number of people needing to be admitted on any given day. A reduced length of stay would allow more capacity within hospitals to manage this, and, to a first approximation, this would scale linearly with the change, for example halving the length of stay would permit double the admissions.
15. Any use of antiviral treatments or change in treatment plans, for example treating more COVID-19 patients in their own homes, would also approximately scale these exponential increases in hospitalisations linearly – subject to any secondary impacts on behaviour or nosocomial transmission.
Timing of interventions
16. Both modelling groups considered the impact of a short intervention that slowed transmission thus allowing more booster doses to be delivered and decreasing the height of the peak in admissions and occupancy. Both groups compare interventions starting on either 19 or 26 December 2021 and finishing on 15 January 2022. LSHTM look at an intervention equivalent to Step 1 (of the Roadmap) with a return to Plan B measures until the end of April 2022. Warwick consider two different types – one equivalent to Step 1 and another equivalent to Step 2 – both with a return to pre-Plan B behaviour.
17. If the coming wave rises comparatively slowly (Annex A: Figure 3a and Annex B: first and second columns of Figure 4) then a short intervention (for example a circuit breaker of a few weeks’ duration) can prolong the wave’s duration and reduce its peak so that admissions and hospital occupancy remain below levels that would compromise quality of care (Annex A Figures 3b and c, or Annex B first and second columns of second and third rows in Figure 4). The sooner such an intervention is implemented, the lower the pressures on health and care whilst it is in place and the more time is available to assess if it has sufficient impact.
18. It is also possible, however, that the coming wave will grow so fast that a short intervention cannot keep admissions and occupancy below a tolerable threshold. In these circumstances (Annex A: Figures 3d to l, and Annex B: third and fourth columns of Figure 4), enacting an intervention early would give time to detect that it is insufficient to avoid a compromise of quality of care and adjust accordingly. If measures are implemented only later, “in an emergency”, when hospitals are already struggling, the measures would need to be in place for longer and might be too late to avert very high admissions (and hence hospital occupancy) for an extended period with associated compromises in the quality of care.
19. In general, a short sharp intervention reduces total numbers of admissions by a little over 10 per cent in these modelled scenarios. Although admissions are much lower whilst the intervention is in place, once the exit wave is considered, the (significant) benefit is largely in the timing of admissions, not their total number. [footnote 1]
20. These models assume that measures change transmission rates immediately. There is no guarantee of this happening, and if behaviour change is slower at the start, this could lead to higher peaks than those presented. Conversely, behaviour on release of any intervention may also take a longer time to return to normal. It is also possible that, if assumptions about intrinsic severity of omicron infections are at the higher, more optimistic end of plausibility, then earlier intervention could make a greater difference in reducing the peak height (just under half).
21. This difference of impact of measures is partly a question of where omicron’s growth advantage relative to delta is primarily derived from: increased transmissibility or immune escape. If omicron has lower immune escape, the transmissibility of omicron must be higher to remain consistent with observed growth rates, and the greater the difference interventions will have. Again, this remains unknown.
22. The scale of uncertainty remains large, with models currently fitting to the current observed growth rates of omicron. As a result, relying on the precise, quantitative results is not recommended. Where models agree in terms of relative differences, such as qualitative results, that conclusion is more robust.
23. Data over the Christmas period will also be significantly disrupted. Testing behaviours (and capacity in the system) may already be affecting signals in cases; and data over the Christmas period itself will be of lower quality and coverage, including hospitalisation data as occupancy increases. Delaying decisions on interventions may not mean any more evidence has accumulated over this period.
Annex A: Different intervention timings on infections, hospital admissions and occupancy, and deaths under different assumptions – LSHTM
Figures 3a to l: Estimated infection incidence, hospital admissions, hospital occupancy and deaths in England under different assumptions in LSHTM’s model. Each triplet of four panels shows the epidemic trajectory under no further control measures (left column), or an intervention equivalent to Step 1 of the Roadmap from 19 December 2021 (central column) or 26 December 2021 (right column), after which there is a return to Plan B measures until the end of April 2022. This is considered for four scenarios for booster effectiveness and immune escape, where: Bst high = high booster effectiveness assumptions; Bst low= low booster effectiveness assumptions; Esc high = high immune escape assumptions; Esc low = low immune escape assumptions. In each panel, the dashed horizontal line shows the previous peak reached during the January 2021 wave in England; the shaded areas show 50 per cent and 90 per cent quantiles across each day, while the small triangles demarcate peaks from each of 50 individual model runs reached between 1 December 2021 and 30 April 2022. Numbers in overlays show the median and 95 per cent projection intervals for total infections, hospital admissions, occupancy or deaths between 1 December 2021 and 30 April 2022.
Panels 3a, b and c: High booster effectiveness and low vaccine escape
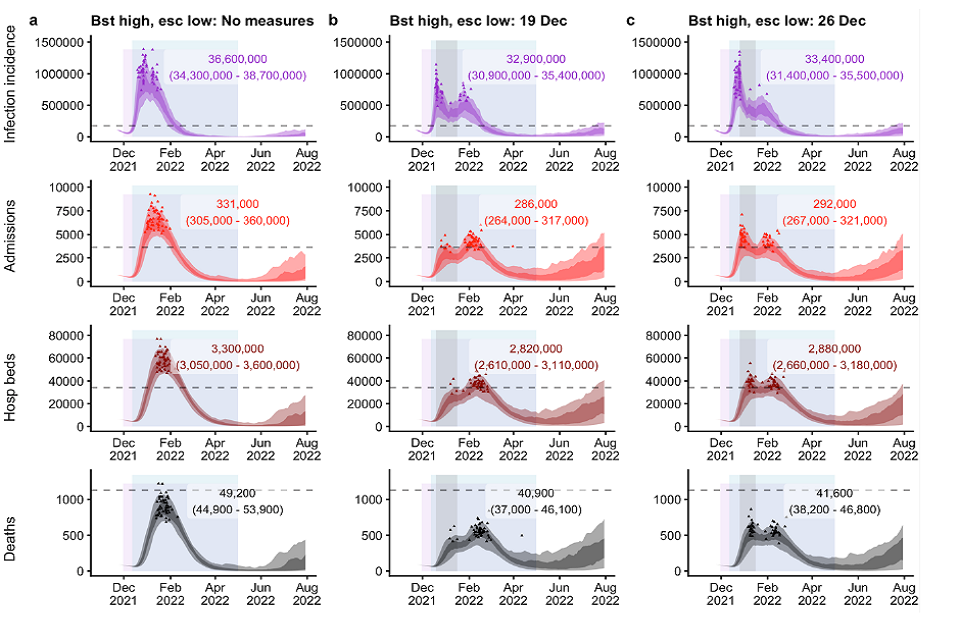
Twelve fan charts showing earlier implementation of NPIs leads to lower estimated total incidence, admissions, occupancy and deaths. This also applies to 3d-l. Besides deaths, projected peaks in NPI scenarios are similar to or breach Jan21 peaks
Panels 3d, e and f: High booster effectiveness and high vaccine escape
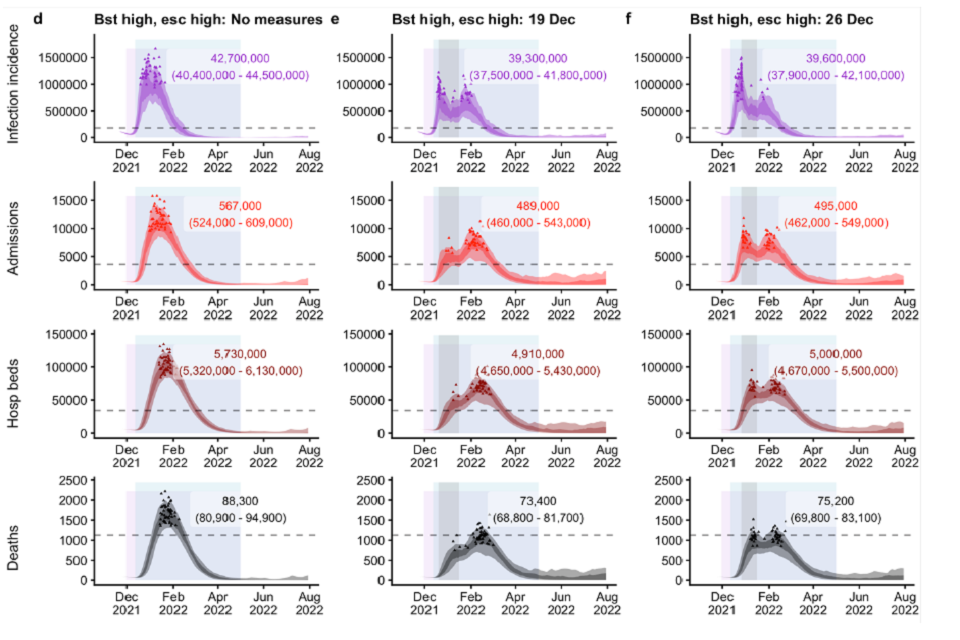
See 3a-c alt text, plus: twelve fan charts showing projected peaks of incidence, admissions, occupancy and deaths are similar to or breach Jan21 peaks. Estimated peaks and totals are higher than in panels 3a-c (Bst high Esc low).
Panels 3g, h and i: Low booster effectiveness and low vaccine escape
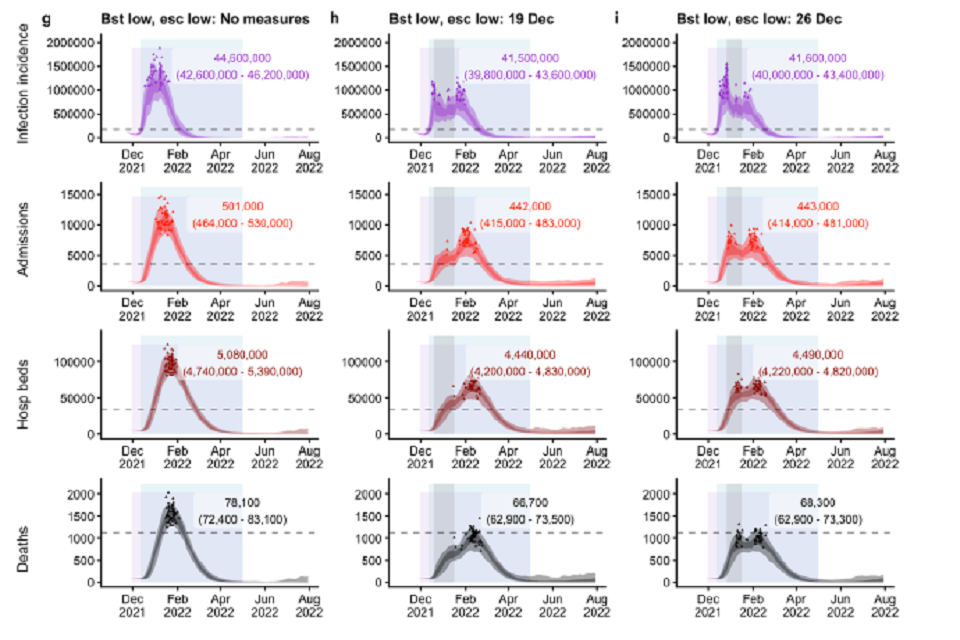
See 3a-c alt text, plus: twelve fan charts showing projected peaks of incidence, admissions, occupancy and deaths are similar to or breach Jan21 peaks. Estimated totals are between those in panels 3a-c and 3d-f, other than infections which exceed both.
Panels 3j, k and l: Low booster effectiveness and high vaccine escape
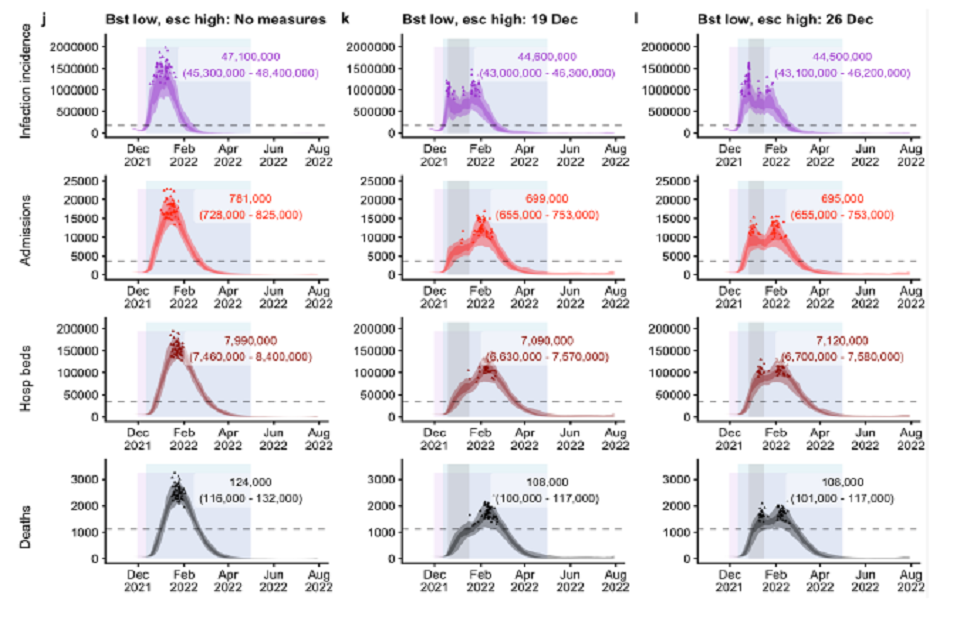
See 3a-c alt text, plus: twelve line charts showing projected projected peaks of incidence, admissions, occupancy and deaths are similar to or breach Jan21 peaks. Estimated peaks and totals are the highest across all four booster eff/escape combinations.
Annex B: Different intervention timings on hospital admissions under different assumptions – University of Warwick
Figure 4: Projections of hospital admissions in England in Warwick’s model, given different NPI implementations in each row (20 per cent: highly effective Plan B; 60 per cent: approximately equivalent to estimated impact seen in Step 2 of the Roadmap; 100 per cent: approximately equivalent to estimated impact seen in Step 1 of the Roadmap) across different severity profiles of omicron in each column (10 per cent, 20 per cent, 50 per cent and 100 per cent that of Delta). There are four scenarios within each plot in which the NPIs are implemented from 19 December 2021 (blue); 26 December 2021 (orange); 3rd January 2022 (yellow) or 10 January 2022 (purple). These NPIs are in place until 15 January 2022 (vertical line in each panel), after which behaviour returns to pre-Plan B. Note the different scales for the y-axis in each column.
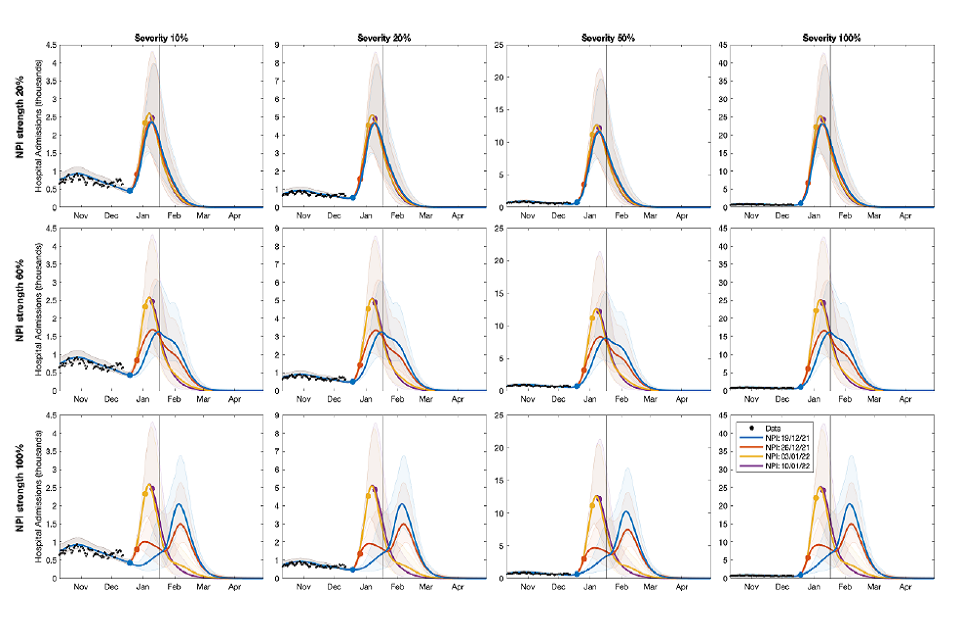
Twelve line charts showing stronger and faster NPI scenarios have lower projected admission peaks during interventions, though “100%” NPIs can result in an exit wave of admissions. Peak size increases proportionately with severity.
Annex C: Assumptions made by LSHTM and Warwick
| Assumption | Warwick [range across scenarios] | LSHTM [range across scenarios] | Remarks |
|---|---|---|---|
| Transmission advantage of omicron over delta | 2- to 4-fold more than delta | Previous assumptions (in pre-print): 5 to 10 per cent less than delta (high escape); 30 to 35 per cent more than delta (low escape). New assumptions: 40 to 45 per cent more than delta (high escape); 100 to 105 per cent more than delta (low escape). | Both models are fitted to observed growth in SGTF. Growth advantage (rather than transmission advantage) can be derived from a combination of transmission and immune escape. Warwick assumes relatively more transmission advantage than LSHTM, but both groups’ combination of assumptions fit to current data. We do not know yet the relative contributions of these two factors to growth advantage. LSHTM’s new assumptions are based on omicron’s growth in reality outpacing their earlier modelling and are being actively investigated. |
| Intrinsic severity of omicron vs. delta | As delta, although sensitivities investigate down to just 10 per cent as severe (which could also come from higher protection from boosters). See remarks on “Efficacy to prevent severe disease (after booster)” | As delta | Omicron may appear to have lower severity as a result of protection due to prior infection or vaccination. Apparent decreased severity may not correspond to intrinsically lower severity. In the absence of any robust evidence, modelling assumes intrinsic severity is unchanged. While other signals of omicron’s properties are being observed in data, there is no evidence for intrinsically lower severity |
| Vaccine (booster) take-up | Of those eligible (had 2nd doses over 3 months ago): 95 per cent in over 70s; 90 per cent in 50 to 69; 80 per cent in 18 to 49. Does not model the clinically vulnerable groups as a separate class | Of those eligible (had 2nd doses): 95 per cent in over 50s; 85 per cent in 18 to 49. Sensitivity analysis considers 0 per cent, 50 per cent, 99 per cent. Assumes booster rollout is perfectly efficient (oldest to youngest age groups Does not model the clinically vulnerable groups as a separate class | |
| Rollout speed | Data where available (up to 12th Dec), then 6 million boosters per week (850k per day) going forwards. | 500k boosters per day from 15 Dec, with sensitivities run for 200k and 350k per day (in pre- print). 1 million boosters per day from 15 Dec (in update) | |
| Efficacy to prevent infection (after booster) | Delta: 88 per cent. Omicron: 60 per cent. Assumes booster is long-lasting (wanes over multi-year timescale). | Delta: 91.4 per cent or 95.9 per cent (booster low or high). Omicron (low escape): 65.9 per cent or 79.2 per cent. Omicron (high escape): 44.1 per cent or 60.4 per cent | A full table of LSHTM’s VE assumptions, and explanation of how they were derived, are in their pre-print. Warwick’s slides, as tabled under SAGE 99, show their assumptions against results of published UKHSA studies. |
| Efficacy to prevent symptomatic disease (after booster) | Delta: 92 per cent .Omicron: 71 per cent | Delta: 91.9 per cent or 96.1 per cent (booster low or high). Omicron (low escape) 67.6 per cent or 80.3 per cent. Omicron (high escape) 46.9 per cent or 62.3 per cent | |
| Efficacy to prevent severe disease (after booster) | Delta: 96 per cent. Omicron: 85 per cent (see remarks) | Delta: 99.0 per cent or 99.6 per cent (booster low or high). Omicron (low escape): 93.3 per cent or 96.9 per cent. Omicron (high escape): 83.7 per cent or 91.4 per cent | Warwick scales estimated protection for delta to produce its estimates for omicron; 85 per cent is the 100 per cent severity assumption. This may be pessimistic for severe disease. Warwick therefore explores a range of severity levels for omicron, rescaling admissions and deaths by a given factor. At 50 per cent severity, either omicron could cause 50 per cent less severe infections than delta or the vaccine protection could increase to 92.5 per cent, or a combination of the two. Thus the table in the SAGE 99 SPI-M-O Consensus Statement uses 20 per cent to 50 per cent severity scenarios (such as more optimistic VE assumptions for severe disease). |
| Cross-immunity [delta-omicron] | 90 per cent protection against omicron from past infection with delta | Low escape 44.1 per cent High escape 24.1 per cent | Both models are fitted to observed growth in SGTF. Growth advantage can be derived from a combination of transmission and immune escape. LSHTM assumes relatively more immune escape than Warwick. LSHTM assume that individuals in the recovered disease state who have previously been infected with SARS-CoV-2 have the same level of protection against omicron as individuals who have received two doses of Pfizer or Moderna. |
| Cross-immunity [omicron-delta] | 100 per cent for recent infections | 100 per cent for recent infections | |
| Waning of immunity [omicron and delta] | Immunity from 2 doses wanes over approximately 1 year (for both omicron and delta). Immunity from boosters and infection wanes over approximately six years (for both omicron and delta) | If the individual is not boosted, immunity from 2 doses wanes to a lower level after 6 months (omicron and delta), then wanes completely after six years. Booster immunity lasts for 6 months. Immunity from natural infection wanes over approximately six years. | All models assume waning of booster protection against omicron is the same speed as that after dose 2. If booster protection wanes rapidly then this may be overly optimistic. |
| Vaccine reduction in onward transmission if infected | Delta: 30 per cent Omicron: 10 per cent | Delta: 37 per cent Omicron: 37 per cent | |
| Assumptions about voluntary behaviour | None – model estimates recent behaviour from the epidemic data, but does not attempt to predict how individuals will change their behaviour in response to perceived risk. | None – model estimates recent behaviour from the epidemic data, but does not attempt to predict how individuals will change their behaviour in response to perceived risk. | Behaviour change (spontaneous, recommended, or mandated) could significantly affect the peak of infections and hospitalisations, in either direction. This modelling assumes no change in behaviours beyond those previously seen on imposition of equivalent measures in the past. It is not possible for models to exactly reflect how people will behave as this depends on a multitude of factors, both at population and individual levels. |
| Seasonality and school holidays | Seasonality: 10 per cent peak to trough School holidays reduce mixing between school-aged pupils, and slightly increase mixing between pupils and other age- groups. Christmas holidays may also dramatically shift the age-based mixing patterns, with less mixing of working individuals but more cross-generational mixing – this is not included in the model. | Seasonality: 20 per cent peak to trough | All models assume school closure / associated reduction in mixing for Christmas break |
| Omicron growth rate | 0.35 (0.32 to 0.40 in different NHS regions). = per cent growth rate per day of 42 per cent (38 per cent- 49 per cent in different NHS regions). | 0.32 updated | Warwick’s estimated growth rate is faster than LSHTM estimated in their pre-print, which was fitted to the proportion of community cases in England with omicron up to 5 December 2021. From subsequent data, it is evident that England is further ahead in the epidemic than originally estimated. The updated modelling has been re-fitted using earlier seeding and a 50 per cent higher growth rate. Given extremely rapid doubling time and exponential growth, results are very sensitive to small changes in these assumptions. LSHTM’s (updated) results are therefore more pessimistic. Both these growth rates are slower than the estimated doubling time of two days (where per cent growth rate per day would be 50 per cent). NB that for small values, the growth rate of a disease will roughly approximate the percentage growth in the number of cases per day but this is no longer the case for growth rates as estimated for omicron. An explanation of this can be found at Plus magazine. |
-
These scenarios assume that the interventions are fully lifted in mid-January, with a return to Plan B (LSHTM) or pre-Plan B behaviour. A more gradual change or longer duration of measures would likely reduce the size of any exit wave ↩