Adult skills gap and the falling investment in adults with low qualifications (HTML)
Published 29 January 2019

© Crown copyright 2019
This publication is licensed under the terms of the Open Government Licence v3.0 except where otherwise stated. To view this licence, visit nationalarchives.gov.uk/doc/open-government-licence/version/3 or write to the Information Policy Team, The National Archives, Kew, London TW9 4DU, or email: psi@nationalarchives.gov.uk.
Where we have identified any third party copyright information you will need to obtain permission from the copyright holders concerned.
This publication is available at https://www.gov.uk/government/publications/low-skilled-adults-are-missing-out-on-training-the-skills-gap/adult-skills-gap-and-the-falling-investment-in-adults-with-low-qualifications-html
1. Executive summary
Helping those from disadvantaged backgrounds to succeed remains high on the political agenda. Research by the Social Mobility Commission and others has found little improvement in social mobility in recent years and deep-seated regional inequalities still exist across Britain.
Britain’s low levels of social mobility has attracted considerable amounts of research with much of the attention focused on improving education and skills in young people.
However, a crucial and often overlooked area is adult skills. In 2017 the Commission found that the UK has an endemic low pay problem with just 1 in 6 low-paid workers (17%) managing to permanently escape from low pay in the last decade.[footnote 1] Meanwhile, a quarter of low-paid workers remained stuck in low pay jobs.
Low pay is mainly a low skill problem but the UK currently lags behind other countries in giving adults a second chance to get on. Compared to its main competitors, the UK spends relatively little on vocational skills and investment in labour market support to increase adult skill levels. Between 2010 to 2011 and 2015 to 2016, the government Adult Skills budget in England fell by 34% in real terms.[footnote 2]
If the labour market is to work for everyone, those with lower skills and qualifications need to be able to improve their career prospects and realise their ambitions. For this to become a reality, employers and government have to create opportunities for individuals through training and better career progression. The government’s National Retraining Scheme provides an opportunity to refocus the adult skills budget on those with lower skills and qualifications, in particular, anyone experiencing or risking their jobs being displaced by technology.
In this report, we look at the adult skills landscape – by examining who invests in, and who participates in, job-related training and education. We consider how these trends have changed over time and to what extent adult skills affect social mobility.
We uncover evidence that people from the lowest socio-economic backgrounds are the least likely to receive adult skills investment. First, there is growing evidence to suggest that those whose parents were working class are less likely to do training than if their parents were middle class – even though they are doing the same type of job. Second, employers are more likely to invest in those with higher skills while better-off individuals are also more likely to fund their own training. This results in widening existing skills gaps as people from working class backgrounds are less likely to have higher skills – and are less likely to earn high wages – than their peers from better off backgrounds.
Only state-funded training targets support to those from lower socio-economic backgrounds, but this makes up a tiny proportion of all training courses undertaken (around 7%). The gender training gap, at the headline level, has been closed.
Indeed, women may be more likely to participate in training – largely because a higher proportion of women than men work in the public sector, where the provision of training is higher than in the private sector.
We also found mixed evidence of the returns to investment in adult skills. Research consistently suggests that the highest qualifications tend to lead to the highest returns, that academic qualifications lead to higher returns than vocational ones at the same level, and that qualifications gained later in life tend to secure lower returns than the same qualifications earlier on. Adult skills provide second chances to individuals, but those who benefit most are overwhelmingly those who already have higher levels of adult skills.
1.1 Key findings
The poorest adults with the lowest qualifications are the least likely to access training – despite being the group who would benefit most. Graduates are over 3 times more likely to participate in training than those with no qualifications (30% vs. 8% in 2017), and previous research has shown half (49%) of adults from the lowest socioeconomic groups have received no training since leaving school.
Almost twice as many people in managerial, professional and associate professional occupations access training (30%) compared to those in intermediate (16%) or routine and manual occupations (18%).
Bigger companies with better developed HR strategies are also more likely to fund training than smaller companies, but employers are prioritising high-qualified workers in senior positions for skill investment.
Since 2010, the proportion of training funded by government decreased and employer funding stayed flat, leaving individuals to fund more of their own training.
About £44 billion was spent on training (excluding student loans) in 2013/14 with most training (82%) provided by employers and much of the rest by individuals. The Government only funds 7% of all investment in adult skills and in 2016 to 2017 over £63 million of the adult training budget was unspent. UK spend on vocational training per employee was half the EU average.
The public sector is more likely to provide training than the private sector (in 2017, 36% of public sector workers participated in training compared to 19% in the private sector).
Men in routine and manual occupations were the least likely group to have done training regardless of age.
In 2017, more women than men undertook training (26% versus 21%), more people from Black and Black British ethnic backgrounds than from white backgrounds (32% compared to 23%), and more younger than older people (25% of 25 to 29 year olds compared to 17% of 60 to 64 year olds).
Adults whose parents worked in professional or managerial occupations are more likely to participate in training, no matter what their own occupation is, than those whose parents worked in lower-skilled occupations. This is because children of high-skilled parents are more likely to be high-qualified and in high-skilled jobs themselves, both of which increase access to training.
1.2 An action plan
This report shows there is a ‘virtuous’ and a ‘vicious’ cycle of learning, whereby those with the lowest or no qualifications are much less likely to get education and training and the highest qualified are likely to receive the most. This urgently needs to be reversed through a focus from employers and government on supporting those with low or no qualifications, those in the lowest skilled occupations, and those in the lowest socioeconomic groups.
Improving the social mobility impact of training will need 3 key changes:
- Increased employer spend on lower-skilled, low-paid workers
- Government support for increased availability of, and access to, free courses for those who cannot pay themselves
- Increased quality of training in terms of earning gains, and improved careers education, information, advice and guidance
Employers should seek to understand and address disparities in their training investment, and consider better work progression pathways by:
-
Improving the level and flow of skills within the business by developing workforce skills to help career progression, with a focus on those in low skilled roles.
-
Investing in the skills of the unemployed and economically inactive people in their local areas to increase the skills supply into businesses.
Government should increase the availability, accessibility and quality of training for adults who need it most by:
-
Increasing spending on education and training to bring it closer to that of international competitors, for example, to comparable expenditure levels of GDP, prioritising this extra financial support for those with no/low skills and qualifications.
-
Ring-fencing National Retraining Scheme funds for the groups who are shown receive the lowest investment, including low-paid and/or low-skilled people who are self- employed and men in routine, manual roles (particularly older men).
-
Reducing underspend of the Adult Skills budget via more flexible rules, including more digital and distance learning and flexibility in any underspend of the apprenticeship levy so that it can support shorter courses for low-skilled workers.
Government should also improve the quality of information available on adult skills, training and careers by:
-
Improving monitoring of government-funded and government-managed training provision for the take-up by, and impact on, those with low or no qualifications, those in lower level occupations and those in low socioeconomic groups, to inform evidence and to learn what works.
-
Investing in research on the impact of investing in training on longer-term social mobility outcomes to help individuals make informed choices about their training, using this to improve careers education, information, advice and guidance for adults.
2. Introduction
Warwick University Institute for Employment Research was commissioned by the Social Mobility Commission to undertake research into adult skills and social mobility.
2.1 Aims and objectives
The main aims of this research are to explore:
- How are adult skills defined and what is included in this definition in the scope of this report?
- Who invests in adult skills in the UK, and how has this changed over time?
- What characteristics affect the decision to invest in adult skills?
- How do adult skills affect socioeconomic outcomes?
- How do the findings inform policy goals of improving social mobility, in light of the government agenda of this Parliament, and longer-term changes to jobs and skills, and any recommendations about measuring and monitoring data going forward?
2.2 Research context
Social mobility in Britain is high on the political agenda. The State of the Nation 2017 report highlighted deep regional inequalities cross-cutting Britain. This revealed a stark postcode lottery where the opportunities and life chances of people from disadvantaged backgrounds is bound by where they live.[footnote 3] Research by the Commission and others has found that Britain has an ongoing ‘social mobility problem’[footnote 4] that has attracted considerable research and proposed solutions. At present, some of the main questions being asked focus on the relationship between the adult education agenda and social mobility, and include the following:
- Intergenerational movements: what are the odds that someone can end up in a higher class position (destination) than their parents’ class position (origin)?
- Intragenerational movements: what are the chances of someone ending up in a higher position than that they started from?
- What are the chances of access to professional occupations and elite universities for people from different backgrounds?[footnote 5]
- How do these issues vary with geography, sex, health, ethnicity, and other characteristics?
- What can be done to improve social mobility and life chances for people?
Education has often been seen as a vehicle for social mobility, but its effectiveness has been questioned. In this report, we focus on looking at who invests in adult skills, how this has changed over time, and whether investment in adult skills has any measurable impact on social mobility. We explain how we approach these issues below.
2.3 Data, definitions and methodology
The exploratory research in this report focuses on whether individuals’ investment in adult skills varies with their socio-economic background, and the kinds of outcomes that can result.
Data
The analysis is based on 2 main datasets, the Labour Force Survey (LFS) and Understanding Society (UKHLS). The Quarterly Labour Force Survey is a survey of randomly-selected households. It has been carried out since 1992, although the quarters used in the Survey shifted from seasonal to calendar basis in 2006. There are roughly 90,000 individuals in each LFS quarterly survey, of whom about half are economically active. From the July to September 2014 quarter, the LFS included a new module on social mobility, which asks who the main wage earner was when the respondent was aged 14, and what occupation the main wage earner did. However, this question module only appears in the third (July to September) quarter, and is not available in the Annual Population Survey.
Understanding Society (UKHLS) is a longitudinal panel survey which follows a sample of the UK population since 2009 and incorporates the British Household Panel Study (BHPS, a similar longitudinal study, which started in 1991). Understanding Society contains over 40,000 households or over 100,000 individuals, with around 50,000 interviews with adults (aged 16+). The BHPS is considerably smaller, with roughly 5,000 households and 10,000 individual adult interviews. UKHLS waves 1 to 7 cover the period 2009 to 2016. Its design means that it is possible to look at variation in the decisions to invest in adult skills and in outcomes by sub-group, and to look at geographic region in more detail (England, Scotland, Wales, Northern Ireland) than would have been the case if the BHPS data had been used.[footnote 6]
Definitions
By adult skills, we mean the education and training that people undertake once they leave formal full-time education, although adult skills can of course be a much broader concept than that (for example, skills that people develop through a number of activities, such as childcare, voluntary work, and as part of their daily life). In this report, we focus on 2 main measures of adult skills: whether individuals have undertaken any job-related training or education in the last 3 months or in the last year, and whether individuals have gained any qualifications in the last 12 months. Specifically, we focus on whether individuals have undertaken education and training or gained qualifications themselves, rather than looking at whether employers have funded individuals’ access to adult skills.
Types of training include: induction training, health and safety training, as well as training to develop one’s skills, or for professional/occupational standards reasons. Training might also be categorised into on- and off-the-job, with the latter tending to be more formal, and tending to yield higher wage returns than the former. As we refer to the findings from other research, the definitions of education and training vary according to the source, as do the definitions of social groups.
When we talk about social mobility outcomes in this report, we focus more on intragenerational social mobility – the extent to which the life chances and outcomes of individuals are affected by their acquisition of skills and qualifications in their adult life, and the extent to which education and training enables people to increase their earnings and become upwardly socially mobile. We do also look at parental background – the occupations of the individuals’ parents when the individuals were children. We use 2 measures of social mobility: the 3-group National Statistics Socio- economic Classification (NS-SEC), and the gross monthly income in respondents’ main jobs. For more information about the NS-SEC, see Box 1.
2.4 Box 1: The NS-SEC
The NS-SEC is a socioeconomic classification to categorise people into social classes based on their occupation and labour relations. Introduced in 2000, it builds on the Goldthorpe Schema sociological classification of class and measures employment relations and conditions of occupations. In so doing, it shows the structure of socio-economic positions in modern societies (ONS, 2010).
The main employment relations distinctions are between employers, employees, and the self-employed, and employees can be further classified by employment regulations such as: a service relationship (salary, career advancement, benefits), a labour contract (labour exchanged for a wage based on work done or time expended), or a hybrid, intermediate type of relationship. Further distinctions are made in terms of company size. The table below shows how the 8- 5- and 3-class NS-SECs are related to each other. In this report, we use the 3-group NS-SEC: whether someone is working in the managerial or professional occupations, intermediate occupations, or routine occupations. Note that the NS-SEC aims to describe employment relations and not skill levels (as is the case with the SOC).
2.5 NS-SEC classes
8-class
- Higher managerial, administrative and professional occupations
1.1 Large employers and higher managerial and administrative occupations
1.2 Higher professional occupations - Lower managerial, administrative and professional occupations
- Intermediate occupations
- Small employers and own account workers
- Lower supervisory and technical occupations
- Semi-routine occupations
- Routine occupations
- Never worked and long-term unemployed
5-class
- Higher managerial, administrative and professional occupations
- Intermediate occupations
- Small employers and own account workers
- Lower supervisory and technical occupations
- Semi-routine occupations
*Never worked and long-term unemployed
3-class
- Higher managerial, administrative and professional occupations
- Intermediate occupations
- Routine and manual occupations
*Never worked and long-term unemployed
Proportion of employed adults aged 25 to 64 in each NS-SEC class (2017, LFS)
- Higher managerial, administrative and professional occupations: 47%
- Intermediate occupations: 24%
- Routine and manual occupations: 29%
2.6 Methodology
We focus on adults aged 25 to 64 because younger adults are more likely to engage in full- time education, while people who are retired are less likely to engage in training and their socioeconomic status is harder to capture (socioeconomic status is typically linked to an occupation). We also focus on adults in employment, in part this is because the main measure used in the LFS is job-related training, but also because we would like to exclude any mandatory training programs that people who are claiming unemployment benefit may have to undertake or leisure courses which people take for their own personal pleasure.
Cross-sectional descriptive analysis is carried out to gain an understanding of the data, using the 2010 and 2017 Labour Force Surveys for July to September quarter. We then run a regression to see whether individuals’ investment in adult skills has changed over time, and what characteristics affect the decisions to invest in adult skills. See the technical annex for a more detailed discussion of our methodology.
We also include a discussion of the impact of investment in adult skills on social mobility and earnings from a range of existing research sources and summarise the main findings. We did attempt to investigate the effect of investment in adult skills (gaining training or a new qualification) on social mobility but encountered several problems in the data. A discussion of our approach is included in the technical annex. Moreover, we consider that, as there is an extensive research literature on the effect of undertaking training and gaining new qualifications on wages, discussing some of the most influential findings to date would provide a more balanced view, rather than conducting an additional study. The main contribution of our report is that we specifically look at the differences in adult skills investment, and their impact on social mobility, by socio- economic background.
The report starts with a short review of the main research on social background and investment in adult skills. First, we show who undertook training in 2010 and 2017 using the Labour Force Survey (LFS) 2010 and 2017 July to September quarters. Next, we look at how multiple factors affect the likelihood of participating in training using the LFS (and also analyse the UKHLS, details in the technical annex). We then bring together a range of recent research findings to discuss the impact of investing in adult skills on social mobility outcomes. The findings form the basis for the discussion and recommendations section. The conclusion summarises the main threads of the report and situates our findings in a broader policy context.
3. Who invests in adult skills?
3.1 Key findings
Around £44 billion was spent by employers, individuals and the government on training (excluding HE loans) in 2013 to 2014.
According to analysis of training expenditure, most training is funded by employers (82%) and individuals (9%).
Just 7% of training is funded by government. This tends to be provision targeted at those with lower/no qualifications and at those living in deprived areas.
Employer-funded provision tends to be from those organisations with better developed human resources and product marketing strategies, which are both linked to ‘good’ jobs.
Larger employers are more likely to invest in training than smaller employers (with fewer than 50 employees).
Public sector employers are more likely to invest in training than private sector employers.
3.2 Financial investment in adult skills
The financial investment in adult skills, including direct (such as training fees) and indirect (for example, lost earnings/production time) investment, is funded by individuals, employers, the state, and/or third sector organisations (TSOs).
In 2013 to 2014, direct employer funding of training[footnote 7] was estimated at £5.3 billion, and government funding (through the Department for Business, Innovation and Skills) amounted to around £3 billion (Figure 1).[footnote 8] Other government departments, particularly the Department for Work and Pensions, also fund training (estimated as £0.35 billion)[footnote 9] but these figures are not included in the diagram. European sources of funding (primarily the European Social Fund and European Regional Development Fund) totalled just over £0.7 billion.[footnote 10] The largest contribution by far is additional or indirect employer costs, which contribute an additional £31 billion to the funding of training. Overall, employers spent £36 billion in training in 2013 to 2014. Individuals’ expenditure in 2014 to 2015 was estimated to be at just under £4 billion (excluding loans). We assume that individual expenditure is a similar amount in 2013 to 2014, and add this to the amount in Figure 1 to get a sense of the total spend on training in that year.
Overall, the total spend on training illustrated in Figure 1 and including individuals’ expenditure roughly amounts to £44 bn. Of this, 82%was funded by employers (directly or indirectly), 7% by the government, 9% by individuals (including loans) and 2% by the EU.
Figure 1: Sources and scale of investment[footnote 11] in adult skills in England (£’000s) for 2013 to 2014
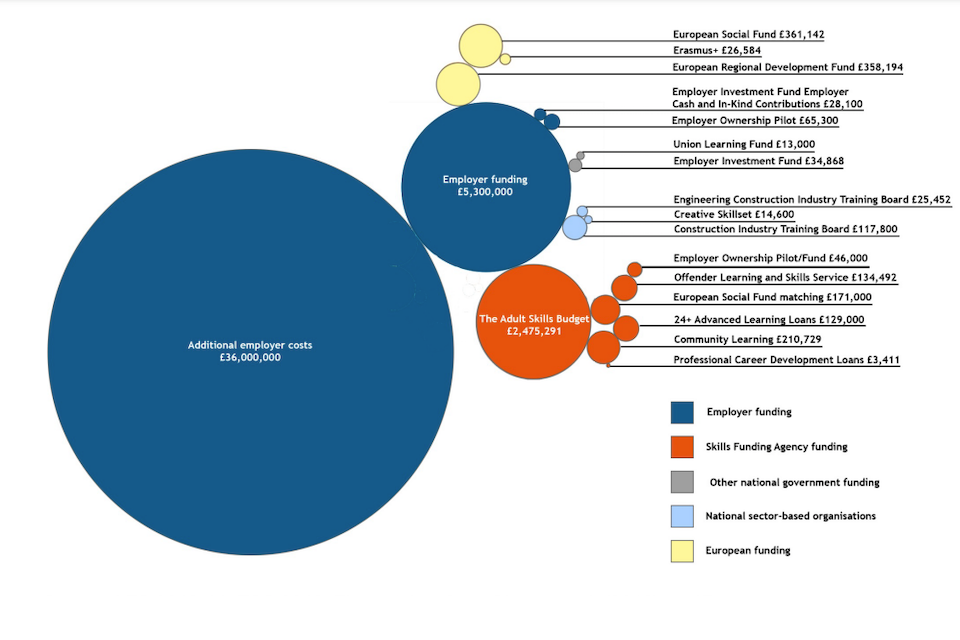
Source: LFS 2013 to 2014; ESS 2013, Figure taken from Gloster and others (2016), p.17.
3.3 Employers’ investment in adult skills
The breakdown of the employers’ £36 billion total investment is shown in Figure 2. Funding was split almost equally between off- and on-the- job training. The largest component of both of these types of training are trainees’ and trainers’ labour costs.
Figure 2: Overview of employer spend on training
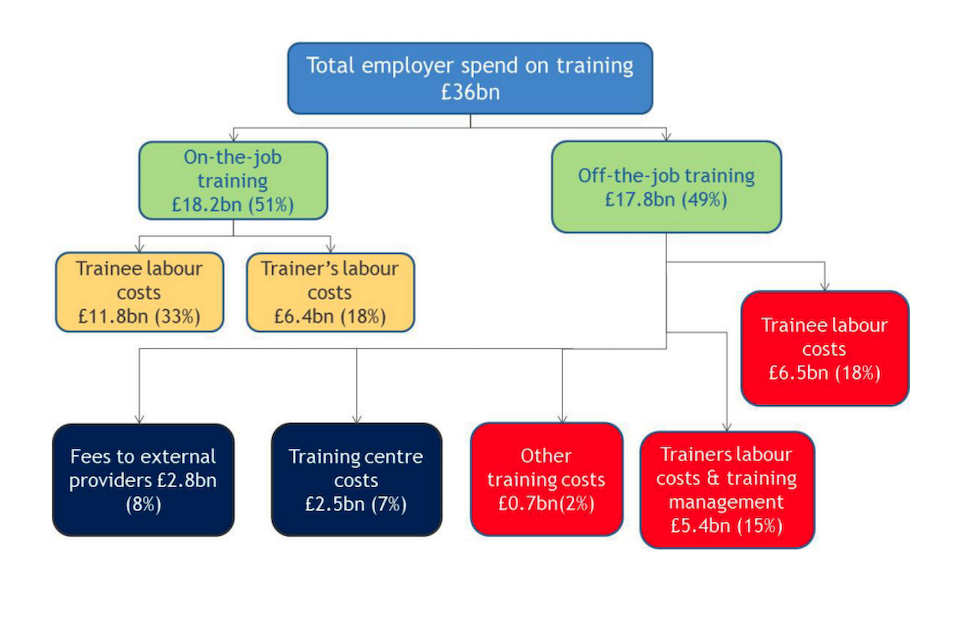
Source: Taken from Gloster and others (2016), p.19
The level of employer investment in training varies by sector, and is closely related to whether the organisation is public (where 84% of employers have funded or arranged employee training), third sector (82%) or private (71%, Employer Perspectives Survey, 2016).[footnote 12] Organisations who have recruited in the past 12 months are also much more likely to invest in staff training (89%) compared to those who had not (56%). Human resources practices are also closely related to training investment: 90% of those employers accredited with Investors in People funded staff training compared to 69% who were not. Organisations with a positive growth outlook are also more likely to fund staff training: 79% who expected the business to grow paid for employee training, compared to 60% of those who expected the business to contract or remain the same.
Private sector employers with a higher product market strategy[footnote 13] are much more likely to invest in staff training (Employer Skills Survey, 2015). Of those describing their business as having a high or very high product market strategy, 69% funded staff training compared to 54% with a low or very low product market strategy. Those with a high/very high product market strategy were also much more likely to fund off-the-job training (51% compared to 37%). The orientation of the business with regard to product market strategy, as well as management practices, are key components of strategies to address low productivity and wages, and address poverty.[footnote 14]
Whilst employer investment in skills training appears substantial, a number of studies have identified that, compared to its main competitors, the UK has relatively low spending on vocational skills[footnote 15] and that investment in labour market support that can increase adult skill levels.[footnote 16] The picture is somewhat complex. In general, a high proportion of UK firms provide training, although this proportion has declined over time. In 2015, 86% of UK enterprises provided continual vocational training (CVT) courses and other forms of CVT compared to the EU-28 average of 73%.[footnote 17],[footnote 18] In 2005, however, the proportions were 90% and 60% respectively (over the period 2005 to 2015 the proportion of UK firms providing training has fallen while the EU-28 average proportion has risen). Similarly, on a simple headcount basis, participation in adult education and training in the UK was above the EU-28 average in 2011 (16.3% vs. 9.1%) and in 2016 (14.1% vs. 10.8%), although the proportion in the EU-28 has risen, while that in the UK has fallen over the period. Moreover, these measures do not capture the quality or extent of the training.
In contrast, the proportion of employees accessing training was lower in the UK than in the EU. In 2015, only 30% of the UK’s employees received CVT compared to the EU average of 41% and this proportion is well below that of the other European G7 countries (France, Germany and Italy).[footnote 19] Moreover, this represents a decline for the UK since 2005. Whilst the proportion of employees receiving continual vocational training in the UK fell by 2.2 percentage points between 2005 to 2015, the proportion across the EU rose by 8 percentage points.
Furthermore, Figure 3 shows that the expenditure per employee on training courses is also much lower in the UK than the EU. In 2015, the amount spent per employee in the UK was just half of the EU-28 average (comparison in euro, down from 80% in 2005).[footnote 20] The amount spent per training participant in the UK was also below EU levels, around 2 thirds of the EU average in 2015 (68%, down from 82% in 2005). In addition, the UK spends less on vocational training as a proportion of the EU- 28 if the purchasing power standard exchange rate is used to adjust for the cost of living in different countries instead of euro.[footnote 21]
In addition to the measures discussed above, the UK is below the EU average on the following training-related measures: the proportion of GDP spent on education and training (see also Figure 4); the participation rate in education and training; the duration of formal training, and the level of training accessed.[footnote 22] This relative lack of investment manifests itself in the comparative skills of the British workforce. According to the OECD’s Survey of Adult Skills, 2013 to 2016, England is ranked 14th on literacy, 18th on numeracy and 10th on problem solving.[footnote 23]
Employer skills training, already at a low level by international standards, has remained broadly flat overall, and may have fallen slightly in real terms between 2011 and 2015 (see Table 1).[footnote 24] Total employer expenditure has fallen by an estimated 3% in real terms, the amount per person trained and per employee has also fallen by 19% and 6% respectively. Investment in management training has increased by 18% suggesting that training for most other categories of employees has fallen.
The picture across UK countries varies significantly. In Scotland, total employer spend on training increased by 24% and the amount per employee rose by 20%. In England, total employer skills training expenditure fell by 2% whilst spend by employee remained static. In Wales and Northern Ireland, however, both these amounts fell, and by larger amounts than in England.
Figure 3: Average expenditure on CVT courses per employee by enterprises in the EU-28, 2005 to 2015, euro[footnote 25]
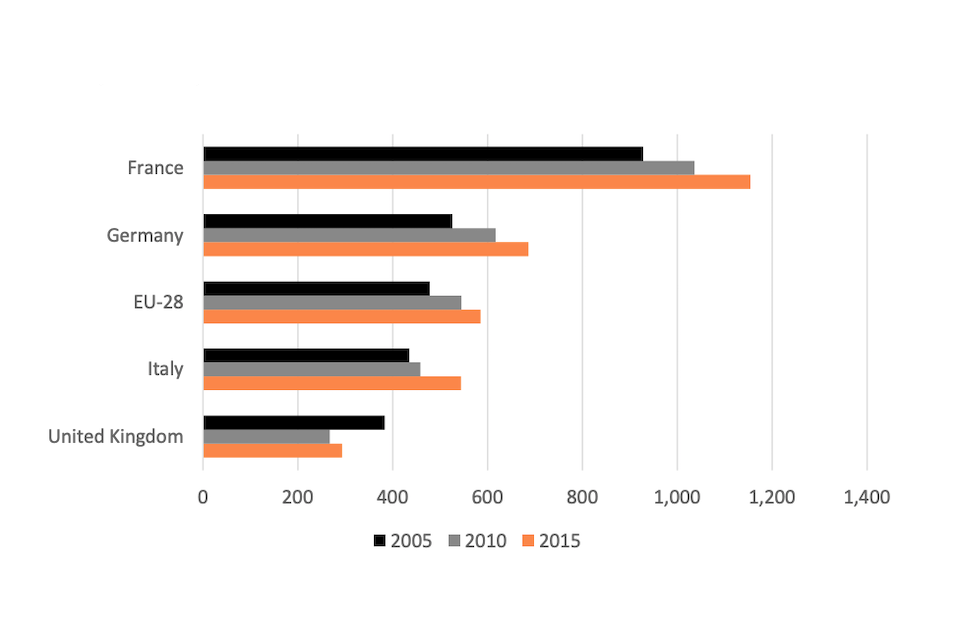
Source: Eurostat ‘Cost of CVT courses by type and size class - cost per person employed in all enterprises [trng_cvt_17s].’ Selected countries shown.
Table 1: Real terms spending by employers on skills by type of investment (UK), 2011 to 2015
| 2011 | 2013 | 2015 | Percentage change 2011 to 2015 | |
| Total (£ bn) | 46.8 | 44.4 | 45.4 | -3% |
| On job (£ bn) | 24.3 | 22.4 | 22.5 | -7% |
| Off job (£ bn) | 22.5 | 22.0 | 22.9 | 2% |
| Training cost minus wages/opportunity cost (£ bn) | 23.9 | 22.0 | 23.8 | 0% |
| Fees to external provider (£ bn) | 2.9 | 2.5 | 2.2 | -24% |
| Management training (£ bn) | 6.5 | 6.7 | 7.7 | 18% |
| Per person trained £ thousand) | 3.2 | 2.7 | 2.6 | -19% |
| Per employee (£ thousand) | 1.7 | 1.6 | 1.6 | -6% |
Source: Employer Skills Survey various years, taken from New Economy (2017)
3.4 Government investment in adult skills
The levels of government investment in adult skills in England seem to be decreasing over time. Broadly, since 2013 to 2014, some of the grant component of the Adult Skills Budget[footnote 26] has been replaced by loans – an example of shifting resources from the state to the private sector, so while the overall budget allocations are similar, the composition of the budget has moved away from government and towards individuals and employers.
The adult further education budget comprises the Adult Skills Budget (the majority of the adult further education allocations) and also smaller funding areas, such as the offender learning and skills service and community learning. The Adult Skills Budget fell by 34% in real terms (29% in cash terms) between 2010 to 2011 and 2015 to 2016.
From 2015 to 2016, the Adult Skills Budget excluding apprenticeships was combined with community learning and discretionary learner support to create the Adult Education Budget. This new Adult Education Budget is set to continue falling in real terms (remain at the same level in cash terms) between 2015 to 2016 to 2019 to 2020. In contrast, 19+ apprenticeships and advanced learner loans funding allocations are set to rise substantially. However, not all of these increases will be government funded. Part of the 19+ apprenticeships funding increases will come from employers (from 2017 to 2018 through the apprenticeship levy), while advanced learner loans will be mostly borne by individuals themselves.
In 2019 to 2020, the total adult further education and skills budget is planned to be £3.78bn, up from £2.94 billion in 2015 to 2016 and £3.18 billion in 2010 to 2011 (cash terms).[footnote 27] In cash terms, this represents an 8% fall between 2010 to 2011 and 2015 to 2016, and a 29% rise from 2015 to 2016 to 2019 to 2020. However, by 2019 to 2020, loans and apprenticeships will comprise around half of the total adult further education and skills budget, up from a third in 2010 to 2011. In 2019 to 2020, advanced learner loans are expected to constitute 13% of the budget compared to just 7% in 2015 to 2016. Apprenticeships for people aged 19+ are expected to increase from 25% of the budget in 2015 to 2016 to around 38% of the budget in 2019 to 2020.
It should also be noted that the government’s Adult Education Budget is not fully spent each year. In 2016 to 2017, for example, at least £63 million was unspent,[footnote 28] equivalent to around 5% of the total amount allocated.[footnote 29] Some of the budget was used to support further education colleges generally. A possible explanation for some of the underspend is that it may arise due to restrictions on how money can be spent and lower demand for college-based courses, as full-time workers cannot always access them.
In addition, there is a move to devolve the Adult Education Budget to Mayoral Combined Authorities in England from 2019 to 2020. Such a move would allow local areas to work more closely with other organisations such as local enterprise partnerships and respond to local needs. However, the funding formula for calculating the grants to local areas has not yet been developed, and no financial plans have yet been announced for the Adult Education Budget going forward from 2020 to 2021 onwards.
Government investment in training is also at comparatively low levels internationally. Comparing expenditure on training across countries is complicated due to differences in definitions and finding a comparable unit of measurement, therefore the analysis should be treated with caution. However, Figure 4 supports the argument that the UK tends to have internationally low levels of investment in skills. As a proportion of GDP, public expenditure on training in Great Britain was among the lowest of the G7 countries between 2004 to 2011, with only Japan at comparably low levels.
Figure 4: Public expenditure on training as a percentage of GDP, G7 countries, 2000 to 2016[footnote 30]
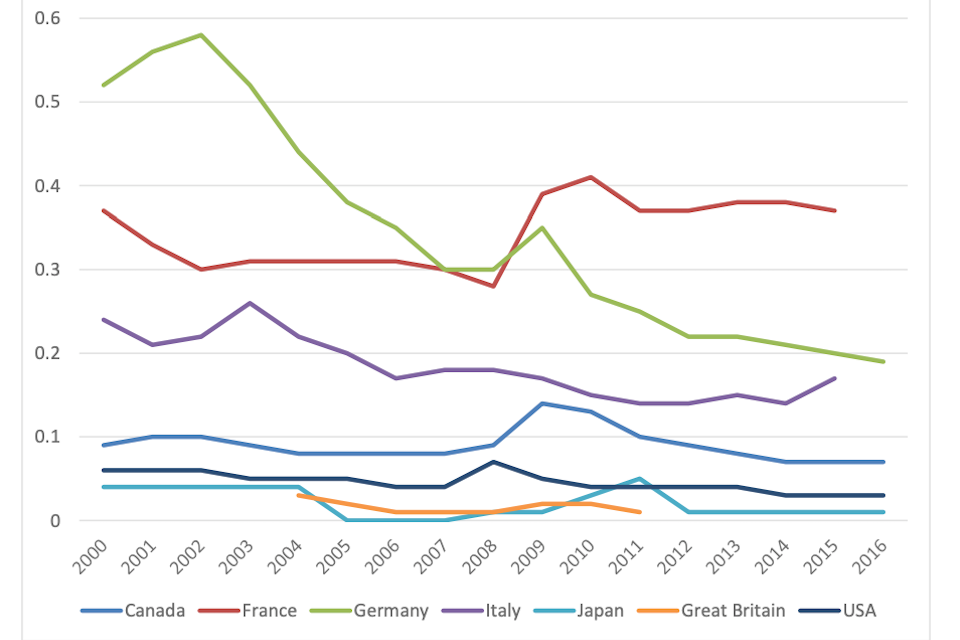
Source: OECD data 2000 to 2016
3.5 Individuals’ investment in and acquisition of adult skills
Most information about individuals’ financial investment in adult skills comes from data on learner loans. Several points have to be clarified before we discuss the data. First, any loans-based measure can only approximately measure individuals’ investment in adult skills, because it does not capture individuals’ private means spent on training or qualifications without taking out a loan – data on individuals’ own expenditure have to be found from other sources. Second, not all individuals will repay the full amount of their loans.[footnote 31] Regarding the largest component of individuals’ investments in adult skills, higher education loans, an estimated 83% of students will not repay the full amount, and if the amount outstanding is to be met by the government, this would contribute to the long-term government cost of higher education provision.[footnote 32] Third, higher education (HE) and further education (FE) are devolved policy areas, which means that each UK constituent country (England, Scotland, Wales and Northern Ireland) decides its own policy on providing and financing these systems. Most estimates of learner loans are based on data for England only. Third, the HE and FE loans systems have been under considerable change in recent years, which results in a complex set of criteria about who repays what and under what conditions. This makes it quite difficult to compare changes in individuals’ investments in adult skills over time.
Undergraduate HE loans make up the bulk of all HE loan figures. Masters loans were introduced in April 2016,[footnote 33] and doctoral loans will come into effect from August 2018.
[footnote 34] In England, the most recent change to the amount taken out in student loans came in 2012 to 2013, when new entrants to HE faced tuition fees of roughly £9,000, compared to earlier cohorts, whose tuition fees were roughly £3,000.[footnote 35]
FE loans were introduced in August 2013, and were available to those aged 24 or older, studying for qualifications at levels 3 and 4 (A-levels/equivalent and certificate of higher education/equivalent). From August 2016, FE loans were expanded to people aged 19 or older, and extended the range of qualifications to include levels 5 and 6 (diploma of higher education/foundation degree/equivalent and degree/equivalent respectively).[footnote 36]
An estimate of individuals’ investment in education and training in England was undertaken based on the National Adult Learning Survey (see below), and data from the higher education and further education loans companies in 2014 to 2015. Individuals’ expenditure in 2014 to 2015 was estimated to be at just under £4 billion, whilst higher education and further education loans (tuition and maintenance) totalled at around £11 billion, of which £0.12 billion was further education loans.[footnote 37] More recent data on higher education loans only show that the tuition and maintenance loans in England amounted to £12.8 billion in 2016 to 2017 (provisional figures).[footnote 38] This increase partly reflects the change in replacing maintenance grants in full by loans from 2016 to 2017.[footnote 39]
Investments made by individuals appear to be the only category of skills spending to rise, however, these data are difficult to compile and compare over time, as discussed above. The evidence for this claim comes from looking at individuals’ learner loans, and assuming that all loans in their entirety are to be repaid by individuals. The data suggest that individuals’ learner loans, and predominantly HE loans, have increased over time. In 2014 to 2015, the Student Loans Company reported £10.7 billion loan funding (of which £3.7 billion was for maintenance), an increase of £4.7 billion since 2010 to 2011.
Regarding participation in HE and FE, it is worth highlighting that for those participating in first degrees across all modes of study (full- and part-time), the proportion of students aged 25 or over fell from 20% in 2012 to 2013 to 16% in 2017 to 2018.[footnote 40] Looking just at disadvantaged students, the number of part-time students (who are mostly older) from low-participation areas (POLAR3 Q1) has fallen by 47% since funding changes in 2011 to 2012.[footnote 41] For those on postgraduate courses, the proportion of people on taught courses (predominantly masters courses) aged 25 and over fell slightly (65% and 62%), while for research courses it remained broadly unchanged (78% and 77%) over the same period. Further education participation levels in England were at 2.3 million aged 19 and older in government-funded adult education in 2015 to 2016, down from around 3.1 million in 2010 to 2011.[footnote 42]
Regarding FE, the data suggest that overall, adult (19+) participation has been decreasing since 2010 to 2011. In particular, the number of people enrolled on Full Level 2 courses has fallen considerably since 2010 2011, Full Level 3 participation was slightly lower than in 2010 to 2011, while the number of apprenticeships (at all ages) has been increasing. Apprenticeship figures increased between 2004 to 2005 and 2016 to 2017 as eligibility criteria were relaxed, extending apprenticeship availability to people aged 25 or over.[footnote 43] Of apprenticeship starts in 2016 to 2017, almost half (46%) went to those aged over 25, up from just over a third in 2013 to 2014.[footnote 44] However, apprenticeship starts have fallen by about 28% since the introduction of the apprenticeship levy in 2017 (with 261,200 starts from August 2017 to March 2018 vs. 362,400 from August 2016 to March 2017).[footnote 45]
Additionally, apprenticeship figures should be treated with some scepticism as there have been suggestions that some employers have been rebranding training as apprenticeships, or offering low-skilled jobs as ‘apprenticeships’.[footnote 46] Such rebranding may be further encouraged by the introduction of the apprenticeship levy. A recent CIPD survey of business leaders and HR professionals found that just under half thought that their organisation would be encouraged to ‘rebadge’ existing training activity as apprenticeships in an effort to recoup some of the levy monies.[footnote 47]
Figure 5: Full Level 2 and Full Level 3 Adult (19+) Further Education and Skills, and All Age Apprenticeship Participation (2005 to 2006 to 2015 to 2016)
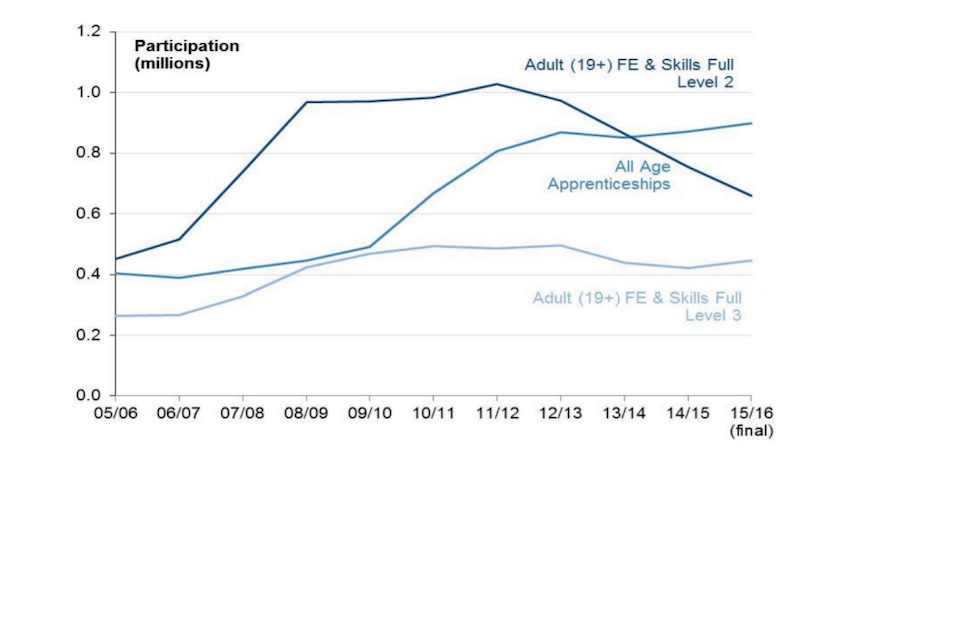
Source: Figure taken from Department for Education and Skills Funding Agency. (2017). Further education and skills in England. SFA/SFR36. 17 November 2016, updated 15 December 2017. Note that Adult (19+) Further Education and Skills includes 19+ Apprenticeships.
Thus, the picture of the changing investment in adult skills over time suggests that government investment in adult skills has fallen, employer investment in adult skills has remained broadly unchanged, and individuals’ own investment into adult skills, as measured by learner loans, has risen. However, the complex loan system and repayments arrangements means that it is difficult to say who ultimately pays for what proportion of higher education, and how that affects government and individual levels of investment in adult skills.
4. Who receives training?
4.1 Key findings
About 1 in 4 adults undertook job related training in the last 3 months in 2017. However, there is evidence of a general decrease in the proportion of people participating in training, particularly younger age groups, that has been occurring since the 2000s.
Almost half of people (49%) from the lowest social grades had not undertaken any learning since they have left school,[footnote 48] and people from lower social grades were much less likely to participate in any training, let alone training in the past 3 years, than those from more advantaged social grades (see Figure 6).
A higher percentage of people who were employed in the higher managerial, professional and associate professional occupations – women especially – participated in training compared to people who were employed in either intermediate, and routine and manual occupations.
In each respondent NS-SEC group, a slightly higher percentage of people whose parents worked in the managerial and professional occupations participated in training compared to those whose parents worked in intermediate, and routine and manual occupations.
In 2017, a slightly higher percentage of women than men participated in training (26% compared with 21%). A higher proportion of people from Black ethnic backgrounds compared to white people, and younger people compared to older people did some training in the last 3 months.
This section presents selected descriptive statistics about who undertakes job-related training or education in the UK.[footnote 49] As this section draws on the findings from other research, different measures of social class or group, and education and training are used.
The 2015 Adult Participation in Learning Survey found that almost half of people (49%) from the lowest social grades had not undertaken any learning (any education or training) since they left school,[footnote 50] and people from lower social grades (DE and C2) were much less likely to participate in any training, let alone training in the past 3 years, than those from more advantaged social grades (AB and C1, see Figure 6).[footnote 51]
Figure 6: Adult participation in learning by socio-economic class, 2014
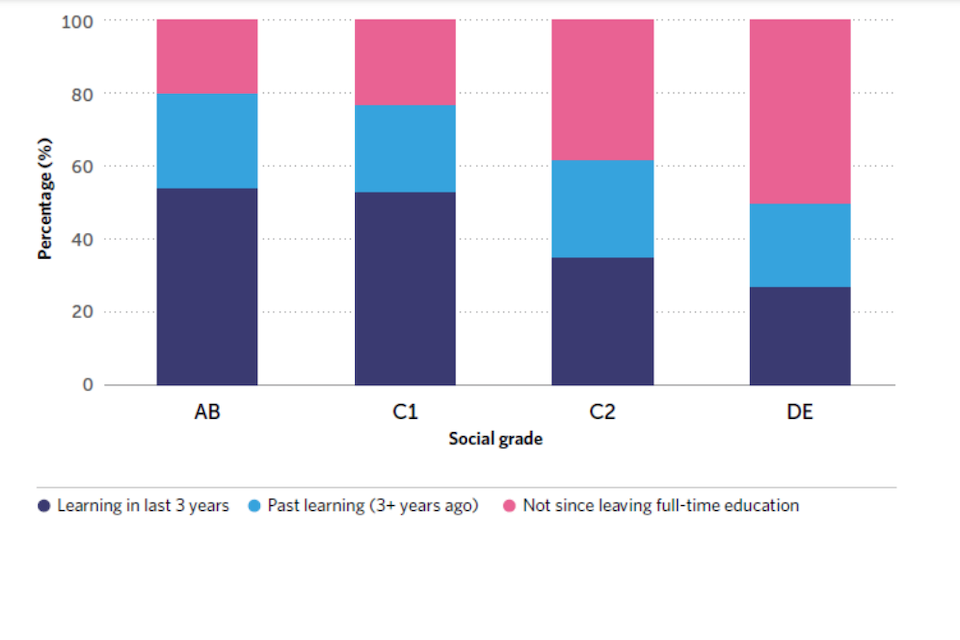
Source: Taken from Walport and Leunig (2017), p. 86, and originally in NIACE (2015), p 2.
Focusing only on training provided by employers, the 2012 Adult Participation in Learning Survey[footnote 52] found that 24% of those in social grade AB participated in training at work, followed closely by those in C2. Those in C1 (14%) and DE (12%) were the least likely. But those in AB (broadly equivalent to NS-SEC professional and managerial occupations, 18%) were much more likely to undertake off-the-job training than those in C1 (broadly equivalent to NS-SEC intermediate occupations, 8%), C2 (7%) and DE (4%), both broadly equivalent to NS-SEC routine and manual occupations.
In contrast, state funded training is targeted at the people from most deprived communities, as Figure 7 shows. In 2004 to 2005, 24% of government-funded training supported those from the most deprived areas, compared to 17% from the least deprived. By 2013 to 2014, funding on those from the most deprived areas increased to 31%, and those from the least deprived fell to 14%. However, what the figures do not show is the incidence of training on the most and least deprived individuals as opposed to residents of areas with different levels of deprivation.
Figure 7: Profile of government-funded learners by IMD quintile, 2004 to 2005 and 2013 to 2014

Source: Taken from Gloster and others (2016), p. 37
Using the UKHLS, we also find that of those who did government-provided training, a higher proportion of people worked in routine and manual occupations compared to those whose training was provided by employers and other providers. Of all the people who had done training provided by the government, 40% worked in routine and manual occupations, while of those who undertook employer-provided training, 32% worked in routine and manual occupations (see Figure 8). This is consistent with the literature that suggests that government training courses tend to be targeted at people from more disadvantaged backgrounds.
The proportion of people accessing government-provided training from routine and manual occupations was higher than in the population as a whole. LFS data show that in 2017, of adults aged 25 to 64 in employment, 47% were in managerial and professional occupations, 24% in intermediate, and 29% in routine and manual occupations. In 2010, the corresponding figures were 47%, 22% and 31% respectively (there was a slight fall in the proportion of people working in routine and manual occupations in the population between 2010 and 2017).
Figure 8: Distribution of people by NS-SEC within each category of training provider (training spell 1, UKHLS)
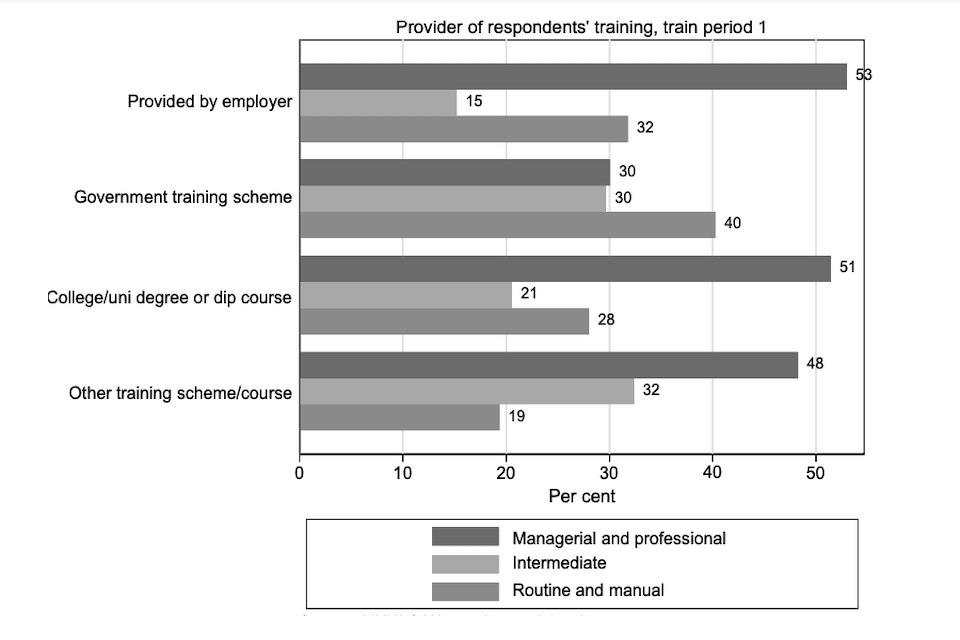
Source: UKHLS, waves 2 to 7 combined, adults aged 25 to 64 in employment only, training period 1 only, weighted.
The further education sector is also instrumental in providing learning and skills opportunities, especially for disadvantaged adults.[footnote 53] The Adult Skills Budget, Community Learning, and ESF programmes are important for adults living in disadvantaged areas, people with low or no qualifications, women and people from Black and Minority Ethnic communities. However, these budgets have been cut and support for many qualifications having the greatest impact on earnings (Level 3+)[footnote 54] have been replaced with learner loans. Moreover, recent findings suggest that further education may reinforce, rather than eliminate, social inequalities, by predominantly benefitting individuals from higher class backgrounds who work in lower-class positions with a vehicle for career advancement, rather than providing effective second-chances to individuals from lower class origins to advance their careers.[footnote 55] Part-time higher education is another option for adult skill building, but changes to government funding in 2011 to 2012 led to a 47% decrease in the number of students from disadvantaged areas (POLAR Q1) entering higher education.[footnote 56]
In terms of who participates in training, NALS 2010 data suggest that the economically inactive (such as retired people and those looking after the family) were the least likely to participate in training (40%, BIS, 2012).[footnote 57] This compares with 64% of unemployed people, 72% of part-time employees and 81% of full-time employees.
In addition, there is evidence of a ‘virtuous circle’ of learning: people with higher levels of qualification are more likely to participate in training, and possessing a qualification appears to have an even stronger effect than parental education levels. In 2010, over one quarter of those with no qualifications (27%) participated in training, compared with 55% of those with a Level 1, 73% of those with a Level 2 and 90% of those with a Level 5 qualification (BIS 2012).[footnote 58] Similar findings have been well-evidenced in the literature.[footnote 59] This suggests that getting people, at whatever level, to gain a qualification has further positive impacts. The NALS also found that parental education played a role but not as significant as possessing a qualification. Of those who had both parents leave full-time education and training at 16, 65% participated in training. This compares with 81% of those who had at least one parent stay on post-16, and 84% of those where both parents stayed on.
The virtuous circle of learning is reinforced by the findings from the 2015 NIACE Adult Participation in Learning Survey, which found that of current learners, 82% were likely to take up training in future, and 68% of those who have undertaken training in the past 3 years. Of those who had not undertaken any training since leaving full- time education, only 17% planned to undertake training, and although 29% of this group have participated in training, this was more than 3 years ago.
Suggestions to improve take-up of training among people from more disadvantaged backgrounds (for example, those with low skills, those in poor-quality and insecure jobs) have included personal learning accounts,[footnote 60] although some concern was raised about the extent to which disadvantaged adults would be able to contribute to such accounts financially. The IPPR (2017) has called for personal training credits to be made available to adults, with the amount depending on whether or not they are in work, on pay, and on existing qualification levels.[footnote 61] The aim is to encourage co-finance between individuals and the state, and at the same time to alleviate the burden on those most in need.
The effect of lifelong learning on intra-generational social mobility: evidence from longitudinal data in the United Kingdom. London: Department for Innovation, Universities and Skills. However, it is not clear how cost-effective or how influential the personal training credits would be. The main rationale in the IPPR report draws on personal health budgets in England, and it is not necessarily the case that personal budgets for skills would be used in a similar way.
Other avenues for improving take-up of training for disadvantaged adults include making use of the National Retraining Scheme and ensuring that some of the programmes in development actively target skill development for people who need it most.
4.2 Participation in job-related training in 2010 and 2017
To recap, we focus on who participated in job-related training or education in the last 3 months (unless stated otherwise), and hereafter refer to this as ‘training’ for short. This LFS question applies to all those who were aged 16 to 69, and who were either in employment or undertaking education/training. In addition, the analysis focuses only on adults aged 25 to 64 who were in employment at the time of the survey. This gives us 41,520 adults aged 25 to 64 in employment in the 2010 July to September LFS, and 36,656 adults in July to September 2017. The drop in the number of adults may be because of a downward trend in survey response rates.[footnote 62] That our sample of analysis is limited to 25 to 64 year old adults in employment suggests that the vast majority of responses to this question will likely involve training rather than education. This does include any part-time education but learner numbers are very low.[footnote 63]
In this section, we look at the descriptive statistics from the LFS about people in the UK who participated in job-related training or education by country of residence, sex, ethnicity, age group, highest qualification held, whether one was working full- or part- time, in the private or public sector, and by current socio-economic status and socioeconomic origin (parental background). Our analysis is weighted to show population-representative percentages.[footnote 64]
About 1 in 4 people in employment accessed job-related training or education in the last 3 months, falling slightly from 24.7% of adults in 2010 to 23.2% in 2017.[footnote 65] This may be a continuation of a longer-term trend of the percentage of people participating in job-related training or education declining since the 2000s (although with variation by age group),[footnote 66] and see also Figure 17). It may also have arisen due to chance – when we are looking at 2 different points in time (2010 and 2017) we miss the variation between the 2 periods. Whichever explanation applies, the overall difference between 2017 and 2010 is negligible.
The percentage of adults participating in training varies slightly by UK country of residence, with Northern Ireland having the lowest incidence of job related training in 2017, at around 18% in 2010 and 16% in 2017 (Figure 9).
Figure 9: Percentage of people who participated in training in 2017 and 2010, by country
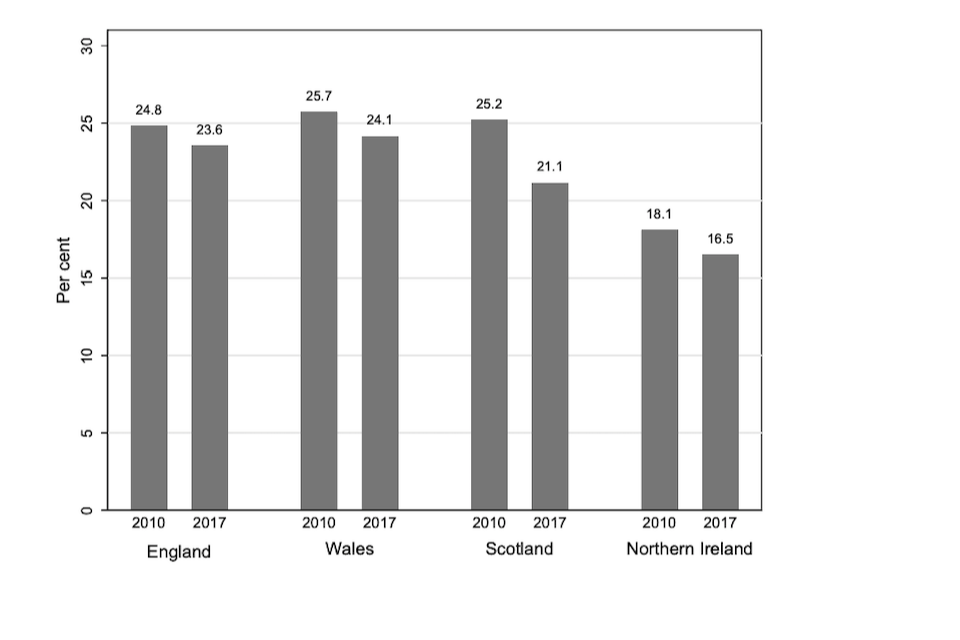
Source: Labour Force Survey 2010 and 2017, July to September quarter, people aged 25 to 64 in employment, weighted. This is calculated by looking at the weighted proportion of people who answered that they had some training in the last 3 months, and looking at how that proportion changes between 2010 and 2017 in different countries in the UK.
4.3 Type of training
The LFS contains limited data on the type of training accessed by respondents, and sometimes, additional questions about training are only asked in certain quarters. As we are primarily working with the July to September quarter (because this quarter contains the social mobility question), we can look into whether the training accessed was predominantly on- or off- the job. On-the-job training refers to “learning by example and practice while actually doing the job.”[footnote 67] Training that is on the employer’s premises but done in a classroom setting or as a training session does not count as on-the-job training, and is instead treated as ‘off-the-job’. These types of training can be loosely interpreted as informal (on-the-job training) and formal (off-the-job), even though not all training that is away from the job will lead to a qualification, and some may include induction training, and health and safety training. However, owing to small sample sizes, we cannot disaggregate the type of training in the LFS any further.
The question about whether the training was on- or off-the-job only applies to those people who replied that they have been involved in training in the last 4 weeks, rather than the last 3 months. Around 11% of adults participated in training in the last 4 weeks, and this proportion has not changed between 2010 and 2017. Of those 11% of adults who participated in training in the last 4 weeks only, a higher proportion did training that included some off-the-job training in 2010 (59%) compared to 2017 (50%). While it is difficult to draw firm conclusions, the data raise the possibility that the incidence of formal training may have declined between 2010 and 2017.
Insight from UKHLS suggests that the most frequently mentioned reasons for undertaking training was to improve skills in one’s current job or to maintain one’s professional status / to meet occupational standards (62% and 45% of respondents who had done some training mentioned these as reasons for at least some of their training, see Figure 10). Just over a fifth of respondents who had done training in a previous year mentioned doing so to prepare for a potential future job, and a similar proportion undertook for health and safety training. Induction training and training for non-job-related reasons were least frequently mentioned as reasons for doing training (only 6% of respondents).
Figure 10: Reasons for which training was done (UKHLS)[footnote 68]

Source: UKHLS, waves 2 to 7 combined, adults aged 25 to 64 in employment only, training period 1 only, weighted. Note that a respondent could pick multiple reasons for training. We also looked at the reasons in each wave separately (not reported), but the pattern was broadly similar to that above.
4.4 Training by funding source
We also used UKHLS to look at who provided the training accessed by individuals, again focusing on the first training period (Figure 11). Of all training accessed, most was provided by the employer (77%) compared to other training schemes or courses (14%) and education institution courses (including college or university degrees and diploma courses, 6%). Government schemes constituted only 3% of training courses accessed by individuals (care should be taken when interpreting this statistic).[footnote 69] However, as set out before, government-funded training only constitutes around 7% of the overall training spend (see Figure 1), and so funds only a minority of training activities.
Figure 11: Training accessed by individuals by different providers (UKHLS data)[footnote 70]
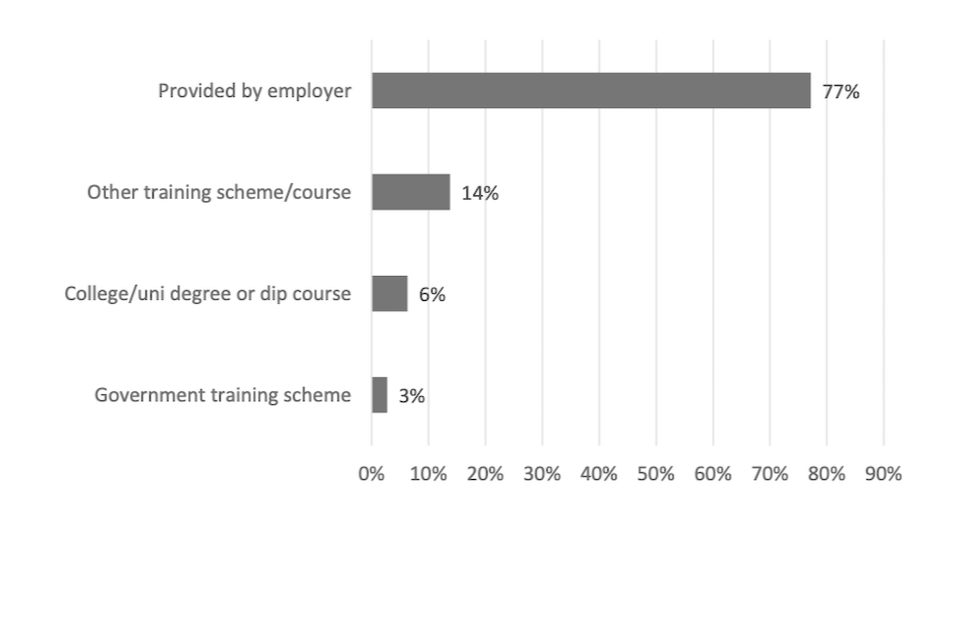
Source: UKHLS, waves 2 to 7 combined, adults aged 25 to 64 in employment only, training period 1 only, weighted. Note that a respondent could pick only one training provider for each period of training. We also looked at the reasons in each wave separately (not reported), but the pattern was broadly similar to that above.
4.5 Access to training by socioeconomic factors and other characteristics
Occupation
Look at participation in training by respondents’ occupation, LFS analysis shows that a higher percentage of people working in high paid, high skilled professional, associate professional and technical, and personal service occupations[footnote 71] participated in training than those working in other occupations (30 to 35% in 2017, compared with 21% for those in managerial occupations and 13 to 16% for those in the remaining occupations).
Between 2010 and 2017, the proportion of people participating in training by occupation decreased for most occupational groups. The decrease was significant for people working in the professional, associate professional and technical, and personal service occupations (Figure 12).
Figure 12: Percentage of people who participated in training in 2017 and 2010, by main occupational group

Source: Labour Force Survey 2010 and 2017, July to September quarter, people aged 25 to 64 in employment, weighted. SOC 2000:
-
Managers and senior officials (for example, MP, company chair, shopkeeper)
-
Professional occupations (for example, scientist, teacher, solicitor, doctor)
-
Associate professional & technical occupations (for example, nurse*, police officer, financial advisor, estate agent)
-
Administrative and secretarial occupations (for example, office assistant, receptionist, secretary)
-
Skilled trades occupations (for example, gardener, mechanic, builder, apiarist, plumber)
-
Personal service occupations (for example, tourist agent, teaching assistant, flight steward)
-
Sales and customer service occupations (for example, cashier, call centre operator)
-
Process, plant and machine operatives (for example, foreman, machinist)
-
Elementary occupations (for example, postman, waiter, bar staff, cleaner, security guard).
*Note that in SOC 2010, nursing and related occupations were reclassified into professional occupations.
However, managers and senior officials – the highest occupational group – received lower levels of training than professional and associate professional and technical occupations. This is likely to arise from the different types of managers included in this occupational group: Managers, Directors and Senior Officials include company directors, members of parliament, as well as small business owners, shopkeepers, etc. Some of these types of occupation (such as senior managers), are likely to have high levels of training, and others (for example, shopkeepers) lower levels of training. For example, in 2017, 22% of people working as corporate managers and directors did training, while only 16% of people working as other managers and proprietors did training, according to the LFS.
Second, Managers, Directors and Senior Officials have a higher proportion of people who are self-employed than other occupational groups. It is well-evidenced that people who are self-employed are also less likely, on average, to participate in training compared to employees. Indeed, in 2017, 25% of employees participated in training in the last 3 months compared to 13% of those who were self- employed. But, it is not only Managers, Directors and Senior Officials that have a high proportion of self-employed workers (17% in 2017). Of people working in Associate professional and technical occupations, 15% were self-employed, and of those in the professional occupations – 14%. Therefore, the self-employed explanation does not tell the full story.
A third explanation may be that most workers in more senior occupations, such as professional occupations, are more likely to be older and therefore will have experienced training throughout their career. People employed in the Managers, Directors and Senior Officials occupational group are on average around 44 years old compared to those in the professional occupations, who are on average aged 42. However, there is relatively little variation in the mean ages across the 9 occupational major groups.
Socioeconomic background – respondent NS-SEC
Finally, we look at respondents’ current socioeconomic status, and that of their parents’. As mentioned earlier, since 2014 the LFS has been capturing data on the occupation of the main wage earner in the household when the respondent was aged 14. Because the main wage earner was likely to be a parent, we refer to this variable as the parental occupation, and use it to derive the parental socioeconomic status, the NS-SEC.[footnote 72] The parental NS-SEC is used as an indicator of the respondent’s socioeconomic background.
To see how jobs (or SOC occupations at the 4-digit level) relate to the NS-SEC, the ONS NS-SEC coding tool can be used. The table below gives just an example of the kinds of occupations that are associated with the NS-SEC (Table 2).
Table 2: NS-SEC Categories (2011 census data, England only)[footnote 73]
| NS-SEC category (3-class) | NS-SEC category (8-class) | Examples of jobs | Number of people (usual residents aged 16 to 74) | Percentage |
| 1. Higher managerial, administrative and professional occupations | 1. Higher managerial, administrative & professional occupations | Lawyers, Architects, Medical doctors, Chief executives, Economists | 4,045,823 | 11.4% |
| 2. Lower managerial, administrative & professional occupations | Social workers, Nurses, Journalists, Retail managers, Teachers | 8,132,107 | 23.0% | |
| 2. Intermediate occupations | 3. Intermediate occupations | Armed forces up to sergeant, Paramedics, Nursery Nurses, Police up to sergeant, Bank staff | 4,972,044 | 14.1% |
| 4. Small employers and own account workers | Farmers, Shopkeepers, Taxi drivers, Driving instructors, Window cleaners | 3,662,611 | 10.4% | |
| 3. Routine and manual occupations | 5. Lower supervisory and technical occupations | Mechanics, Chefs, Train drivers, Plumbers, Electricians | 2,676,118 | 7.6% |
| 6. Semi-routine occupations | Traffic wardens, Receptionists, Shelf- stackers, Care workers, Telephone Salespersons | 5,430,863 | 15.4% | |
| 7. Routine occupations | Bar staff, cleaners, labourers, Bus drivers, Lorry drivers | 4,277,483 | 12.1% | |
| *Never worked and long-term unemployed | 8. Never worked and long-term unemployed | N/A | 2,180,026 | 6.2% |
| Total | 35,377,075 | 100.0% |
Source: Modified from Table 1, UK Parliament Education Committee (2014), originally from Office for National Statistics, 2011 census, Table KS611EW.
In the LFS data, we find that in 2017, a higher percentage of people who were employed in the higher managerial, professional and associate professional occupations – women especially – participated in training compared to people who were employed in either intermediate and routine and manual occupations (30% compared with 16% for intermediate occupations and 18% for routine and manual occupations respectively, see Figure 13). A possible explanation for the slightly lower incidence of training for those employed in the intermediate occupations compared to the routine and manual occupations could be that the intermediate occupations include the self-employed, and it is well-documented that the self-employed are less likely to undertake training than employees. In the 8-class NS- SEC, the intermediate occupations and small employers and own account workers (both of which form the 3-class NS-SEC) exhibit different patterns of undertaking training (see technical annex).
As before, a slightly higher percentage of women than men participated in training across each socioeconomic group. Between 2010 and 2017, the percentage of women employed in managerial and professional and routine and manual occupations who participated in training decreased slightly (37% to 33% – 22% to 20% respectively) but the change was negligible for men and women in other NS- SEC groups.
Figure 13: Percentage of people who participated in training in 2017 and 2010, by their own current 3-category NS-SEC
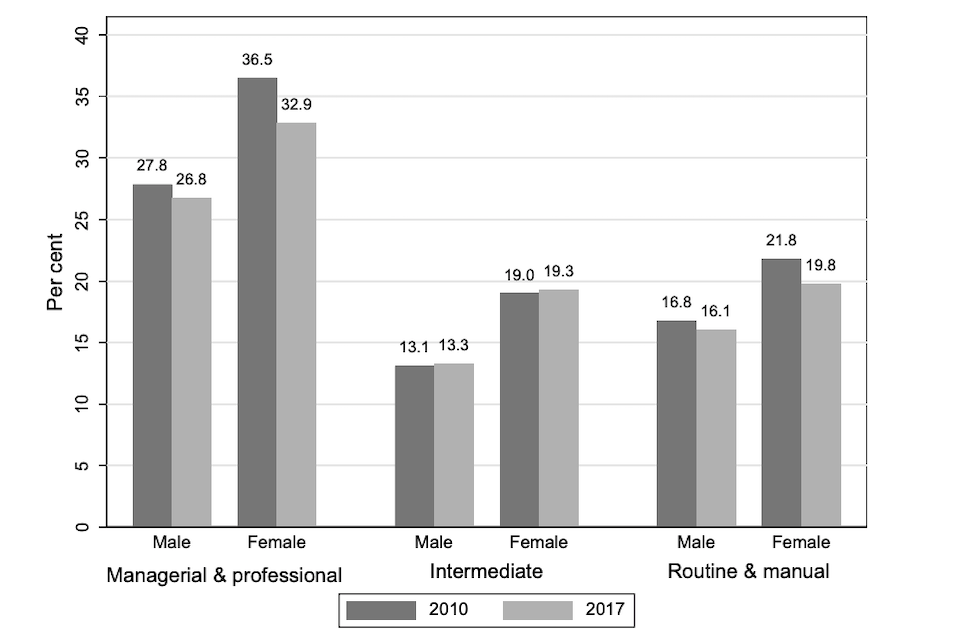
Source: Labour Force Survey 2010 and 2017, July to September quarter, people aged 25 to 64 in employment, weighted.
Socioeconomic background – parental NS-SEC
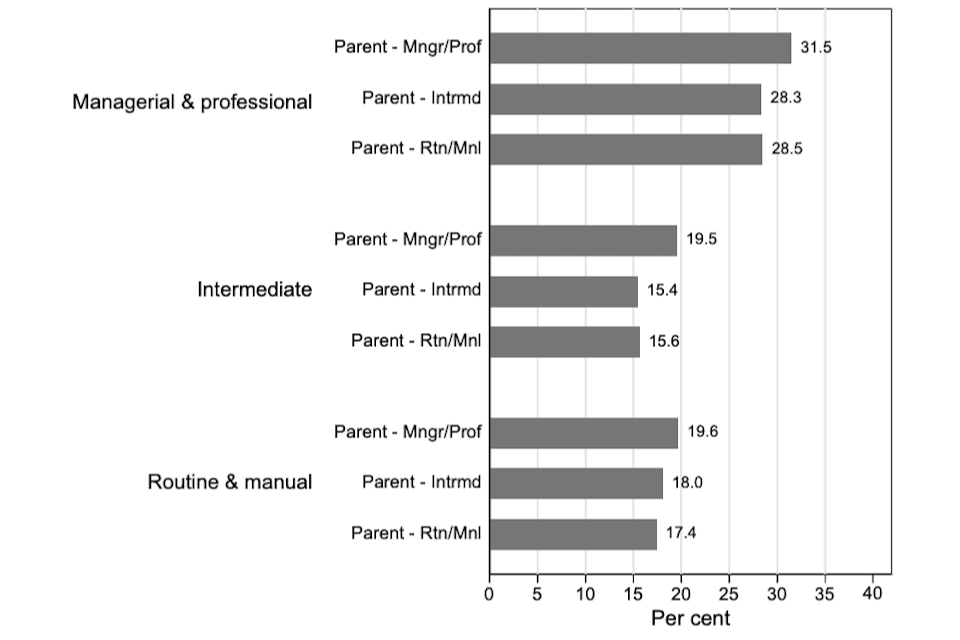
It is also possible to look at the proportion of people participating in training by the NS- SEC of their parent. Overall, in 2017, 27% of people whose parent had a managerial or professional background participated in training in the last 3 months, compared to 22% for those whose parents were from an intermediate background, and 21% – from a routine and manual background.
Within each respondent’s NS-SEC category for their current job in 2017, the data show that a slightly higher percentage of people whose parents worked in the managerial and professional occupations participated in training compared to those whose parents worked in intermediate and routine and manual occupations (Figure 14). This pattern holds even though the percentage of people participating in training was higher overall for respondents who worked in the managerial and professional NS-SEC groups than in others. This suggests that those whose parents were working class are less likely to do training than if their parents were middle class, even though they are doing the same job, and we explore this possibility more fully in the next section.
We find that, when taking the personal and work-related factors discussed above into account (such as gender, employer size and current occupation), parental background does not affect the likelihood of accessing training in a significant way. However, while we find no evidence of a direct effect this does not mean that parental class does not matter. There is widespread evidence that parental background affects children’s educational attainment and through that – occupational attainment.[footnote 74] We expand on this point more fully in the next section.
Intervening factors may come into play which explain why there are differences. For example, the availability of training may be related to the specific occupational group in which people currently work. There are also differences in the type of job-related training. For example, some job-related training is off-the-job and leads to a qualification. Such training may be of better quality than on-the-job training that does not lead to a qualification. It may also be the case that those from managerial, professional and associate professional backgrounds are more likely to access such higher-quality training than those from other socioeconomic backgrounds. Regardless of the job of the individual, however, a slightly lower proportion of people undertake training if their parents were working class than if their parents were middle class.
Figure 14: Percentage of people who participated in training in 2017, by their current 3-category NS-SEC and parental NS-SEC
Source: Labour Force Survey 2017, July to September quarter, people aged 25 to 64 in employment, weighted.
Qualification level
There is a clear decreasing relationship between the proportion of people who undertook training or education and the highest qualification held (Figure 15). These descriptive statistics from the LFS show that a higher proportion of people holding a degree-level qualification have accessed training in the last 3 months, while the lowest proportion of people accessing training was amongst those who had no qualifications. Indeed, the proportion of people with degrees who accessed training was more than 3 times higher than that of people with no qualifications. This finding has been well-evidenced elsewhere in the literature, as we discussed above, and suggests that there may be a ‘virtuous circle’ of training accruing to people who already have high levels of qualifications, and who already participate in training.
The percentage of people who received training or education in the last 3 months declined for everyone between 2010 and 2017, irrespective of highest qualification held. The decline was most pronounced for those who had higher education qualifications below degree level (such as a foundation degree or diploma of higher education), or a national vocational qualification (NVQ) at levels 4 and 5. While the ‘no qualification’ group shows a small increase, this change is not statistically significant.
Figure 15: Percentage of people who participated in training in 2017 and 2010, by highest qualification held

Source: Labour Force Survey 2010 and 2017, July to September quarter, people aged 25 to 64 in employment, weighted.
Sex
In 2017, a slightly higher percentage of women than men participated in training (26% compared with 21%). These figures are consistent with other research that has found that women are more likely to have undertaken training in the last 3 months than men.[footnote 75]
According to the LFS, the proportion of men and women who did training and/or education in the last 3 months declined slightly between 2010 and 2017 (see Figure 15), but the decline was statistically significant for women only. We discuss later that the reason for this may be related to the decrease in the incidence of people doing training in the public sector, which tends to employ more women than men, and where the provision of training tends to be higher than in the private sector (see p.47).
Figure 16: Percentage of people who participated in training in 2017 and 2010, by sex

Source: Labour Force Survey 2010 and 2017, July to September quarter, people aged 25 to 64 in employment, weighted.
Ethnicity
In 2017, analysis of the LFS found that a higher percentage of people from Black or Black British ethnic groups participated in job-related training or education in the last 3 months (32%) compared with people from Mixed/Other ethnic backgrounds (24%), White (23%) and Asian/Asian British ethnic backgrounds (20%, see Figure 17).[footnote 76]
The percentage of people who participated in training or education in the last 3 months decreased between 2010 and 2017 across all ethnic groups. The decrease was almost negligible for people from White backgrounds, although more pronounced for others (not significant for people from Black or Black British backgrounds).
Existing research has reported that men from Pakistani and Bangladeshi backgrounds in employment tend to receive least training (Cheung and McKay, 2010), that Pakistani and Bangladeshi adults were less likely to participate in adult learning, and that Bangladeshi and Black Caribbean adults were less likely to do job-related training (Bhattacharyya and others, 2003). Not much literature on ethnic background and participation in training is available.
Figure 17: Percentage of people who participated in training in 2017 and 2010, by ethnic group

Source: Labour Force Survey 2010 and 2017, July to September quarter, people aged 25 to 64 in employment, weighted.
Age
Consistent with findings in the literature, analysis of the LFS shows that a higher percentage of younger adults than older adults participated in job-related training or education in the last 3 months (Figure 17). While other research suggests that younger people (aged 16 to 24) tend to have the highest rates of training, and have also experienced some of the highest falls in training over the last decade or so, we do not include them in this research.
Consistent with findings from other research that suggests that younger adults have experienced a decline in the incidence of training, we found that the proportion of people accessing training between 2010 and 2017 fell by a larger amount for younger adults than for older adults. In 2010, 28% of adults aged 25 to 29 had accessed training in the last 3 months, compared to 24% of those aged 30 to 64. In 2017 a quarter (25%) of 25 to 29 year olds undertook training, compared to 23% for those aged between 30 to 64.
Between 2010 and 2017, the percentage of people who did job-related training or education in the last 3 months declined across most age groups, except for the over 55s, where it rose slightly.
Figure 18: Percentage of people who participated in training in 2017 and 2010, by age group

Source: Labour Force Survey 2010 and 2017, July to September quarter, people aged 25 to 64 in employment, weighted.
These findings support a large literature that shows that participation in training decreases with age. The reasons for this, discussed in the literature, include the argument that as older workers near retirement there is less incentives for employers to provide training as they would have less time in which to recoup the costs of training, (any training provided may be less costly to the employer and of lower quality for the same reason), that older workers may be less likely to be motivated to undertake training, and that older workers may be perceived as being less adaptable – less able to learn, take on and implement new knowledge (Zwick, 2015; Cully and others, 2000).[footnote 77] An ageing population may, however, challenge some of these arguments and encourage employers to invest in older workers, and older workers to take up more training opportunities.
Next we look at the descriptive statistics between selected job-related characteristics and the proportion of people in employment accessing education and training. The main characteristics we investigate here are: whether the job is full- or part-time, whether it is in the private or public sector, and workplace size.
Full-and part-time work
LFS analysis shows that a slightly higher percentage of people who worked full time participated in training compared to those who worked part-time, in both 2010 and 2017 (21% who worked part-time and 24% – full-time in 2017, Figure 18).[footnote 78]
Potential reasons for differences in the proportions of people who participated in training who worked full- and part-time may be that employers may be less inclined to invest in part-time workers as they would get less of a return compared to that on full-time workers, and that part-time workers may have different levels of commitment to the organisation compared to full-time workers.[footnote 79]
Figure 19: Percentage of people who participated in training in 2017 and 2010, by full- or part-time job

Source: Labour Force Survey 2010 and 2017, July to September quarter, people aged 25 to 64 in employment, weighted.
Public and private sector
However, of those employed in the public sector, a much higher proportion participated in training than those employed in the private sector, almost double (36% in and 19% respectively in 2017, Figure 19).
Figure 20: Percentage of people who participated in training in 2017 and 2010, by public or private sector

Source: Labour Force Survey 2010 and 2017, July to September quarter, people aged 25 to 64 in employment, weighted.
A possible explanation could be that there is a different distribution of occupations in the public and private sectors, such that a higher proportion of lower-skilled occupations are concentrated in the private sector, and a higher proportion of higher-skilled occupations – in the public sector. As has been discussed earlier, people in lower-skilled jobs tend to participate less in training, and so those in the private sector may be more likely to train less. This is borne out by the data, we find that a higher proportion of professional, associate professional and technical, and personal service occupations are found in the public than in the private sector (see technical annex). People working in higher level occupations tend to receive higher levels of training.
Another possible explanation is that public sector organisations tend to be larger employers, and provision of training is positively correlated with the employment size of the organisation (see below). Other explanations include: public sector workers being more unionised; having traditionally had a culture of investing in learning and development; and have more regulation concerning minimum qualification levels (for example, those in health and social care personal service roles).
Workplace size
As mentioned above, it is well-evidenced that larger firms tend to invest in job related training more than smaller firms.[footnote 80] Although workplace size does not measure firm size directly (as a company may have several workplaces), in general, there is a high correlation between workplace size and company size.
LFS analysis finds that the relationship between workplace size and participation in training was as expected – a lower proportion of people working in smaller workplaces participated in training than those working in larger workplaces (Figure 20). In 2017, 31% of people in organisations employing 500 or more employees received job related training compared to 22% of those with fewer than 50 employees. While the proportions of people who did training or education in the last 3 months decreased between 2010 and 2017 across all workplaces, the change was not significant for people working in workplaces with fewer than 50 employees.
Figure 21: Percentage of people who participated in training in 2017 and 2010, by number of employees at workplace
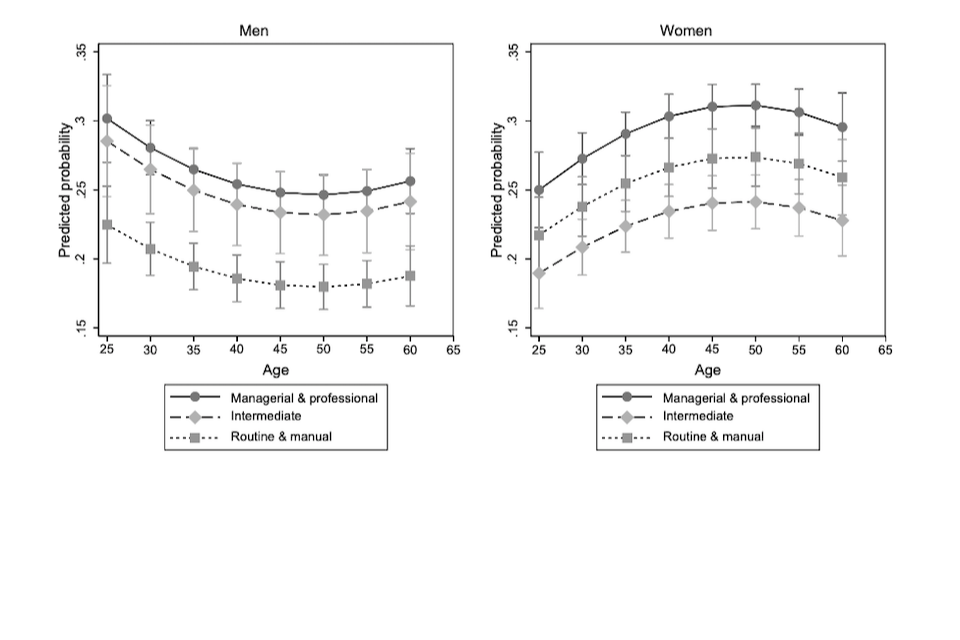
Source: LFS 2010 and 2017, July to September quarter, people aged 25 to 64 in employment, weighted.
5. What affects the likelihood of doing job-related training or education?
In the previous section, we looked at how participation in training varied with different personal factors (such as sex, age, existing qualification levels), job-related factors (for example, employment sector and occupation), and socioeconomic background.
However, the above analysis looked at the relationship between these factors and participation in training by one factor at a time. In the next section, we look at how the different factors together affect the likelihood of accessing training.[footnote 81] We use the LFS data to explore 3 main questions:
-
Has the likelihood of participating in job-related training or education in the last 3 months changed between 2010 and 2017?
-
What factors affect the likelihood of participation in training?
-
Does socioeconomic status affect the likelihood of participation in training?
5.1 Key findings
Individuals’ own current socioeconomic status has a significant impact on the likelihood of doing training – in particular, men who were working in routine and manual NS-SEC occupations were least likely to have done training across all age groups. For women, the probability of accessing training was lowest for those in the intermediate occupations. This may be due to occupational segregation in the occupations comprising these NS-SEC categories.
Once we control for other factors, the direct effect of parental background on the likelihood of participating in training is not significant. However, there is likely an indirect effect where parental background affects respondents’ educational attainment, which in turn affects respondents’ socioeconomic status. People from higher socio-economic backgrounds are more highly educated, and are more likely to be in senior jobs – factors that are associated with increased access to training.
Women were more likely than men to have done job-related training and/or education in the last 3 months, but have experienced a small (2.5%) fall in training since 2010, whereas men did not experience a fall in training.
Becoming older had a small negative affect on men’s likelihood of having done training, but a small positive effect on women’s likelihood of accessing training.
Men who worked in a small workplace (fewer than 50 employees) compared to a larger one also had a lower likelihood of having accessed training.
Both men and women with a long-standing health problem were more likely to have done training than those who did not, with the effect being slightly greater for women.
Women who were married, in a civil partnership or co-habiting, were slightly less likely to have done training. Marital status was not significant for men.
Other findings were similar to those discussed in the descriptive analysis in the previous section:
Men and women living in Northern Ireland, and women living in Scotland were less likely to have done training than those living in England.
People who had an existing higher education qualification were more likely to have accessed education or training than those with lower levels of qualifications.
Those who worked in the public sector compared to the private sector had a higher likelihood of having participated in training.
Working part-time rather than full-time reduced the likelihood of having done training in the last 3 months for both men and women.
Broadly, our model supports the descriptive analysis in the previous section, and furthermore highlights differences between men and women’s participation in training, including by age, NS-SEC, and other characteristics.
5.2 Has the likelihood of participating in job-related training and/or education changed between 2010 and 2017?
In the previous section we found that the proportion of people accessing training in 2017 was slightly lower (1.5 percentage points) than the proportion accessing training in 2010. When we run the model, we similarly find that participation in training decreased slightly, by about 1.5 per cent, with all other things being equal.
However, when the model was run separately for men and women, the decrease was only significant for women. In 2017 compared to 2010, women were 2.5% less likely to have accessed job-related training and/or education in the last 3 months. For men, there was no significant difference in the probability of having accessed training between 2010 and 2017.
Although these differences are slight, this finding raises the possibility that there may have been some kind of change that has affected women’s likelihood of accessing training, but not men’s. Similar findings have been reported in other research.[footnote 82] One explanation for this may be the different jobs that men and women do in the labour market. It is widely known that more women than men work part-time, work in the public sector, in certain industries (health and education), and in certain occupations (notably in administrative and secretarial occupations and in caring, leisure and other service occupations). All of these labour market differences are associated with differences in access to training, as discussed above. Research suggests that the fact that more women work in the public sector, where opportunities to access training are higher than those in the private sector, affects overall women’s participation in training (Schuller, 2013; Cheung and McKay, 2010).
A key question is whether training provision in the public sector has decreased since the recession, disproportionately affecting women’s participation in training. There is an argument that posits that government cuts and austerity pressures on the public sector have reduced the training it provides. The LFS data cannot answer this question directly, because it surveys individuals and not employers. Having said this, Figure 19 shows that the proportion of people working in the public sector fell by 2 percentage points between 2010 and 2017, but did not change substantially for those in the private sector. Other research has found that in the few years after the recession, although the training system in the public sector was not substantially affected by the recession, the availability of some training courses or the mode of delivery of training has changed (Jewson and others, 2015; Green and others, 2013).[footnote 83] The data for this research was taken from 2010 and 2012, and it is possible that ongoing austerity financial pressures have exacerbated the issue since then.
5.3 Does socioeconomic status affect the likelihood of having done job-related training and/or education?
Adults’ current socioeconomic status significantly affected the likelihood of having done training and education in the last 3 months. People who were in intermediate or in routine and manual occupations, relative to professional occupations, had a lower likelihood of doing job-related training and education for both men and women (although working in intermediate occupations was significant only for women when the regressions were run separately).
As men get older, their predicted probability of doing job-related training or education decreases across all 3 current NS-SEC groups (Figure 20). In contrast, for women, the predicted probability of doing training increases as they get older, up to about 50 years old, and then decrease, across all 3 current NS-SEC groups. These findings corroborate the descriptive statistics in Figure 17, and suggest that opportunities may exist that enable middle-aged women to upskill or retrain. The literature supports the finding that women are more likely than men to participate in adult learning broadly defined,[footnote 84] especially in mid-life.[footnote 85] Part of the reason for this may be middle-aged women taking up opportunities to upskill or retrain for second-chance careers, likely after childrearing responsibilities. However, for women who had been previously employed in higher-status occupations (for example, managerial and professional), obtaining new vocational qualifications can help labour market re-entry, but potentially to lower status occupations.[footnote 86]
Men who were working in routine and manual NS-SEC occupations were least likely to have done training across all age groups. For women, however, the probability of accessing training was lowest for those in the intermediate occupations. This may be partly owing to occupational segregation in the occupations comprising these NS-SEC categories.
We can compare our predicted probabilities from the model with the actual proportions of people accessing training by NS-SEC background and age from the LFS data. The results are broadly similar, in that the incidence of participating in training decreases with age for males and females in all NS-SEC groups, except for women in managerial and professional NS-SEC and in the routine and manual NS-SEC, where a small increase between the ages of 40 and 50 can be seen (Figure 21). Consistent with the predicted probabilities, the descriptive statistics also show that those working in the managerial and professional NS-SEC group have the highest probability for accessing training across all age groups.
It should also be highlighted that, consistent with the data in Figure 13, the descriptive statistics in Figure 21 show that for both men and women, a lower proportion of those working in intermediate occupations participated in training than those in routine and manual occupations. In contrast, our predicted probabilities in Figure 20 suggest that, when we take other factors (personal and job-related) into account, for men, those working in the routine and manual occupations have a lower incidence of participating in training. This inconsistency between the model and the data may arise because of our modelling approach: we control for public and private sector, part-time work, existing levels of qualifications and other variables that also affect participation in training. Taking these into account may mean that they have a differential effect for men and women, hence the predicted probabilities differing from the descriptive statistics.
Figure 22: Actual percentages of people doing job-related training and education by sex and current NS-SEC, by age, 2017 only

Source: LFS 2017, July-September quarter, people aged 25 to 64 in employment, weighted.
We also looked at whether parental background affected the probability of participating in training using the 2017 LFS dataset only. The main finding was that parental background had no direct effect on the likelihood of the respondents doing job-related training or education when we also control for respondents’ own current NS-SEC. Furthermore, there was no significant interaction effect (findings not reported), which suggests that parental background does not have a differential direct effect on the likelihood of accessing training even for individuals in the same current NS-SEC group, using the 3-group NS-SEC measure. This suggests that it is respondents’ current NS- SEC rather than parental NS-SEC that directly affects the likelihood of accessing job- related training or education. However, it is important to highlight the indirect channels through which socioeconomic background affects respondents’ likelihood of gaining adult skills, although investigation of such channels is beyond the scope of this report. Research suggests that children whose parents were from higher social class backgrounds were more likely to have higher cognitive ability at age 7 and to have made more academic progress at school between the ages of 5 and 7 than their peers.[footnote 87] Even after controlling for the effects of education, parental social class still seems to matter for children’s occupational outcomes.[footnote 88]
6. How does individuals’ investment in adult skills affect socioeconomic outcomes?
6.1 Key findings
Research suggests that there may be a small positive relationship between participation in training and hourly wages, although the magnitude of this relationship varies widely. Research on the relationship between gaining qualifications and wages tends to show a positive relationship more strongly, but again, the magnitudes vary considerably.
Research findings on the relationship between adult skills and social mobility have been similarly mixed. Among some of the better estimates are suggestions that gains to adult learning become obvious in the medium-term, around 5 years from the adult learning event. Gains also tend to accrue most to younger adults (aged less than 25) who are not included in the scope of this analysis.
The support for the financial impacts of investing in low-level vocational qualifications in the literature likewise appears small, with the greatest gains to earnings and social mobility gained from obtaining higher levels of qualifications and training that leads to qualifications.
Moreover, only a small proportion of adults actually gain new qualifications that are at a higher level than those that they already possess. Research using the BHPS has found that only 14% of men and 17% of women ‘upgrade’ to a higher level of qualification than the one that they held initially over a 16 year period.
6.2 Evidence of the impact of adult skills on social mobility and earnings
Few studies analyse the impact of adult education and training on social mobility. This is surprising given that there is a large literature of the impact on skills and qualifications on earnings, and its centrality to adult education and training policy over the past 2 decades. In government reviews from Leitch[footnote 89] to Sainsbury[footnote 90] and others, the role of adult skills in driving social mobility through job and career progression has been a fundamental element of government skills policy. Similarly, numerous studies have also quantified the impact of skills acquisition (typically measured by qualifications) on increased earnings but not on social mobility even though the 2 are closely related.[footnote 91]
Because of this lack of evidence, it is necessary to extrapolate the findings of studies analysing the impact of adult learning and skills on social mobility. This process suggests a number of mechanisms by which skills and qualifications impact on social mobility by getting, keeping and progressing in a job or career:
-
A number of studies identify a positive relationship between learning and skills and getting work, especially for those with no or low skills and qualifications.[footnote 92] The argument is that getting a job improves the incomes of individuals, and thereby moves them to a higher earnings group. In particular, the impact of lifelong learning can help improve life chances by keeping adults close to the labour market in a context of economic uncertainty.[footnote 93]
-
Retention and progression.[footnote 94] Continuous years in employment has been found to enable people to escape low pay, through the retention of and progress in work.[footnote 95]
-
Health and wellbeing impacts on reduced worklessness, job satisfaction and participation in learning and skills.[footnote 96]
While there has been a significant increase in the level of skills and qualifications in the population and workforce, this has not necessarily translated into increased social mobility. For example, between 1993 and 2011 the proportion of 16 to 64 year olds with no qualifications declined from 37% to 12% and those with Level 3+ qualifications rose from 56% to 62%.[footnote 97] Social mobility on the other hand, is generally considered to have moved independently of this trend.
However, the trends for absolute and relative mobility have varied: “…absolute mobility was higher in the 1990s but relative mobility was higher in the 2000s. […A] n individual’s earnings at 40 were less closely tied to his or her earnings at 30 in the 2000s than in the 1990s, indicating an improvement in relative mobility.”[footnote 98] Absolute mobility increased due to occupational changes (more managerial and professional jobs as opposed to manual jobs), whilst relative mobility was driven by changes in earnings.
A number of qualifying factors reducing the intragenerational impact of skills on social mobility have been identified:[footnote 99]
-
Age. The economic impacts of learning and skills (pay and job progression) are more apparent for younger learners (under-25s).[footnote 100]
-
Gender. The benefits of learning and skills generally accrue to men, not women.[footnote 101]
-
Existing qualification levels. Several studies have pointed out that while there may be a positive association between gaining new qualifications and social outcomes, the strengths and magnitudes of the associations vary when looking at initial levels of qualification.[footnote 102] People with higher initial levels of education are also more likely to access more new education and training as adults, suggesting a suggesting a ‘virtuous circle’ of educational acquisition and a pattern of accumulated advantage.[footnote 103] In addition, where people do gain new qualifications, most are likely to be at or below their existing qualification levels. Research using the BHPS has found that only 14% of men and 17% of women ‘upgrade’ to a higher level of qualification than the one that they held initially over a 16 year period.[footnote 104]
There is also the impact of different types of skills and qualifications, including:
- Higher level skills and qualifications have a greater impact on social mobility as measured by earnings (especially at Level 3+)[footnote 105]
-
A vocational/academic divide that means that, even at the same level of qualifications, returns to academic qualifications are higher than those to comparative vocational education, with the possible exception of qualifications at the highest levels[footnote 106]
-
Training that is work-related provides a higher earnings return. Vocational training may also provide a channel into a particular occupation and higher socioeconomic status[footnote 107]
-
Non-cognitive as opposed to cognitive skills. Some studies suggest that the returns to cognitive skills adult training are not as significant as those from non-cognitive provision (for example, teamwork and self-awareness)[footnote 108]
-
Basic skills can impact on job entry but not progression. Also they may benefit speakers of non-English language rather than English speakers.[footnote 109]
-
The quality of provision. Retention and engagement of learners is viewed as politically important, partly because it leads onto further learning.[footnote 110]
In addition, the UK is seen as having relatively low skills investments in terms of overall spending on skills training, and the skills levels of the working population.[footnote 111]
Another factor is the extent of over-qualification and over-skilling within the UK labour market. Even if adult upskilling through increased investment in adult education and training takes place, individuals may still be overqualified for their jobs.[footnote 112] This suggests that occupation and earnings-based measures of social mobility may be less affected by adult skill gains if these gains do not translate into access to better jobs (limited by the occupational structure and employer demand for skilled labour). There is some evidence that the HE and FE skills system and market for higher skilled jobs has become more segregated, with qualifications from certain institutions (for example, Russell Group) having greater currency in the labour market than similar degrees from other institutions.[footnote 113]
Where there does appear to be agreement is that adult learning and skills does tend to lead to an earnings premium, compared to those with lower or no skill levels.[footnote 114] But whether this earnings premium converts to increased intragenerational social mobility is another question which tends not to be addressed in most studies.
6.3 What do we know about the wage returns to training?
A range of factors affect the relationship between skills acquisition (as measured by training or qualification gain) and earning. The extensive and long-running research on the wage returns to training by gender has found mixed results, ranging from 11% for men and 18% for women[footnote 115] to around 3.6% for men, and no significant effect for women.[footnote 116]
However, other research has found that the returns to training vary at different occupations and with different qualifications (and by implication, at different wage levels). For example, Cheung and McKay’s (2010) cross-sectional analysis of the LFS found that participation in training was correlated with higher wages for workers with no qualifications (both for men and women) but not at GCSE-level/equivalent or above. In addition, the authors found that working in managerial and professional occupations was associated with higher wages, but not in the other occupations. In contrast, their analysis of the BHPS data found no significant effect of training on wages in the immediate term, but by extending the time horizon, men were seen to gain 4% wage growth after 4 years, and women gained 2% after 2 years. Fixed effects models, however, cut the wage returns to training to just 0.5%.[footnote 117]
The above discussion highlights the important issue that the research method adopted by researchers tends to affect the size of the estimates produced. This issue, as well as the consequence of using different datasets and varying definitions of training (for example, ‘job- related training’, qualifications etc.), may explain why the estimates for the wage returns to training vary so much.
Looking across the research, the broad conclusions are that training does not seem to increase wages by much, if at all, and that higher estimates from older literature suffered from different methodological issues. Progress in modelling approaches made possible with up-to-date datasets, improvements in computer power and developments in modelling (such as the increase in the popularity of fixed-effects research) have meant that some of those challenges have since been overcome. For example, modelling approaches that aim to distil the causal effect of training on earnings have found the impact of training on earnings to be much lower than reported.[footnote 118]
Furthermore, there are likely to be differences regarding the type of training and whether or not the training led to a qualification. The literature suggests that the effects of learning or training that does not lead to a qualification on social mobility may be limited (Blanden and others, 2008). Regarding the type of training, certain kinds of training have more of an effect on wages than others. Health and safety training, for example, is unlikely to be associated with an increase in pay. From the UKCES ESS surveys, we know that of employers who provided at least some training in the last 12 months, around 3 quarters provided health and safety training, and 2 thirds provided their staff with basic induction training. Both of these types of training are legal requirements for some types of worker, and it may be expected that firms would be implementing these (UKCES, 2016). For 11% of employers in 2015, health and safety and/or induction training was the only training they provided in the last 12 months, up from 7% in 2011.
Another possible reason why the literature shows limited impact of training on wages has a more theoretical foundation. From the classic human capital perspective, training can be viewed as firm-specific (that which cannot be easily transferred to another firm, and where the firm providing the training will reap some of the returns to the training) or generic (that which is easily transferable, and where all benefits of the training accrue to the worker).[footnote 119] Hence, in theory, firms will not finance generic training, but would finance specific training and may also let workers share some of the firm-specific benefits (for example, through higher wages) to improve worker retention and minimise costs of providing the specific training to new workers.[footnote 120] As training variables in many widely-used surveys such as the LFS do not distinguish between firm-specific and generic training, it may be the case that most of the training provided tends to be more generic, and does not show up on wages. According to UKCES (2016), however, 85% of employers also said that they provided some firm-specific training, which suggests that firm-specific training is still relatively prevalent.
6.4 What do we know about the wage returns to qualifications?
In contrast to the research on training, the findings about wage returns to education tend to show more positive results.
In general, returns are higher to higher-level qualifications, as mentioned above. There is also some evidence of vocational qualifications resulting in lower returns than academic qualifications at the same level, and also differences between different vocational qualifications at the same level (McIntosh and Morris, 2016).[footnote 121] For example, the authors found that NVQs (national vocational qualifications, typically work-based) had lowest returns and BTEC (Business and Technology Education Council) qualifications - especially those in engineering, construction, and business subject areas, and apprenticeships – the highest returns. This could be related to the different values placed on these qualifications in the labour market. NVQs were typically (but not always) prevalent in the service sector, which has lower earnings on average than other sectors such as engineering and technologies. It could be the case that because certain vocational qualifications are associated with particular occupations, which are in turn associated with particular salaries, some qualifications lead to higher returns than others.
McIntosh and Morris also found that when looking at the returns to vocational education by one’s position in the wage distribution, for all but the very low-level vocational qualifications, the returns were higher further up in the wage distribution. But some evidence suggests that for low-level qualifications, even if the earnings do not change by much, the likelihood of becoming employed rather than unemployed might increase.
Blanden and others (2012) consider what the effects on earnings are for adults who obtain qualifications after leaving full-time education. They find that there may be some positive financial impacts on wages for women but not for men.[footnote 122] The findings suggest that after about 5 years, women and men can expect a return of around 10% on hourly wages, but that effect disappears for men after controlling for earnings before the qualification was gained. The authors conclude that adult learning therefore has a positive effect on women’s earnings after gaining the qualifications, but that for men, any earnings gain associated with adult learning is due to self-selection – men with lower initial earnings are more likely to obtain qualifications.
6.5 What do we know about the social mobility returns to gaining adult skills?
Of the few studies that have looked at the impact of undertaking training and gaining qualifications on social mobility, Blanden and others (2008) examined several sources of data and found that in general, low-level vocational qualifications do not result in substantial benefits to social mobility, and that instead, the largest changes were found for individuals who made the gains from lower-level vocational qualifications to qualifications at degree-level or above. Furthermore, the authors’ key findings included the following:
Gaining a new qualification led to a 1.3 and 1.5 point improvement in social status for men and women respectively, and that the greatest gains in social mobility were for individuals who had qualifications at NVQ level 2 or lower and who gained a qualification at degree level or above (ONS Longitudinal study, 1991 to 2001).
There were positive links between lifelong learning and social status from the British Cohort Study (BCS) and National Child Development Study (NCDS), and that the effect was larger and more robust for women.
Analysis of the BHPS also showed a positive association between undertaking education and training since leaving full-time education and social status – the effects took about 2 years to come through for men, and 4 for women. However, the BHPS findings, particularly for women, were less robust than those from the cohort studies, and suggested that selection effects may be present (for example, high-achievers tend to select into training). There is likely some weight to that assertion, given our findings and those in other literature of the ‘virtuous circle’ of qualifications and training.
More recently, Gloster and others (2015) analysed who is likely to engage in adult learning and its effects on intergenerational social mobility. They found results similar to those in the literature when looking at the likelihood of who tends to undertake adult learning.
However, their analysis of the impact of adult learning on social mobility suggests that the effect of adult learning may not be observable in the short term, with results becoming more visible when looking at more medium-term outcomes, around 5 years after the incidence of the participation in adult learning. In particular, for shorter-term outcomes, the likelihood of attaining a particular occupational status was driven more by prior qualifications than by participation in adult learning. This time frame used was similar to that discussed in Blanden and others, (2012, 2008) above. Overall, the literature suggests that the linkages between adult skills and social mobility, measured by different measures of social class and status, or by income, are complex, and may require a more medium-term outlook to become visible.
For this report, we initially attempted to model the impact of gaining a new qualification and participating in training on social mobility (measured by respondents’ NS-SEC).
However, partly because of the ‘distance’ required to move between NS-SEC categories (especially using the collapsed 3-group NS-SEC), and partly because of the comparatively short time span of the UKHLS, we were not able to find meaningful results in the analysis we undertook. For these reasons we have not included the analysis here. But further details about this analysis are given in the technical annex.
This section has presented a range of estimates of returns to qualifications and training that have been presented in the literature. These broadly suggest that the returns to training may, under certain model specifications, be negligible, but that returns to qualifications may be more substantial. Returns are typically higher for academic rather than vocational qualifications, and for higher level qualifications rather than those at a lower level. But also, the analysis is complicated by the changing nature of higher education and the labour market. Partly as a consequence of the expansion of higher education and of skills supply-side policy, the proportion of people with qualifications in the market may have exceeded demand. In the case of degrees, there is evidence of the graduate earnings premium still holding up, but possibly likely to shrink in the future,[footnote 123] and varying considerably across different subjects studied.[footnote 124]
As for the impact of training and qualifications on social mobility – our original research question – several issues may be at play here. First, firms tend to prefer to retain workers that they had trained to reap the benefits of that training. If that is the case, then taking on training could diminish social mobility if people stay on with the same employer in the same or similar job. Any marginal changes in the job done are not likely to be enough to make the jump from NS-SEC routine and manual to NS-SEC 2 intermediate or to NS-SEC 1. Second, the impact on social mobility may take longer to show here than the 4 years of lags we calculated. Third, there are differential returns to different types of training and qualifications – to differentiate new qualifications gained by type of qualification has to be done with care as otherwise the number of observations becomes small, especially given the already low numbers of people gaining new qualifications.
7. Discussion
Social mobility in Britain is high on the political agenda. There are deep economic, social and regional inequalities cross-cutting Britain which permeate all aspects of people’s lives, and represent a waste of human aspiration and potential.
Education has often been seen as a vehicle for social mobility, and so the focus of this report has been on who invests in adult skills, how this has changed over time, and whether investment in adult skills has any measurable impact on social mobility.
The report undertook a literature review of existing research and analysis of the LFS and the UKHLS. The latter enabled the authors to undertake an analysis of skills acquisition over time.
Within this study, adults are defined as adults aged 25 to 64 who are in employment. In the data analysis ‘the definition of ‘training’ depends on the questions asked in the UKHLS and the LFS. For the LFS, training is defined as the receipt of job related training in the past 3 months, and within the UKHLS – as the participating in training in the last 12 months. UKHLS also asks about the acquisition of an additional qualification in the past 12 months. Where we report on other studies, definitions range from broad (for example, learning which includes education and training) to narrow (such as job specific training) depending on the focus of these studies and the data they analyse.
7.1 Who invests in adult skills?
Employers, individuals themselves and the government (in that order) are the main stakeholders responsible for funding training. Employers provide by far and away the highest levels of funding for adult training followed by individuals themselves (mostly through higher education loans). Only around 7% of adult skills training is funded by the government.
As far as employers and the government are concerned, the levels of investment in skills is low by international standards. Government investment in adult skills has been declining (although government support for student loans for higher education that have not been paid off complicates the picture), while employer investment in training has remained broadly flat, and may have declined slightly between 2011 and 2015.
Levels of employer investment vary between types of firms. Large (in employment terms), public sector, and businesses with better product market strategies invest more in training. Most government skills investment is through Adult Education Budget, with funding for apprenticeships recently changed from the government to employers via the apprenticeship levy.
Individuals’ financial investments in their own skills development have also increased due to the government switching the funding of adult education and training to individual loans, in particular higher education loans, and to a lesser extent 24+ Advanced Learner Loans.
7.2 Who receives training?
Whether training is funded by employers, the government or individuals themselves, the incidence of training varies significantly between different groups of people. A major finding of this report, and that of previous studies, is the ‘virtuous circle of learning’. In short, those with the highest existing levels of education and training receive the highest levels of training, in turn, are more likely to receive further training. In contrast, there is a ‘vicious circle of learning’ whereby those with no or the lowest level of qualifications are much less likely to receive any adult training and, consequently, are less likely to receive any training in the future.
Those in the virtuous circle tend to be those from higher level occupations and social groups, and those in the vicious circle tend to be those from lower level occupations and social groups. For example, half of people from lower social groups had not undertaken any training (broadly defined) since leaving school compared to 20% of those from the highest social group. A similar pattern emerges when we focus on employer funded training (which accounts for the majority of all training). Those in higher level occupations and social groups receive the most training, as do those who possess higher qualifications. In 2010, over one quarter of those with no qualifications (27%) participated in training, compared to 90% of those with a Level 5 qualification.
In contrast, government-funded training is targeted at the people from most deprived communities. Of people who undertook government-provided training, a higher proportion was from routine and manual occupations (40% manual occupations, compared to 32% undertaking employer-provided training). Those living in the most deprived areas were also more involved in government-funded training (31% of government-funded learners in 2013 to 2014), compared to 14% from the least deprived. In addition, since 2004 to 2005, the trend has been towards funding more learners from the most deprived areas.
Furthermore, the further education sector is also instrumental in providing learning and skills opportunities for disadvantaged adults defined by other socioeconomic characteristics. The Adult Skills Budget, Community Learning, and ESF programmes are important for adults living in disadvantaged areas, people with low or no qualifications, disabled people and people from Black and Minority Ethnic communities. Government- funded training is a means for disadvantaged people to break into the virtuous circle of learning. Even supporting people to gain lower levels of qualifications increases their propensity to engage in training twofold.
Analysis of the LFS shows that within each NS-SEC group, a slightly higher percentage of people whose parents worked in the managerial and professional occupations participated in training. Parents’ social group appears to influence an individual’s current level of participation in training directly (though not significantly) and indirectly (because parents from higher social groups tend to have higher qualifications, work in higher level occupations and, themselves, participate more in training). For example, of those who had both parents leave full-time education and training at 16, 65% participated in training. This compares with 81% of those who had at least one parent stay on post-16, and 84% of those where both parents stayed on.
This analysis of investments in adult skills training comes against a backdrop of a tightening labour market, rising levels of skills shortages, and persistent emphasis on the importance of skills and training for international competitiveness, especially in a post- Brexit world.
International comparisons of employer skills training suggest that it is the quality of training which is relatively low in the UK. Analysis of skills training in the UK’s main competitor countries shows that training tends to be off-the-job, of longer duration and funded to a higher level. There is evidence that not only is the quantity of job related training declining in the UK, but the quality is as well. According to the LFS in 2017 only half of those receiving job related training said that it involved off-the-job training. This has fallen by 9 percentage points since 2010.
One explanation for this is that, according to classic human capital theory, training is increasingly becoming firm-specific rather than generic. In an increasingly competitive labour market businesses are only willing to fund training that is of direct benefit to their own organisation. Analysis of the UKHLS suggests that individuals’ main reason for undertaking training is to improve skills in the current job (62%).
7.3 What affects the likelihood of doing job-related training or education?
As discussed, individuals’ own current socioeconomic status has a significant impact on the likelihood of doing training. People from higher socio-economic backgrounds are more highly educated, and are more likely to be in senior jobs – factors that are associated with increased access to training.
There are a number of personal characteristics associated with the propensity to train. Being female, of Black British ethnic origin, younger, working in the public sector, for large businesses and in a full-time job are all significantly related to a higher incidence of job related training. Women were also more likely to participate in training than men – this may be explained by a greater concentration of women employed in the public sector, where training provision tends to be greater.
The dynamics for women appear to be different than for men. As men get older, their predicted probability of doing job-related training or education decreases across all 3 current NS-SEC groups. In contrast, for women, the probability of doing training increases as they get older, up to about 50 years old, and then decreases, across all 3 current NS-SEC groups. These findings suggest that opportunities may exist that enable middle-aged women to upskill or retrain. These opportunities may be related to women returning to the labour market.
Parental background does not affect the probability of participating in training directly. However, it may do indirectly (see above). Current NS-SEC rather than parental NS- SEC is more likely to affect the probability of accessing job-related training or education.
7.4 How does individuals’ investment in adult skills affect socioeconomic outcomes?
Research on the relationship between training and wages is inconclusive. The most methodologically robust analyses tend to find little or no impact of training on wages. However, there is generally more of a consensus that gaining new qualifications leads to wage increases, especially the higher the level of the new qualification gained. Higher levels of qualifications gained tend to yield higher returns than lower levels of qualifications, all other things being equal. There is also some evidence of differential returns to vocational and academic qualifications, with the latter being associated with higher wage increases.
The mixed findings on the relationship between adult skills and social mobility in ours and others analysis may be due to the length of time it takes for impacts to emerge. Also gains also tend to accrue most to younger adults (aged less than 25) who are not included in the scope of this analysis. Moreover, only a small proportion of adults actually gain new qualifications that are at a higher level than those that they already possess. Research using the BHPS has found that only 14% of men and 17% of women ‘upgrade’ to a higher level of qualification than the one that they held initially over a 16 year period.
As we have seen, investment in adult skills training by employers and government is diminishing. The implication of this is that people’s ability through these 2 routes to gain qualifications and higher level qualifications is also diminishing, and thereby their ability to improve their wages and thereby their social group.
7.5 Evidence of the impact of adult skills on social mobility and earnings
Few studies analyse the impact of adult education and training on intragenerational social mobility. The evidence suggests that adult education and training impact on social mobility through: unemployed and economically inactive people getting jobs and thereby improving their standard of living; retention and progression in work for employed people; and improved health and wellbeing which improves job satisfaction and participation in further learning and skills.
However, a number of qualifying factors appear to reduce the intragenerational impact of skills on social mobility: age (the economic impacts of learning and skills are more apparent for younger learners); gender (men tend to gain more in wages from learning and skills than do women, despite the fact that women are more likely to participate in training or gain new qualifications); and existing qualification levels (the strengths and magnitudes of the associations vary when looking at initial levels of qualification). There are also different levels of impact from different types of skills and qualifications: higher level qualifications; academic qualifications; and training in non-cognitive and work- related skills generally generate higher returns.
In addition, the mixed results from other research may be an artefact of the research method adopted by researchers affecting the size of the estimates produced. This issue, as well as the consequence of using different datasets and varying definitions of training (for example, ‘job-related training’, qualifications etc.), explains why the estimates for the wage returns to training vary so much. In contrast to the research on training, the findings about wage returns to education tend to show more positive results, in particular to higher level academic qualifications.
Given the higher level returns of qualifications to young people rather than adults, it may be that the greatest effects occur prior to the age of 25, with more marginal effects occurring for adult learners.
The effect of adult skills on social mobility outcomes tends to take a while to show up in the data. A medium-term outlook of around 5 years is needed when looking at the effects of gaining new qualifications on so to fully capture the effects, as transitions into different types of employment can take a long time.
To move this agenda forward further, we recommend that the following research is undertaking, building upon these findings in this research. First, a study with a more medium-term outlook (for example, 5 years) would be able to capture the social mobility and earnings outcomes of investing in adult skills (for example, undertaking new qualifications or training). Second, for the analysis of social mobility specifically, we recommend adopting more fine-grained measures of socioeconomic outcomes (for example, using the eight-class NS-SEC, or other, continuous measures of social status such as the Cambridge Social Interaction and Stratification (CAMSIS) scale). More granular scales would capture smaller social status movements, while continuous variables would be more amenable to economic modelling. Third, studies could adopt measures to correct for the selection issue in training and gaining new qualifications (for example, if the sample for analysis is restricted to those in work, those not in work are missing and may be systematically different from the group in work. Similarly, there are different factors that affect individuals’ propensity to undertake training or qualifications, and these could be incorporated into models that look at the effects of training/qualifications gain on social mobility outcomes. Econometric methods such as the Heckman two-step modelling procedure, or its variants, could be used effectively here.
8. Conclusions
A key conclusion from this study is that there is a ‘virtuous’ and a ‘vicious’ circle of learning. Adults with low or no qualifications, in low social groups and occupations are much less likely to have been, or to become involved in, training. In contrast, those with high levels of qualifications, in higher level occupations and higher socio-economic groups receive the highest levels of training and, as a result, are also more likely to take up training in the future.
Another main conclusion is that the level of investment in skills by employers and the government is relatively low by international standards, and diminishing in both quantity and quality. For government expenditure on adult skills training, a key concern over reduced adult education and skills budgets is that this cut will disproportionately affect adults on lower social groups and other disadvantaged groups. Already in receipt of the lowest levels of skills investment, this is likely to be reduced further.
There is a great deal of evidence to show that social group impacts on adult training. Both directly, through an individual’s current social group, and indirectly, through their parents’ social group.
These conclusions have clear implications for government and employers, namely that:
- The role of government as a funder in supporting the skills development of adults from low social groups is critical in helping those in low social groups, and other disadvantaged people to break into the ‘virtuous circle of learning’. This has implications for the level and quality of the future Adult Education Budget, its devolution to Mayoral Combined Authorities, the successor to the European Social Fund (post-Brexit) and the recently announced National Retraining Scheme.
-
The government, and its various agencies, also has a role as an employer to maintain and extend the relatively high levels of skills training it invests in.
-
The government as a strategic lead, policy maker and purchaser also has a range of strategic and operational levers it can pull to raise the quality, quantity and impact of skills training across the country.
-
As far as employer-funded investments are concerned there is widespread concern over the relatively low and falling levels. Private sector skills training is much lower than the public sector, and much lower than firms in other countries. There are links between the business models and strategies employers run, especially with regard to ‘good work’. There are therefore links to be made with the Taylor Commission’s ongoing work, and work at a sub-regional level through Mayoral Combined Authorities, and Local Enterprise Partnerships across the good work and business development agendas. At the moment, skills training tends to be a separate and distinct agenda to business, and local economic development.
-
For individuals, investment in education and training has increased largely due to higher education loans. As we have seen, the financial returns from qualifications (and their subsequent impact on social mobility whether measured by income or social group) is much higher for degree and equivalent qualifications. However, as far as adults are concerned, there has been a significant fall in numbers entering higher education.[footnote 125] Adult higher education is one of the few mechanisms whereby adults increase the level of qualification they hold, and is therefore a major route to social mobility. However, increased tuition fees have seemingly impacted on the propensity of adults in England to engage in higher education on a full- or part-time basis.
-
If there is a link between adult skills and social mobility it is likely to take several years to emerge. There are a number of longitudinal datasets which can be utilised to research if there are any relationships. Our analysis has hinted about subtle and nuanced relationships which could form a basis for further exploration.
9. About the Commission
The Social Mobility Commission is an advisory non-departmental public body established under the Life Chances Act 2010 as modified by the Welfare Reform and Work Act 2016. It has a duty to assess progress in improving social mobility in the UK and to promote social mobility in England. It consists of 13 commissioners and is supported by a small secretariat.
The Commission board comprises:
- Dame Martina Milburn (Chair).
- Alastair da Costa, Chair of Capital City College Group
- Farrah Storr, Editor-in-chief of Cosmopolitan
- Harvey Matthewson, Aviation Activity Officer at Aerobility and Volunteer
- Jessica Oghenegweke, Project co-ordinator at the Diana Award
- Jody Walker, Senior Vice President at TJX Europe (TK Maxx and Home Sense in the UK)
- Liz Williams, Group Director of Digital Society at BT
- Pippa Dunn, Founder of Broody, helping entrepreneurs and start ups
- Saeed Atcha, Founder and Chief Executive Officer of Xplode magazine
- Sam Friedman, Associate Professor in Sociology at London School of Economics
- Sammy Wright, Vice Principal of Southmoor Academy, Sunderland
- Sandra Wallace, Joint Managing Director Europe at DLA Piper
- Steven Cooper, Chief Executive Officer C.Hoare & Co
The functions of the Commission include:
- Monitoring progress on improving social mobility.
- Providing published advice to ministers on matters relating to social mobility.
- Undertaking social mobility advocacy.
9.1 Report prepared by:
Dr Daria Luchinskaya, Institute for Employment Research, University of Warwick Peter Dickinson, Institute for Employment Research, University of Warwick
9.2 Institute for Employment Research, University of Warwick
Established in 1981, the Warwick Institute for Employment Research (IER) is a leading international social science research centre. Its research is interdisciplinary and made relevant to policy makers and practitioners. It is renowned for consistently delivering high quality research.
9.3 Acknowledgements
The authors would like to acknowledge the UK Data Archive and the Institute for Social and Economic Research for collecting and making available the data examined in this project, and researchers from the Social Mobility Commission, the Learning and Work Institute, and our colleagues at the Institute of Employment Research for valuable advice and guidance during this project.
-
https://www.gov.uk/government/publications/low-pay-and-labour-progression-the-great-escape ↩
-
Foster, D. (June 2018). Adult further education funding in England since 2010. House of Commons Library Briefing Paper Number 7708, 13 June 2018. ↩
-
SMC. (November 2017). State of the Nation 2017: Social Mobility in Great Britain. London: Social Mobility Commission. [https://www.gov.uk/government/uploads/system/uploads/attachment_data/file/662744/State_of_the_Nation_2017-_Social_Mobility_in_Great_Britain.pd](https://www.gov.uk/government/uploads/system/uploads/attachment_data/file/662744/State_of_the_Nation_2017-_Social_Mobility_in_Great_Britain.pdf)f ↩
-
Elliot Major, L. (2017). Stuck: Britain’s social mobility problem. Keynote speech given at the University of Warwick, 2nd November 2017. London: The Sutton Trust. https://www.suttontrust.com/newsarchive/britains- social-mobility-problem-2/ ↩
-
For example, SMCP. (August 2014). Elitist Britain? London: Social Mobility and Child Poverty Commission. ↩
-
Initially the BHPS did not contain a Northern Irish sample, and had relatively low numbers for Wales and Scotland. Boosters for Scotland and Wales were introduced in wave 9, and a Northern Irish sample was conducted at wave 11. ↩
-
Employer direct funding of training includes cash contributions covering fees to external training providers and costs of running training centres, which is arguably the type of training spend most similar to the Adult Skills Budget (ASB). Additional employer costs include on-the-job training, trainee labour costs, and trainer and training management costs. ↩
-
No comprehensive data exists on the amount of TSO funding to support people’s training. Providing the comprehensive amount of funding by TSOs is not possible, due to the complexity of TSO organisations, TSOs’ use of other funding sources, for example, the state, and the lack of surveys of the sector. ↩
-
Gloster, R., Marvell, R., Buzzeo, J., Hadjivassiliou, K., Williams, J. and Huxley, C. (2016). Mapping investment in adult skills: Which individuals, in what learning and with what returns? BIS Research Paper. London: BIS. ↩
-
It is at present unclear to what extent skills funding from EU sources, in particular from the European Social Fund and European Regional Development Fund programmes, will be replaced after Brexit. ↩
-
Employer spending on fees includes all employer contributions (on and off the job training). ↩
-
Shury, J. and others (2017). Employer Perspectives Survey 2016 : Research report. IFF Research, Department for Education. https://assets.publishing.service.gov.uk/government/uploads/system/uploads/attachment_data/file/622343/EPS_ 2016_UK_Report.pdf ↩
-
The product market strategy is a composite score based on 5 questions which asks employers, for example, how innovative they are; and the extent to which their goods and services are price dependent (as opposed to quality, service or innovation). See Vivian, D., and others (2016). Employer Skills Survey 2015:UK Results. Evidence Report 97 May 2016, Amended May 2018. London: UKCES. https://assets.publishing.service.gov.uk/government/uploads/system/uploads/attachment_data/file/704104/Employer_Skills_Survey_2015_UK_Results-Amended-2018.pdf ↩
-
For example, see Green, A. E., and others (2018), Raising productivity in low-wage sectors and reducing poverty. York: Joseph Rowntree Foundation. ↩
-
Greatbatch, D. and Tate, S. (July 2017). Funding and expenditure in post-16 education: An international review. London: Department for Education. ↩
-
Cedefop. (July 2017). Investing in skills pays off: The economic and social cost of low-skilled adults in the EU. Thessaloniki: Cedefop. ↩
-
Figures taken from http://ec.europa.eu/eurostat/web/education-and-training/data/database ‘Enterprises providing training by type of training and size class - % of all enterprises (trng_cvt_01s)’ ↩
-
“Continuing vocational training (CVT) refers to education or training measures or activities which are financed in total or at least partly by the enterprise (directly or indirectly). Part financing could include the use of work-time for the training activity as well as financing of training equipment.” http://ec.europa.eu/eurostat/cache/metadata/en/trng_cvt_esms.htm ↩
-
Figures taken from http://ec.europa.eu/eurostat/web/education-and-training/data/database ‘Participants in CVT courses by sex and size class - % of persons employed in all enterprises (trng_cvt_12s)’ ↩
-
Figures taken from http://ec.europa.eu/eurostat/web/education-and-training/data/database ‘Cost of CVT courses by type and size class - cost per person employed in all enterprises (trng_cvt_17s)’ and ‘Cost of CVT courses by type and size class - cost per participant (trng_cvt_19s)’. Data last updated June 2018. In 2015, the UK spent 293 euro on training per employee compared to 585 euro across the EU-28, while in 2005 the figures were 383 euro and 478 euro respectively. In 2015, the UK spent 961 euro on training per employee compared to EU-28 of 1,418 euro, while in 2005 the figures were 1,178 euro and 1,438 euro respectively. ↩
-
The purchasing power standard is an artificial currency constructed to reflect the different price levels – and thus the cost of living – in different countries. In 2015, the amount spent on CVT courses per employee in the UK in purchasing power standard terms was just 38% of the EU-28 average (220 pps vs. 585 pps), while the amount spent per training participant was 51% of the EU average (721 pps vs. 1,418 pps). ↩
-
See: [http://ec.europa.eu/eurostat/statistics- explained/index.php?title=File:Participation_rate_in_education_and_training,2011(%C2%B9)(%25)_YB16.pn](http://ec.europa.eu/eurostat/statistics-explained/index.php?title=File%3AParticipation_rate_in_education_and_training%2C_2011(%C2%B9)_(%25)_YB16.png) g (participation rate and level of training) and Eurostat ‘Hours spent in CVT courses by size class - hours per person employed in all enterprises (trng_cvt_23s)’ (duration). ↩
-
See IPPR. (February 2017). Skills 2030: Why the adult skills system is failing to build an economy that works for everyone. London: IPPR. https://www.ippr.org/files/publications/pdf/skills-2030_Feb2017.pdf ↩
-
New Economy. (2017). Investment in skills. Manchester: New Economy. Note, however, that it is not clear from the New Economy report how the real-terms employer spending figures have been calculated and which deflator has been used. Given that it is not clear which deflator should be applied to nominal employer spend figures to adjust for changes in costs, and given that labour costs have been dampened owing to slow growth in real wages, we can broadly say that, whether adjustments are made or not, employer spending on training in the UK has not changed by much between 2011 and 2015. ↩
-
http://ec.europa.eu/eurostat/web/products-datasets/-/trng_cvt_17s ↩
-
The Adult Skills Budget includes classroom-based further education, adult apprenticeships and other workplace training. ↩
-
This excludes funding from the European Social Fund programmes. ↩
-
Milton, A. (February 2018). Answer to Adult Education: Public Expenditure: Written question –127048. https://www.parliament.uk/business/publications/written-questions-answers-statements/written- question/Commons/2018-02-06/127048/ ↩
-
Foster, D. (June 2018). Adult further education funding in England since 2010. House of Commons Library Briefing Paper Number 7708, 13 June 2018. ↩
-
Accessed from https://data.oecd.org/socialexp/public-spending-on-labour-markets.htm ↩
-
New Economy. (2017). Investment in skills. Manchester: New Economy. ↩
-
Institute for Fiscal Studies. (October 2017). Higher Education finance reform: Raising the repayment threshold to £25,000 and freezing the fee cap at £9,250. IFS Briefing Note BN0217. ↩
-
https://www.slc.co.uk/media/latest-news/apply-now-for-postgraduate-student-funding.aspx; ↩
-
Prior to 2006 to 2007, tuition fees were roughly £1,000, initially introduced in the academic year 1998 to 1999. ↩
-
See https://www.gov.uk/advanced-learner-loan/eligibility and see https://www.gov.uk/what-different- qualification-levels-mean/list-of-qualification-levels for an overview of levels and corresponding qualifications. ↩
-
New Economy. (2017). Investment in skills. While these figures are not broken down by age, a rough ‘back of the envelope’ calculation can be made for illustration purposes. If we assume that older learners take out loans at the same rate as all students, we can multiply the total amount of HE loan by the proportion of over-25s in HE (first degree). This gives a figure of £10.7 billion * 0.17 = £1.8 billion (tuition and student loan) in 2014 to 2015 for the over- 25s. In practice, older students’ different circumstances may mean that the rate of loan take-up differs from that of students aged under 25. ↩
-
Student Loans Company. (2018). Student Support for Higher Education in England 2017: academic year 2016 to 2017 payments, 2017 to 2018 awards. Student Loans Company. https://www.slc.co.uk/media/9667/slcsfr052017-with- correction.pdf ↩
-
Bolton, P. (2018). Student Loan Statistics. House of Commons Library Briefing Paper Number 1079, 28 February. http://researchbriefings.parliament.uk/ResearchBriefing/Summary/SN01079 ↩
-
HESA. (2018). HE student enrolments by personal characteristics. Statistical First Release 247. See Figure 4. https://www.hesa.ac.uk/data-and-analysis/sfr247/figure-4 ↩
-
Johnson, J. (2017). Answer to ‘Higher Education: Admissions: Written question – 109016’, November. https://www.parliament.uk/business/publications/written-questions-answers-statements/written- question/Commons/2017-10-23/109016 ↩
-
Department for Education and Skills Funding Agency. (2017). Further education and skills in England. SFA/SFR36. 17 November 2016, updated 15 December 2017. London: DfES. https://assets.publishing.service.gov.uk/government/uploads/system/uploads/attachment_data/file/577119/SFA_ SFR36_2016_Ofqual_Update.pdf ↩
-
Apprenticeship starts had also been previously affected by the introduction of advanced learner loans in 2013 to 2014, when older apprentices (aged 25 or over) had to take out loans. This policy was reversed in February 2014, when the Skills Funding Agency stated that apprentices did not have to take out loans, and that those who had already taken them out did not have to pay them back. See Powell (2018) for more information. ↩
-
Powell, A. (2018). Apprenticeship Statistics: England. House of Commons Library Briefing Paper, Number 06113. https://researchbriefings.parliament.uk/ResearchBriefing/Summary/SN06113 ↩
-
Department for Education. (June 2018). Apprenticeship and Levy Statistics. London: Department for Education. https://www.gov.uk/government/statistics/apprenticeship-and-levy-statistics-june-2018 ↩
-
Kirby, P. (2015). Levels of Success: The potential of UK apprenticeships. London: Sutton Trust. https://www.suttontrust.com/wp-content/uploads/2015/10/Levels-of-Success.pdf ↩
-
CIPD. (2018). Assessing the early impact of the apprenticeship levy – employers’ perspective. Research report, London: CIPD. https://www.cipd.co.uk/Images/assessing-the-early-impact-of-the-apprenticeship- levy_2017-employers-perspective_tcm18-36580.pdf ↩
-
NIACE. (2015). Adult Participation in Learning Survey: Headline Findings. Leicester: National Institute of Adult Continuing Education. ↩
-
49 This is the variable ED13WK in the LFS. ↩
-
NIACE. (2015). op cit. ↩
-
Social grades include: Social Grade A: High managerial, administrative, or professional; Social Grade B: Intermediate managerial, administrative and professional; Social Grade C1: Supervisory, clerical and junior managerial, administrative and professional; Social Grade C2: Skilled manual workers; Social Grade D: Semi- skilled and unskilled manual workers; Social Grade E: State pensioners, casual and lowest grade workers, unemployed with state benefits only. These social grades were developed by the National Readership Survey, and are widely used in market research. Social grades are often grouped into ABC1 and C2DE to represent middle and working class respectively. These broadly correspond to the 3-category NS-SEC in the following way: AB ≈ NS-SEC 1, C1 ≈ NS-SEC 2, C2DE ≈ NS-SEC 3. ↩
-
NIACE. (2012). Adult Participation in Learning Survey. Leicester: National Institute of Adult Continuing Education. ↩
-
Bibby D., and others (November 2015). Further Education: Social Mobility, Skills and Second Chances, Centre for Employment Research, University of Westminster; Gloster R., and others (May 2016). Mapping investment in adult skills: Which individuals, in what learning and with what returns? London: BIS. ↩
-
Each qualification is assigned a National Vocational Qualification (NVQ) Level. This ranges from Entry Level to NVQ Level 8 (doctorate). Level 2 is equivalent to GCSEs and intermediate apprenticeships; Level 3 to A levels and advanced apprenticeships; and Level 6 to Bachelor’s degrees. ↩
-
Bukodi, E. (2017). Cumulative Inequalities over the Life-Course: Life-long Learning and Social Mobility in Britain. Journal of Social Policy, 46(2): 367-404. ↩
-
Johnson, J. (November 2017). Answer to ‘Higher Education: Admissions: Written question – 109016’. https://www.parliament.uk/business/publications/written-questions-answers-statements/written- question/Commons/2017-10-23/109016 ↩
-
National Adult Learner Survey (NALS) 2010, see BIS (2012). ↩
-
Findings from the National Adult Learner Survey (NALS) 2010, see BIS (2012) https://assets.publishing.service.gov.uk/government/uploads/system/uploads/attachment_data/file/34798/12- p164-national-adult-learner-survey-2010.pdf ↩
-
For example, Chen, T., Raeside, R., Egdell, V. and Graham, H. (2015). Job-related training in the UK from 2000 to 2014: Insights from the LFS. In: J. Vero and C. Goffette (Eds.) Report on the Quantitative Case Studies. SocIEtY: Social Innovation - Empowering the Young for the Common Good. Report to the European Commission. http://pmb.cereq.fr/doc_num.php?explnum_id=3699; Blanden, J., Buscha, F., Sturgis, P. and Urwin, P. (2008). ↩
-
See, for example, Learning and Work Institute. (2016). Power to the People: The Case for Personal Learning Accounts. http://www.learningandwork.org.uk/our-thinking/policy-solutions; Association of Colleges. (2017). AoC Manifesto 2017. London: Association of Colleges. https://www.aoc.co.uk/publications/aoc-manifesto-2017 ↩
-
IPPR. (2017). Another lost decade? Building a skills system for the economy of the 2030s. London: IPPR. ↩
-
https://www.ons.gov.uk/employmentandlabourmarket/peopleinwork/employmentandemployeetypes/methodologie s/labourforcesurveyperformanceandqualityreportocttodec2016 ↩
-
Despite restricting the sample to those who were in employment only, there was still a small number of people who were enrolled in education (2,315 in LFS JS 2010 (5.6% of the sample for analysis) and 1,508 in LFS JS 2017 (4.1% of the analysis sample), of whom about 20% were enrolled on a full-time university course, and about half were doing part-time study including correspondence and open learning courses). We have retained these cases in our analysis. ↩
-
The person weight PWT17 and PWT14 sampling weights are used for 2017 and 2010 data respectively, except for when we look at income data, when the person income weights, PIWT17 and PIWT14, are used. ↩
-
This difference is statistically significant, at p<0.01; Across countries, the fall was significant for people living in England and Scotland only, p<0.05. ↩
-
See Chen, T., Raeside, R., Egdell, V. and Graham, H. (2015). Job-related training in the UK from 2000 to 2014: Insights from the LFS. In: J. Vero and C. Goffette (Eds.) Report on the Quantitative Case Studies. SocIEtY: Social Innovation - Empowering the Young for the Common Good. Report to the European Commission. http://pmb.cereq.fr/doc_num.php?explnum_id=3699 ↩
-
LFS User guide Volume 3, variable details 2010. ↩
-
Respondents were asked whether they had any training over the last year, and if so, how many periods of training they had. The UKHLS collects information on the 3 longest training schemes or courses that the respondent has done. For each of the 3 training periods, the UKHLS asks the respondent to give the reasons(s) for which they did this training (multiple reasons possible). ↩
-
Note that this 3% refers to percentage of training accessed by individuals that is government-funded (self-reported data). Of total financial investment in adult skills, the government contribution is around 7%. Another reason that the figure is low is that it is self-reported, and people may not be aware that they are on a government-funded training programme. ↩
-
Respondents were asked whether they had any training over the last year, and if so, how many periods of training they had. The UKHLS collects information on the 3 longest training schemes or courses that the respondent has done. For each of the 3 training periods, the UKHLS asks the respondent further questions about the training, for example, reasons for undertaking the training and who funded the training accessed. ↩
-
Most people working in personal service occupations work in the education, health and social care sectors. They are likely to benefit from the higher investment in training form public sector employers, as well as regulation on minimum qualification levels (for example, as required in the social care sector). ↩
-
For more information on the methodology of deriving this variable, please see the technical annex. ↩
-
Available at: https://publications.parliament.uk/pa/cm201415/cmselect/cmeduc/142/14204.htm ↩
-
See, for example, Richards, L., Garratt, E, and Heath, A.F. with Anderson, L. and Altintaş, E. (2016). The childhood origins of social mobility: socio-economic inequalities and changing opportunities. Social Mobility Commission. Centre for Social Investigation, Nuffield College, Oxford University. ↩
-
For example, Cheung, S. Y. and McKay, S. (2010). Training and progression in the labour market. DWP Research Report No 680. https://assets.publishing.service.gov.uk/government/uploads/system/uploads/attachment_data/file/214451/rrep68 0.pdf ↩
-
The variable ETHCEN6 was recoded such that Chinese ethnic group was combined with Asian/Asian British, and the Mixed and Other ethnic groups were combined into one category to boost observations per category. ↩
-
Zwick, T. (2015). Training older employees: what is effective? International Journal of Manpower, 36(2): 136- 150; Cully, M., Heuvel, A. V., Curtain, R., and Wooden, M. (2000). Participation in, and barriers to, training: The experience of older adults. Australasian Journal on Ageing, 19(4): 172-179. ↩
-
The LFS adopts a specific definition of the public sector, defining it as “that owned, funded or run by central or local government”, and the ‘private’ sector as everything else (LFS User Guide Vol. 3, p. 109). The public sector also includes organisations such as schools, universities, armed forces, and other organisations. The private sector, as defined here, includes public- and private-limited companies, self-employed individuals, charities etc. See the discussion in the Labour Force Survey User Guide Volume 3, pp. 109-11. ↩
-
Garnero, A. (2016). Are part-time workers less productive and underpaid?. IZA World of Labor, 249. https://wol.iza.org/uploads/articles/249/pdfs/are-part-time-workers-less-productive-and-underpaid.pdf ↩
-
See, for example, Stone, I. and Braidford, P. (2008). Engaging small employers in continuing training: An international review of policies and initiatives. Research report 30. Wath-upon-Dearne: Sector Skills Development Agency. http://dera.ioe.ac.uk/9571/1/report_30_3.pdf ↩
-
We further explore the relationship by using UKHLS, and look at what affects individuals’ decisions to have done training in or to have got a new qualification in the past year. The results are broadly consistent with LFS analysis, and are not reported here. A summary of the results as well as detailed tables can be found in the technical annex. ↩
-
E.g. Schuller, T. (2011). Gender and skills in a changing economy. UKCES Briefing Paper Series, September, London: UKCES. http://dera.ioe.ac.uk/10463/1/equality-gender.pdf ↩
-
Jewson, N., Felstead, A., and Green, F. (2015). Training in the public sector in a period of austerity: the case of the UK. Journal of Education and Work, 28(3), 228-249; Green, F., A. Felstead, D. Gallie, H. Inanc, and N. Jewson. (2013). What has been Happening to the Training of Workers in Britain? LLAKES Research Paper 43. London: ESRC Centre for Learning and Life Chances in Knowledge Economies and Societies, Institute of Education, University of London. ↩
-
Macleod, F. and Lambe, P. (2006). Patterns and Trends in Part-Time Adult Education: Participation in relation to UK nation, Class, Place of participation, Gender, Age and Disability, 1998-2003. Learning Lives Working Paper 2. http://www.leeds.ac.uk/educol/documents/162922.pdf ↩
-
See Jenkins, A. (2016). Adult learning and qualifications in Britain. Journal of Education and Work, 30(4): 445- 455. ↩
-
Bukodi, E. (2017). Cumulative Inequalities over the Life-Course: Life-long Learning and Social Mobility in Britain. Journal of Social Policy, 46(2): 367-404. ↩
-
Sullivan, A., Ketende, S. and Joshi, H. (2013). Social Class and Inequalities in Early Cognitive Scores. Sociology, 47(6): 1187-1206; see also Richards, L., Garratt, E, and Heath, A.F. with Anderson, L. and Altintaş, E. (2016). The childhood origins of social mobility: socio-economic inequalities and changing opportunities. Social Mobility Commission. Centre for Social Investigation, Nuffield College, Oxford University ↩
-
Jacob, M., Klein, M., Iannelli, C. (2015). The Impact of Social Origin on Graduates’ Early Occupational Destinations – An Anglo-German Comparison. European Sociological Review, 31(4): 460-476. ↩
-
Leitch Review of Skills. (December 2006). Prosperity for all in the global economy - world class skills: Final Report. London: Cabinet Office. ↩
-
The Independent Panel on Technical Education. (December 2016). Report of the Independent Panel on Technical Education. Department for Education. ↩
-
See, for example, Lynch S. and others (June 2015). A literature review of the value of vocational qualifications. National Foundation for Educational Research; Department for Education. (May 2018). Post-16 education: highest level of achievement by age 25, England. Department for Education; Bhutoria, A. (September 2016). Economic Returns to Education in the United Kingdom: Foresight Report. London: Government Office for Science. ↩
-
See, for example: Gloster, R., Buzzeo, J., Marvell, R., Tassinari, A., Williams, J., Williams, M., Swift, S., Newton, B. and Gate, C., (October 2015). The contribution of further education and skills to social mobility. BIS Research Paper (254), London: BIS; Gloster, R., Marvell, R., Buzzeo, J., Hadjivassiliou, K., Williams, J. and Huxley, C. (2016). Mapping investment in adult skills: Which individuals, in what learning and with what returns? BIS Research Paper; Schuller, T. (June 2017). What are the wider benefits of learning across the life course? London: Government Office for Science. ↩
-
Evans, K., Schoon, I. and Weale, M. (2013). Can Lifelong Learning Reshape Life Chances? British Journal of Educational Studies, 61(1): 25-47. ↩
-
Gloster R. and others (October 2015). op cit. ↩
-
D’Arcy C. and Finch D. (October 2017). The Great Escape? Low pay and progression in the UK’s labour market. London: Social Mobility Commission. ↩
-
Schuller, T. (June 2017). op cit. ↩
-
ONS. (2012). Measuring National Well-being, Education and Skills. London: Office for National Statistics. ↩
-
Savage, L. (March 2011). Moving on up? Social mobility in the 1990s and 2000s. Resolution Foundation. ↩
-
BIS. (2013). Review of the Economic Benefits of Training and Qualifications, as shown by Research based on Cross-Sectional and Administrative Data. BIS Research Paper Number 105, London: BIS. https://assets.publishing.service.gov.uk/government/uploads/system/uploads/attachment_data/file/137878/bis-13- 636-review-of-the-economic-benefits-of-training-and-qualifications-as-shown-by-research-based-on-cross-sectiona-and-administrative-data.pdf ↩
-
Crawford, C., and others (March 2011). Social Mobility: A Literature Review, BIS; Lynch, S. and others (June 2015). op cit.; Lynch, S., and others (June 2015). op cit.; Department for Education and Skills. (April 2006). Social Mobility: Narrowing Social Class Educational Attainment Gaps. Supporting Materials to a speech by the Rt Hon Ruth Kelly MP Secretary of State for Education and Skills. ↩
-
Gloster, R., and others (October 2015).op cit.; D’Arcy, C., and Finch, D. (May 2016). Finding your routes: non-graduate pathways in the UK’s labour market. London: Social Mobility and Child Poverty Commission. ↩
-
Blanden, J., Buscha, F., Sturgis, P. and Urwin, P. (2008). The effect of lifelong learning on intra-generational social mobility: evidence from longitudinal data in the United Kingdom. London: Department for Innovation, Universities and Skills. ↩
-
Gloster, R., and others (October 2015). op cit. ↩
-
Evans, K., Schoon, I. and Weale, M. (2013). Can Lifelong Learning Reshape Life Chances? British Journal of Educational Studies, 61(1): 25-47. ↩
-
Ibid. ↩
-
BIS. (2013). Review of the Economic Benefits of Training and Qualifications, as shown by Research based on Cross-Sectional and Administrative Data. BIS Research Paper Number 105. London: BIS. ↩
-
Ibid. ↩
-
Crawford, C. and others (March 2011). op cit.; Macmillan, L. (January 2013). The role of non-cognitive and cognitive skills, behavioural and educational outcomes in accounting for the intergenerational transmission of worklessness. London: Institute of Education. ↩
-
Schuller, T. (June 2017). op cit; Wolf, A. and Jenkins, A. (August 2014). Do ‘learners’ always learn? The impact of workplace adult literacy courses on participants’ literacy skills. British Educational Research Journal, 40(4): 585-609. ↩
-
Government Office for Science. (2017). Future of Skills & Lifelong Learning: UK challenges. London: Government Office for Science. ↩
-
Brinkley, I. and Crowley, E. (April 2017). From ‘inadequate’ to ‘outstanding’: making the UK’s skills system world class. London: CIPD. ↩
-
Brinkley, I. and Crowley E., (April 2017). op cit. ↩
-
Chillas, S. (2010). Degrees of fit? Matching in the graduate labour market. Employee Relations, 32(2): 156- 170. ↩
-
Bibby D., and others (November 2015). Further Education: Social Mobility, Skills and Second Chances. Centre for Employment Research, University of Westminster; Gloster, R., and others (May 2016). Mapping investment in adult skills: Which individuals, in what learning and with what returns? London: BIS. ↩
-
Booth (1981), using the 1987 British Social Attitudes Survey (BSAS) and looking at the effect of training on annual earnings, but not accounting for selection. In: Leuven, E. (2004). A review of the wage returns to private sector training. Unpublished paper. http://www.oecd.org/els/emp/34932279.pdf ↩
-
Blundell and others (1996), using the National Child Development Survey (NCDS) 1981-1991 data and a quasi- differencing approach, in: Leuven (2004). Vignoles and others (2004) also found returns of a similar magnitude: for male workers aged 33 to 42 who participated in work-related training gained 4 to 5% increase in wages than those who did not: Vignoles, A., Galindo-Rueda, F. and Feinstein, L. (2004). The Labour Market Impact of Adult Education and Training: A Cohort Analysis. Scottish Journal of Political Economy, 51(2): 266-280. ↩
-
Fixed-effects models aim to control for typically unobserved measures that may affect wages (for example, motivation) by (generally speaking) using the individuals as their own controls. This means that models that do not control for unobserved factors in this way may overestimate the wage returns to training. ↩
-
Leuven and Oosterbeek (2008) found that when comparing wages between those who participated in training and those who wanted to but, for a random unforeseen event, did not, the return to training decreased to close to zero, much lower than most of the literature on the returns to training would suggest. See Leuven, E., and Oosterbeek, H. (2008). An alternative approach to estimate the wage returns to private‐sector training. Journal of Applied Econometrics, 23(4): 423-434. ↩
-
Becker, G.S. (1962). Investment in Human Capital: A Theoretical Analysis. Journal of Political Economy, 70(5): 9-49. ↩
-
Leuven, E. (2004). A review of the wage returns to private sector training. Unpublished paper. http://www.oecd.org/els/emp/34932279.pdf ↩
-
Mcntosh, S. and Morris, D. (2016). Labour Market Returns to Vocational Qualifications in the Labour Force Survey. Research Discussion Paper 002, CVER Discussion Paper Series, London: Centre for Vocational Education Research. ↩
-
Blanden, J., Buscha, F., Sturgis, P., and Urwin, P. (2012). Measuring the earnings returns to lifelong learning in the UK. Economics of Education Review, 31(4): 501-514. ↩
-
Blundell, R., Green, D. and Jin, W. (2016). The puzzle of graduate wages. IFS Briefing Note BN185. London: IFS. https://www.ifs.org.uk/uploads/publications/bns/bn185.pdf; Purcell, K. and Elias, P. (2004). Seven years on: Graduate careers in a changing labour market – short report. Manchester: Higher Education Careers Service Unit/Economic and Social Research Council. https://www.hecsu.ac.uk/assets/assets/documents/seven_years_on.pdf ↩
-
Belfield, C., Britton, J., Buscha, F., Dearden, L., Dickson, M., van der Erve, L., Sibieta, L., Vignoles, A., Walker, I. and Zhu, Y. (2018). The relative labour market returns to different degrees. London: IFS. https://www.ifs.org.uk/publications/13036 ↩
-
Independent Commission on Fees. (September 2013). Analysis of university applications for 2013/2014 admissions. London: Independent Commission on Fees. ↩
_(%25)_YB16.png)