Evidence Pack: Modernising Support for Independent Living: The Health and Disability Green Paper
Updated 13 June 2024

© Crown copyright 2024
This publication is licensed under the terms of the Open Government Licence v3.0 except where otherwise stated. To view this licence, visit nationalarchives.gov.uk/doc/open-government-licence/version/3 or write to the Information Policy Team, The National Archives, Kew, London TW9 4DU, or email: psi@nationalarchives.gov.uk.
Where we have identified any third party copyright information you will need to obtain permission from the copyright holders concerned.
This publication is available at https://www.gov.uk/government/consultations/modernising-support-for-independent-living-the-health-and-disability-green-paper/evidence-pack-modernising-support-for-independent-living-the-health-and-disability-green-paper
Analytical Evidence Pack
This is a summary of analysis to support the Modernising Support for Independent Living: The Health and Disability Green Paper. This includes:
- Caseload and expenditure data, plus forecasts
- Personal Independence Payment (PIP) and Daily Living Allowance (DLA) caseload analysis
- PIP registrations, clearances, and outcomes data
- PIP customer journey data
- Employment status of PIP claimants
- Costs of Disability research
What you need to know
The data in this evidence pack comes from a range of sources that are referenced in the accompanying data tables. The new data presented here includes analysis from:
- 100% DWP administrative data of people receiving DLA and PIP.
- 100% DWP administrative data of PIP initial decisions, mandatory reconsiderations (MRs) and appeals
- HMRC administrative data
- DWP Benefit Caseload and Expenditure Outturn and Forecasts
- Stat-Xplore
- The employment of disabled people – DWP publication
- DWP research
Data tables, which provide more details on the data and analysis presented here, are available online.
1. Executive Summary
Benefit expenditure and forecasts
-
In real terms, the total expenditure on benefits to support disabled people and people with health conditions, for all ages, has increased from £47.7 billion in 2002/03 to £72.0 billion in 2022/23, and is expected to increase further to £101.0 billion in 2028/29.
-
The total expenditure on benefits directed at working age people who are disabled or have health conditions has increased in the last 20 years.
-
DWP expenditure on extra costs disability benefits has increased since 2002/03 and is forecast to continue to increase.
-
In the ten years prior to the COVID-19 pandemic, expenditure on extra costs disability benefits stayed at a consistent one per cent of Gross Domestic Product (GDP). Since then, it has risen rapidly relative to GDP, and is forecast to continue to do so.
-
In 2002/03 the total expenditure on extra costs disability benefits as a percentage of TME was 2 per cent. This remained stable until 2010/11, and then started to increase slowly. There was a sharp drop during the COVID-19 pandemic, reflecting increases in TME to address the pandemic and support the economy.
-
Since PIP was introduced in 2013, the number of people receiving DLA and PIP (all ages) has increased from 3.3 million in 2013/14, to 4.1 million in 2022/23. This is forecast to increase to 6 million in 2028/29.
-
In 2002/03, 1.5 million people of working age received DLA. The number of working aged people receiving DLA and PIP has increased from 1.9 million in 2012/13, just before PIP was introduced, to 2.6 million in 2022/23. This is forecast to increase to 4 million in 2028/29.
-
Spending on PIP and DLA has been consistently higher than forecast.
-
Previous forecasts have overall underestimated the future caseload.
PIP Demand
-
People are less likely to leave PIP now than they were when it was first introduced.
-
There is little evidence to suggest that over the longer-term the demand for PIP is associated with increased receipt of other benefits, and only weak evidence for it increasingly reaching into the population not receiving an income-replacement benefit.
-
The trends in PIP/DLA caseload follow the trends in self-reported disabilities in the wider population.
-
Around 70 per cent of cleared PIP applications from those previously receiving child DLA cite a psychiatric condition as their main condition.
-
Around 80 per cent of PIP awards from those previously receiving child DLA cite a psychiatric condition as their main condition.
PIP Registrations and Clearances
-
There was a drop in registrations at the beginning of the COVID-19 pandemic, to 23,000 in April 2020. Since then, there has been a trend of increasing new claims registrations with PIP monthly registrations exceeding 76,000 in late 2023.
-
The award rate for PIP claimants at initial decision stage has mostly been around 35 to 45 per cent since 2015.
-
There is a concentration of points awarded at the standard rate threshold, particularly for older claimants.
-
Mobility scores are much more concentrated than those for Daily Living.
-
Points awarded vary significantly by primary health condition.
-
The Anxiety and Depression health condition category most often scores 0 or 10 points, showing claimants with this health condition are more likely to get a Standard award or Nil award compared to the caseload.
-
Receipt of extra costs disability benefits by 16- to 65-year-olds generally increases by age and has risen for all age groups over the past two decades - though not uniformly so.
-
Anxiety and Depression, and to a lesser extent Autistic Spectrum Disorders, have been the main conditions contributing to growth over the past decade, and particularly since the COVID-19 pandemic.
-
Anxiety and Depression as a primary condition increases with age, though tends to level off then fall after age 40, though this could be because physical conditions are more prominent.
-
The prevalence of Learning Disabilities as a primary condition tends to decrease with age.
-
Autism as a primary condition is heavily related to age and is now by far the most common primary condition for claimants aged under 20.
Customer Journey
-
8 per cent of initial decisions following a PIP assessment have been appealed and 3 per cent have been overturned at tribunal hearing.
-
The proportion of all claimants successful at initial assessment decision has varied between a low of 46 per cent in August 2020 up to over 70 per cent.
-
The proportion of successful decisions for PIP claimants in the Anxiety and Depression category has consistently been lower than the “all conditions” success rate, with a peak of up to 16 per cent fewer than average claimants being successful at decision in 2019. Apart from during the pandemic, the award rate has remained broadly flat since 2015.
-
Highest overall award rates are seen for conditions including Cancer, Autistic Spectrum Disorders, Epilepsy and Cerebral Palsy and Neurological Muscular Diseases; while lower award rates are seen for Anxiety and Depression, Cardiovascular Diseases, Other Regional Musculoskeletal Diseases, and the combined group of Other Conditions.
Employment status of PIP claimants
-
Over 40 per cent of people registering a PIP claim are in employment in the month of registration.
-
Fewer than one in six claimants of PIP are in employment.
Award Reviews
- The largest proportion of clearances across all years have their award maintained, and this has increased over time. A smaller proportion have their award decreased or increased.
2. Benefit Expenditure and Forecasts
In real terms, the total expenditure on benefits to support disabled people and people with health conditions, for all ages, has increased from £47.7 billion in 2002/03 to £72.0 billion in 2022/23, and is expected to increase further to £101.0 billion in 2028/29.
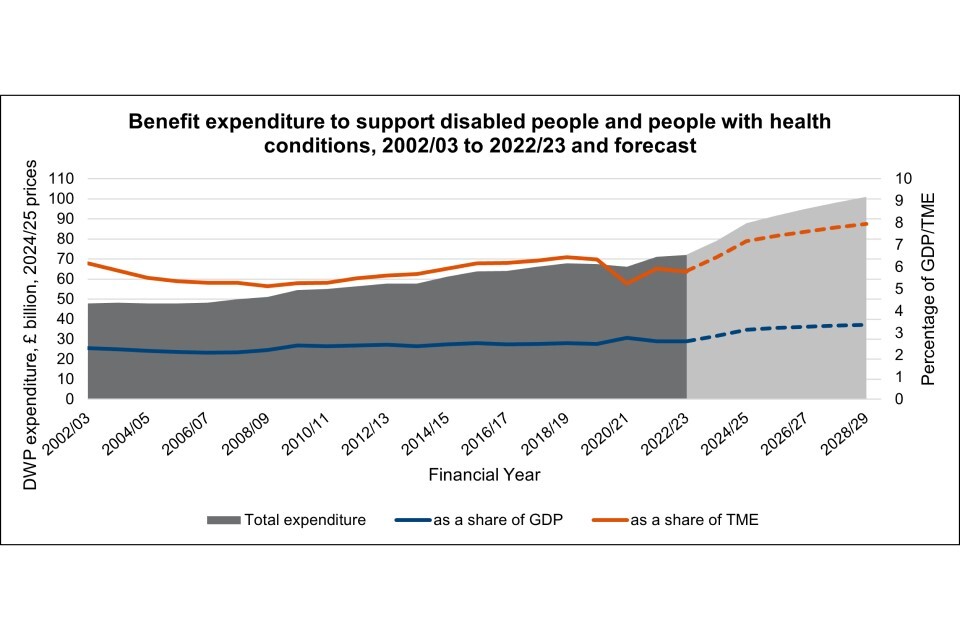
This chart shows actual and forecast DWP expenditure on benefits to support disabled people and people with health conditions over time.
The percentage of Gross Domestic Product (GDP) spent on these benefits remained fairly stable between 2002/03 and 2019/20 (between 2.1 per cent and 2.5 per cent). By 2028/29 this is expected to increase to 3.4 per cent of GDP.
The percentage of Total Managed Expenditure (TME) spent on these benefits is also forecast to increase, from 5.8 per cent in 2022/23 to 7.9 per cent in 2028/29.
Source - Benefit expenditure and caseload tables
The total expenditure on benefits directed at working age people who are disabled or have health conditions has increased in the last 20 years.
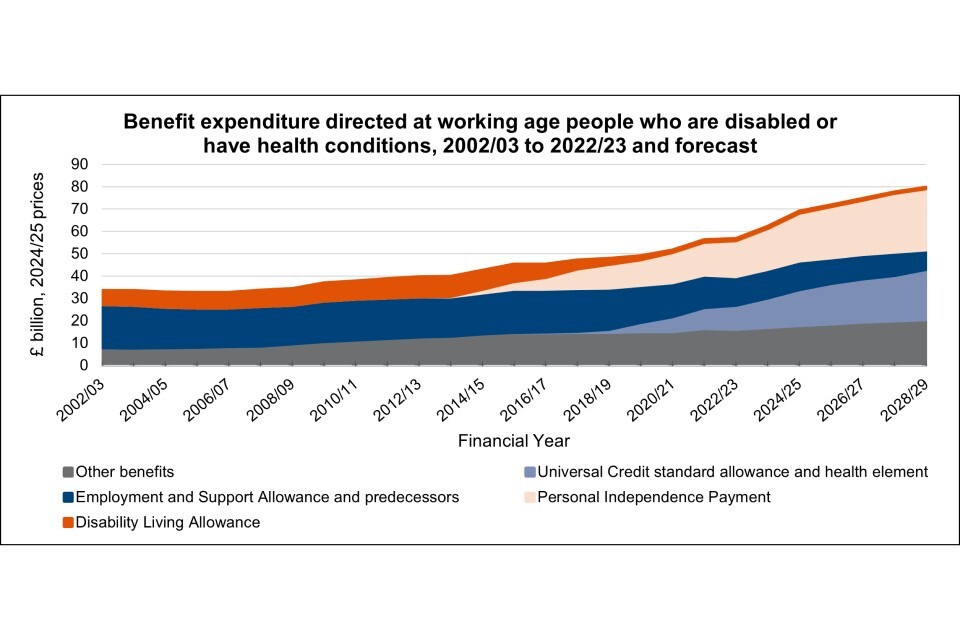
This chart shows how the total expenditure on benefits directed at working age people who are disabled or have health conditions has increased in the last 20 years.
Between 2002/03 and 2012/13 the total expenditure on these working age benefits increased from £33.6 billion to £39.6 billion in real terms. Between 2012/13 and 2022/23 it increased to £56.8 billion, and it is forecast to increase to £79.6 billion in 2028/29.
In 2012/13, the year before PIP rollout began, the expenditure on working age Disability Living Allowance was £8.9 billion, an increase of £2.7 billion from 2002/03. In 2022/23 the expenditure on working age PIP and DLA was £16.9 billion, and it is forecast to increase to £27.9 billion in 2028/29.
Source - Benefit expenditure and caseload tables
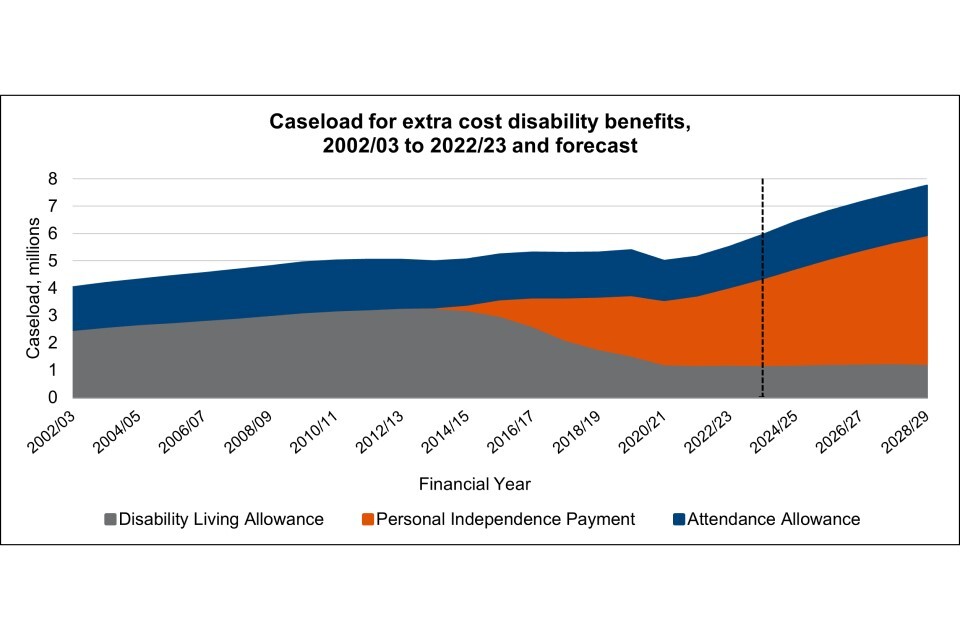
DWP expenditure on extra costs disability benefits has increased since 2002/03 and is forecast to continue to increase.
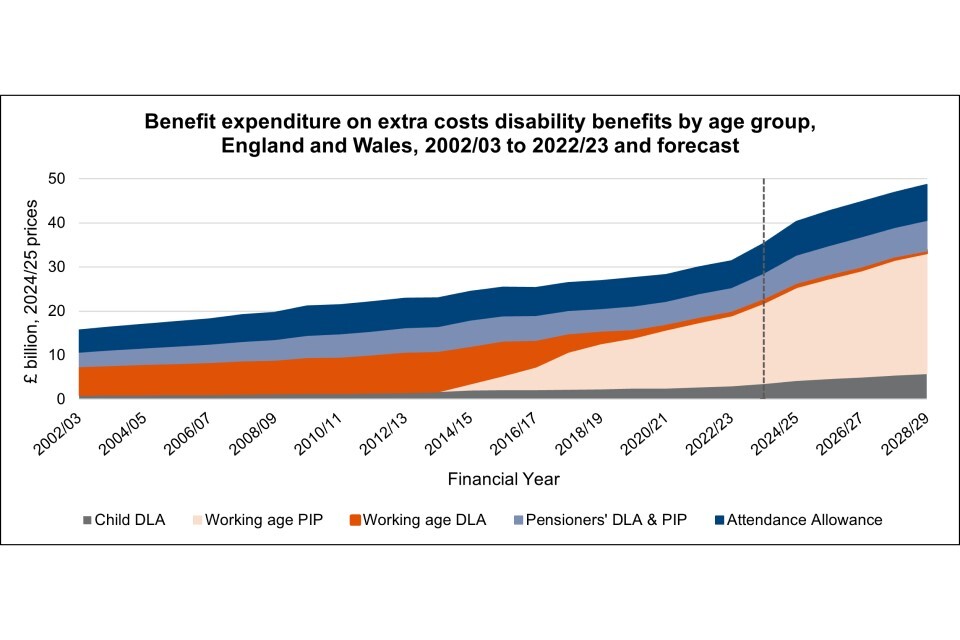
This chart shows how DWP expenditure on extra costs disability benefits has increased since 2002/03, and is forecast to continue to increase.
Spending on extra costs disability benefits has risen steadily for the last two decades, but growth has increased since the COVID-19 pandemic, and is expected to be higher in future years than pre-pandemic.
The total expenditure on extra costs disability benefits was £31.4 billion in 2022/23, of which £16.9 billion was on working age PIP and DLA. The total expenditure is forecast to increase to £48.8 billion by 2028/29, and for working age PIP and DLA to £27.9 billion, a 55 and 65 per cent increase respectively compared to 2022/23.
Source - Benefit expenditure and caseload tables
In the ten years prior to the COVID-19 pandemic, expenditure on extra costs disability benefits stayed at a consistent one per cent of Gross Domestic Product (GDP). Since then, it has risen rapidly relative to GDP, and is forecast to continue to do so.
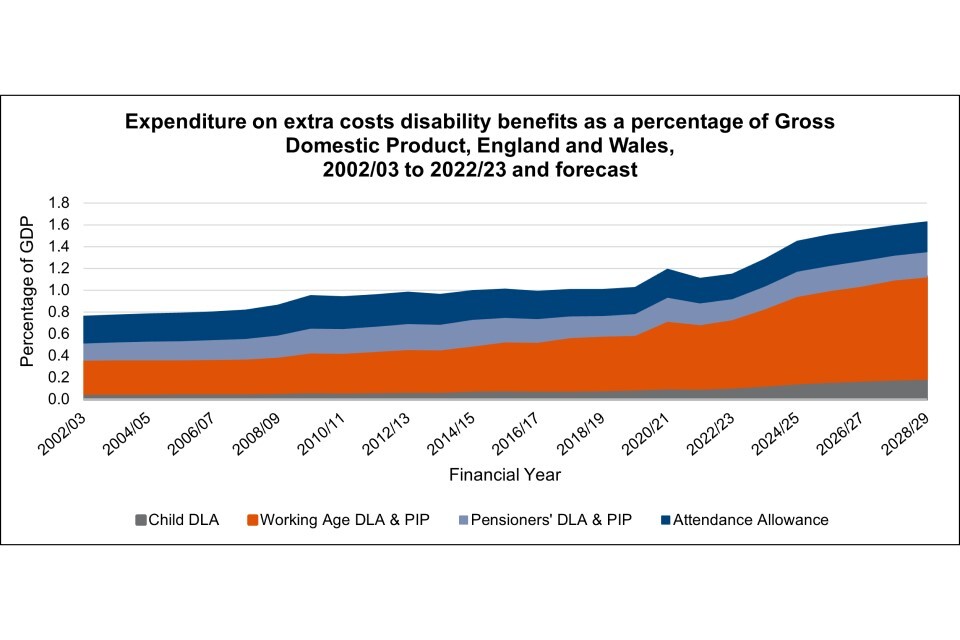
This chart shows actual and forecast expenditure on extra costs disability benefits as a percentage of GDP. Movements in this measure reflect both what happens to the numerator (spending on the benefits) and the denominator (GDP).
In 2002/03 the total expenditure on extra costs disability benefits as a percentage of GDP was 0.8 per cent. It reached 1.0 per cent of GDP during the late 2000s financial crisis, and remained there up until the pandemic.
The pandemic brought a temporary increase due to the sharp drop in GDP, but by 2022/23 it had increased to 1.1 per cent of GDP and is expected to increase to 1.6 per cent of GDP in 2028/29.
Source - Benefit expenditure and caseload tabless
In 2002/03 the total expenditure on extra costs disability benefits as a percentage of TME was 2 per cent. This remained fairly stable until 2010/11, and then started to increase slowly. There was a sharp drop during the COVID-19 pandemic, reflecting increases in TME to address the pandemic and support the economy.

Total Managed Expenditure (TME) is the total amount that government spends each year. This chart shows actual and forecast expenditure on extra costs disability benefits as a percentage of TME. Movements in this measure reflect both what happens to the numerator (spending on the benefits) and the denominator (TME), which is mostly determined by what happens to other types of Government spending.
In 2022/23 it stood at 2.5 per cent of TME and is forecast to increase to 3.8 per cent of TME in 2028/29.
Working age DLA/PIP was 0.8 per cent of TME in 2002/03, reaching 1.4 per cent of TME in 2022/23, and is forecast to increase further, to 2.2 per cent of TME in 2028/29.
Source - Benefit expenditure and caseload tables
Since PIP was introduced in 2013, the number of people receiving DLA and PIP (all ages) has increased from 3.3 million in 2013/14, to 4.1 million in 2022/23. This is forecast to increase to 6 million in 2028/29.
This chart shows the number of people receiving DLA, PIP and Attendance Allowance since 2002/03, and the forecast up to 2028/29.
Caseload on extra costs disability benefits rose steadily up to around 2010, before flattening off for a few years ahead of resuming a slight upward trend.
The drop in caseload in 2020/21 is due to the devolution of responsibility for these benefits to the Scottish Government. Since the COVID-19 pandemic the caseload has increased more rapidly.
In 2002/03 there were 4 million people receiving one of these extra cost disability benefits, with 2.5 million receiving DLA (of all ages).
Source - Benefit expenditure and caseload tables
In 2002/03, 1.5 million people of working age received DLA. The number of working aged people receiving DLA and PIP has increased from 1.9 million in 2012/13, just before PIP was introduced, to 2.6 million in 2022/23. This is forecast to increase to 4 million in 2028/29.
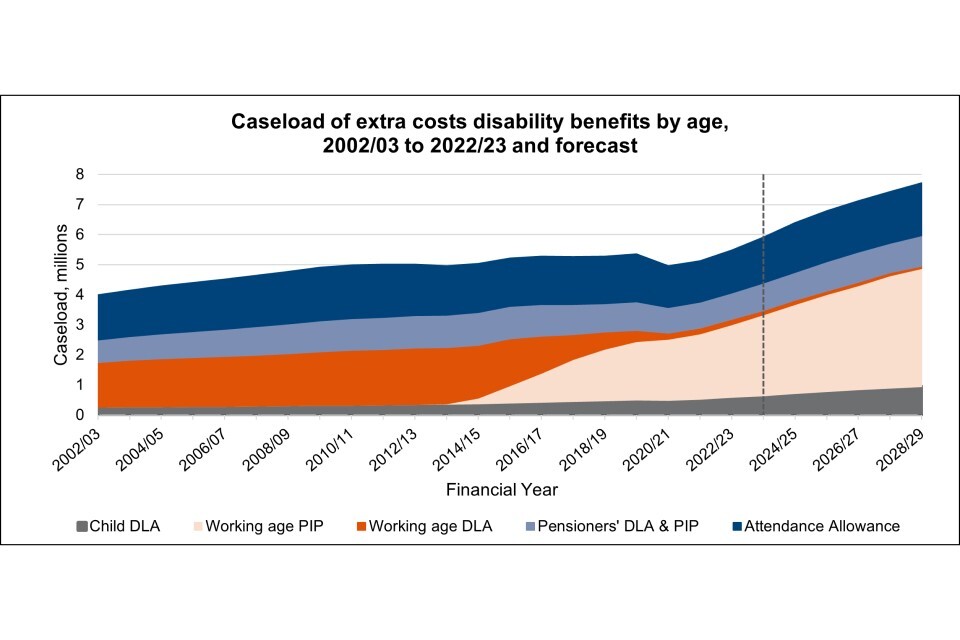
This chart shows the number of people receiving DLA, PIP and Attendance Allowance since 2002/03, and the forecast up to 2028/29.
The number of people claiming extra costs disability benefits has risen steadily for the last two decades.
The drop in caseload in 2020/21 is due to the devolution of responsibility for these benefits to the Scottish Government. Growth has increased since the COVID-19 pandemic, and is expected to be higher in future years than pre-pandemic. This is despite the loss of around ten per cent of the caseload as a result of devolution of these benefits to the Scottish Government in 2020.
Source - Benefit expenditure and caseload tables
Spending on PIP and DLA has been consistently higher than forecast.
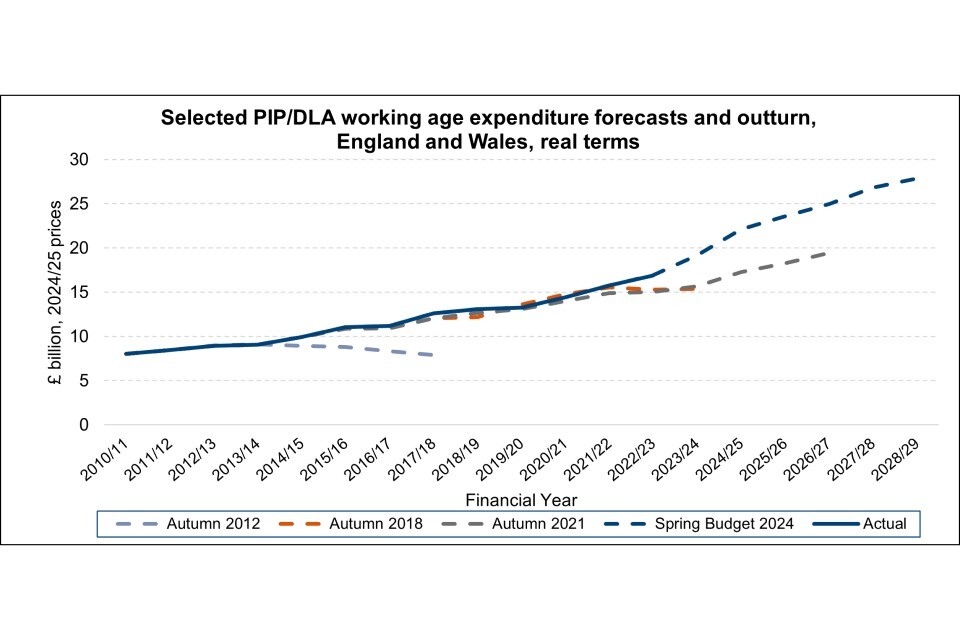
This chart shows how forecasts of the expenditure of PIP/DLA for working age claimants has fared against the actual expenditure data.
Previous forecasts have tended to underestimate the future expenditure on working age PIP/DLA. Actual expenditure has increased every year since 2010/11.
In Autumn 2012 it was forecast that expenditure on working age PIP/DLA would start a downward trend in 2014/15. Then in Autumn 2018, expenditure was forecast to increase slightly higher than the actual expenditure, but then flatline. More recent forecasts such as Autumn 2021 have also under forecast the rate of increase in expenditure.
Source - Benefit expenditure and caseload tables
Previous forecasts have overall underestimated the future caseload.
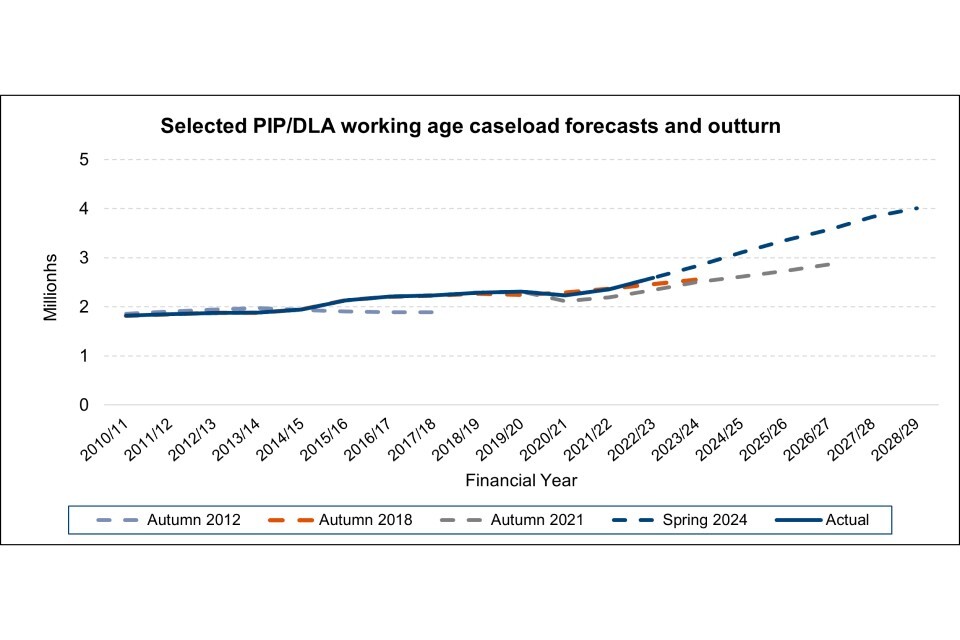
This chart shows how forecasts of the caseload of PIP/DLA for working age claimants has fared against the actual caseload data.
In Autumn 2012 it was forecast that the caseload would gradually fall. Then in Autumn 2018, the caseload was forecast to gradually increase, at a lower rate than the actual caseload.
Source - Benefit expenditure and caseload tables
3. PIP Demand
People are less likely to leave PIP now than they were when it was first introduced.
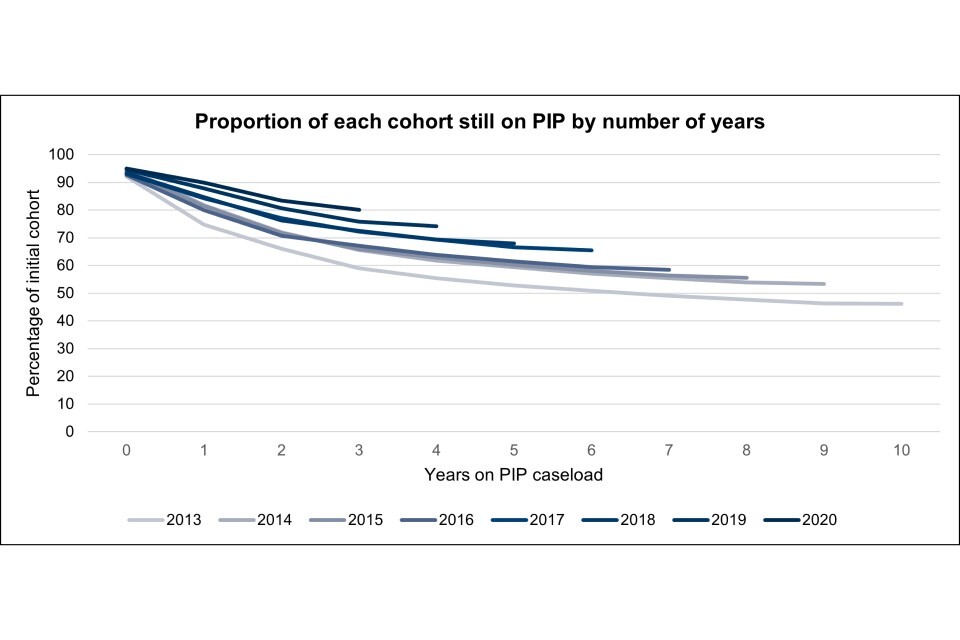
This chart shows the proportion of each cohort who remain on the PIP caseload over a number of years.
Of those who started claiming PIP in 2013 (the first cohort), 53 per cent were still claiming it after five years, and 46 per cent after 10 years.
The likelihood of leaving PIP has declined over time. 67 to 68 per cent of cohorts in 2017 and 2018 are on the benefit five years later, compared to 53 per cent for the 2013 cohort.
Source – Figures derived from DWP administrative data
There is little evidence to suggest that over the longer-term the demand for PIP is associated with increased receipt of other benefits, and only weak evidence for it increasingly reaching into the population not receiving an income-replacement benefit.

This chart shows the proportion of new PIP claims who are in receipt of Universal Credit (UC), Employment and Support Allowance (ESA), Jobseeker’s Allowance (JSA), Income Support (IS) or Incapacity Benefit (IB).
Prior to the COVID-19 pandemic, there was a slow decline in the proportion of new claims with other benefits, from around 60 per cent to around 50 per cent.
Apart from the period during and immediately following the pandemic, the proportion does not appear to have increased since, when all else equal we might have expected an increase due to the greater reach of Universal Credit compared to ESA.
Source – Figures derived from DWP administrative data
The trends in PIP/DLA caseload follow the trends in self-reported disabilities in the wider population.
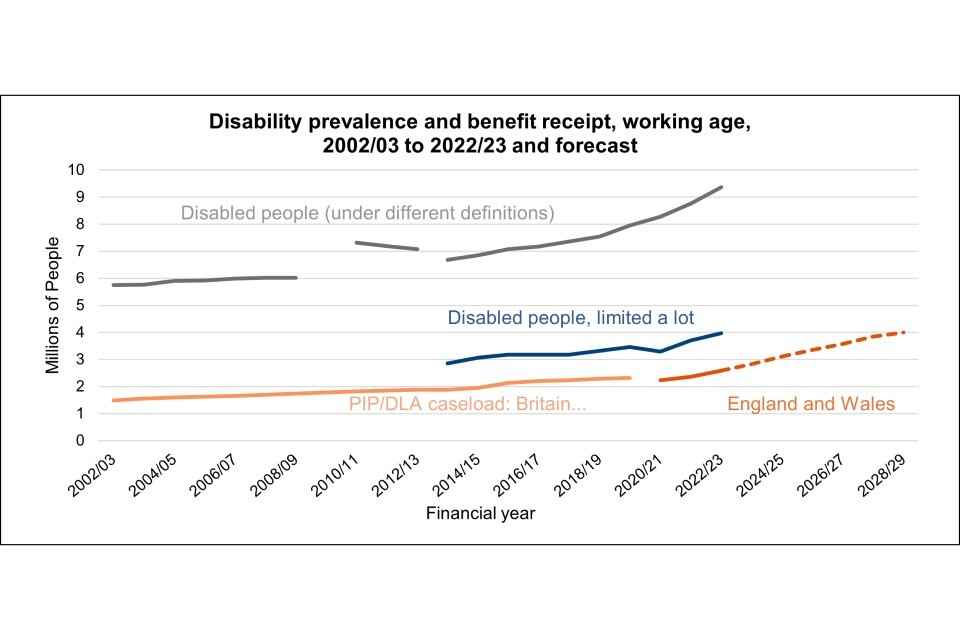
This chart shows self-reported disability among the working age population and the working age caseload for PIP/DLA.
Due to changes in the definition of disability (grey lines), the self-reported disability estimates should not be compared between these different time periods, but taken together they can indicate broad trends over a longer time period.
The number of people self-reporting as disabled in 2022/23 was 9.4 million, an increase of 2.7 million since 2013/14.
The number of people self-reporting to be disabled with their activities limited “a lot” increased from 2.9 million people in 2013/14 to 4 million people in 2022/23.
Mirroring these trends, the caseload for PIP/DLA also increased in this period. However, the caseload has continued to remain significantly lower than overall self-reported disability, and around a million lower than the volumes reporting being disabled and limited “a lot” in their activities.
Sources - Benefit expenditure and caseload tables
The employment of disabled people
Around 70 per cent of cleared PIP applications from those previously receiving child DLA cite a psychiatric condition as their main condition.
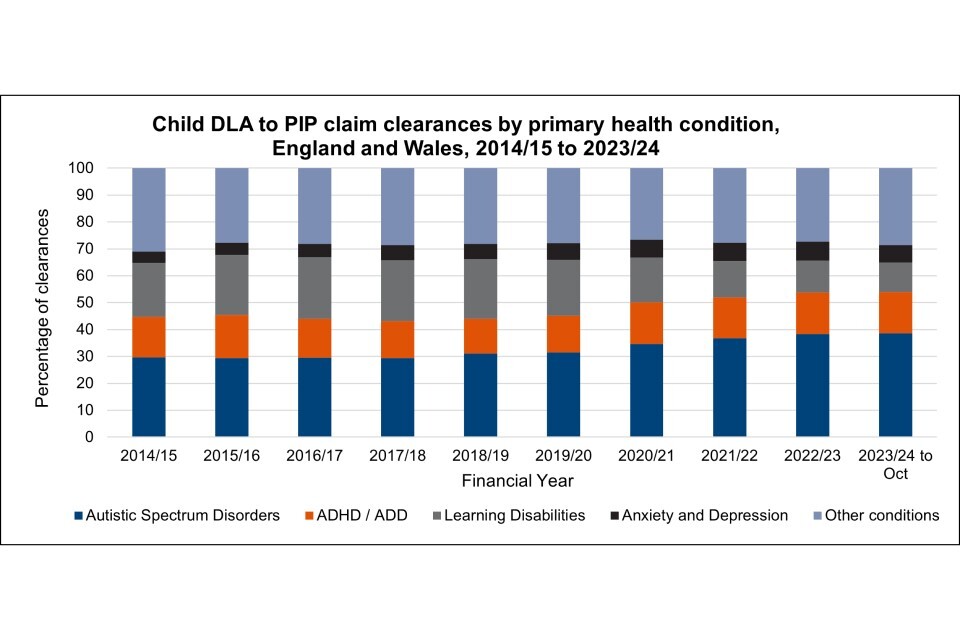
This chart shows the four most common conditions awarded PIP as DLA to PIP reassessments as well as a group for all other conditions.
The chart shows the proportion of people cleared with each condition over time. The proportion of clearances for claimants with autism spectrum disorders has increased, particularly since the COVID-19 pandemic, while the proportion with Learning Disabilities has decreased. This change may reflect the awareness of and access to diagnosis for learning disabilities and autism, as the two conditions have a large overlap.
The volume of clearances is affected by both operational processes and the number of children on child DLA reaching age 16.
Source – Stat-Xplore
Around 80 per cent of PIP awards from those previously receiving child DLA cite a psychiatric condition as their main condition.
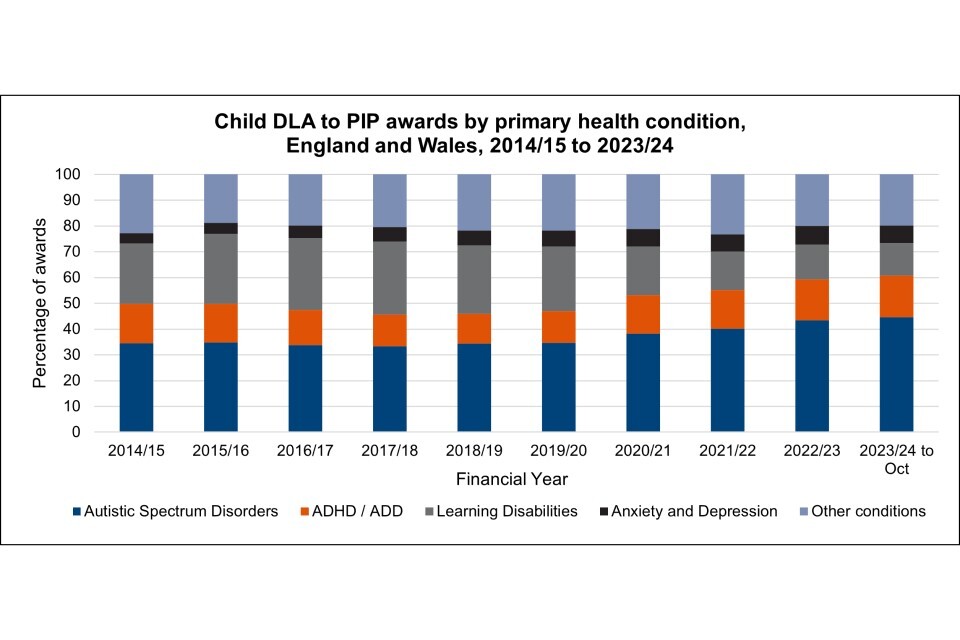
This chart shows the four most common conditions awarded PIP as DLA to PIP reassessments as well as a group for all other conditions.
The chart shows the proportion of people awarded with each condition over time. The proportion of awards for claimants with autism spectrum disorders has increased, particularly since the pandemic, while the proportion of awards for claimants with Learning Disabilities has decreased. This change may reflect the awareness of and access to diagnosis for learning disabilities and autism, as the two conditions have a large overlap.
Comparing with chart D4, this suggests that claimants with a psychiatric condition as their main condition - other than anxiety and depression - have higher success rates than those with other conditions.
Source – Stat-Xplore
4. PIP Registrations and Clearances
There was a drop in registrations at the beginning of the COVID-19 pandemic, to 23,000 in April 2020. Since then, there has been a trend of increasing new claims registrations with PIP monthly registrations exceeding76,000 in late 2023.
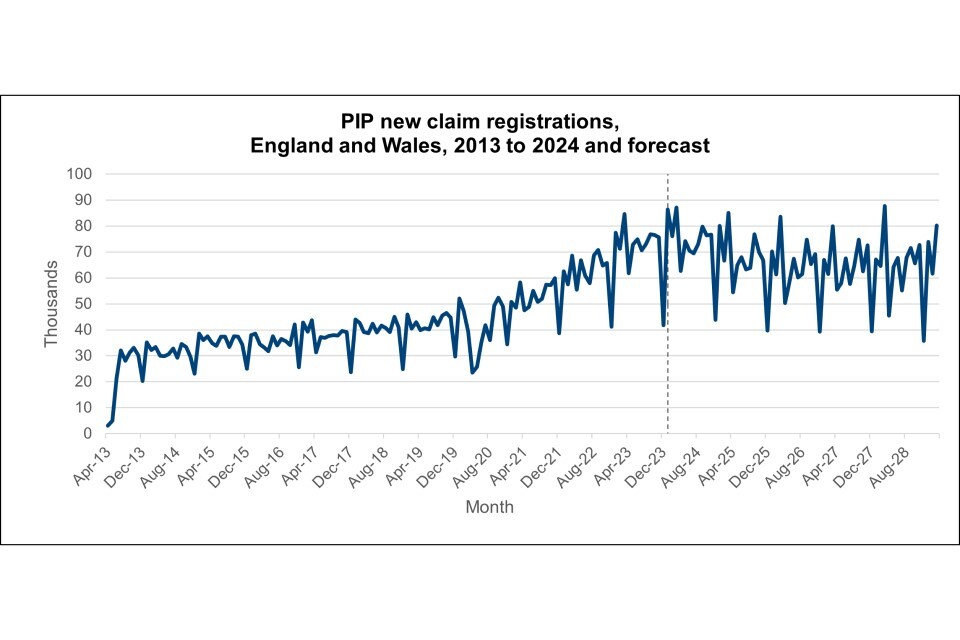
This chart shows the number of PIP New Claims registrations from introduction up to December 2023, and forecasted volumes up to March 2029. There is a seasonality to the trend, with registrations falling in December every year, so it is better to focus on the overall trend.
The forecast assumes that caseload growth rates slow as real household disposable incomes recover later in the forecast period. However, were registrations to continue to rise at recent rates, or even stay level at recent outturn, the forecast caseload and expenditure would be considerably higher.
Source – Figures from unpublished analysis consistent with the published Spring Budget 24 tables
The award rate for PIP claimants at initial decision stage has mostly been around 35 to 45 per cent since 2015.
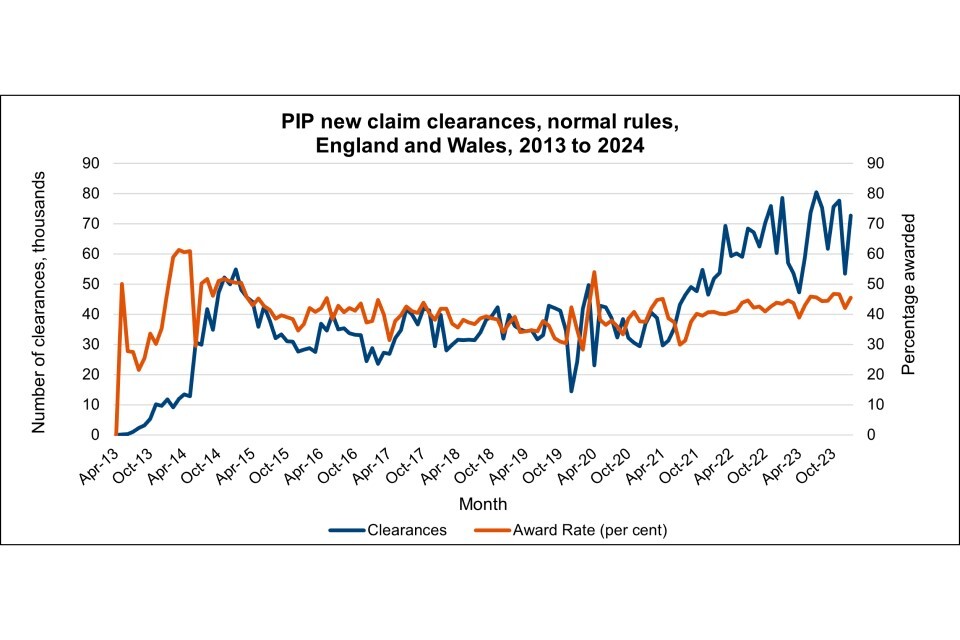
This chart shows the number of normal rules PIP clearances per month and the percentage awarded between May 2013 and January 2024.
While the number of new claim clearances has increased substantially over time, with a peak of 80,000 in July 2023, the award rate has remained relatively stable, with a slight increase in recent years from an average of 35 per cent in 2019, to 44 per cent in 2023.
This suggests the rise in claims has not been driven by claimants with a lower likelihood of a PIP award.
Source – Stat-Xplore
There is a concentration of points awarded at the standard rate threshold, particularly for older claimants.
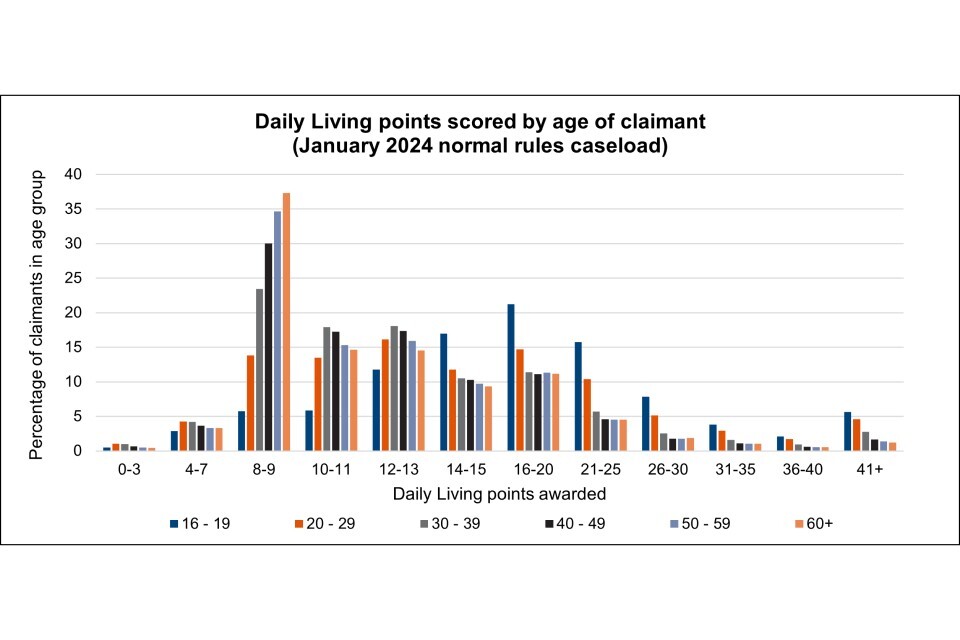
This chart shows the proportion of each age group that score within each Daily Living points band.
The PIP caseload shows stepwise progression in points distribution with age group, with larger proportions of younger groups (notably 16- to 19-year-olds) obtaining higher scores (peak at 16-20 points). This tendency decreases with age, with older groups having highest proportions scoring 8-9 points, increasing with age.
Despite these differences the proportions at the Enhanced award threshold (12-13 points) are fairly similar across different age groups.
Source – Figures derived from DWP administrative data
Mobility scores are much more concentrated than those for Daily Living.
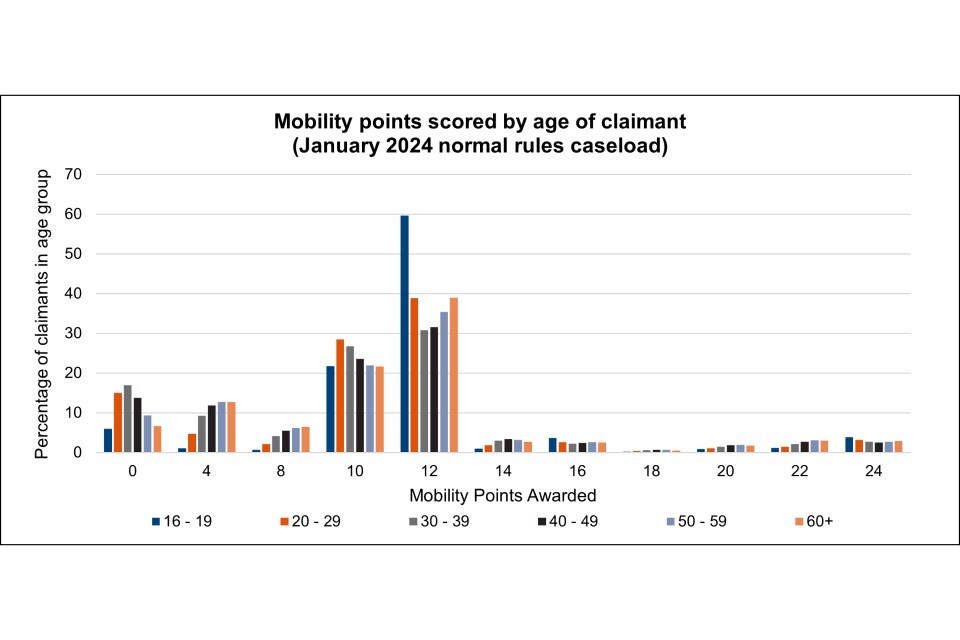
This chart shows the proportion of each age group that score within each Mobility points band.
In all age groups, a score of 12 Mobility points (Enhanced award) is the most common. Scoring 10 points is the second most frequent outcome, much more so than 8 points (both Standard award). A Nil award (0 or 4 points) is more likely for Mobility than for Daily Living award.
The 16 to 19 age group shows the largest proportion by far scoring 12 points (Enhanced award), with 60 per cent of claimants in this age group scoring 12 points. Older age groups show slightly higher proportions scoring 8 points (Standard award) but also 4 points (Nil award).
Source – Figures derived from DWP administrative data
Points awarded vary significantly by primary health condition.
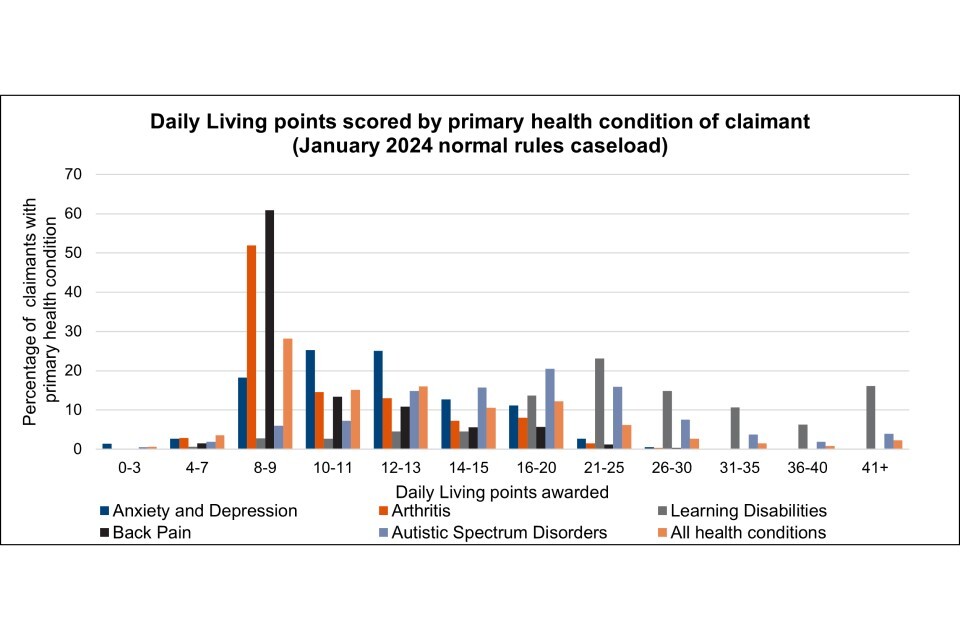
This chart shows the proportion of claimants with the five most common conditions on the PIP caseload that score within each Daily Living points band, along with the proportion of the total caseload in each points band.
The Arthritis and Back Pain health condition categories both show most common scores of 8-9 (Standard award), with the proportion scoring 12 points or more (Enhanced award) lower than the proportion for the overall caseload.
Scores in the Anxiety and Depression category are most often in the range spanning Standard and Enhanced awards (10-13 points).
The Autistic Spectrum Disorder category shows a tendency towards higher scores with largest proportions scoring 12-25 points, while scores in the Learning Disabilities category tend towards higher again, with the proportion scoring 21 points or more significantly above the proportion of the overall caseload.
Source – Figures derived from DWP administrative data
The Anxiety and Depression health condition category most often scores 0 or 10 points, showing claimants with this health condition are more likely to get a Standard award or Nil award compared to the caseload.
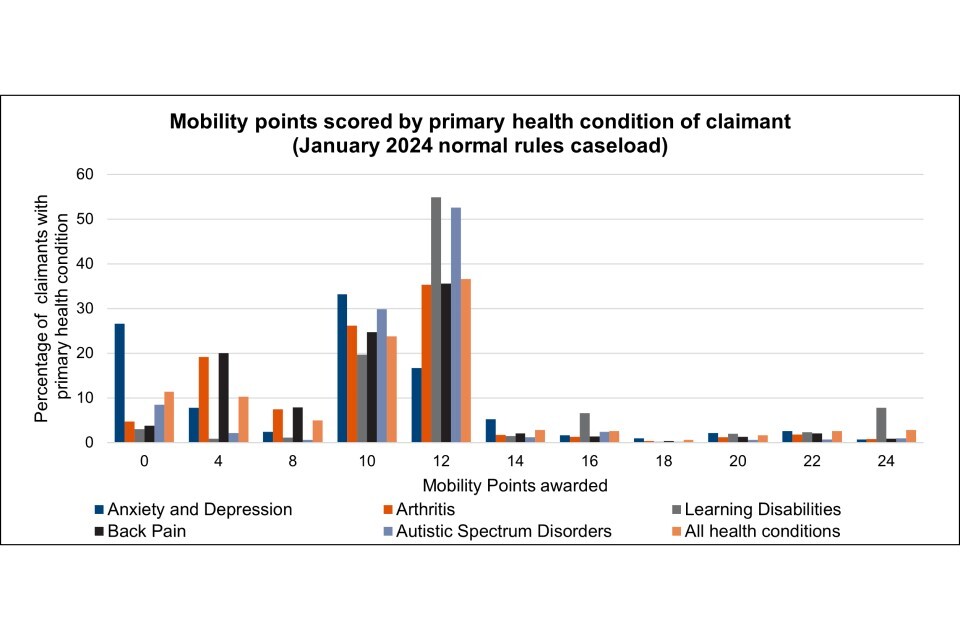
This chart shows the proportion of claimants with the five most common conditions on the PIP caseload that score within each Mobility points band, along with the proportion of the total caseload in each points band.
More than 50 per cent of scores in the Autistic Spectrum Disorders and Learning Disabilities categories are 12 points or more, with claimants in these categories more likely to get an Enhanced award compared to the caseload as a whole.
Conversely, more than 50 per cent of scores in the Arthritis and Back Pain categories score 10 points or fewer (Standard award or Nil award).
Source – Figures derived from DWP administrative data
Receipt of extra costs disability benefits by 16- to 65-year-olds generally increases by age, and has risen for all age groups over the past two decades - though not uniformly so.
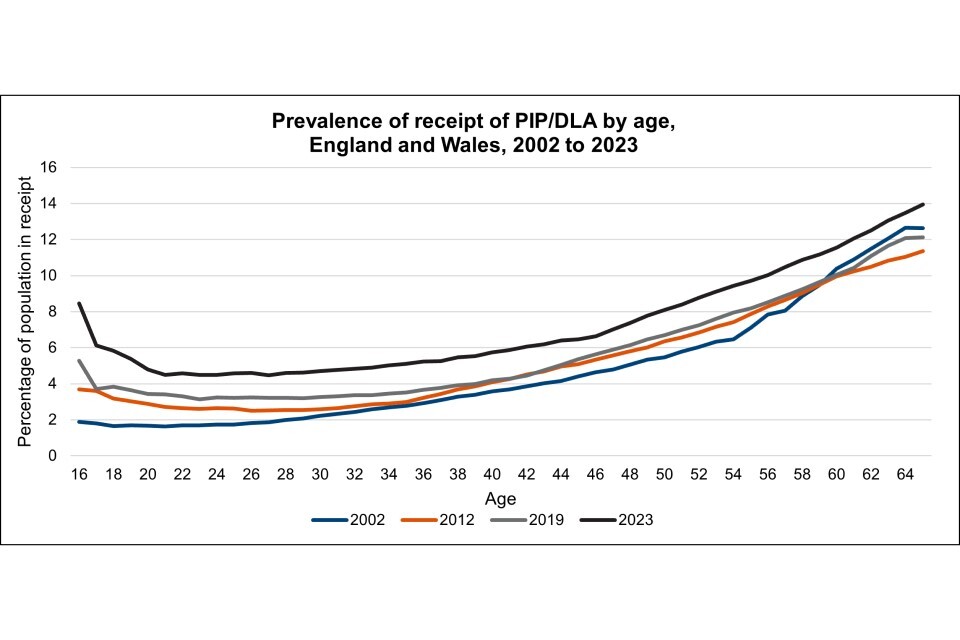
This chart shows the prevalence of PIP/DLA claimants in the population by age, at four points in time (2002, 2012, 2019 and 2023). Demographic change - in particular, the increasing numbers of people in their 50s and 60s - exerts upward pressure on PIP/DLA claims, all else equal; considering prevalence permits the isolation of the non-demographic trends in receipt.
The chart shows the prevalence of people claiming PIP or DLA in the population has been increasing over time, at all ages, with more people than ever before receiving PIP or DLA by 2023. Among the over 60s prevalence of receipt fell between 2002 and 2019, but has risen since.
The increase in prevalence over the whole period has been slightly more marked at younger ages, with the figures for 16-year-olds particularly affected by continued payment of child DLA prior to reassessment.
Increases have been much more significant at all ages since 2019 (immediately before the COVID-19 pandemic). Since late 2018 the upper age limit for making a new claim for PIP has risen with State Pension Age, to 66.
Source – Figures calculated from Stat Xplore data and Office for National Statistics (ONS) population estimates and projections
Anxiety and Depression, and to a lesser extent Autistic Spectrum Disorders, have been the main conditions contributing to growth over the past decade, and particularly since the COVID-19 pandemic.
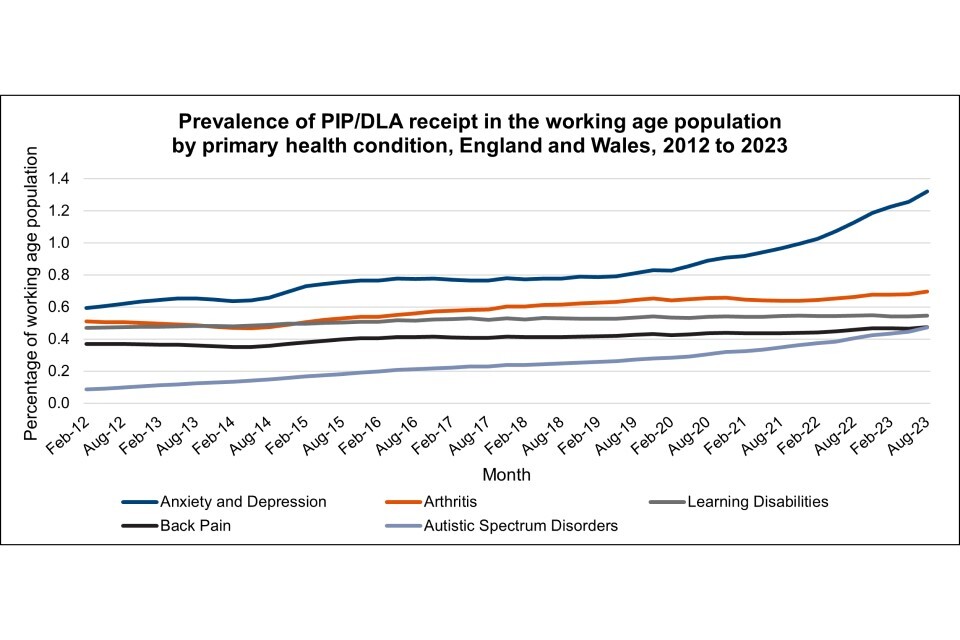
This chart shows the top five most prevalent primary conditions for PIP/DLA claimants in the working age population.
Claimants with Anxiety and Depression have consistently been the group with the highest prevalence, and prevalence more than doubled between 2012 and 2023, from 0.6 per cent of the working age population to 1.3 per cent. Growth has been faster since the pandemic.
The prevalence of claimants with Arthritis as their primary condition has increased by around 0.2 percentage points since 2012, but has remained broadly flat since 2019. Prevalence of claimants with Back Pain has risen by 0.1 percentage points over the whole period.
Prevalence of claimants with Autistic Spectrum Disorders in the population has increased five-fold over the 11 years, from 0.1 per cent to 0.5 per cent of the working age population. There has been very little change in the proportion with Learning Disabilities.
Source – Figures calculated from Stat Xplore data and ONS population estimates and projections
Anxiety and Depression as a primary condition increases with age, though tends to level off then fall after age 40, though this could be because physical conditions are more prominent.
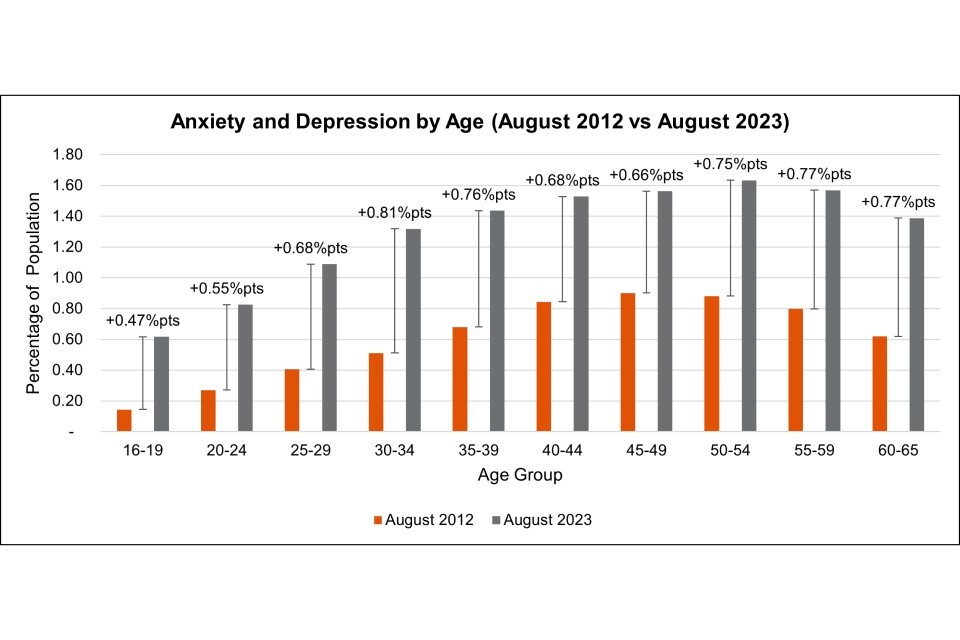
This chart shows the difference in the prevalence in the working age population of PIP/DLA claimants with Anxiety and Depression as their primary condition between August 2012 and August 2023.
Between 2012 and 2023, the prevalence of the population claiming PIP/DLA with Anxiety and Depression has increased in all age groups.
Increases have varied between 0.47 percentage points and 0.81 percentage points, with claimants aged between 30 and 34 having the highest increase in prevalence, although the increases are all above 0.65 percentage points for ages 25 upwards.
Source – Figures calculated from Stat Xplore data and ONS population estimates and projections
Arthritis is heavily related to age.
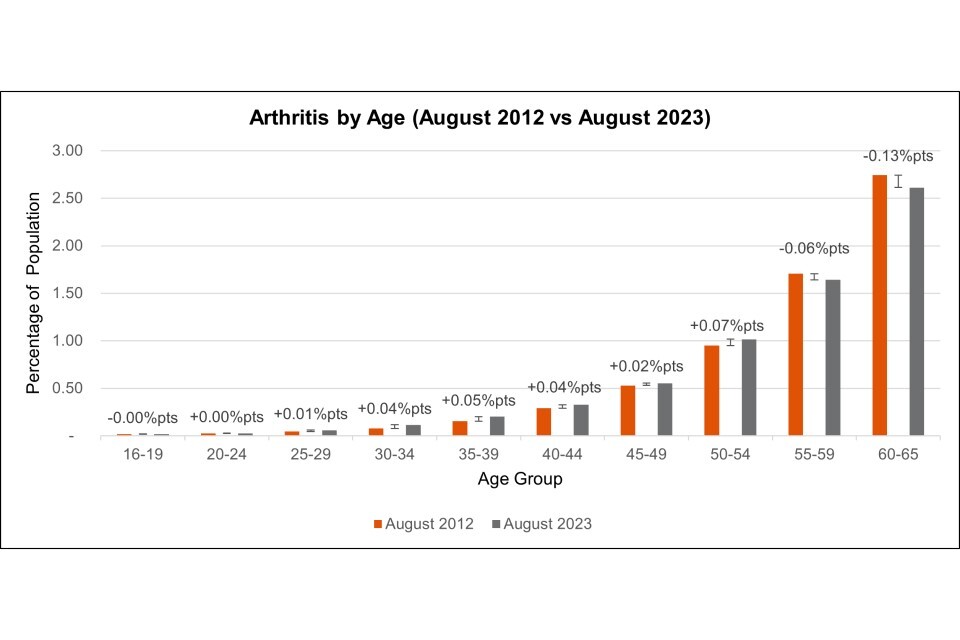
This chart shows the difference in the prevalence in the working age population of PIP/DLA claimants with Arthritis between August 2012 and August 2023.
Over time, the prevalence of the population claiming PIP with Arthritis has seen a small increase across claimants aged 25 to 54.
The prevalence of arthritis in claimants aged 55 and over has decreased slightly over time.
Source – Figures calculated from Stat Xplore data and ONS population estimates and projections
The prevalence of Learning Disabilities as a primary condition tends to decrease with age.
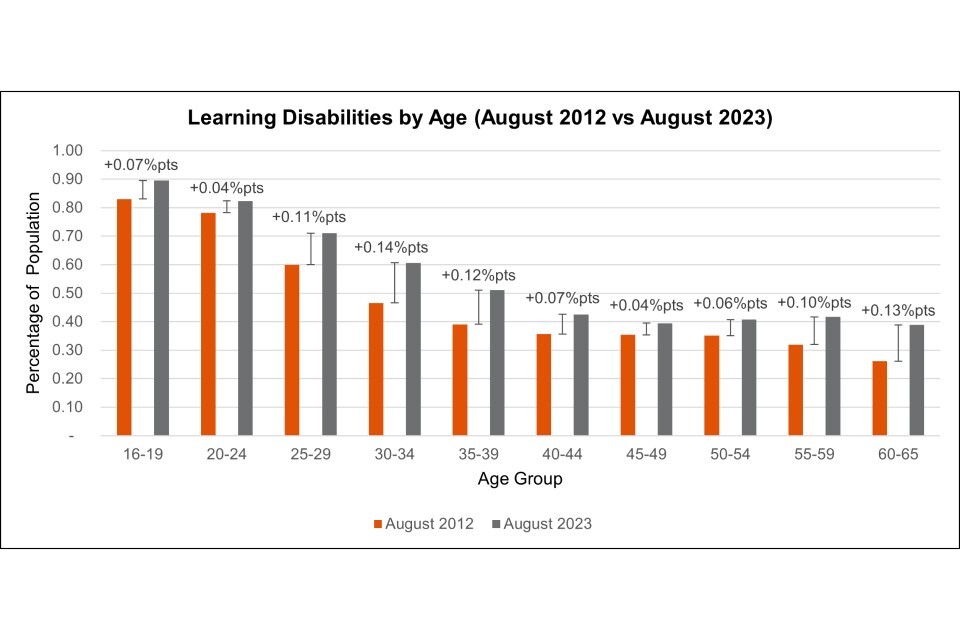
This chart shows the difference in the prevalence in the working age population of PIP/DLA claimants with Learning Disabilities between August 2012 and August 2023.
Over time, the prevalence of the population with Learning Disabilities has seen a small increase across all age groups, more so for those in their late 20s and 30s.
Source – Figures calculated from Stat Xplore data and ONS population estimates and projections
Back pain is heavily related to age.
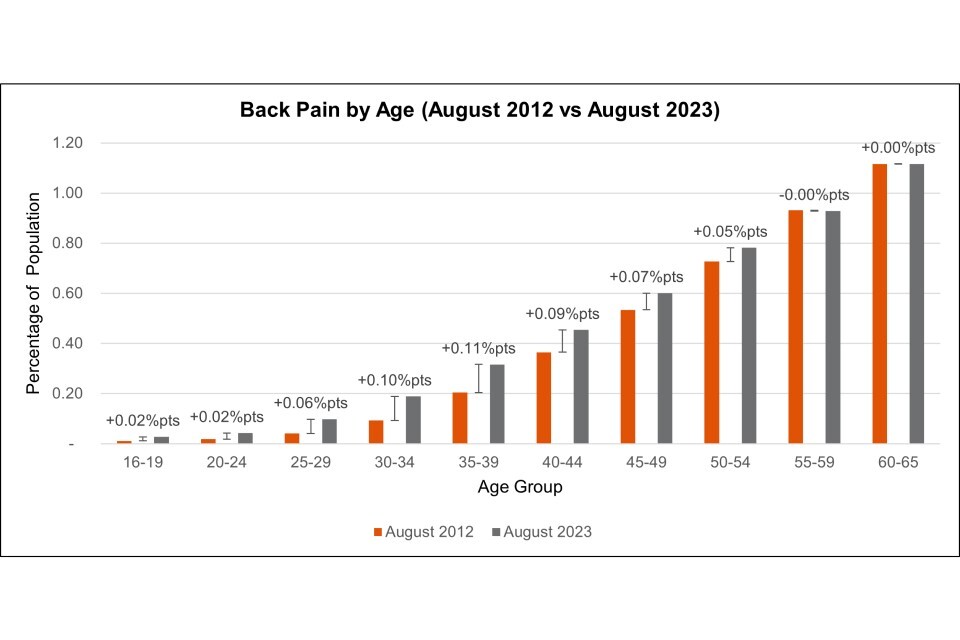
This chart shows the difference in the prevalence in the working age population of PIP/DLA claimants with Back Pain between August 2012 and August 2023.
Over time, the prevalence of the population with Back Pain has seen a small increase across most age groups.
Source – Figures calculated from Stat Xplore data and ONS population estimates and projections
Autism as a primary condition is heavily related to age, and is now by far the most common primary condition for claimants aged under 20.
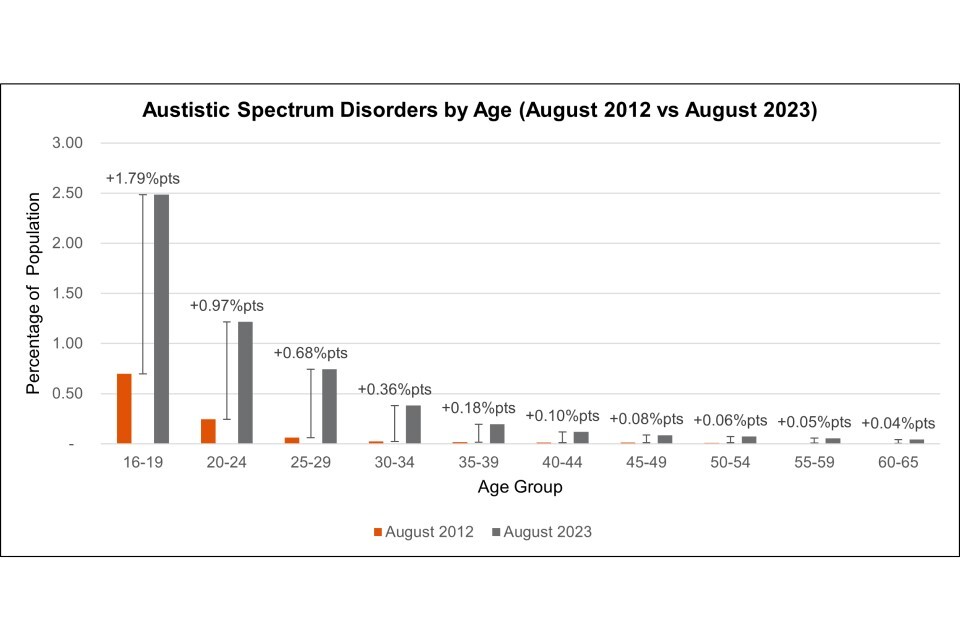
This chart shows the difference in the prevalence in the working age population of PIP/DLA claimants with Autistic Spectrum Disorders between August 2012 and August 2023.
Over time, the prevalence of the population with Autistic Spectrum Disorders has seen a large increase. The increase in prevalence in the 16 to 19 age group for this condition (an increase of 1.79 percentage points) is the largest increase in prevalence for any condition since 2012.
In 2012, the prevalence of Autistic Spectrum Disorders in claimants aged over 40 was very low, nearing no prevalence at all, however by 2023, the prevalence had increased for claimants over age 40.
Source – Figures calculated from Stat Xplore data and ONS population estimates and projections
5. Customer Journey
8 per cent of initial decisions following a PIP assessment have been appealed and 3 per cent have been overturned at tribunal hearing.
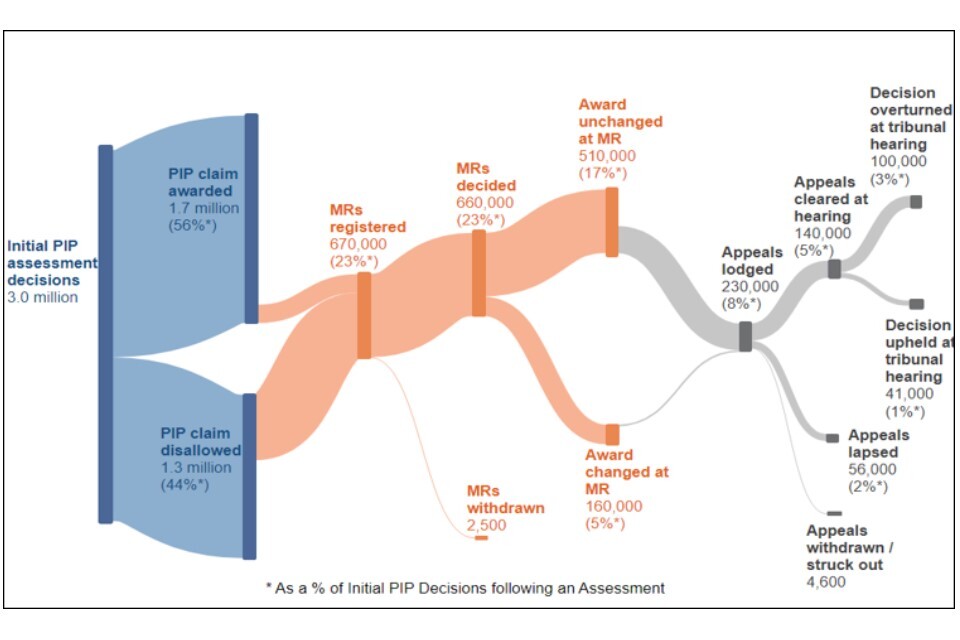
This figure shows the claimant’s journey from initial PIP assessment decision through to Mandatory Reconsideration (MR) and Appeal.
The figure shows that for initial PIP decisions following an assessment during the period October 2018 to September 2023:
There were 3.0 million initial decisions following a PIP assessment, and 56 per cent were awarded PIP.
There were 670,000 Mandatory Reconsiderations (MRs) registered about these decisions (23 per cent of decisions).
24 per cent of completed MRs resulted in a change in award (excluding withdrawn cases).
34 per cent of completed MRs then lodged an appeal.
24 per cent of appeals were lapsed (which is where DWP changed the decision in the customer’s favour after an appeal was lodged but before it was heard at tribunal).
70 per cent of the DWP decisions cleared at tribunal hearing were “overturned” (which is where the decision is revised in favour of the claimant).
8 per cent of initial decisions following a PIP assessment have been appealed and 3 per cent have been overturned at tribunal hearing.
Source – Personal Independence Payment: Official Statistics to January 2024
The proportion of all claimants successful at initial assessment decision has varied between a low of 46 per cent in August 2020 up to over 70 per cent.
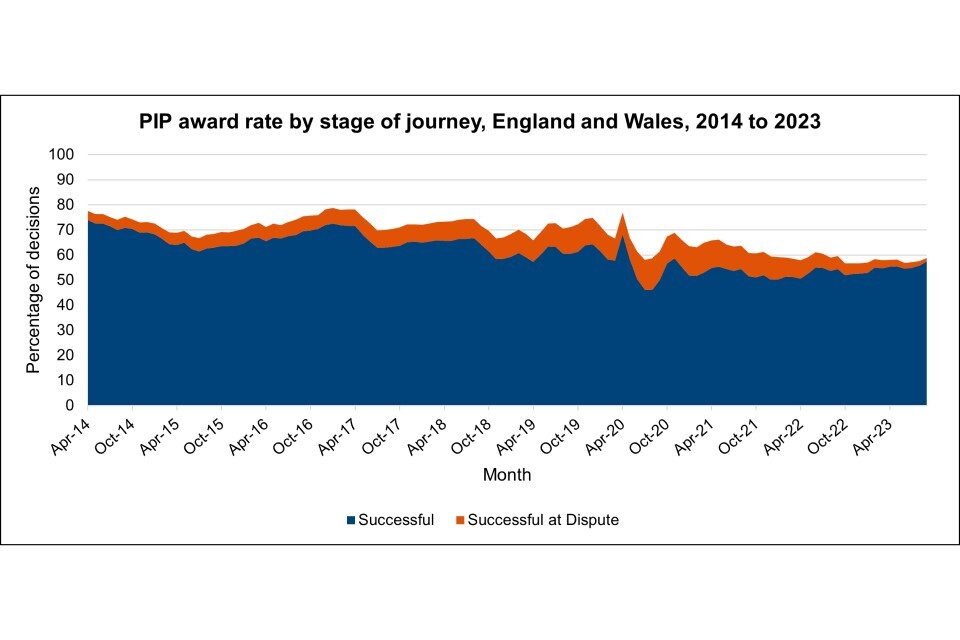
This chart shows the proportion of successful working age PIP decisions, for all conditions. ‘Successful’ indicates PIP awarded at initial assessment decision. ‘Successful at Dispute’ indicates PIP awarded following a dispute process decision - this includes Mandatory Reconsideration (MR), appeal following a Tribunal hearing, or an appeal lapsed by DWP prior to a Tribunal hearing.
When including claimants successful at dispute, the proportions increase to between 57 and 79 per cent. However, the proportion of successful decisions varies by health condition.
The proportion of awards at dispute also varies over time, and is generally higher when the initial award rate is lower. The highest proportion of awards at dispute reached 13 per cent in 2020. Levels of those Awarded at Dispute are lower for more recent periods, however the latest data is incomplete, and this could increase as claimants progress to Mandatory Reconsideration and Appeal and current disputes are resolved.
Source(s): Figures derived from DWP administrative data (except October 2023 to December 2023 in table J2.4 which is sourced from Stat Xplore)
The proportion of successful decisions for PIP claimants in the Anxiety and Depression category has consistently been lower than the All Conditions success rate, with a peak of up to 16 per cent fewer than average claimants being successful at decision in 2019. Apart from during the pandemic, the award rate has remained broadly flat since 2015.

This chart shows the proportion of successful working age PIP decisions, for claimants with Anxiety and Depression, Arthritis and Learning Disabilities (the three conditions with the highest proportion of working age claimants on the PIP/DLA caseload over time), compared with the proportion of successful decisions across all conditions. This includes claimants successful at either initial decision or following dispute.
The proportion of successful decisions for PIP claimants with Arthritis has consistently been higher than the All Conditions success rate, with a peak of up to 8 per cent higher than average claimants being successful. Since the pandemic, the award rate has fallen.
The proportion of successful decisions for PIP claimants with Learning Disabilities has consistently been higher than the All Conditions success rate, with up to 20 per cent higher than average claimants being successful at decision in 2020. Since the pandemic, the award rate has fallen.
Source(s): Figures derived from DWP administrative data (except October 2023 to December 2023 in table J2.4 which is sourced from Stat Xplore)
Highest overall award rates are seen for conditions including Cancer, Autistic Spectrum Disorders, Epilepsy and Cerebral Palsy and Neurological Muscular Diseases; while lower award rates are seen for Anxiety and Depression, Cardiovascular Diseases, Other Regional Musculoskeletal Diseases, and the combined group of Other Conditions.
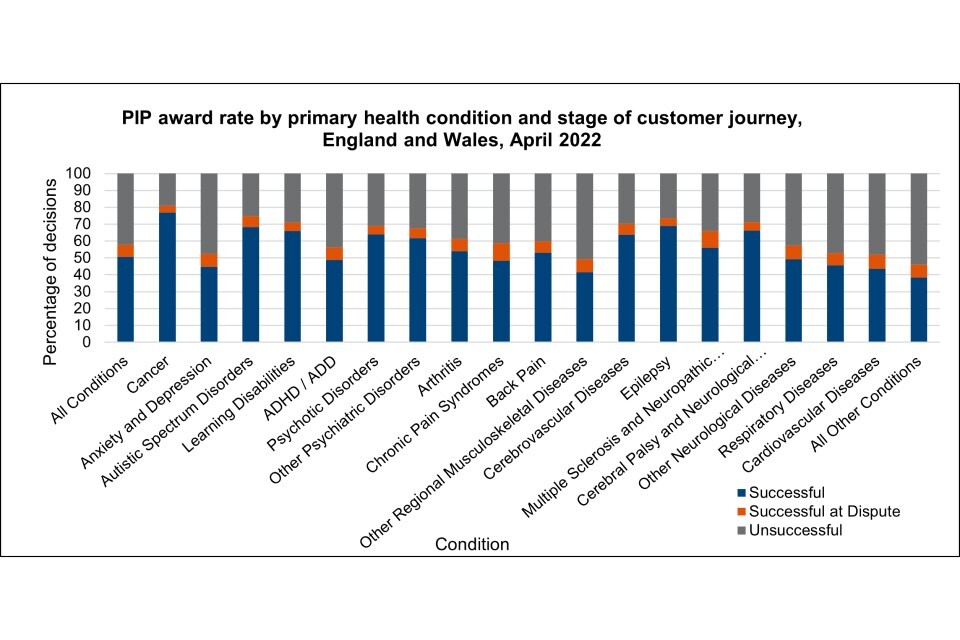
This chart shows the proportion of successful working age PIP decisions by condition, in April 2022. Data for more recent periods is subject to change as claimants progress through the disputes process, while most claims from April 2022 will have completed the disputes process.
Source(s): Figures derived from DWP administrative data (except October 2023 to December 2023 in table J2.4 which is sourced from Stat Xplore)
6. Employment status of PIP claimants
Over 40 per cent of people registering a PIP claim are in employment in the month of registration.
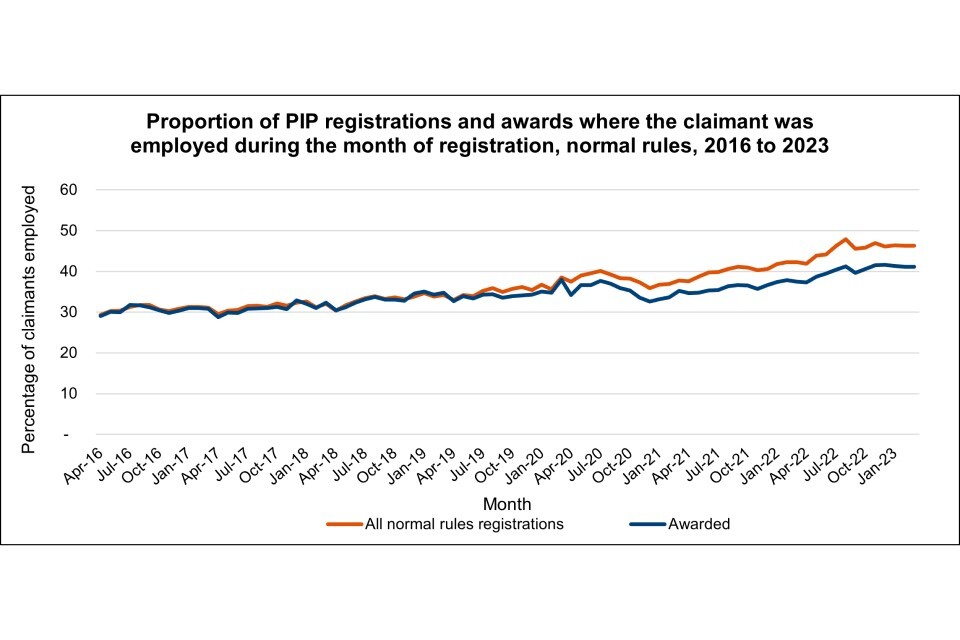
The chart shows the proportion of normal rules claimants registering for PIP who are employed during their month of registration increased steadily over time up until the COVID-19 pandemic, where there was a decrease for a few months before it began to increase again.
Currently, those who are employed are less likely to be successful in their claim than those who are not employed. However, this was not always the case. 29 per cent of claimants registering in April 2016 who were later awarded PIP were employed, the same proportion as the total registering. However, 41 per cent of those registering for PIP in March 2023 who were later awarded PIP were employed, compared to 46 per cent for all registrations.
Source(s): Figures derived from DWP and HMRC administrative data
Fewer than one in six claimants of PIP are in employment.
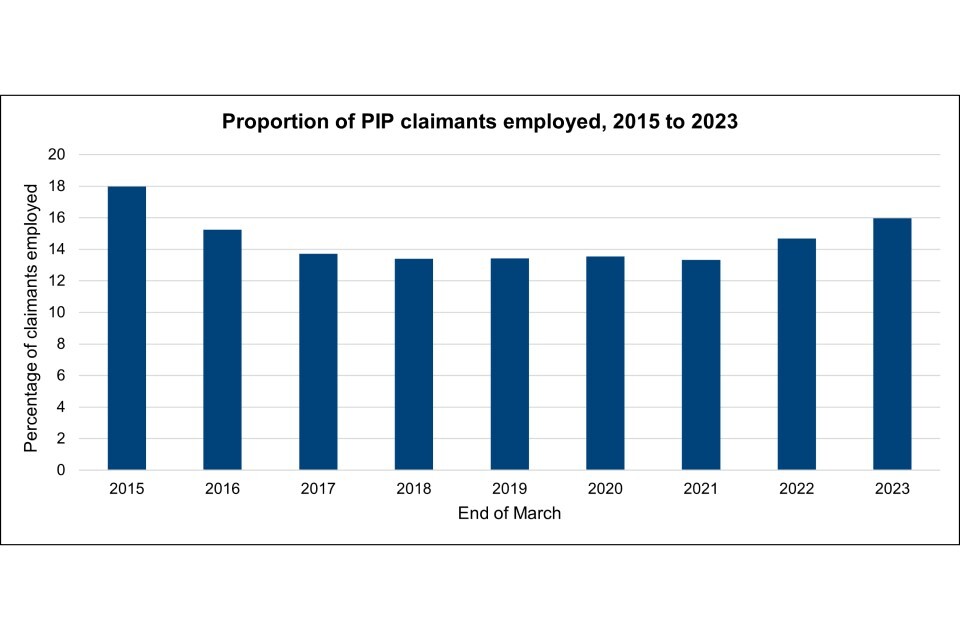
The chart shows the proportion of the PIP caseload who are employed fell from 18 per cent in March 2015 to 13 per cent in March 2018. However, during this period a large number of Disability Living Allowance claimants were reassessed for PIP; these were longer-term claimants and therefore more likely to be severely disabled and therefore less likely to be employed.
The proportion of claimants who were in employment stabilised at around 13 per cent from March 2018 until March 2021.
Since the COVID-19 pandemic the proportion has started to increase, from 13 per cent in March 2021 to 16 per cent in March 2023. Nevertheless, it is still much lower than the employment rate of new claims.
Source(s): Figures derived from DWP and HMRC administrative data
7. Award Reviews
The largest proportion of clearances across all years have their award maintained, and this has increased over time. A smaller proportion have their award decreased or increased.
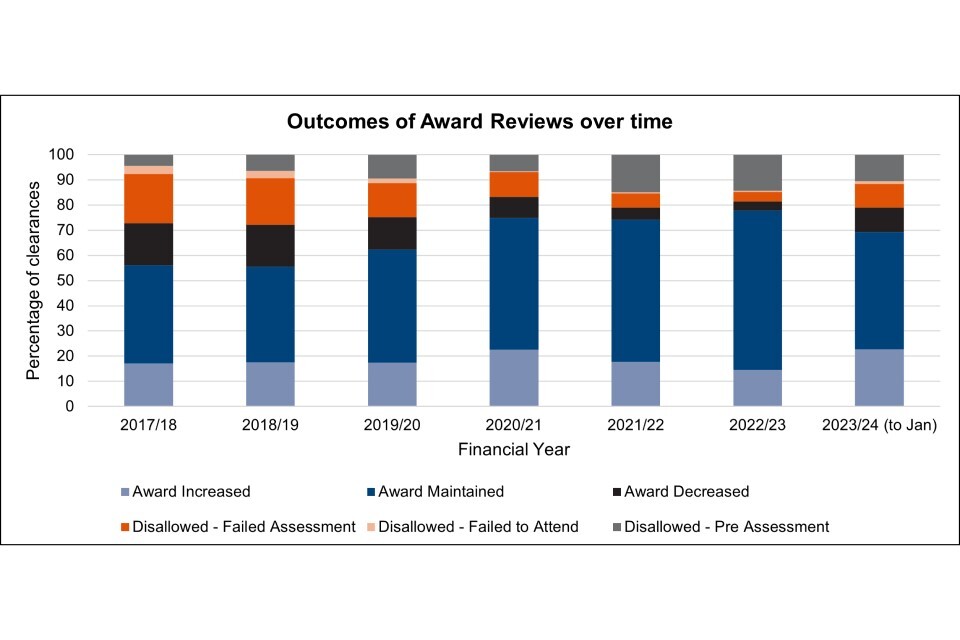
This chart shows the proportion of Award Review clearances by outcome over time.
The share of outcomes which were disallowed decreased in 2020/21 due to COVID-19 easements, but has since increased slightly. During the COVID-19 pandemic, the department managed the capacity available by pausing assessments for Award Reviews in some cases. The share of outcomes which were disallowed for failed assessments in 2020/21 decreased due to this. From 2021/22 there was an increase in the share and proportion of outcomes where claimants were disallowed prior to assessment. The backlog began to be cleared in 2023, which caused a rise in disallowances after assessment.
Source(s): Stat-Xplore
8. Costs of Disability
Definition of cost of disability
The “cost of disability” is the additional net amount of money a disabled person, or person with long term health conditions, needs to spend that a non-disabled person does not. These costs include specialised goods and services that only disabled people would need such as mobility aids, but can go wider than that. Disabilities and health conditions can create additional cost in other areas of personal expenditure, including non-specialised goods and services which everyone needs but disabled people might need more of, such as heating in the home. As such defining what is or is not a disability related cost can be complex.
Disability can create costs in different ways. Firstly, there are the personal expenditure costs which are faced by disabled people themselves. Secondly, there are also opportunity costs, such as the lost income and time of the disabled person themselves, or of the family members or friends who act as carers instead of attending school or work. Lastly, disability more widely causes costs to society through spending on public services.
We focus here on the personal expenditure costs faced by disabled people themselves.
Types of personal expenditure costs of disability
Disability-related additional costs can be classified into the following three types (Scope 2015):
- Disability-specialised goods and services: Expenses that only disabled people incur, which can involve both one-off purchases and recurring spending.
- Greater use of common goods and services: This includes spending on items common to disabled people and non-disabled people, but which disabled people need to use more of and therefore spend more money on.
- Higher costs for common goods and services: This category includes anything which costs more for disabled people than for non-disabled people, for an equivalent product or service.
Examples of disability-related additional costs
| Disability-specialised goods and services | Greater use of common goods and services | Higher costs for common goods and services | |
|---|---|---|---|
| Equipment and aids | Mobility vehicles, including insurance, maintenance (IRISS 2022) | Energy to run equipment (Evans et al 2023) | |
| Personal assistance | Interpreters for deaf people Personal care support (Mont & Cote 2020) |
Help around the home (DWP 2023) | |
| Health and personal care | Prescribed medications (DWP 2023; Scope 2023) Pain management and other therapies (JRF 2004) Incontinence pads (IRISS 2022) |
Greater use of hygiene products (IRISS 2022) | |
| Transportation | Vehicle adaptations and additional personal assistant insurance (JRF 2004) | Greater reliance on taxis and private hire vehicles to get around (Scope 2016) More trips to and from appointments (Evans et al, 2023) |
Being charged more for accessible taxis and private hire vehicles (Evans et al, 2023; Scope, 2015) Public transport fare for personal assistants where concessions do not apply (IRISS 2022) |
| Energy and utilities | More heating used by people who spend more time at home/are housebound, incl. those with mental health conditions (DWP 2023) Increased heating for those with conditions which cause them to be cold easily or which mean they must stay warm e.g. cerebral palsy, HIV, COPD (Chronic Obstructive Pulmonary Disease), cancer (DWP 2023) Increased water usage for participants who have to wash clothing and bedding more due to incontinence (DWP 2023) |
||
| Clothing and bedding | Soiling and wear and tear leads to frequent washes and replacement of items (Scope 2016) | Specially adapted clothing (IRISS 2022) Specialised footwear (DWP 2023) Tailoring to accommodate body shapes/needs (Scope 2016) |
|
| Food | Dietary supplements (IRISS 2022) | Ready meals and/or takeaways for those that are not able to cook (DWP 2023; Scope 2023) | Increased costs due to special dietary needs e.g. soft food or gluten-free (DWP 2023) People with OCD (obsessive compulsive disorder), anxiety disorders, eating disorders may be compelled to eat specific types of food (DWP 2023) |
| Insurance | Insurance for personal assistants, equipment, and aids, etc. (JRF 2004; IRISS 2022) | Disabled people being charged more for insurance than non-disabled people, or refused insurance outright (Scope 2015) | |
| Housing | Home adaptations (DWP 2023) | Hiring out regular maintenance and repairs (JRF 2004) | Fewer accessible housing options (IRISS 2022) |
Sources cited
DWP (2023) Uses of Health and Disability Benefits
Evans et al (2023) The financial wellbeing of disabled people: The extra costs of disability
IRISS (2022) Disability and extra living costs
JRF (2004) Monitoring poverty and social exclusion
JRF (2016) Disability and poverty in later life
Mont & Cote (2020) Inclusive social protection for empowerment of persons with disabilities
9. Important terms and abbreviations
Terms and abbreviations used throughout this publication
Appeal
If the claimant still disagrees with the decision following a Mandatory Reconsideration, they can lodge an appeal with His Majesty’s Courts & Tribunal Service (HMCTS). Some appeals are cleared without a tribunal hearing, where the following outcomes are possible: a) withdrawn by the customer or struck out by the tribunal; or b) lapsed – where DWP change the decision in the customer’s favour. Some appeals are cleared at a tribunal hearing, where the following outcomes are possible: a) DWP decision upheld by the tribunal; or b) DWP decision overturned by the tribunal.
Award
Where the decision is made to award PIP to the claimant, in most cases after a functional assessment has taken place.
Caseload
The number of people receiving a benefit at a particular point in time or averaged over a period.
Clearances
The resolution of an initial registration, and includes all possible outcomes – awards, disallowances, and withdrawal.
Claim
A request for a benefit.
Devolution
The Scottish Government is now replacing PIP with Adult Disability Payment (ADP), a new benefit launched in 2022. Executive competence for PIP was transferred to the Scottish Government from April 2020, with DWP continuing to administer PIP for people resident in Scotland until they are moved to ADP.
Disabled people
People with a disability or long-term health condition.
Disallowance
Often where an assessment has taken place, and the decision is made to disallow the claim – though a disallowance can also occur prior to assessment.
Dispute
Where the claimant asks for a decision to be reconsidered at Mandatory Reconsideration, or appeal stages.
DLA
Disability Living Allowance, which is being replaced by PIP and helps with the extra costs associated with long term ill-health or a disability.
ESA
Employment and Support Allowance, which people can apply for if they have ill-health or disability that affects their ability to work.
Mandatory Reconsideration
If the claimant disagrees with a decision on their claim, including where an award has been given, they can ask for a Mandatory Reconsideration (MR).
Normal Rules
All claims not made meeting the Special Rules for End of Life criteria.
Outcome
The result of a clearance or dispute – either an award, a disallowance, or a claim withdrawal.
PIP
Personal Independence Payment, which can help people with some of the extra costs associated with long term ill-health or a disability.
Prevalence
The proportion of a population who have a specific characteristic in a given time period.
Registrations
The start of the PIP customer journey, a claimant registers for a claim.
SREL
Special Rules for End of Life allow people nearing the end of life to get faster, easier access to certain benefits, get higher payments for certain benefits, and avoid a medical assessment.
UC
Universal Credit, which is a payment to help with living costs. It is replacing 6 other benefits. These are Child Tax Credit, Housing Benefit, Income Support, income-based Jobseeker’s Allowance (JSA), income-related Employment and Support Allowance (ESA), and Working Tax Credit.
Definition of medical conditions
ICD Group refers to the World Health Organisation’s International Classification of Diseases (2010) Condition Groups. These are sometimes referred to as medical conditions in DWP statistics. For reporting purposes, the conditions as recorded on DWP systems have been mapped to reflect as closely as possible the appropriate ICD10 code. Conditions are based on evidence provided and may not represent a person’s most recent medical condition. Where someone has more than one diagnosis or disabling condition, only the predominant one is reported on in these statistics.