Section 1 - Fleet
Updated 19 December 2023

© Crown copyright 2023
This publication is licensed under the terms of the Open Government Licence v3.0 except where otherwise stated. To view this licence, visit nationalarchives.gov.uk/doc/open-government-licence/version/3 or write to the Information Policy Team, The National Archives, Kew, London TW9 4DU, or email: psi@nationalarchives.gov.uk.
Where we have identified any third party copyright information you will need to obtain permission from the copyright holders concerned.
This publication is available at https://www.gov.uk/government/statistics/uk-sea-fisheries-annual-statistics-report-2022/section-1-fleet
1. Key Statistics - Fleet
In 2022 there were 5,541 UK registered fishing vessels. This represents a 14% reduction in the last ten years, however Gross Tonnage (GT) has remained similar at 203 thousand tonnes.
Approximately 21% of the UK fleet is represented by vessels over 10 metres in length, of which 44% are administered in Scotland.
There are around 10 thousand fishers working on UK registered vessels. This is a reduction of 2,100 fishers in the last ten years
2. Fleet Characteristics
Capacity and power
As well as the total number of vessels, the fleet can also be assessed in terms of their capacity and power. Capacity is usually measured in gross tonnage (GT) which is a volumetric measure of a vessel capacity. The power (kW) of a vessel refers to the vessel’s engine power.
The MMO holds data on the capacity and power of all individual UK vessels and these figures are aggregated to compare groups of interest. This allows for a more nuanced assessment of the fleet, as opposed to looking at the number of vessels alone.
The number of UK fishing vessels has reduced by 52% over the past three decades, from over 11 thousand vessels to approximately 5.5 thousand.
The power (kW) of the UK fleet has also decreased by 41% over the past three decades[footnote 1]. Two key changes which have contributed to this are national and international policies introduced to ensure the sustainability of fish stocks:
-
Greater controls on fishing opportunities
-
Fleet capacity reductions through decommissioning exercises
Figure 1.1[footnote 2] [footnote 3] : Fleet characteristics split by country of admin within the UK.
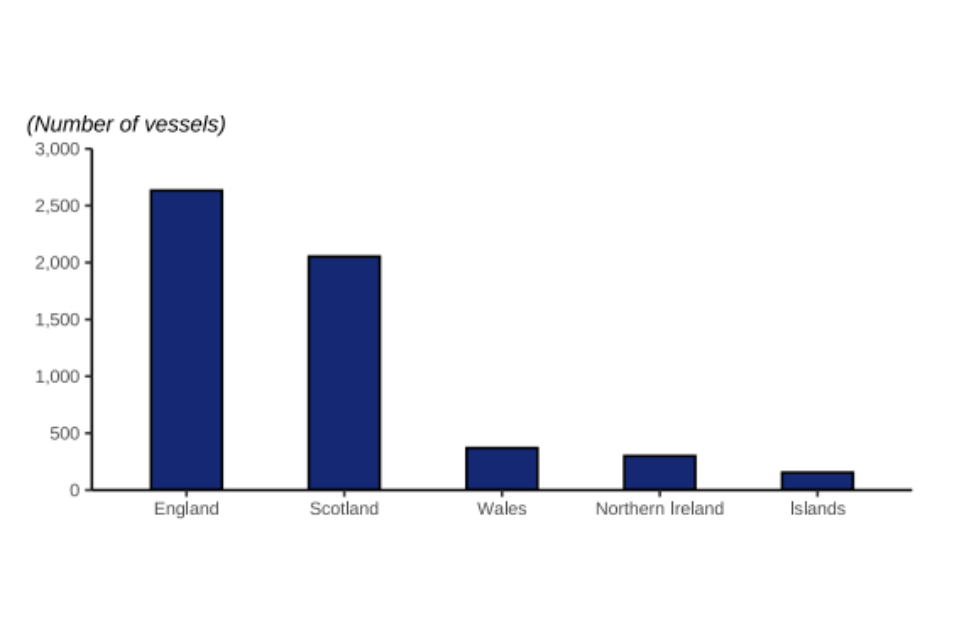
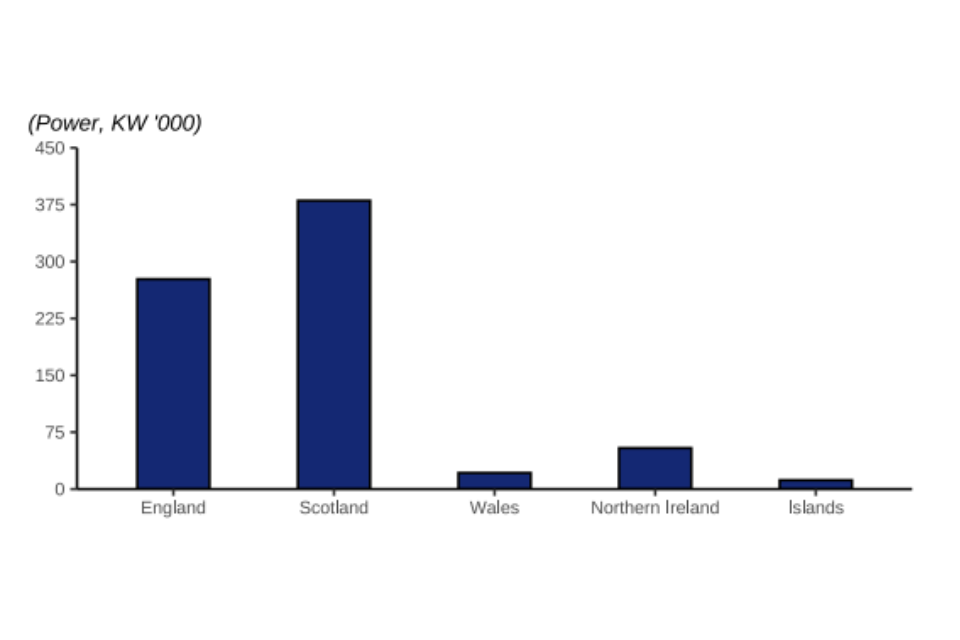
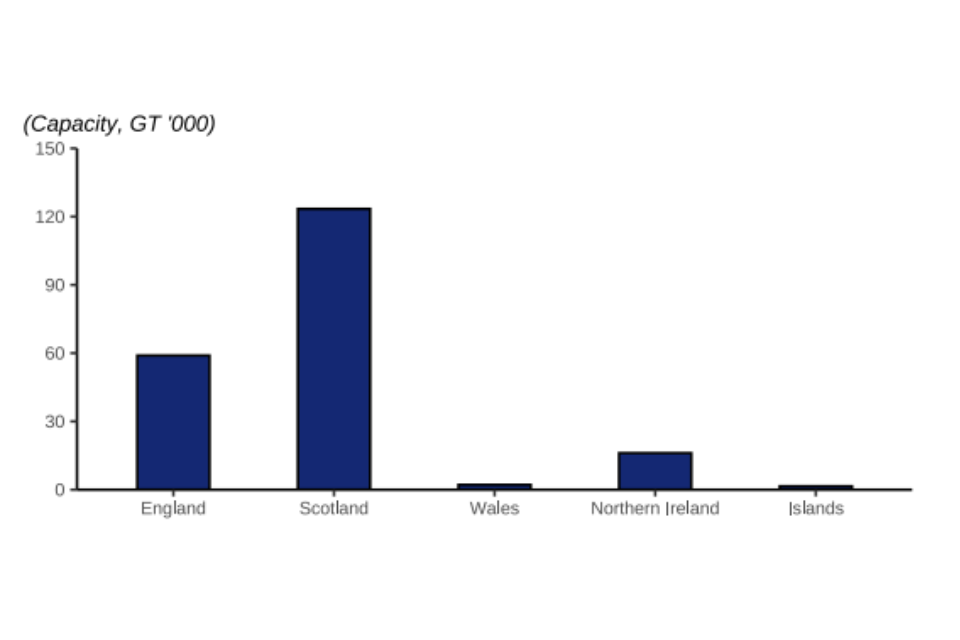
In 2022, England contributed the highest number of vessels to the UK fleet, but Scotland’s fleet had more power and capacity. English vessels represent 48% of the total number of vessels in the UK while Scottish vessels 37%. This proportion has remained the same since 2020, with little change over the last decade. The Scottish fleet has the greatest overall capacity (61%) while the English fleet accounts for 29% of the total fleet capacity.
3. Vessel length
Figure 1.2: Fleet composition showing proportion of over 10m and proportion of under 10m vessels in country of admin
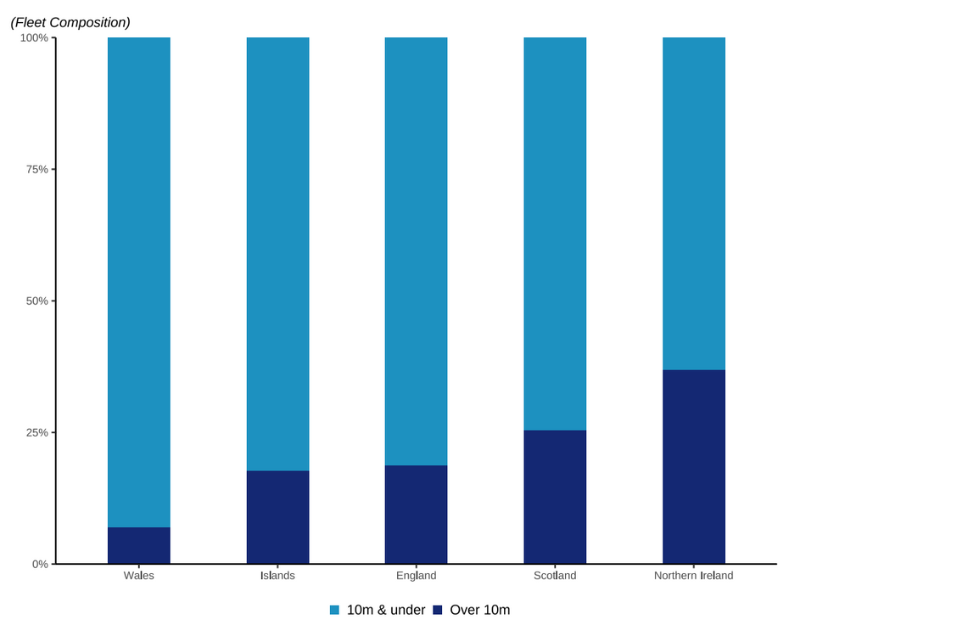
The Welsh fleet has the lowest proportion of vessels over 10m. The smaller number yet higher capacity of Scottish compared with English vessels (Figure 1.1) can be explained by Scotland having a higher proportion of larger, more powerful vessels in comparison to the English fleet.
The fleet with the largest proportion of vessels over 10 metres in the UK is the Northern Irish fleet. The different length composition of the fleet can again be used to explain why the Northern Irish fleet has more capacity and power than the Welsh and island fleets, despite having a similar number of vessels.
In 2022, there were 31 vessels that could not be assigned to a country. These vessels are registered but not administered by a port; typically, new vessels and vessels in the process of moving to another administration[footnote 4].
Fish stock
A fish stock refers to a fish population that is isolated from other stocks of the same species. For example, around the UK there are several cod stocks – including e.g. Cod 7d in the Channel and North Sea Cod. Many fish stocks are managed by quotas – limits set on the tonnage that can be caught. Currently the UK has quota for around 100 different fish stocks.
Owing to the diverse nature of the fishing industry, it is difficult to provide a simple explanation of the variation seen across the fleet. The main influencer is the different fish stocks that the fleets target. Key elements of the Scottish fleet target several fisheries that are high volume but lower priced, such as herring and mackerel caught in the North Sea and West of Scotland waters. To target these stocks, the Scottish fleet has moved towards having higher capacity vessels which cover large sea areas and can catch large volumes (several hundred tonnes) of fish per trip.
Compared with this, the English fleet is involved in several key fisheries that are typically lower volume but higher priced, such as the Channel fisheries for sole and plaice. In addition, a greater proportion of the fisheries pursued by the English fleet cover inshore areas. Together these factors have allowed the English fleet to develop with a greater proportion of smaller vessels that are able to be economically viable through catching smaller quantities of more valuable fish. Changes in fishing opportunities over time have been key drivers for the development of the fleet.
Figure 1.3: Fleet characteristics by vessel length groups.
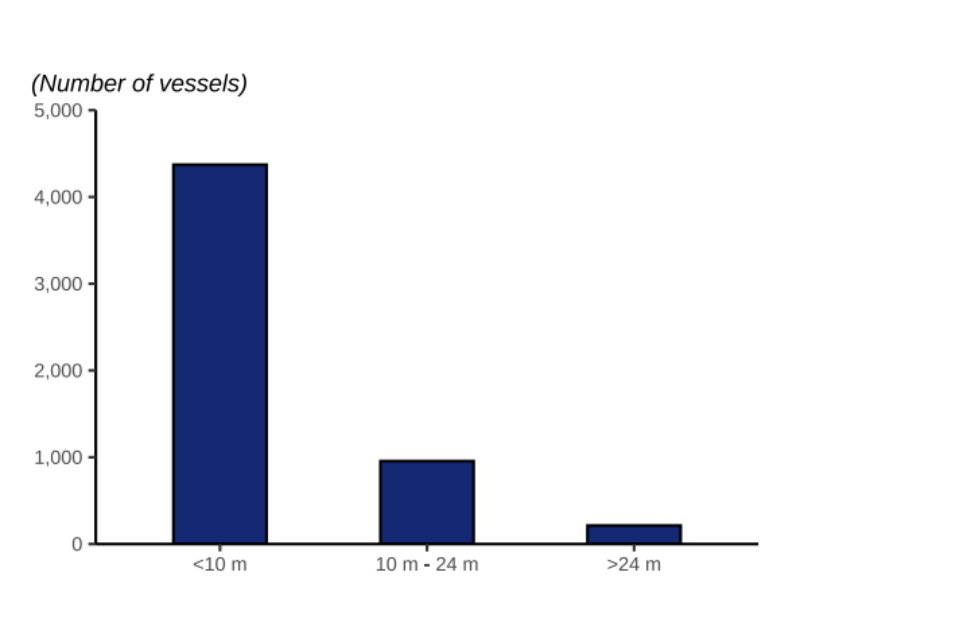
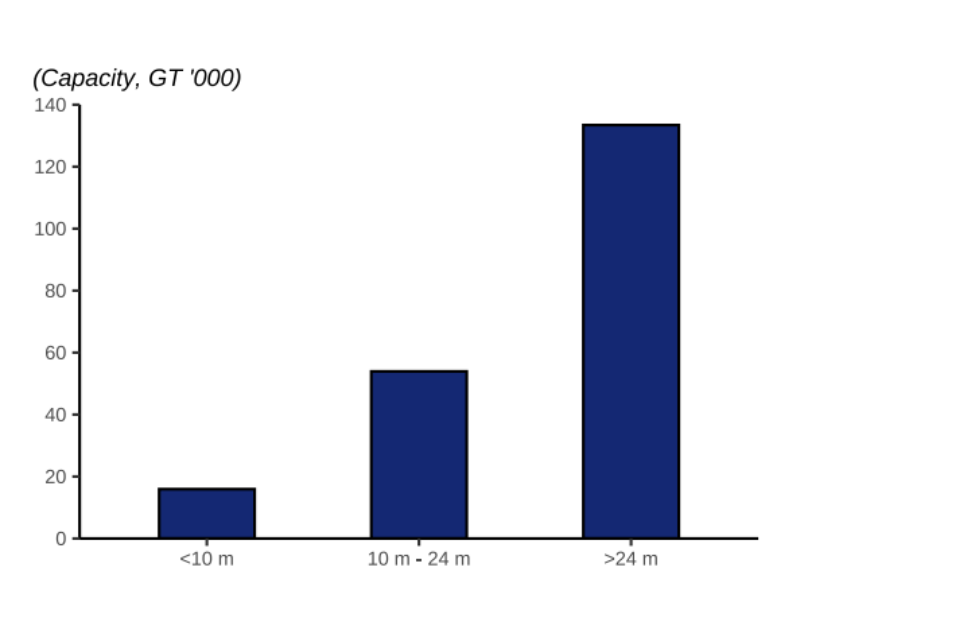
Larger vessels contribute more to the UK fleet’s capacity than smaller vessels. Vessels under 10 metres make up 79% of the UK fleet but only contribute 8% to the fleet’s total capacity. Larger vessels of more than 15 metres make up 10% of the total fleet by number representing 85% of the fleet’s capacity. This is because larger vessels utilise fishing gear that can catch larger quantities and hold greater amounts of fish per trip and can journey for longer distances to better fishing locations.
The Scottish fleet has larger vessels than the English fleet. The average length of a Scottish vessel is 13 metres, while the average length of an English vessel is just over 11 metres. As a result, the Scottish fleet has over twice the capacity than the English fleet despite the English fleet having 29% more vessels.
4. Age of vessels
Figure 1.4: Fleet characteristics by age of vessels within the UK fleet.
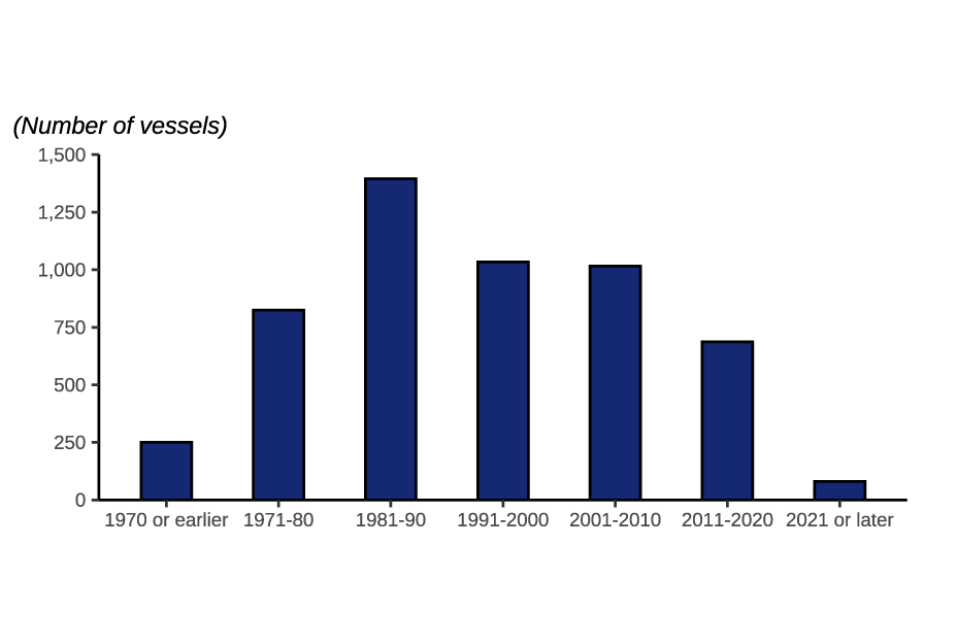
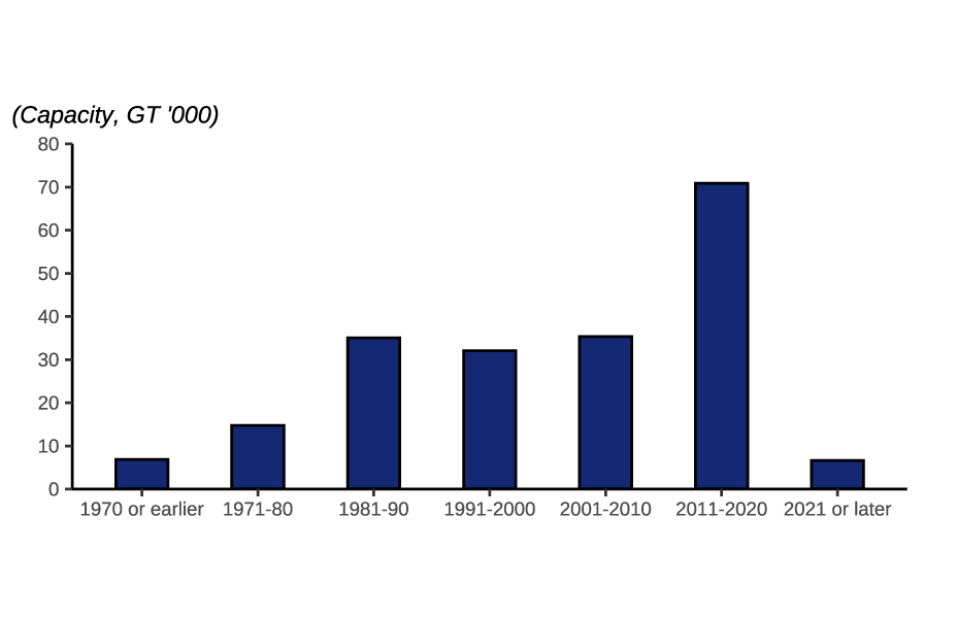
Vessels built in 2011 or later have a much higher capacity than vessels built prior to 2011. While the number of vessels built in the last four decades has decreased, the total capacity and power of those built since 2011 has increased substantially. These modern vessels (built since 2011) contribute 38% of the fleet’s capacity, while only making up 14% of the vessels in the UK fleet. In comparison, vessels built between 1981 and 1990 account for 25% of the total number of vessels in the fleet but only 17% of the fleet’s total capacity. This illustrates the transition within the UK fleet to fewer but larger vessels that have higher capacity and are more efficient in utilising the fishing opportunities available.
5. Industry Groups
Fish Producer Organisations (FPOs)
FPOs are officially recognised bodies set up by fishery or aquaculture producers. In the UK, they are responsible for managing the quota for their vessels and play an essential role in fisheries management.
On 31 December 2022, 739 vessels over 10 metres in length were members of a FPO, 63% of all vessels over 10m. The remaining 430 vessels over 10m were not members of an FPO and were therefore members of the non-sector. The proportion of non-sector vessels (37%) has remained relatively stable since 2018.
The composition of FPOs varies greatly; Scottish FPO had the highest membership with 142 vessels, although The average number of vessels in an FPO was 30[footnote 5] .
6. Fishers on Vessels
Figure 1.5: Total number of fishers in the UK split by regular and part time fishers from 1996 to 2022
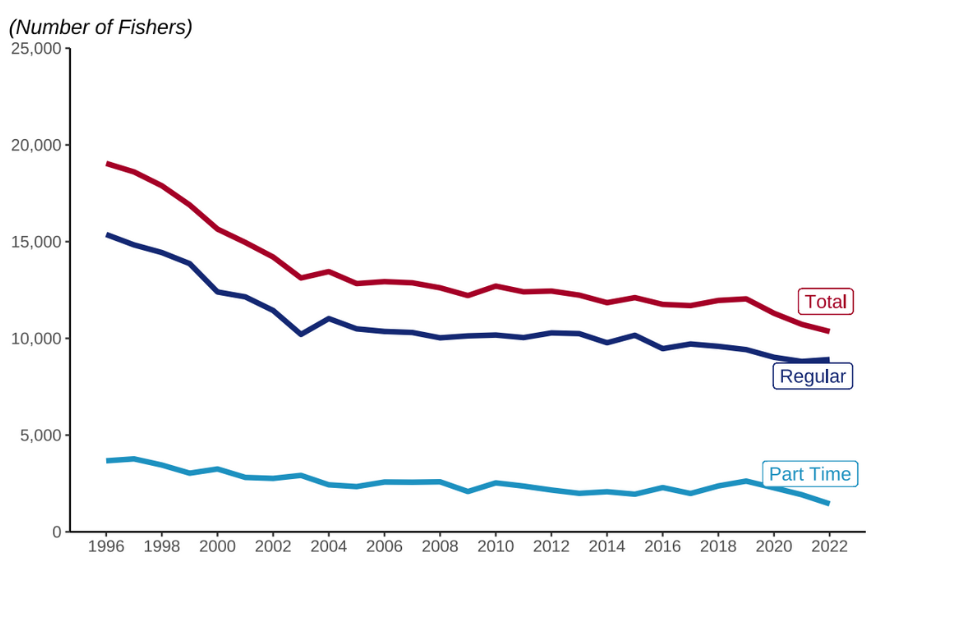
Compared to 2021, the total number of fishers decreased by over 3% in 2022. This amounted to almost 400 fewer jobs in the catching sector. This is less of a decrease from 2020 to 2021, which had a 5% decrease with almost 600 fewer jobs.
The total number of fishers in the United Kingdom has steadily declined by 48% since 1995.
The number of part time fishers in 2022 decreased by 25% since 2021 and is 63% less than in 1995. The decrease in number of part-time fishers in 2022 from 2021 can be accounted for due to changes in COVID. With crewing on vessels becoming more stable with the easing of COVID regulations, more part-time fishers left or became regular fishers. This is reflected by a slight increase in regular fishers in 2022 compared to 2021, when numbers have been decreasing since 2017.
The long-term decrease in the number of fishers is associated with reductions in fleet size and the move to fewer but larger vessels. Relative to their capacity, larger vessels do not require as many fishers as small vessels. As the UK fleet transitions to having more of these large ships rather than a higher proportion of small ships, there are fewer jobs in the catching sector.
Another reason for this decline is policies that limit fishing activity to protect fish stocks and the marine environment. National and international policies that limit fishing activity, such as the western waters and Sole recovery zone effort regimes, can reduce the number of available fishing jobs while insuring the sustainability of the industry.
7. Fishers by UK nation
Figure 1.6: Number of fishers in the UK by country with proportions of regular and part time fishers
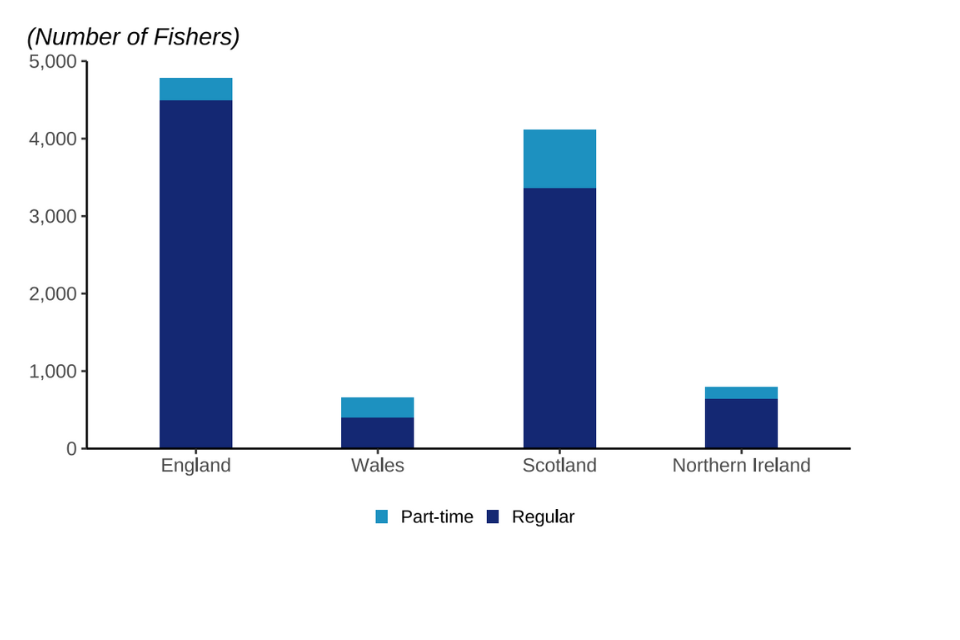
Fishers working on English and Scottish vessels make up 86% of fishers on UK vessels. 46% of UK fishers work onboard English vessels and 40% work on Scottish vessels. The remaining 14% is split 8% for Northern Irish vessels and 6% for Welsh vessels. Welsh vessels have the highest proportion of part time workers (39%), compared to lowest in England where only 6% of fishers are part time. The Scottish fleet has a 52% higher capacity that the English fleet but employs 669 fewer fishers. This demonstrates that fleets with a higher proportion of large ships require fewer fishers while having a higher capacity.
-
Table 1.1 ↩
-
In this figure and throughout the publication, Islands refers to the Crown Dependencies of Isle of Man, Jersey and Guernsey. ↩
-
The figures and values reported here are based on the country of administration for the vessel while the figures in Tables 1.1 and 1.2 are based on the country associated with the district the vessel is administered by. Some Island vessels (based on country of administration) are assigned to England in the associated tables as the district of their admin port is Plymouth in England. ↩
-
Table 1.2 ↩
-
See Table 1.5. ↩