Reported road casualties in Great Britain, provisional estimates involving illegal alcohol levels: 2019
Published 11 February 2021

© Crown copyright 2021
This publication is licensed under the terms of the Open Government Licence v3.0 except where otherwise stated. To view this licence, visit nationalarchives.gov.uk/doc/open-government-licence/version/3 or write to the Information Policy Team, The National Archives, Kew, London TW9 4DU, or email: psi@nationalarchives.gov.uk.
Where we have identified any third party copyright information you will need to obtain permission from the copyright holders concerned.
This publication is available at https://www.gov.uk/government/statistics/reported-road-casualties-in-great-britain-provisional-estimates-involving-illegal-alcohol-levels-2019/reported-road-casualties-in-great-britain-provisional-estimates-involving-illegal-alcohol-levels-2019
About this release
This publication presents provisional estimates of casualties arising from reported accidents involving at least one motor vehicle driver or rider over the legal alcohol limit for driving, in Great Britain in 2019. Figures are derived from the STATS19 forms completed by the police plus toxicology data for road fatalities from coroners and procurators fiscal.
Final 2019 estimates, based on more complete data, will be published in August 2021.
Main points
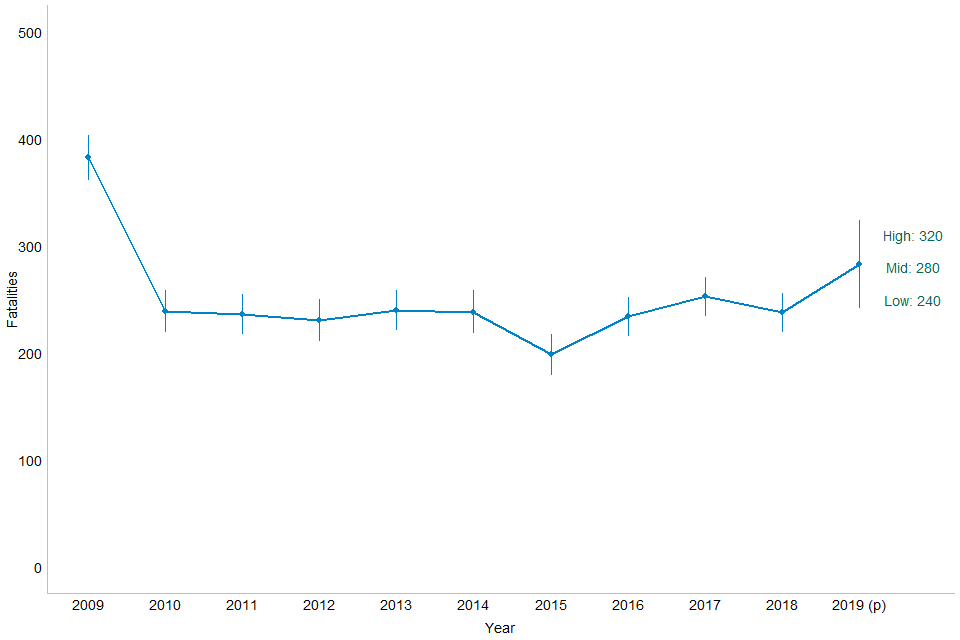
Provisional estimates for 2019 show that between 240 and 320 people were killed in accidents in Great Britain where at least one driver was over the drink-drive limit, with a central estimate of 280 deaths.
The provisional estimate of fatalities for 2019 is the highest since 2009. However, the rise from 240 in 2018 is not statistically significant.
Chart 1: Fatalities in reported drink-drive accidents, Great Britain: 2009 to 2019; error bars show 95% confidence intervals
An estimated 7,860 people were killed or injured when at least one driver was over the drink-drive limit. This represents a fall of 9% from 8,680 in 2018 and the lowest recorded.
The total number of accidents where at least one driver was over the alcohol limit decreased by 8% to 5,400 in 2019, the lowest number of drink-drive accidents.
Casualties in drink-drive accidents in 2019
Drink-drive fatalities
These statistics, especially the number of fatalities, are subject to considerable uncertainty (see sampling uncertainty below). This means that it is impossible to be sure of the precise number of fatalities, so ranges and confidence intervals are used for fatalities throughout the publication.
The 95% confidence level is the standard against which statistics are typically tested. The bars on chart 1 are ranges of values for an estimate which we are 95% confident that the ‘true’ value falls in. Technically, it indicates that in 100 years with the same risk of fatality, 95 of those years will result in a number of fatalities between a given range. If the actual change falls outside of this range then we can be 95% confident that the change is as a result of a genuine trend (statistically significant) rather than a product of chance (not statistically significant).
The provisional central estimate of the number of deaths in accidents with at least one driver over the alcohol limit for 2019 is 280. This represents about 16% of all deaths in reported road accidents in 2019. The central estimate for 2019 is higher than the final figure for 2018, but the increase is not statistically significant. The 95% confidence range indicates that we can be 95% certain that the true figure, is between 240 and 320 fatalities.
The provisional estimate for 2019 is based on coroners’ and procurators’ fiscal reports for 30% of the drivers or riders who were killed in road traffic accidents in 2019 in addition to breath tests taken at the scene (see definitions below). The final figure for 2019 will be published in August 2021, and is likely to be based on around 60-70% of drivers who died in road accidents. Therefore, the final 2019 figure may be different from this provisional estimate.
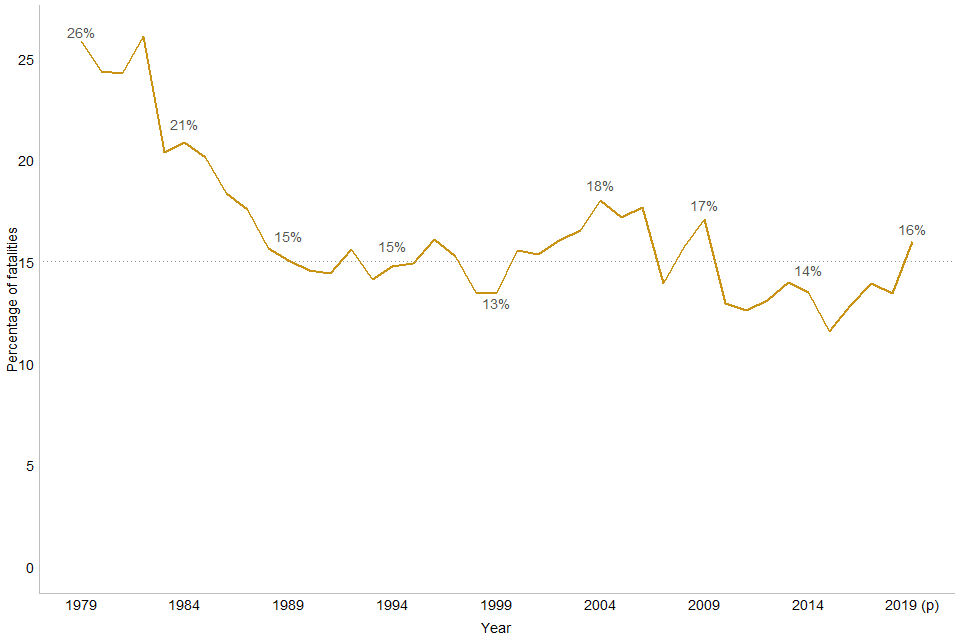
The prevalence of drink-driving in road deaths has fallen over time. In 1979, 26% of road deaths occurred in accidents where at least one driver or rider was over the drink-drive limit. This had fallen to 15% by 1989. Since then the percentage of road deaths that are drink-drive related has varied between 12% and 18%. In 2019, the rate is 16%.
Chart 2: Fatalities in reported drink-drive accidents, as a percentage of all fatalities, Great Britain: 1979 to 2019
Drink-drive killed or seriously injured casualties (KSI)
We are publishing KSI drink-drive casualties for the first time this year. This is possible due to the availability of severity adjustments for non-fatal injuries to take account of changes in accident reported systems. For information on the adjustments see severity adjustments below.
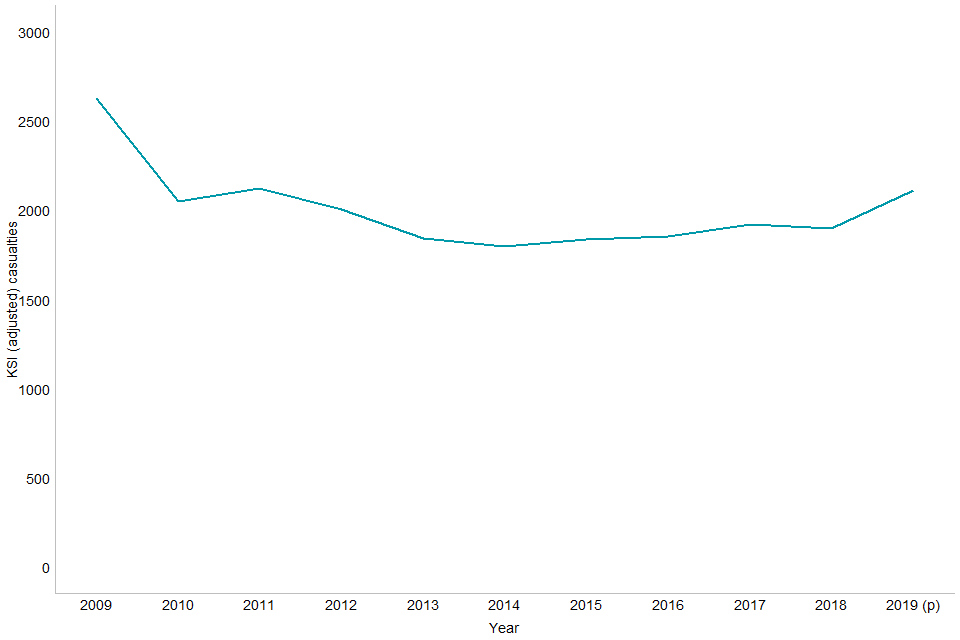
The central estimate of the number of killed or seriously injured (KSI adjusted) drink-drive casualties in 2019 is 2,110, an increase of 11% on 2018. This is the highest level since 2011.
Chart 3: Killed or seriously injured (KSI adjusted) casualties in reported drink-drive accidents, Great Britain: 2009 to 2019
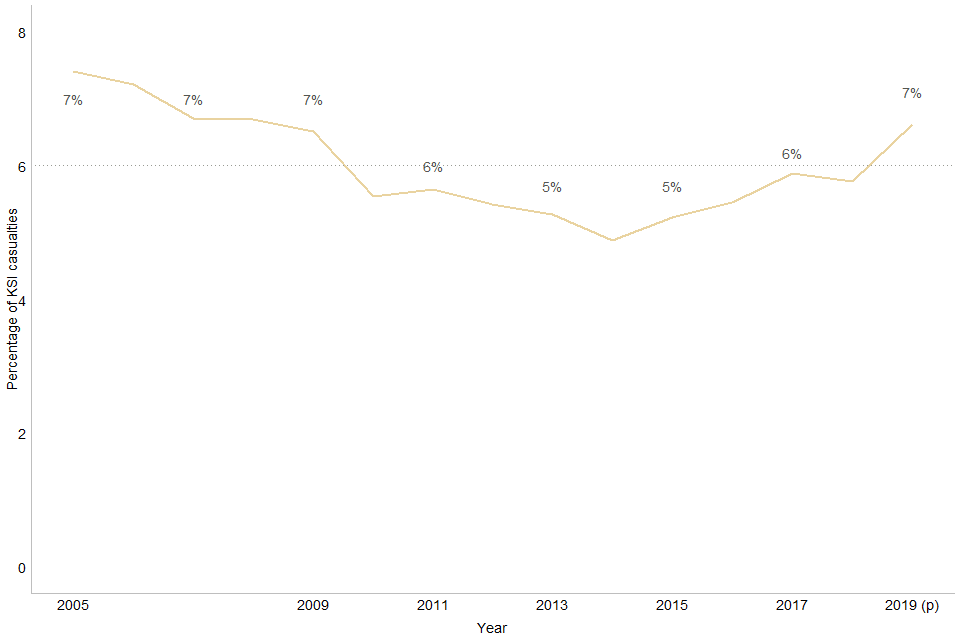
The proportion of killed or seriously injured (KSI adjusted) casualties in drink-drive accidents has varied between 5% and 7% since 2005. In 2019, the rate was 7%.
Chart 4: Killed or seriously injured (adjusted) casualties (KSI) in reported drink-drive accidents, as a percentage of KSI casualties, Great Britain: 2005 to 2019
All drink-drive casualties
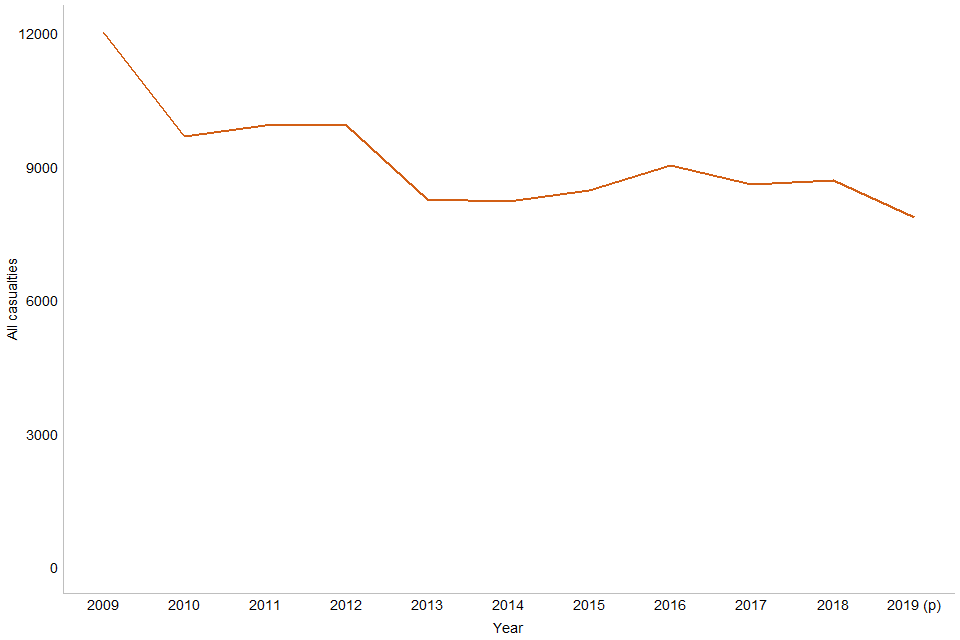
The central estimate of the number of drink-drive casualties of all severities in 2019 is 7,860, a fall of 9% on 2018. This is the lowest level recorded.
Chart 5: Total casualties in reported drink-drive accidents, Great Britain: 2009 to 2019
It is estimated that around 5% of all casualties in reported road accidents in 2019 were involved in accidents in which at least one driver or rider was over the drink-drive limit.
Chart 6: Casualties in reported drink-drive accidents, as a percentage of all casualties, Great Britain: 1979 to 2019
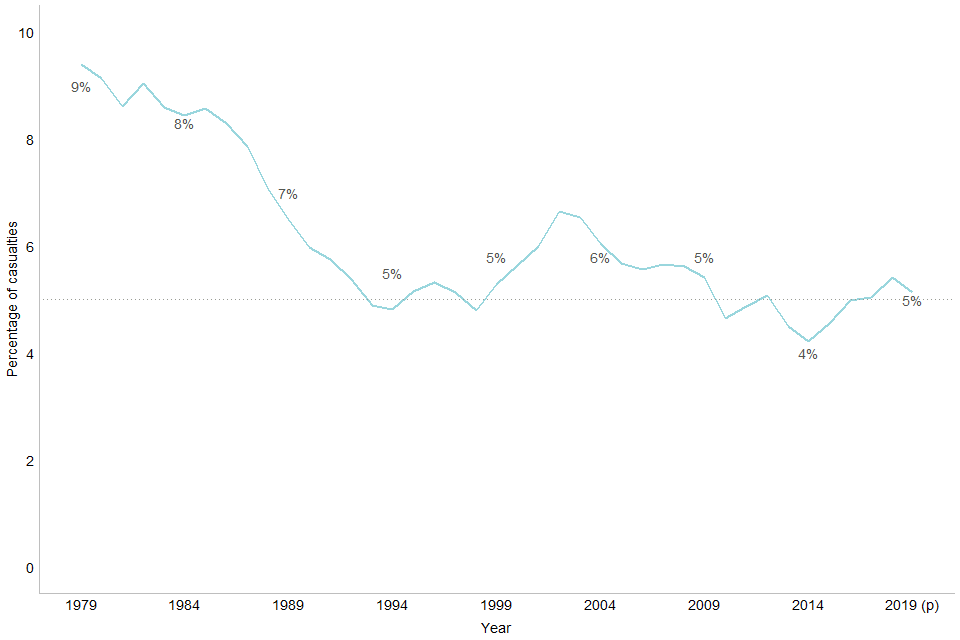
In 1979, 9% of road casualties occurred in accidents in which at least one driver/rider was over the drink-drive limit. This has fallen to 5% by 1992 and has mainly varied around 5% since then.
Number of drink-drive accidents in 2019
Trends in drink-drive accidents are similar to those for casualties.
There were an estimated 260 fatal drink-drive accidents in 2019. This is an increase from 210 in 2018 and the highest level since 2009. The increase from 2018 is not statistically significant.
The total number of drink-drive accidents of all severities fell by 8% from 2018 to 2019 to 5,400, to the lowest number recorded. This means that around 5% of all reported road traffic accidents in 2019 involved at least one driver and or rider over the legal alcohol limit.
In 1979, 8% of reported road accidents were drink-drive related. This has fallen to 5% by 1990 and has been generally around 5% since then.
Background information
Table published with this release
With this release, the headline table on drink-driving, RAS51001, has been updated with provisional 2019 figures. It shows accidents and casualties by severity since 1979. The final update for 2019 will be published in August 2021.
Definitions used through this publication
Drink-drive accident: A reported incident on a public road in which someone is killed or injured, where at least one of the motor vehicle drivers or riders involved met one of these criteria:
-
failed a roadside breath test by registering above 35 micrograms of alcohol per 100ml of breath (in England and Wales) or 22 micrograms (in Scotland)
-
refused to give a breath test specimen when requested by the police (other than when incapable of doing so for medical reasons).
-
died, within 12 hours of the accident, and was subsequently found to have more than 80 milligrams of alcohol per 100ml of blood (in England and Wales) or 50 milligrams (in Scotland).
Drink-drive casualties: All road users killed or injured in drink-drive accidents.
A full list of the casualty definitions used in this release are available.
Reviewing the frequency and improving the timeliness of drink-drive estimates
We want to further improve the quality and timeliness of road safety data. Currently, provisional drink-drive estimates are released 14 months after the end of the year reported on (with a return rate around 30% from coroners), and final estimates are released 20 months after the end of the year (with a return rate around 60% from coroners).
The range of uncertainty associated with the lower return rate at the provisional stage means that it is very unlikely the provisional publication can detect significant changes in the underlying trends. Therefore, the road safety team in the longer term aims to reduce the delay from the end of the year to the date of publication making the releases more timely.
The road safety team is working to allow the data collection from coroners to start earlier and more regularly based on STATS19 data. The aim is to improve the overall response rate and allow the publication of final drink-drive estimates to be released in less than 20 months after the end of the year. This approach is currently being tested and initial findings are encouraging. The return rate at the final stage for 2017 and 2018 at 84% of all fatalities was 3 percentage points higher than for 2016. Progress on this has been delayed due to the coronavirus (COVID-19) pandemic. We plan to progress this further post-pandemic.
We welcome your feedback on this approach, specifically how you are using these statistics and whether this meets your needs. Please contact us the road safety statistics team.
How do provisional estimates differ from the final estimates?
The provisional estimates have a wider range than the final estimates. This is because the provisional estimates are based on fewer toxicology reports (39% for this release) from coroners and procurators fiscal. The final estimates will be based on more reports and will, therefore, increase the accuracy of the results. The return rate of coroners reports is 39% down 5 percentage points from 2018 provisional. This has been affected by a backlog in inquest cases due to the COVID-19 pandemic.
National Statistics
National Statistics are produced to high professional standards as set out in the Code of Practice for Statistics. They undergo quality assurance reviews to ensure that they meet customer needs. The statistics were last assessed during 2013 and the report number 258 is available.
Details of Ministers and officials receive pre-release access to these statistics up to 24 hours before release.
Background on legislation
The Road Safety Act 1967 introduced the first drink-driving limit in the UK, set at a maximum blood alcohol concentration (BAC) of 80mg of alcohol per 100ml of blood (or the equivalent 107mg of alcohol per 100ml of urine). It became an offence to drive, attempt to drive or be in charge of a motor vehicle on a road or other public place with a BAC that exceeded the maximum prescribed legal limit. The 1967 Act also made it an offence to fail to provide a specimen for a laboratory test without reasonable excuse. The Transport Act 1981 introduced evidential breath testing and established a maximum breath alcohol concentration of 35 micrograms of alcohol in 100ml of breath. This was implemented in 1983. Today, people are given a preliminary breath test at the roadside and then taken back to the police station for an evidential breath test.
Drink-driving legislation has been strengthened over the years, including tougher penalties for offenders which can include potentially unlimited fines, disqualification from driving, or facing imprisonment for the most serious offences.
On 5 December 2014, Scotland reduced the legal BAC limit for all drivers from 80mg/100ml of blood to 50mg/100ml. The drink drive limit introduced by the 1967 Act remains in place for England and Wales today.
Evaluation of changes to the drink-drive limit
An independent evaluation of the impact of the limit reduction in Scotland led by the University of Glasgow was published in the Lancet on 12 December 2018. This evaluation took advantage of the natural experiment created by the lowering of the legal blood alcohol limit in Scotland only and compared data on weekly road traffic accident rates and alcohol consumption (off and on sales data) between Scotland (the intervention group) and England and Wales (the control group). The study found that lowering the drink-drive limit was not associated with any reduction in total accident rates or serious and fatal accident rates, but that the change was associated with a small reduction in per-capita alcohol consumption from on trade alcohol sales.
Quality and methodology
Sampling uncertainty
Toxicology data are not available for all killed drivers or riders recorded in STATS19 and are typically available for around 60% to 70% of relevant cases (averaging 63% between 2013 and 2018) for final estimates. Provisional estimates for 2019 are based on 30% of relevant cases.
To account for the killed drivers without a known Blood Alcohol Content (BAC), the casualties from the known cases are scaled up. The estimates are therefore based on a sample, rather than a complete count, which introduces an element of uncertainty.
Due to the nature of the data used to create these estimates, there is considerably more uncertainty in the number of fatalities and fatal accidents than any other severity level. The reason for this is that 52% of fatalities in 2019 were motor vehicle drivers themselves.
Under-reporting of road casualties
The estimates in this release are based only on those road accidents which are reported to the police. Comparisons of road accident reports with death registrations show that very few, if any, road accident fatalities are not reported to the police. However, it has long been known that a considerable proportion of non-fatal casualties are not known to the police. The data used as the basis for these statistics are therefore not a complete record of all personal injury road accidents, and this should be borne in mind when using and analysing the figures.
Changes in systems for severity reporting
Non-fatal casualties since 2016 have been affected by a large number of police forces changing their reporting systems which has had a large impact on the classification of injuries recorded. Further details are in the 2019 annual report.
Methodology details
A methodology note is available describing how the estimates are compiled from the sources.