Reported road casualties in Great Britain: younger driver factsheet, 2021
Published 24 November 2022

© Crown copyright 2022
This publication is licensed under the terms of the Open Government Licence v3.0 except where otherwise stated. To view this licence, visit nationalarchives.gov.uk/doc/open-government-licence/version/3 or write to the Information Policy Team, The National Archives, Kew, London TW9 4DU, or email: psi@nationalarchives.gov.uk.
Where we have identified any third party copyright information you will need to obtain permission from the copyright holders concerned.
This publication is available at https://www.gov.uk/government/statistics/reported-road-casualties-great-britain-older-and-younger-driver-factsheets-2021/reported-road-casualties-in-great-britain-younger-driver-factsheet-2021
This factsheet gives an overview and key statistics on younger car drivers involved in road collisions in Great Britain as reported by the police, including the main trends and characteristics of collisions. Young car drivers are a notable set of road users because they have higher rates of injury in road collisions in comparison with car drivers of other ages.
This factsheet defines a younger driver as someone aged between 17 and 24 years old.
Things you need to know
This factsheet presents trends from 2004 onwards. However, grouped data for years from 2016 to 2021 is used widely in order to allow sufficiently robust analysis by age, sex and other variables. Comparisons are made between collisions involving younger drivers and those involving drivers of other ages, though there will be some overlap as a collision could involve car drivers of different ages.
Severity adjustment
The figures in this release for injured casualties are based on adjusting figures reported by the police to take account of changes in the reporting of injury severity by some police forces in recent years. These adjusted figures can reliably be used to compare trends over time across the country. More details can be found in our severity adjustments guidance.
Impact of coronavirus (COVID-19)
Recent trends in reported road casualties have begun to normalise after the national restrictions implemented from March 2020 onwards following the coronavirus (COVID-19) pandemic, including periods of lockdown during 2021. Many of the trends discussed during this factsheet may see the impact of COVID-19 restrictions. More details about the coronavirus restrictions can be found in Coronavirus: a history of English lockdown laws (England only).
Main findings
Overall, in 2021, around a fifth of all killed or seriously injured (KSI) casualties from collisions involving cars were in collisions which involved a young car driver.
Between 2004 and 2021:
-
KSI casualties from a collision involving at least one younger car driver decreased from 12,629 to 4,529, a fall of 64%
-
KSI casualties in collisions involving other aged car drivers decreased from 32,084 to 17,711, a fall of 45%
Averaged over the period 2016 to 2021:
-
65% of KSI casualties from a collision involving at least one younger car driver were male. This compares to 66% for KSI casualties from collisions involving other aged car drivers
-
32% of KSI casualties from a collision involving at least one younger car driver were male and aged between 17 and 24 years old
-
KSI casualties from a collision involving at least one younger car driver peak on weekdays from 4pm to 7pm, but as a proportion of car collisions are highest during the late evening and early morning
-
49% of KSI casualties in younger driver collisions occurred on rural roads, compared to 42% for other aged car driver collisions
-
53% of KSI casualties in younger driver collisions occurred not at junction or within 20 metres, compared to 47% for other aged car driver collisions
-
the most common contributory factor allocated to vehicles driven by a younger car driver involved in fatal or serious collisions (FSC) with another vehicle was ‘driver failed to look properly’
-
vehicles driven by a younger car driver were more likely to have factors ‘loss of control’, ‘exceeding speed limit’ and ‘learner or inexperienced driver’ compared to vehicles driven by drivers of other ages
Introduction
Car driver casualty rates
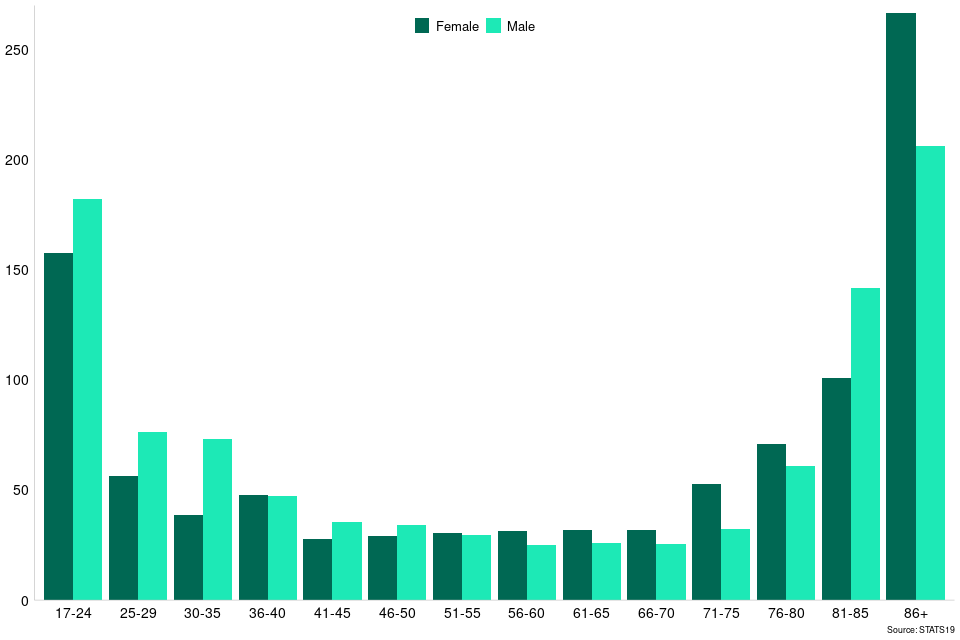
Chart 1 shows KSI car driver casualties per billion miles driven, by age and sex. There is an increased casualty rate for younger car drivers, especially for those aged between 17 and 24 years old.
Chart 1: KSI car driver casualties per billion miles driven, by age and sex, Great Britain:2021[footnote 1]
Casualties in younger car driver collisions by severity
Younger car drivers account for a relatively large proportion of both car driver casualties and casualties in collisions involving cars.
Table 1 shows that in 2021 16% of all car driver fatalities were younger car drivers.
Table 2 shows that in 2021 21% of fatalities from collisions involving a car driver were from a collision involving at least one younger car driver. Table 2 shows that younger car drivers account for a similar proportion of fatalities, serious injuries and slight injuries from collisions involving a car driver. In this factsheet we focus on KSI collisions.
Table 1: Reported driver casualties by severity, younger car driver casualties compared to all car driver casualties, Great Britain:2021
| Killed | Serious | Slight | All | |
|---|---|---|---|---|
| Young car driver | 78 | 1,201 | 7,474 | 8,753 |
| All car drivers | 482 | 6,563 | 42,736 | 49,781 |
| Percentage young car driver | 16 | 18 | 17 | 18 |
Table 2: Reported casualties by severity, from collisions involving a younger car driver compared to collisions involving all car drivers, Great Britain:2021
| Killed | Serious | Slight | All | |
|---|---|---|---|---|
| From collisions involving a young car driver | 250 | 4,279 | 19,410 | 23,939 |
| From collisions involving all car drivers | 1,216 | 20,989 | 90,621 | 112,826 |
| Percentage involving young drivers | 21 | 20 | 21 | 21 |
Casualties from a collision involving at least one younger car driver
Casualties by type
Chart 2 shows KSI casualties from a collision involving at least one younger car driver, by casualty type which includes:
- the younger car driver themselves
- the passengers of the cars driven by younger drivers
- all other casualties (including drivers and passenger of other vehicles, or other road users for example pedestrians)
There was a consistent drop in all casualty numbers since 2004 until the COVID-19 pandemic in 2020. COVID-19 caused a drop in casualty numbers however, the increase seen recently shows casualty numbers beginning to return to pre-pandemic levels.
Since 2004, KSI casualties from a collision involving at least one younger car driver decreased from 12,629 to 4,529 (64%). However, due to the COVID-19 pandemic recovery when comparing 2021 to 2020 there has been an increase of 12%.
During 2021, there were:
- 1,279 KSI younger car driver casualties, an increase of 8% compared to 2020.
- 926 passenger KSI casualties from a collision involving at least one younger car driver, an increase of 19% compared to 2020.
Chart 2: Reported KSI casualties from collisions involving at least one younger car driver by casualty type, Great Britain: 2004 to 2021
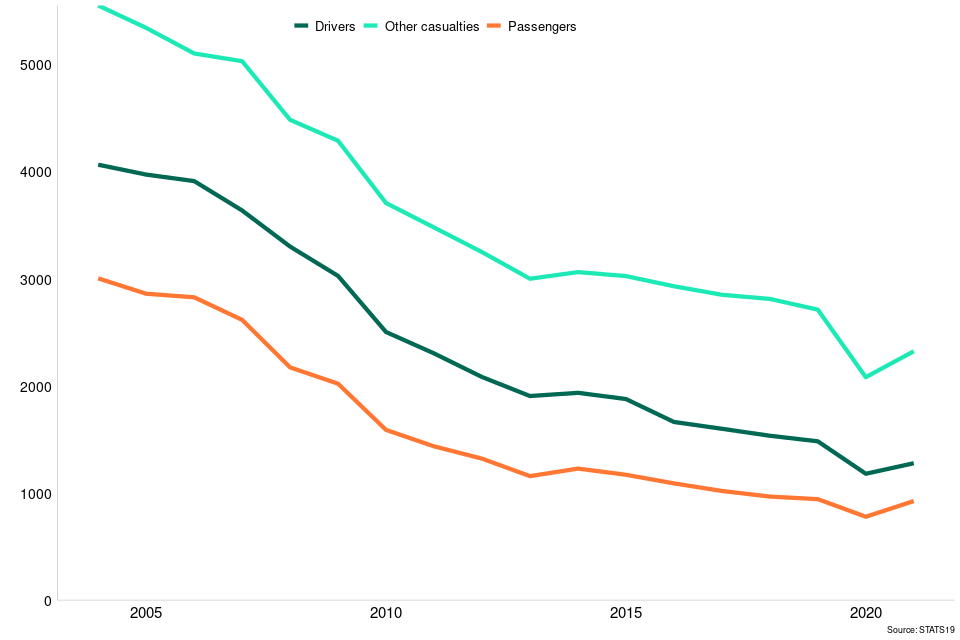
Table 3: Reported KSI casualties by casualty type from collisions involving at least one younger car driver, Great Britain: 2004 to 2021
| Year | All casualties | Passengers of younger car drivers | Younger car drivers | Other casualties |
|---|---|---|---|---|
| 2004 | 12,629 | 3,006 | 4,068 | 5,555 |
| 2005 | 12,183 | 2,862 | 3,975 | 5,346 |
| 2006 | 11,851 | 2,829 | 3,915 | 5,107 |
| 2007 | 11,293 | 2,618 | 3,640 | 5,035 |
| 2008 | 9,964 | 2,174 | 3,303 | 4,487 |
| 2009 | 9,342 | 2,022 | 3,029 | 4,292 |
| 2010 | 7,804 | 1,590 | 2,504 | 3,710 |
| 2011 | 7,223 | 1,436 | 2,305 | 3,481 |
| 2012 | 6,657 | 1,322 | 2,084 | 3,251 |
| 2013 | 6,067 | 1,158 | 1,907 | 3,002 |
| 2014 | 6,230 | 1,229 | 1,937 | 3,064 |
| 2015 | 6,077 | 1,171 | 1,879 | 3,027 |
| 2016 | 5,687 | 1,091 | 1,664 | 2,932 |
| 2017 | 5,473 | 1,020 | 1,601 | 2,853 |
| 2018 | 5,317 | 967 | 1,535 | 2,814 |
| 2019 | 5,140 | 943 | 1,483 | 2,713 |
| 2020 | 4,042 | 779 | 1,181 | 2,083 |
| 2021 | 4,529 | 926 | 1,279 | 2,325 |
Table 4 shows the proportion of each casualty type for the total KSI casualties from a collision involving at least one younger car driver. This shows how the proportion of casualties being the driver or passenger of the car has fallen, whereas the proportion of other casualties has increased since 2021.
For 2021, younger car driver casualties accounted for 28% of all KSI casualties from a collision involving at least one younger car driver. By comparison, for collisions involving other aged car drivers, driver casualties accounted for 32% of all KSI casualties in 2021.
For 2021, passenger casualties (of young drivers) accounted for 20% of all KSI casualties from a collision involving at least one younger car driver. By comparison, for collisions involving other aged car drivers, passenger KSI casualties accounted for 13% of all KSI casualties in 2021.
Table 4: Proportion of all KSI casualties from collisions involving at least one a younger car driver by casualty type, Great Britain
| Year | Passengers of younger car drivers | Younger car drivers | Other casualties |
|---|---|---|---|
| 2004 | 24 | 32 | 44 |
| 2011 | 20 | 32 | 48 |
| 2020 | 19 | 29 | 52 |
| 2021 | 20 | 28 | 51 |
Sex and age comparisons
Chart 3 shows the sex and age breakdown of KSI casualties from a collision involving at least one younger car driver between 2016 and 2021.
Between 2016 and 2021, 65% of KSI casualties from a collision involving at least one younger car driver were male and 35% were female.
32% of KSI casualties from a collision involving at least one younger car driver were male and between 17 and 24 years old. 17% of casualties were female and between 17 and 24 years old.
Chart 3: Percentage of KSI casualties from collisions involving at least one younger car driver, by sex and age, Great Britain: 2016 to 2021
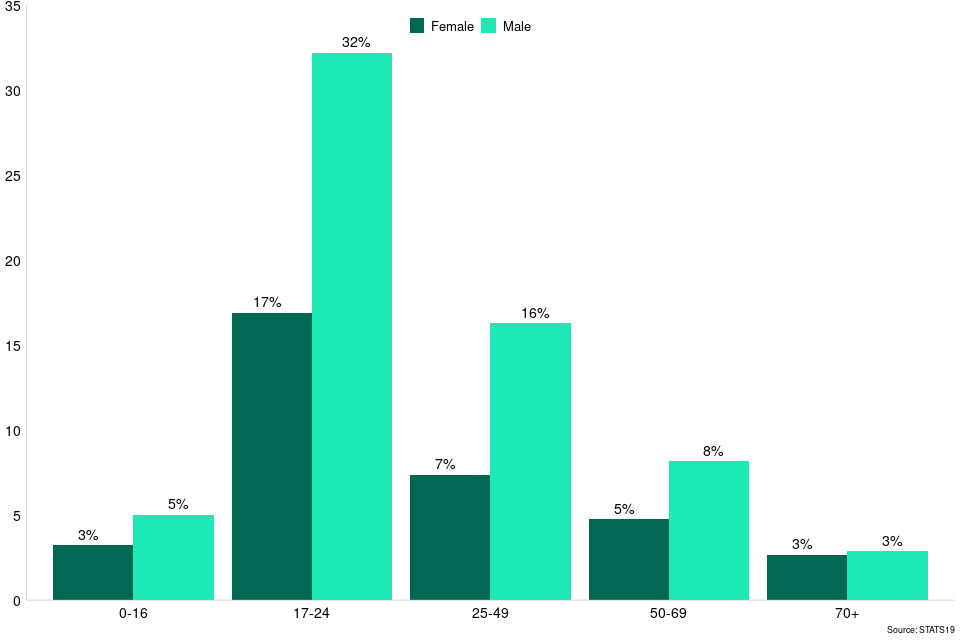
Table 5: Percentage of KSI casualties from collisions involving at least one a younger car driver, by sex and age, Great Britain: 2016 to 2021
| Age | Female | Male |
|---|---|---|
| All ages | 35% | 65% |
| 0 to 16 | 3% | 5% |
| 17 to 24 | 17% | 32% |
| 25 to 49 | 7% | 16% |
| 50 to 69 | 5% | 8% |
| 70 and above | 3% | 3% |
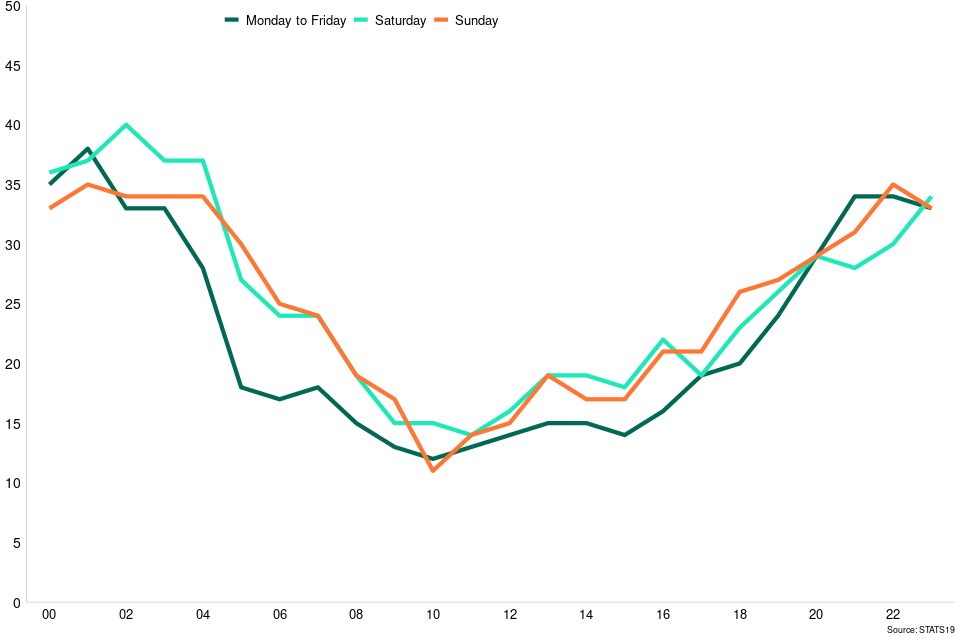
Time of day of collisions
Table 6 shows the total KSI casualties from a collision involving at least one younger car driver by hour of day and day of the week. The totals for the weekdays (Monday to Friday) have been averaged. KSI casualties from a collision involving at least one younger car driver have a peak on weekdays from 4pm to 7pm. On the weekends there is an overall increase in the evenings and early hours of the morning.
Table 6: Total KSI casualties from a collision involving at least one younger car driver by hour of the day and day of the week, between 2016 and 2021, Great Britain
| Hour of day | Monday to Friday | Saturday | Sunday |
|---|---|---|---|
| 00 | 105 | 292 | 287 |
| 01 | 76 | 207 | 278 |
| 02 | 55 | 177 | 201 |
| 03 | 45 | 137 | 173 |
| 04 | 35 | 121 | 118 |
| 05 | 43 | 78 | 92 |
| 06 | 92 | 67 | 68 |
| 07 | 184 | 99 | 77 |
| 08 | 200 | 99 | 80 |
| 09 | 111 | 105 | 99 |
| 10 | 101 | 152 | 98 |
| 11 | 117 | 164 | 148 |
| 12 | 142 | 220 | 201 |
| 13 | 162 | 256 | 245 |
| 14 | 179 | 250 | 244 |
| 15 | 239 | 248 | 243 |
| 16 | 294 | 298 | 280 |
| 17 | 364 | 289 | 257 |
| 18 | 317 | 321 | 299 |
| 19 | 291 | 335 | 272 |
| 20 | 265 | 317 | 249 |
| 21 | 262 | 261 | 218 |
| 22 | 238 | 303 | 221 |
| 23 | 174 | 327 | 161 |
Table 6 note: Monday to Friday is the average of the total on each of those days.
Chart 4 puts these KSI casualty numbers into context by displaying them as a proportion of all KSI casualties from collisions involving any car driver.
KSIs casualties from a collision involving at least one younger car driver make up a much higher proportion of all KSI casualties in the early morning and late evening. They make up a much smaller proportion in the middle of the day. The highest proportion is seen in the early hours of Saturday morning.
Chart 4: Proportion of KSI casualties from collisions involving at least one younger car driver out of all collisions involving a car driver by hour of day and day of week, Great Britain: 2016 to 2021
Type of road
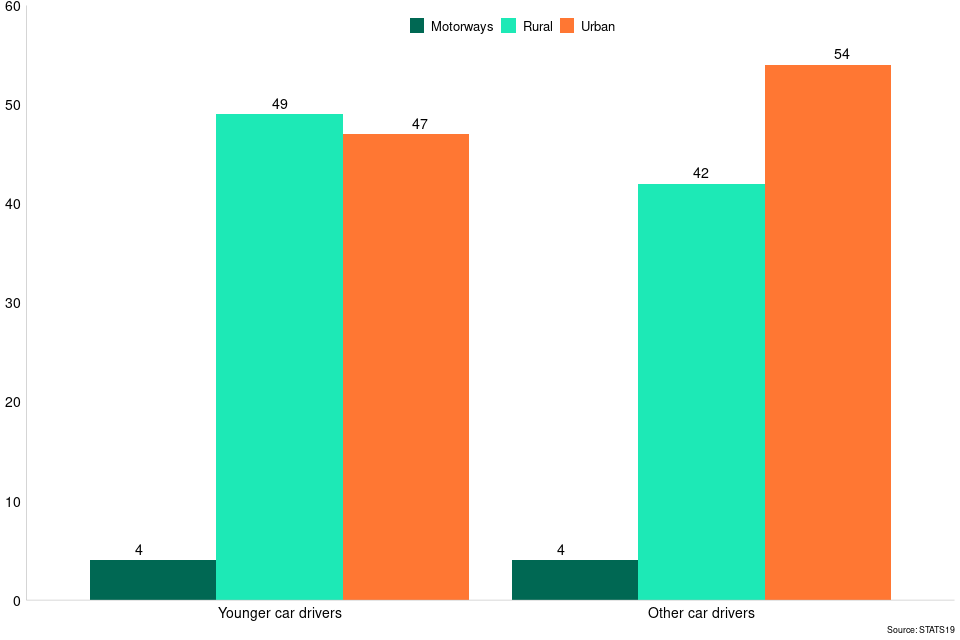
Chart 5 looks at where the collisions according to rural or urban road classification, involving at least one younger car driver, occur.
Between 2016 and 2021 49% of KSI’s in collisions involving at least one older car driver occurred on rural roads and 47% occurred on urban roads.
In comparison for collisions involving other aged car drivers 42% of KSI’s occurred on rural roads and 54% occurred on urban roads.
Chart 5: Percentage of KSI casualties from collisions involving at least one younger car driver and from collisions involving at least one other aged car driver, by urban rural classification, Great Britain: 2016 to 2021
Urban roads are those within an area of population of 10,000 or more. The definition is based on the 2001 Communities and Local Government definition of Urban Settlements. Roads outside these areas will be classified as Rural. More information is available in the user guide to urban and rural area definitions (PDF, 271KB).
Vehicle movement on the road
Table 7 displays the percentage of KSI’s in collisions involving at least one younger car driver which occur at different junction types.
Between 2016 and 2021 53% of KSI’s in younger car driver collisions occurred not at a junction or within 20 metres. This is similar to collisions involving other aged car drivers where 47% of KSIs in collisions occurred not at a junction or within 20 metres.
Table 7: Percentage of KSI casualties from collisions involving at least one younger car driver and from collisions involving at least one other aged car driver by severity and junction detail where the collision occurred, Great Britain: 2016 to 2021
| Junction | Younger car drivers | Other car drivers |
|---|---|---|
| Not at junction or within 20 metres | 53 | 47 |
| T, Y or staggered junction | 25 | 29 |
| Crossroads | 9 | 9 |
| Roundabout | 4 | 6 |
| Other junction | 3 | 4 |
| Private drive or entrance | 2 | 3 |
| Slip road | 1 | 1 |
| Mini-roundabout | 1 | 1 |
| Junction - more than 4 arms (not roundabout) | 1 | 1 |
| Unknown | 0 | 0 |
Contributory factors in collisions
Contributory factors provide an insight into how and why collisions occur. The factors are largely subjective as they reflect the opinion of the reporting police officer. They are assigned quickly at the occurrence of the collision and often without extensive investigations and so should be interpreted with caution. They are likely to be affected in part by preconceptions police officers have of certain vehicle groups. A maximum of 6 factors can be recorded for each collision. Further information is available in the guide to contributory factors.
Table 8 shows the 10 most common contributory factors that have been allocated to younger car drivers that were involved in FSC’s (between 2016 and 2021). This is displayed as a proportion of all vehicles driven by younger car drivers. These proportions are contrasted to the equivalent figures for vehicles driven by other aged car drivers.
The most common contributory factors assigned to both younger car drivers and other car drivers was ‘failed to look properly’.
Where younger car drivers differ is that second most common factor was ‘driver careless, reckless or in a hurry’. For other car drivers this contributory factor is ranked third. Younger drivers were also more likely to be assigned factors such as ‘loss of control’, ‘exceeding speed limit’ or ‘learner or inexperienced driver or rider’.
Table 8:Percentage of cars in FSC’s driven by a younger car driver with specific contributory factors assigned, compared to the equivalent percentage for other aged car drivers, Great Britain: 2016 to 2021
| Contributory Factor | Younger car drivers | Other car drivers |
|---|---|---|
| Driver or rider failed to look properly | 21 | 23 |
| Driver or rider careless, reckless or in a hurry | 16 | 9 |
| Loss of control | 15 | 7 |
| Driver or rider failed to judge other person`s path or speed | 10 | 10 |
| Exceeding speed limit | 10 | 3 |
| Travelling too fast for conditions | 9 | 3 |
| Learner or inexperienced driver or rider | 9 | 1 |
| Poor turn or manoeuvre | 8 | 7 |
| Slippery road (due to weather) | 7 | 3 |
| Driver or rider impaired by alcohol | 6 | 4 |
Further information
Further information on road collisions and casualties can be found in Reported Road Casualties in Great Britain.
Published tables on casualties in reported road collisions are available.
Non-fatal casualties since 2016 have been affected by a large number of police forces changing their reporting systems which has had a large impact on the classification of injuries recorded. Further details of the adjustment for this are in the 2021 annual report.
Road collisions and safety statistics guidance including accompanying notes and definitions are available.
Personal travel statistics within Great Britain covering English residents, including mileage by car drivers of different ages, is available from the National Travel Survey.
Instructions for printing and saving
Depending on which browser you use and the type of device you use (such as a mobile or laptop) these instructions may vary.
Tablets and mobile devices normally have the option to “find in text” and “print or save” in their sharing or quick options menu of their browser, but this will vary by device model.
How to search
Select Ctrl and F on a Windows laptop or Command and F on a Mac
This will open a search box in the top right-hand corner of the page. Type the word you are looking for in the search bar and press enter.
Your browser will highlight the word, usually in yellow, wherever it appears on the page. Press enter to move to the next place it appears.
Contact details
Road safety statistics
-
Rates are calculated using car driver mileage from the National Travel Survey (for England) scaled to Great Britain population by age group and sex. Figures are miles recorded for personal travel where the mode of travel was car or van driver. ↩