Migrant Journey: 2020 report
Published 27 May 2021

© Crown copyright 2021
This publication is licensed under the terms of the Open Government Licence v3.0 except where otherwise stated. To view this licence, visit nationalarchives.gov.uk/doc/open-government-licence/version/3 or write to the Information Policy Team, The National Archives, Kew, London TW9 4DU, or email: psi@nationalarchives.gov.uk.
Where we have identified any third party copyright information you will need to obtain permission from the copyright holders concerned.
This publication is available at https://www.gov.uk/government/statistics/migrant-journey-2020-report/migrant-journey-2020-report
Key results
Of migrants issued an initial visa in 2015, around a quarter (25%) held valid temporary leave or settlement five years later at the end of 2020.
Of migrants issued visas in 2015, the under 18 years age group was most likely to hold valid leave or settlement after five years (40%).
A quarter (25%) of migrants granted settlement in 2020 were those who originally came to the UK on a Work visa.
Of the 135,000 granted a Work visa in 2015, around a quarter (24%) held valid leave or settlement at the end of 2020, the proportion for each Work route was:
- 70% of migrants issued Tier 1 (High value) visas
- 29% of those issued Tier 2 (Skilled) visas
- 10% of those issued Tier 5 (Youth mobility and temporary worker) visas (98% of who had switched to a different route)
Of the 31,500 migrants granted a Family visa in 2015, 70% still held valid leave or had been granted settlement at the end of 2020.
1. Introduction
This release explores changes in non-European Economic Area (non-EEA) migrants’ visa and leave status as they journey through the UK’s immigration system. It is the eleventh in an annual series of publications on the ‘migrant journey’.
The analysis combines the following data collected from UK Visas and Immigration databases to illustrate the changes in visas held by people applying to the immigration system, including:
- grants of visas outside the UK
- any subsequent grants of extensions of stay in the UK
- grants of settlement (permission to stay in the UK permanently)
- grants of UK citizenship
Understanding these journeys helps to inform Parliament, policy makers and the public on the patterns of migration to the UK and the impact of changes to the Immigration Rules.
This report includes data up to the end of 2020. It updates analysis from the ‘Migrant Journey: 2019 report’ published in May 2020, which included data up to the end of 2019.
The data are presented in detailed data tables and summary tables, which include data on the age and sex of migrants.
Both main applicants and dependants are included within this report and all references to Tier 1, Tier 2, Tier 4 or Tier 5 visas include their pre-points-based system (PBS) equivalents.
Information is presented on current visa status and it is not possible to tell from the data whether individuals are currently in the UK.
This report focuses on migrant journeys, where a journey is defined as a series of periods of leave to remain in the UK with each period starting no more than 12 months after the end of the previous period. This is consistent with the UN definition of migration where an individual who has left the UK for a year or more would be considered an emigrant. Therefore, the numbers in this report for journeys starting each year, although similar, will not match total numbers of visas granted each year.
The ‘Migrant Journey: user guide’ provides further details on this topic including definitions used, how figures are compiled, data quality and issues arising from figures based on data sourced from an administrative database.
2. Overall trends
The data in this section relate to:
- A forward-looking analysis: People granted an initial visa in 2015 and their leave status in 2020 (table MJ_D01), by age and sex (tables MJ_03 and MJ_04)
- A backward-looking analysis: Migrants who were granted settlement in 2020 and which visas they used initially to come to the UK (table MJ_D02), by age and sex (tables MJ_05 and MJ_06)
Key results
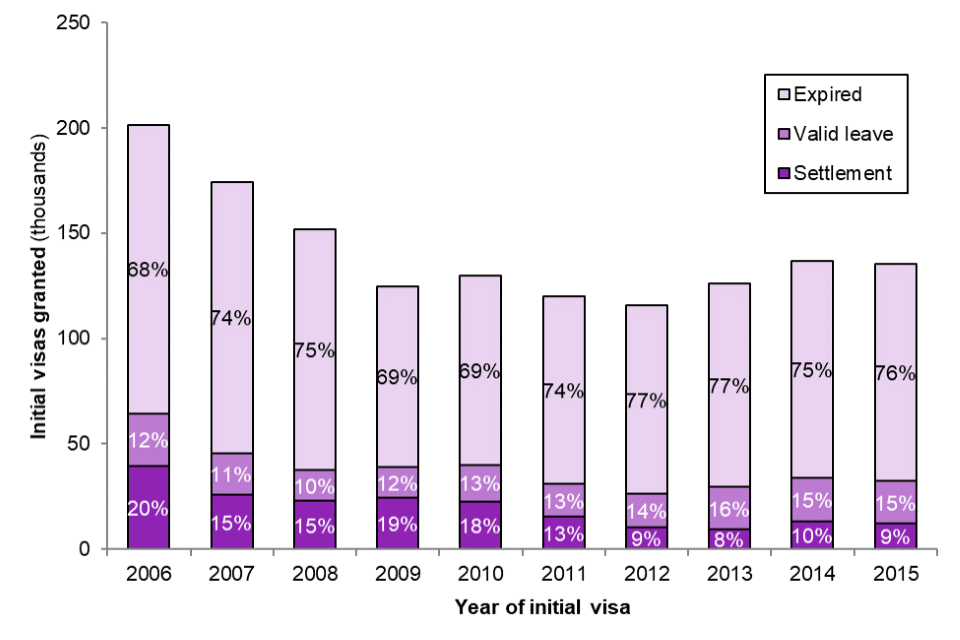
- Of people issued an initial visa in 2015, 25% held valid temporary leave or settlement (permission to stay in the UK permanently) at the end of 2020 – a lower proportion than earlier cohorts in the series, such as the proportion of those granted a visa in 2004 after five years (40%) (see Figure 1 below).
- Around 1-in-14 (7%) people issued a visa in 2015 had been granted settlement after five years – lower than the figure of a fifth (20%) for those arriving between 2004 and 2007 who had obtained settlement after five years.
- People issued visas who were under 18 years old in 2015 were the age group most likely still to hold valid leave or settlement after five years (40%). People issued visas when they were between 18 and 29 years old were the least likely (19%).
- The largest proportion of people granted settlement in 2020 originally arrived in the UK on a Work visa (25%).
- Of the 87,000 migrants granted settlement in 2020, the majority (56%) were aged between 30 and 49 years old when they were granted settlement.
Figure 1 shows a decrease in the number of visas issued from after 2010, and then levelling off from 2012. The proportion of people granted settlement five years after their initial visa has also decreased, from 19-20% in the 2006-08 cohorts to 7-8% in 2013-15.
Figure 1: Number of migrants issued an initial visa in 2006 to 2015, broken down by their immigration status after five years

Source: Migrant Journey – Detailed Tables – MJ_D01
Note: Percentages may not sum to 100% due to rounding.
In 2015, around 333,000 people were issued an initial visa within four main categories of leave: Work, Study, Family, and Dependants joining or accompanying. Of these, 24,000 (7%) had been granted settlement at the end of 2020 and a further 59,000 (18%) still held valid leave.
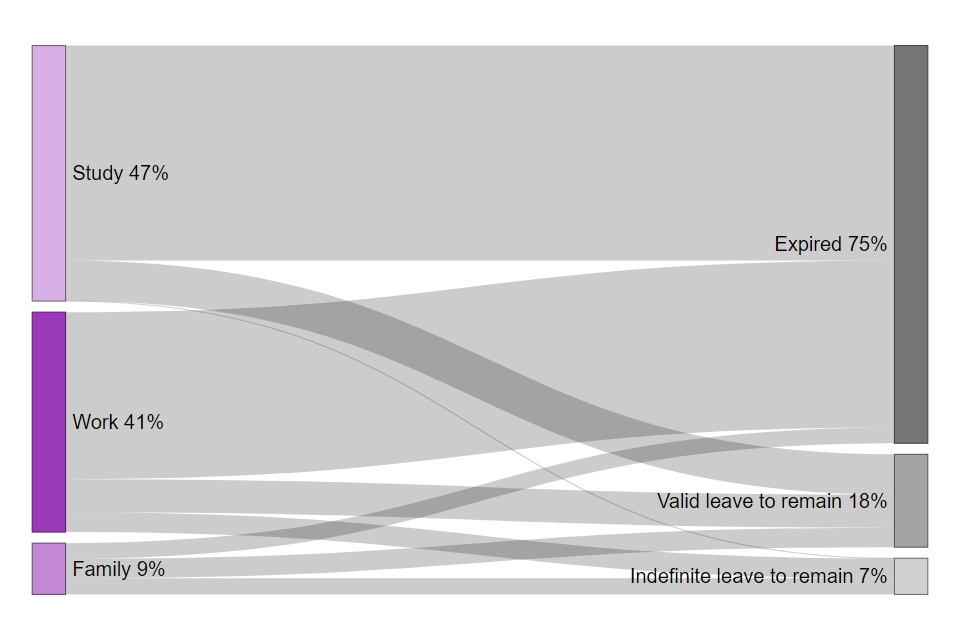
These proportions differ by initial visa category, as shown in Figure 2. The vast majority (70%) of people granted Family visas in 2015 still had valid leave or settlement at the end of 2020, compared to 24% of Work visas and 16% of Study visas. This report presents the differences in patterns across these three key categories.
Figure 2: Immigration status at end of 2020 of migrants issued an initial visa in 2015, by initial visa type
Source: Migrant Journey – Detailed Tables – MJ_D01
Notes:
-
Percentages on the left do not sum to 100% as visas issued to ‘Dependants joining or accompanying’ are excluded from the chart.
-
‘Study’ excludes short-term study.
Analysis of the age and sex data shows that under 18s were the age group most likely to hold valid leave or settlement after five years. Almost two-thirds (63%) of this age group issued visas in 2015 were dependants of another visa holder, rather than the main applicant, likely coming to the UK with their parents. This indicates that families with accompanying children are more likely to stay in the UK long term, extending their leave or applying for settlement.
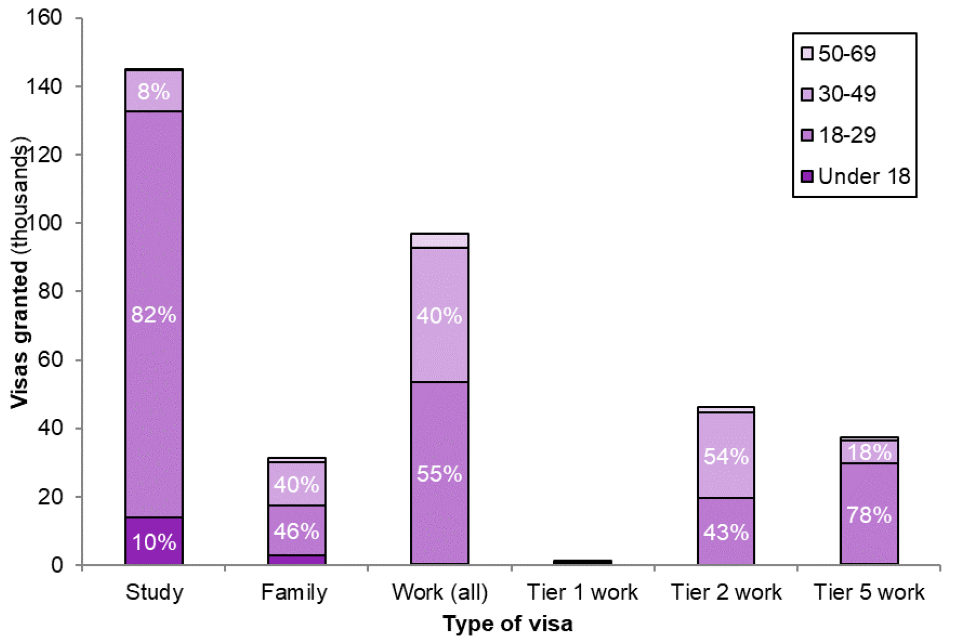
Those aged between 18 and 29 were the least likely to hold valid leave or settlement after five years. This is in part likely related to the differences in age profiles of different visa categories, as shown in Figure 3. For example, 18 to 29 year olds made up 82% of Study visas and 78% of Tier 5 Work visas issued to main applicants in 2015, both of which are temporary routes without a direct path to settlement.
Figure 3: Number of migrants issued an initial visa in 2015, broken down by their age when granted a visa, by initial visa type (excluding dependants)
Source: Migrant Journey – Age and Sex Summary tables – MJ_03
Notes:
-
Dependant applications are not included in the chart.
-
Over 70s are not included in the chart due to small numbers.
-
Percentages may not sum to 100% due to rounding.
-
The ‘Work (all)’ category is the total of Tier 1, Tier 2, Tier 5 and non-PBS work categories.
-
Tier 1 route is for ‘High value’ migrants, Tier 2 for skilled workers, Tier 5 for Youth mobility and temporary workers.
-
Categories include pre-PBS equivalents.
A greater proportion of females issued their visas in 2015 held valid leave or settlement after five years (26%) than males (23%). Again, this is likely related to the category of visas issued – females made up almost three-quarters (72%) of Family visas issued in 2015, which have a much higher rate of leave or settlement after five years compared to other categories of visa. Work and Study visas were issued to a more equal number of males and females.
The fastest non-asylum pathways to settlement are the Family and some Work categories, which are the direct routes to settlement allowed under the Immigration Rules. These categories allow a grant of settlement without the migrant switching to another immigration category. Study is not a direct route to settlement, therefore a student would normally have to apply to stay in another route before being eligible for settlement.
Figure 4 shows that of the 87,000 migrants granted settlement in 2020, around a quarter had initially come for both work (25%) and family (24%) reasons, just under a fifth (19%) came to study, and the remaining third (32%) came for other reasons.
Those initially on Family or Work visas who were granted settlement in 2020 were most likely to have been granted their initial visa in 2015, that is five years previously. This is a result of Family and Work migrants taking up the option for settlement as soon as they become eligible after five years.
Meanwhile, those who settled in 2020 and had initially been granted Study visas were most likely to have been granted their initial visa in 2010. As Study is a temporary route, these migrants will, in most cases, have subsequently switched into another route to permanent settlement or applied for settlement under the 10 year long-term residency rule. The proportion of settlement grants in 2020 who originally came to the UK on a student visa (19%) was considerably lower than the proportions in the previous five years (28-29%) and similar to the level at the beginning of the last decade. (See Figure 5)
Figure 4: Migrants granted settlement in 2020, by initial visa type
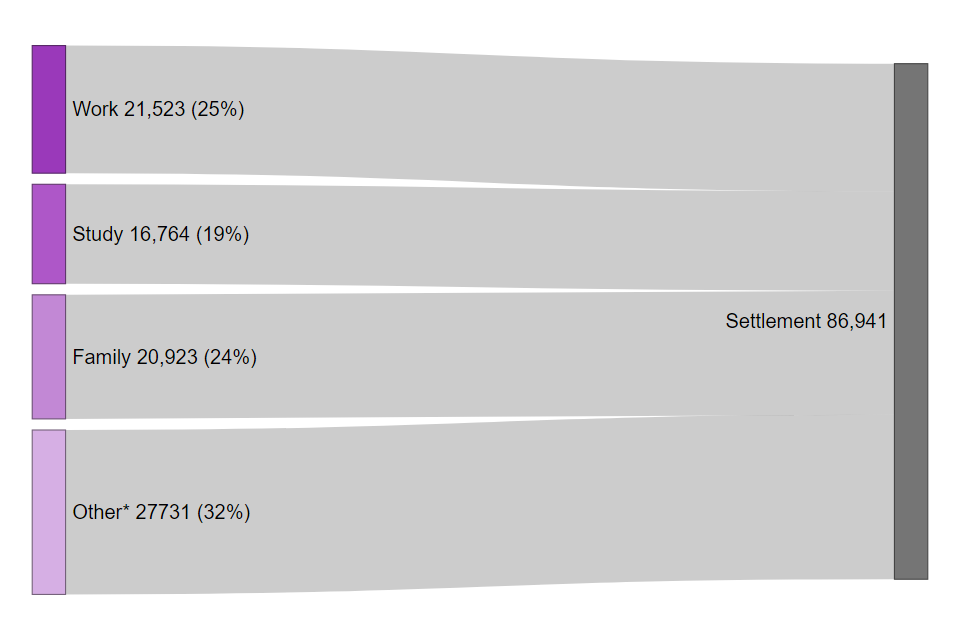
Source: Migrant Journey – Detailed Tables – MJ_D02
Note: The ‘Other’ category contains grants of settlement to: Dependants joining or accompanying; visas for immediate settlement; EEA family permits; where there had previously been grants related to asylum, grants of leave outside the Immigration Rules, grants of discretionary leave, grants of private life; and other small miscellaneous categories.
The number of cases granted settlement in different years can also reflect casework management decisions as well as policy changes. The high volume of cases granted settlement in 2010 reflects more grants given on a discretionary basis. This resulted from a review of the backlog of cases involving unsuccessful asylum applications announced in July 2006 by the then Home Secretary.
Figure 5 shows that the number of people granted settlement fell from 169,000 in 2011 to 63,000 in 2016, and subsequently has been fairly stable between 87,000 and 93,000 in the last three years.
Figure 5: Common immigration categories of those granted settlement, 2011 to 2020

Source: Migrant Journey – Detailed Tables – MJ_D02
Notes:
-
Percentages may not sum to 100% due to rounding.
-
The ‘Other’ category contains grants of settlement where there had previously been grants related to asylum, grants of leave outside the Immigration Rules, grants of discretionary leave, grants of private life, and other small miscellaneous categories.
-
Categories less than 5% have not been labelled on the chart.
-
EEA family permits have been excluded.
Settlement rates also differ considerably by nationality. Of the top ten nationalities issued visas in 2015, Pakistani nationals had the highest proportion who had been granted settlement after five years (22%). The next highest were Filipino nationals (15%), with the remaining nationalities in the top ten having a settlement rate of 7% or less.
Of all those granted settlement in 2020, the largest number were originally from India (12%), Pakistan (10%) and Syria (7%).
A majority of Syrian nationals who were granted settlement in 2020 originally came to the UK under one of the refugee protection schemes (most likely through the Vulnerable Persons Resettlement scheme (VPRS) or having been granted refugee status (asylum) or humanitarian protection following an asylum application), or as a partner or child of someone previously granted refugee status (asylum) or humanitarian protection. For more information see the ‘How many people do we grant asylum or protection to?’ section of the Immigration Statistics.
Of all those granted settlement in 2020, a majority (56%) were between 30 and 49 years old, a fifth (20%) were under 18, 18% were aged 18 to 29, and 7% were over 50. These proportions are shown in figure 6.
A slightly higher proportion were female (53%) than male (47%).
Figure 6: Age of migrants granted settlement in 2020

Source: Migrant Journey – Detailed Tables – MJ_D01
Travel restrictions imposed in 2020 due to the Covid-19 pandemic meant that many people were unable to return home when expected. On 17th February 2020 a policy offering exceptional extensions to visas was announced and this may impact these statistics in future years. More details are provided in the ‘How many people continue their stay’ section of the quarterly immigration statistics.
3. Study
The data in this section relate to:
- People granted an initial Study visa in 2010 and 2015, and examining their leave status in 2020 (table MJ_D01), by age and sex (tables MJ_01 to MJ_04)
- Migrants granted settlement in 2020 who were initially issued a Study visa to come to the UK (table MJ_D02), by age and sex (tables MJ_05 and MJ_06)
References to ‘Study’ visas refer to Tier 4 (Sponsored study) visas and their pre-PBS equivalents. Short-term study visas are excluded from this analysis. All figures include dependants unless otherwise stated.
Key results
- Five-year cohort: Of the 157,000 people granted a Study visa in 2015, 16% held valid leave at the end of 2020 – similar to the 2014 cohort (17%).
- Ten-year cohort: Of the 250,000 granted a Study visa in 2010, 7% still held valid leave and 8% had been granted settlement at the end of 2020.
- Of all those granted settlement in 2020, 19% had initially been granted a Study visa; despite low rates of settlement compared to other visa categories, the large volume of foreign students means that they account for nearly a fifth of settlement cases in 2020.
- Around three-quarters (77%) of Study visas issued in 2015 were to 18 to 29 year olds, but the long path to settlement for migrating students means they are unlikely to be granted settlement until their 30s and 40s.
Of people granted a Study visa in 2015, 16% still held valid leave at the end of 2020:
- 10% were continuing to study and remain on a Study visa
- 4% had switched to a Work visa
- 1% had switched to a Family visa
- 1% held other categories of visa
Of people issued an initial Study visa in 2015, 56% had expired leave after just two years. After five years, the proportion with expired leave increased to 84%, indicating that many people on Study visas will come to study and do not subsequently seek to remain in the UK. These figures relate only to those whose initial visa was a Tier 4 (Sponsored study) visa, and exclude the large numbers of those on ‘Short-term study’ visas for short courses and study-abroad programmes.
The proportion of migrants arriving on an initial Study visa who subsequently obtain a Work visa within the five years following their arrival as a student has decreased over time – from 14% of those granted a Study visa in the 2004 cohort to 4% in the 2015 cohort. This change is consistent with the tightening of Immigration Rules for students since September 2007. It also reflects changes in the composition of student migrants coming to the UK. For example, Chinese students accounted for 13% of those initially granted a Study visa in the 2004 cohort and had risen to 33% of the 2015 cohort. Chinese nationals are less likely than other nationalities to stay in the UK long term – 15% of Chinese nationals granted visas for Work, Study, Family or Dependants joining or accompanying in 2015 had valid leave or settlement five years later, compared to 27% across all other nationalities.
Figure 7 shows that majority of students’ leave had expired after five years, consistently increasing from 73% for the 2006 cohort to 84% for the 2015 cohort. It also shows that only a tiny proportion of students had been granted settlement after five years, from a high of 1.9% for the 2006 cohort to a low of 0.1% for 2015.
Figure 7: Number of migrants issued an initial Study1 visa in 2006 to 2015, broken down by their immigration status after five years

Source: Migrant Journey – Detailed Tables – MJ_D01
Notes:
-
Tier 4 (Sponsored study) and pre-PBS equivalents. Excludes Short-term study visas.
-
Categories less than 5% are not labelled on the chart.
-
Percentages may not sum to 100% due to rounding.
Those aged between 18 and 29 years made up over three-quarters (77%) of Study visas issued in 2015 (and of which 98% were main applicants). Of this age group, only 12% still had valid leave at the end of 2020. There were no substantial differences between male and female students in this respect.
Under 18s made up only 13% of Study visas issued in 2015 but this age group were the most likely to hold valid leave after five years – over a third (36%) still held a visa at the end of 2020. Of the under 18s issued Study visas in 2015, 32% were dependants of a main visa holder (likely the children of adult students), while the remaining 68% were main applicants. Under 18s who were main visa holders were particularly likely to continue holding valid leave after five years (44%). This is likely because many of them come to study at schools, rather than universities, and therefore stay for a longer period to complete their education.
Less than 1% of those granted an initial Study visa in 2015 had been granted settlement by the end of 2020. Only a very small proportion of student visa holders are granted settlement within a five-year timeframe, as Study is not a direct route to settlement – a student would usually have to apply for another type of visa, for example by switching into skilled employment or through marriage, before being eligible for settlement.
After 10 years, the proportion of former students with settlement is greater; 8% of those granted an initial Study visa in 2010 had been granted settlement by the end of 2020. These visa holders will, in most cases, have subsequently switched into another route to permanent settlement or applied for settlement under the ten-year long-term residency rule. Only 6% of those granted settlement in 2020 who had initially been issued a Study visa, remained on a Study visa immediately prior to being granted settlement. Just under half (44%) had switched to a Work visa and over a quarter (31%) had switched to a Family visa.
Although the settlement rate for student visa holders is low compared to people on Work and Family visas, the volume of Study visas issued is much larger than other categories. As a result, of those granted settlement in 2020, 19% had originally entered the UK on a Study visa. They were most likely to have been granted their initial Study visa in 2010, demonstrating the longer route to settlement for Study migrants.
Of the top five nationalities issued Study visas in 2015 (who together accounted for 57% of total Study visas granted), Nigerian nationals had the highest proportion who still had valid leave five years later (25%). American nationals were less likely to have valid leave after five years (10%).
Table 1: Top 5 nationalities issued an initial Study1 visa in 2015
| Visa category | Migrants in 2015 cohort | % with expired leave after five years | % with valid leave after five year | % granted settlement after five years |
|---|---|---|---|---|
| All nationalities | 157,244 | 84% | 16% | 0% |
| Of which: | ||||
| China | 51,154 | 87% | 13% | 0% |
| United States | 12,866 | 90% | 10% | 0% |
| India | 9,856 | 84% | 16% | 0% |
| Malaysia | 7,862 | 86% | 13% | 0% |
| Nigeria | 7,377 | 75% | 25% | 0% |
Source: Migrant Journey – Detailed Tables – MJ_D01
Notes:
-
Tier 4 (Sponsored study) visas and pre-PBS equivalents. Excludes Short-term study visas.
-
Percentages may not sum to 100% due to rounding.
Of all those granted settlement in 2020 who had initially entered on a Study visa, the most common nationalities were Indian (15%), Pakistani (14%) and Chinese (9%).
Of those granted settlement in 2020 who had initially entered on a Study visa, 77% were between 30 and 49 years old when granted settlement. This is despite the majority of Study visas being issued to 18 to 29 year olds. This is likely related to the longer path for settlement for Study migrants, meaning they are often 10 or more years older by the time they are granted settlement.
4. Work
The data in this section relate to:
- People granted an initial Work visa in 2015 and examining their leave status in 2020 (table MJ_D01), by age and sex (tables MJ_03 and MJ_04)
- Migrants who were granted settlement in 2020, who were initially issued a Work visa to come to the UK (table MJ_D02), by age and sex (tables MJ_05 and MJ_06)
All references to ‘Tier 1’, ‘Tier 2’ and ‘Tier 5’ visas within this section also include their pre-PBS equivalents. All figures include dependants unless otherwise stated.
Key results
- Of the 135,000 people granted a Work visa in 2015, around a quarter (24%) still held valid leave or had been granted settlement by the end of 2020, a similar proportion to the preceding year’s cohort.
- 9% of people granted a Work visa in 2015 had been granted settlement after five years, a similar level to the 2014 (10%) and 2013 (8%) cohorts of Work migrants.
- For people issued Tier 1 (High value) visas in 2015, 70% still held valid leave or settlement after five years, compared to 29% of those issued Tier 2 (Skilled) visas and 10% of those issued Tier 5 (Youth mobility and temporary worker) visas.
- Of all those people granted settlement in 2020, a quarter (25%) had initially arrived on a Work visa, the same proportion as in 2019.
At the end of 2020, around a quarter (24%) of people who initially came to the UK in 2015 on a Work visa (either as the main applicant or their dependant) held valid leave or settlement:
- 12% remained on a Work visa
- 3% had switched to a different category of visa
- 9% had been granted settlement
The remaining 76% of people issued Work visas in 2015 had expired leave by the end of 2020. Figure 8 shows the proportions.
Figure 8: 2020 status of migrants granted work visas in 2015
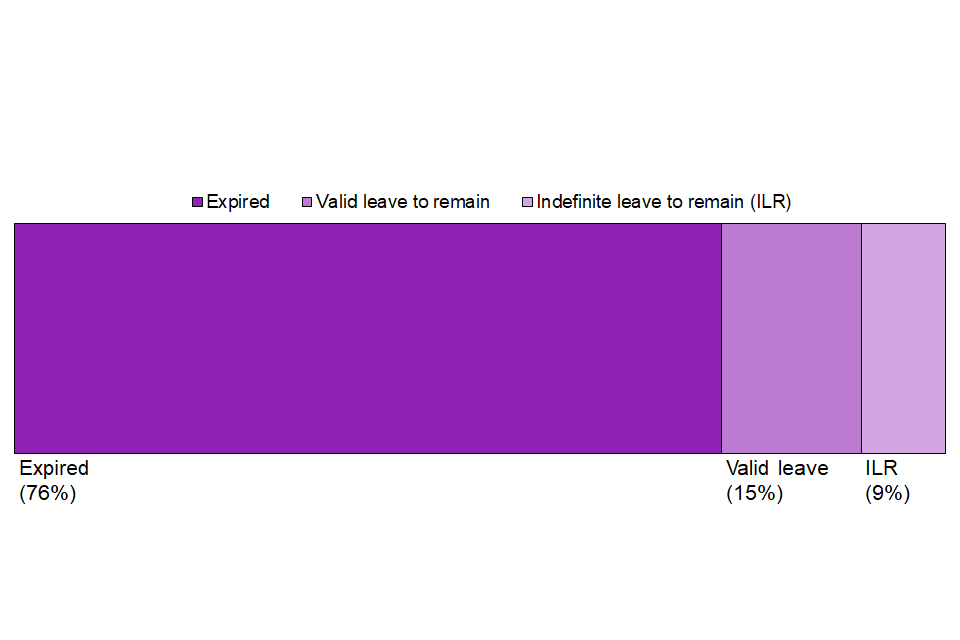
Source: Migrant Journey – Detailed Tables – MJ_D01
Under 18s issued Work visas in 2015 were the age group most likely to hold valid leave or settlement five years later (36%). However, almost all (98%) of these were dependants accompanying someone else on a Work visa, such as their parents. This may indicate that Work migrants who bring children with them are more likely to stay in the UK long term. For other ages groups the proportion of those holding valid leave or settlement after five years was between 14% and 25%.
At the end of 2020, 25% of females issued Work visas in 2015 held valid leave or settlement, compared to 23% of males.
Figure 9 shows that for each cohort of Work migrants from 2006 to 2015, a large majority (between 66% and 77%) had no leave to remain five years later.
Figure 9: Number of migrants issued an initial Work visa in 2006 to 2015, broken down by their immigration status after five years
Source: Migrant Journey – Detailed Tables – MJ_D01
Note: Percentages may not sum to 100% due to rounding.
People arriving on the Tier 1 routes (and pre-PBS equivalents) had the highest proportion of individuals with valid leave or settlement (70%) after five years, although this category also represents the smallest number of Work visas issued. The Tier 1 route has focused on providing visas for ‘High value’ migrants, including the exceptional talent route, investors and entrepreneurs.
By comparison, there was a much lower proportion of valid leave or settlement for people on the Tier 2 route (29%). The proportion was even lower for people on the Tier 5 route (10%) which had a very small number of settlement cases, which is unsurprising given the temporary nature of the Tier 5 routes.
Table 2: Migrants issued an initial Work visa in 2015, broken down by work category
| Visa category | Migrants in 2015 cohort | % with expired leave after five years | % with valid leave after five years | % granted settlement after five years |
|---|---|---|---|---|
| All categories | 135,312 | 76% | 15% | 9% |
| Of which: | ||||
| High value (Tier 1) | 4,523 | 30% | 34% | 36% |
| Skilled (Tier 2) | 79,156 | 71% | 18% | 11% |
| Youth mobility & temporary work (Tier 5) | 39,268 | 90% | 10% | 0% |
| Non-PBS / Other | 12,365 | 82% | 7% | 11% |
Source: Migrant Journey – Detailed Tables – MJ_D01
Notes:
-
Tier 1, Tier 2 and Tier 5 totals include pre-PBS equivalents.
-
Percentages may not sum to 100% due to rounding.
Of all those granted settlement in 2020, a quarter (25%) had initially been granted a Work visa. They were most likely to have been granted their Work visa in 2015, with migrants applying for settlement as soon as they were eligible after five years.
Due to their higher settlement rate, Tier 1 workers made up 19% of migrants granted settlement in 2020 who had initially entered on a Work visa, despite making up less than 10% of those granted work visas. Tier 1 workers granted settlement in 2020 were roughly equally likely to have an initial grant in either 2014 or 2015.
Tier 2 workers have a lower settlement rate but account for a much larger proportion of Work visas issued, hence over half (63%) of workers granted settlement in 2020 had entered on Tier 2 visas. The remaining 18% of settlement cases in 2020 who been issued initial Work visas, entered the UK originally on a temporary Tier 5 (9%) or other non-PBS (9%) Work visa.
Tier 2 (Skilled) work
Tier 2 visas (and pre-PBS equivalents) accounted for over half (58%) of Work visas issued in the 2015 cohort. 11% of migrants on this route had been granted settlement within five years, similar to the 2014 cohort. However, the proportion of Tier 2 workers granted settlement within five years remains much lower than 2009 levels (23%).
The proportion of Tier 2 workers who had been granted settlement within five years differs by nationality. Some differences between nationalities are likely to be related to the types of jobs they do and also the number of people granted visas under the Intra-company Transfer (ICT) route, which does not have a direct route to settlement. Of the top 10 nationalities granted Tier 2 visas in 2015, Japanese nationals had the highest proportion of ICT visas (90%), along with the lowest proportion of migrants granted settlement after five years (1%). Pakistan had the lowest proportion of ICT visas (9%) and the second highest proportion granted settlement after five years (37%).
Table 3: Top 10 nationalities (by volume) issued an initial Tier 2 (Skilled) work visa in 2015, ordered by proportion granted settlement
| Nationality | Migrants in 2015 cohort | Proportion of Tier 2 visas issued which were ICTs1 | % with expired leave after five years | % with valid leave after five years | % granted settlement after five years |
|---|---|---|---|---|---|
| All nationalities | 79,156 | 64% | 71% | 18% | 11% |
| Of which: | |||||
| Philippines | 1,655 | 18% | 27% | 34% | 39% |
| Pakistan | 1,440 | 9% | 26% | 37% | 37% |
| Russia | 1,301 | 25% | 43% | 23% | 34% |
| South Africa | 1,359 | 29% | 50% | 24% | 26% |
| China | 2,026 | 42% | 63% | 20% | 16% |
| Canada | 1,286 | 30% | 69% | 19% | 13% |
| Australia | 1,900 | 29% | 66% | 22% | 12% |
| United States | 8,903 | 53% | 75% | 17% | 8% |
| India | 45,683 | 82% | 78% | 14% | 7% |
| Japan | 3,244 | 90% | 83% | 15% | 1% |
Sources:
Migrant Journey – Detailed Tables – MJ_D01
Entry clearance visa applications and outcomes – Vis_D02
Notes:
-
Tier 2 visa totals include pre-PBS equivalents.
-
ICT figures sourced from the quarterly Home Office ‘Immigration Statistics’ publication.
Of all those granted settlement in 2020 who had initially entered on a Work visa, the top nationalities were India (28%), Pakistan (8%) and the USA (7%).
Just under two-thirds (65%) of those granted settlement in 2020 who had initially entered on a Work visa were aged between 30 and 49 years old when granted settlement.
A majority (55%) of those granted settlement in 2020 who had initially entered on a Work visa were female.
5. Family
The data in this section relate to:
- People granted an initial Family visa in 2015 and examining their leave status in 2020 (table MJ_D01), by age and sex (tables MJ_03 and MJ_04)
- Migrants initially issued a Family visa to come to the UK and who were granted settlement in 2020 (table MJ_D02), by age and sex (tables MJ_05 and MJ_06)
Key results
- Of the 32,000 people granted a Family visa in 2015, 70% held valid leave or settlement at the end of 2020, much higher than other categories of visa. This is a lower proportion than the 2014 cohort (89%).
- Females accounted for nearly three-quarters (72%) of Family visas issued in 2015
- Under 18s who arrived on a Family visa were much more likely (86%) than other age groups (68%) to hold valid leave or settlement five years later.
- Of people granted a Family visa in 2015, 32% had been granted settlement at the end of 2020, continuing a general downward trend in settlement rates after five years starting from a peak of 82% for the 2010 cohort
- Of all those granted settlement in 2020, 24% had initially been granted a Family visa.
At the end of 2020, 70% of people granted a Family visa in 2015 held valid leave or settlement:
- Over a third (37%) remained on a Family visa
- 1% had switched to a different category of visa
- Almost a third (32%) had been granted settlement
The remaining 30% of migrants issued Family visas in 2015 had expired leave by the end of 2020. This proportions are shown in Figure 10.
Figure 10: 2020 status of migrants granted family visas in 2015

Source: Migrant Journey – Detailed Tables – MJ_D01
The proportion of people granted a Family visa in 2015 who had been granted settlement five years later (32%) was a much lower than the 2014 cohort (46%). This continues a general downward trend starting from a peak of 82% in 2010, and was less than half the rate of the 2012 cohort (69%). This change can to some degree be accounted for by changes in July 2012 to the Immigration Rules for Family visas, which changed the eligibility period for settlement from two years to five years.
Younger age groups (under 29 years old) issued Family visas in 2015 were the most likely to hold valid leave or settlement five years later, 86% of under 18s and 69% of 18 to 29 year olds, compared to 66% for over 30s. Females accounted for 72% of Family visas issued in 2015, though there was little difference between the sexes in the proportion of those who held valid leave or settlement at the end of 2020.
Figure 11 shows that there was a general downward trend in the number of family visas issued between 2005 and 2013 with small increases in 2014 and 2015. It also shows a downward trend in the proportion of those granted settlement after five years, with a large drop for the 2013 cohort following the mid-2012 immigration rule changes.
Figure 11: Number of migrants issued an initial Family visa in 2006 to 2015, broken down by their immigration status after five years

Source: Migrant Journey – Detailed Tables – MJ_D01
Note: Percentages may not sum to 100% due to rounding.
Of the top five nationalities issued Family visas in 2015 (accounting for 42% of total Family visas granted), Syrian nationals had the highest proportion with settlement after five years (80%). Almost all Syrian nationals initially issued a family visa in 2015 were granted Family Reunion visas, which are issued to partners and children of those previously granted refugee status (asylum) or humanitarian protection in the UK.
Bangladeshi (19%) and American (20%) nationals were less likely to have settlement after five years.
Table 4: Top 5 nationalities (by volume) issued an initial Family visa in 2015
| Visa category | Migrants in 2015 cohort | % with expired leave after five years | % with valid leave after five years | % granted settlement after five years |
|---|---|---|---|---|
| All nationalities | 31,558 | 30% | 38% | 32% |
| Of which: | ||||
| Pakistan | 4,942 | 30% | 41% | 28% |
| India | 3,041 | 31% | 42% | 27% |
| Syria | 1,848 | 13% | 6% | 80% |
| United States | 1,826 | 45% | 35% | 20% |
| Bangladesh | 1,733 | 26% | 55% | 19% |
Source: Migrant Journey – Detailed Tables – MJ_D01
Of all migrants granted settlement in 2020, 24% had been initially granted a Family visa. One third (33%) of these were issued their initial Family visa in 2015, suggesting these migrants applied for settlement as soon as they become eligible after five years, with a further 28% issued a visa in 2014.
Of all those granted settlement in 2020 who had initially entered on a Family visa, the top nationalities were Pakistani (15%) and Syrian (10%).
Similar to the Study and Work visa categories, the majority (53%) of those granted an initial Family visa who had been granted settlement in 2020 were aged between 30 and 49. Most (72%) were female, which is consistent with the proportion of Family visas issued to female migrants in 2015 (72%).
6. Further information and enquiries
The data are presented in two detailed data tables:
- Table MJ_D01: End-of-year category and immigration status of all applicants issued a visa by year of initial grant, category of initial visa and country of nationality. Persons starting on Visit visas, visas for immediate settlement and other smaller miscellaneous entry clearance routes (e.g. EEA family permits) are excluded.
- Table MJ_D02: Migrants granted settlement by year of settlement grant, initial leave category and country of nationality. Persons arriving as visitors or for short-term study are excluded.
This release also includes data on the age and sex of migrants, following their introduction to the series last year. These data are presented in the following summary tables:
- Table MJ_01: Status of those issued an initial visa in 2010 at the end of 2020, by initial visa category and age at initial visa grant.
- Table MJ_02: Status of those issued an initial visa in 2010 at the end of 2020, by initial visa category and sex.
- Table MJ_03: Status of those issued an initial visa in 2015 at the end of 2020, by initial visa category and age at initial visa grant.
- Table MJ_04: Status of those issued an initial visa in 2015 at the end of 2020, by initial visa category and sex.
- Table MJ_05: Grants of settlement in 2020 by year of initial grant, initial visa category and age at time of settlement.
- Table MJ_06: Grants of settlement in 2020 by year of initial grant, initial visa category and sex.
Tables MJ_01 and MJ_03 are based on the age of migrants when granted their initial visa, while table MJ_05 is based on the age of migrants when granted settlement.
About the figures
Both main applicants and dependants are included.
The Study figures include all lengths of sponsored Tier 4 Study visas but exclude Short-term study (where validity is up to 6 or 11 months), as this category of leave cannot be extended in-country.
Where the text refers to those granted settlement, this also includes those who were granted citizenship (alternatively or subsequently to a grant of settlement), unless this is otherwise indicated. The supplementary tables separately identify migrants granted settlement and individuals who have been granted citizenship.
Those granted settled or pre-settled status under the EU Settlement Scheme are not included in this analysis. Statistics relating to the EU Settlement Scheme are published monthly and quarterly as part of the EU Settlement Scheme statistics release.
Percentages in this report do not always add up to 100% due to rounding.
‘Family’ visas are where an individual is applying for a visa on the basis of their relationship to a person granted settlement in the UK or a British citizen.
‘Dependants joining or accompanying’ are dependants applying for a visa on the basis of their relationship with another migrant (who has not been granted settlement and is not a British citizen).
The expiration of an individual’s (entry clearance) visa or extension of stay does not necessarily imply that person has (or has not) left the UK – there are a number of reasons why an individual with an expired visa may still be in the UK legally e.g. while waiting for the outcome of a further application to stay. Similarly some individuals granted a visa may never have entered the UK. Some of those with expired visas may not have left the UK.
This is the eleventh in a series of reports based on the ‘Migrant Journey’; it is published annually by the Home Office and complements data published as part of the quarterly National Statistics release of ‘Immigration Statistics’. If as a user you have any comments on this report please email MigrationStatsEnquiries@homeoffice.gov.uk.
The findings presented here are based on data collected from Home Office administrative databases. These databases hold records of individuals granted Entry clearance visas and any subsequent grants of extensions of stay in the UK. As these are sourced from operational systems, numbers may change and may not precisely reflect other published statistics, if those are produced and published at a different time. While EEA nationals do not require visas, records suggest that some apply and are granted visas, and therefore small numbers may be included in this analysis. Nationals from countries that became part of the EEA over the time period of this analysis are also likely to be included in earlier cohorts.
The ‘Migrant Journey: user guide’ provides further details on this topic including definitions used, how figures are compiled, data quality and issues arising from figures based on data sourced from an administrative database.
The numbers of applications and decisions made reflect changes in the levels of immigration over time as well as policy and legislative changes, including changes to immigration legislation. Details of these policy changes, together with information on changes to immigration legislation affecting the statistics, can be found in ‘Policy and legislative changes affecting migration to the UK: timeline’ published alongside this report.
Statistical or public enquiries
If you would like to make an enquiry about this release or have any general feedback about this release, please contact the Migration Statistics team by emailing MigrationStatsEnquiries@homeoffice.gov.uk.
Media enquiries via Home Office news desk
Journalists with enquiries can call the Home Office news desk on 0300 123 3535. The desk operates from 7am to 8pm, Monday to Friday.