Only Connect report (HTML version)
Published 25 January 2024

© Crown copyright 2024
This publication is licensed under the terms of the Open Government Licence v3.0 except where otherwise stated. To view this licence, visit nationalarchives.gov.uk/doc/open-government-licence/version/3 or write to the Information Policy Team, The National Archives, Kew, London TW9 4DU, or email: psi@nationalarchives.gov.uk.
Where we have identified any third party copyright information you will need to obtain permission from the copyright holders concerned.
This publication is available at https://www.gov.uk/government/statistics/justice-data-lab-statistics-january-2024/only-connect-report-html-version--2
This analysis looked at the reoffending behaviour of 249 men participating with the Keyworking programme from Only Connect (OC). It covers those who began the programme between January 2018 and December 2021. The overall results do not show that the programme had a statistically significant effect on a person’s reoffending behaviour. A previous analysis was published in April 2014, covering a separate cohort and a variation of the programme. This can be found in the Justice Data Lab statistics collection on GOV.UK.
Only Connect work with men and women in prison or in the community in London and the South East, with the aim of helping them to live crime-free lives. The Keyworking programme aims to help individuals ensure the key things are in place to help get them into employment following offending. This analysis only considers males as there were too few females within the cohort to analyse separately.
The headline analysis in this report measured proven reoffences in a one-year period for a ‘treatment group’ of 249 offenders who received support some time between 2018 and 2021, and for a much larger ‘comparison group’ of similar offenders who did not receive it. The analysis estimates the impact of the support from Only Connect on reoffending behaviour.
1. Overall measurements of the treatment and comparison groups
| For 100 typical men in the treatment group, the equivalent of: | For 100 typical men in the comparison group, the equivalent of: |
|---|---|
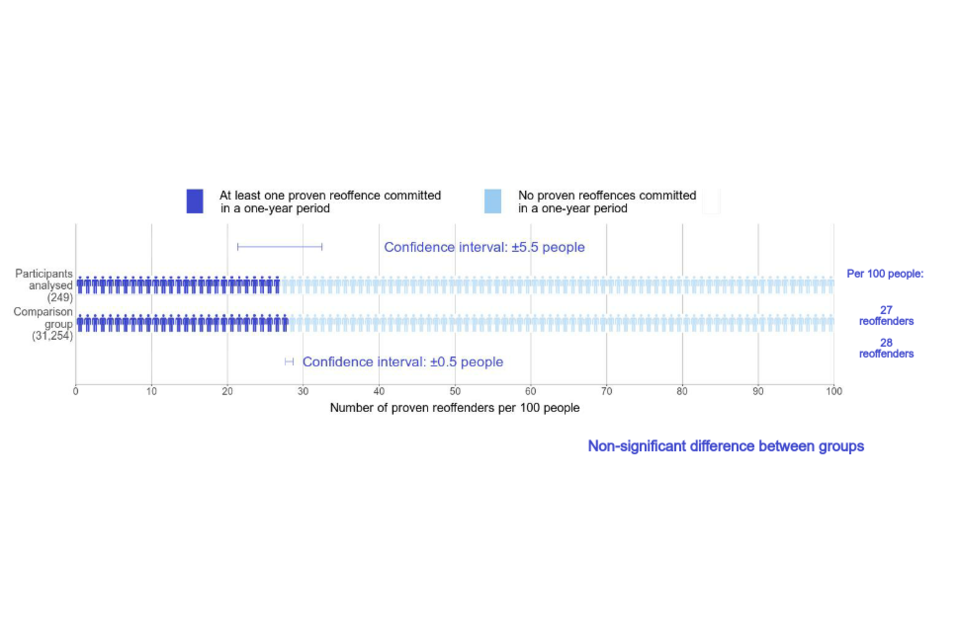
| 27 of the 100 men committed a proven reoffence within a one-year period (a rate of 27%), 1 man fewer than in the comparison group. | 28 of the 100 men committed a proven reoffence within a one-year period (a rate of 28%). |
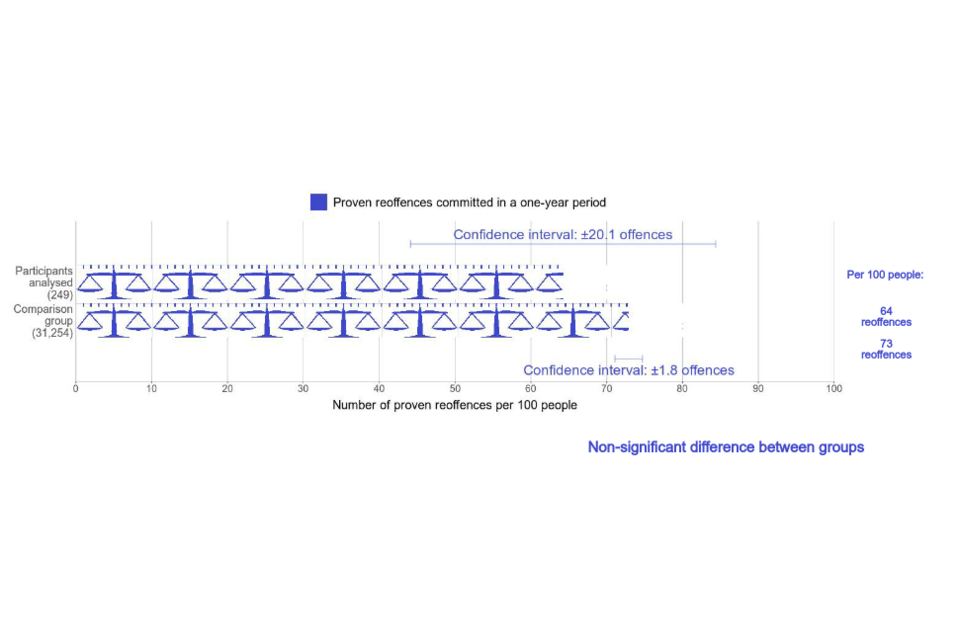
| 64 proven reoffences were committed by these 100 men during the year (a frequency of 0.6 offences offences per person), 9 offences fewer than in the comparison group. | 73 proven reoffences were committed by these 100 men during the year (a frequency of 0.7 offences per person). |
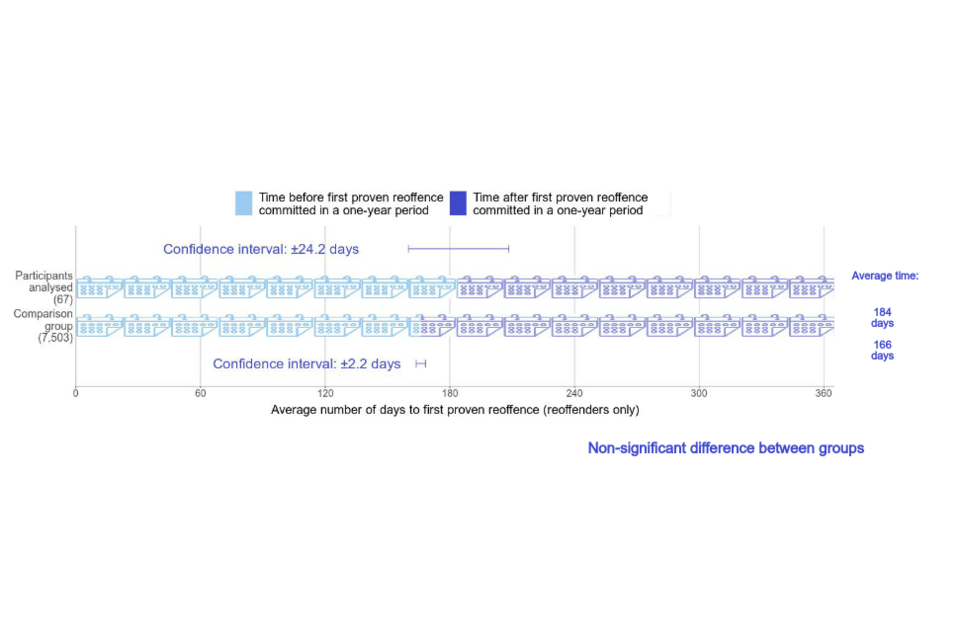
| 184 days was the average time before a reoffender committed their first proven reoffence, 18 days later than the comparison group. | 166 days was the average time before a reoffender committed their first proven reoffence. |
2. Overall estimates of the impact of the intervention
| For 100 typical men who receive support, compared with 100 similar men who do not receive it: |
|---|
| The number of men who commit a proven reoffence within one year could be lower by as many as 7 men, or higher by as many as 4 men. More men would need to be available for analysis in order to determine the direction of this difference. |
| The number of proven reoffences committed during the year could be lower by as many as 29 offences, or higher by as many as 12 offences. More men would need to be available for analysis in order to determine the direction of this difference. |
| On average, the time before an offender committed their first proven reoffence could be shorter by as many as 6 days, or longer by as many as 43 days. More men would need to be available for analysis in order to determine the direction of this difference. |
| ✔ | What you can say about the one-year reoffending rate: |
|---|---|
| “This analysis does not provide clear evidence on whether support from Only Connect increases or decreases the number of participants who commit a proven reoffence in a one-year period. There may be a number of reasons for this and it is possible that an analysis of more participants would provide such evidence.” | |
| ✖ | What you cannot say about the one-year reoffending rate: |
| “This analysis provides evidence that support from Only Connect increases / decreases / has no effect on the reoffending rate of its participants.” | |
| ✔ | What you can say about the one-year reoffending frequency: |
| “This analysis does not provide clear evidence on whether support from Only Connect increases or decreases the number of proven reoffences during a one-year period. There may be a number of reasons for this and it is possible that an analysis of more participants would provide such evidence.” | |
| ✖ | What you cannot say about the one-year reoffending frequency: |
| “This analysis provides evidence that support from Only Connect increases / decreases / has no effect on the number of proven reoffences committed during a one-year period by its participants.” | |
| ✔ | What you can say about the time to first reoffence: |
| “This analysis does not provide clear evidence on whether support from Only Connect shortens or lengthens the average time to first proven reoffence. There may be a number of reasons for this and it is possible that an analysis of more participants would provide such evidence.” | |
| ✖ | What you cannot say about the time to first reoffence: |
| “This analysis provides evidence that support from Only Connect shortens / lengthens / has no effect on the average time to first proven reoffence for its participants.” |
3. Figure 1: One-year proven reoffending rate after support from Only Connect
4. Figure 2: One-year proven reoffending frequency after support from Only Connect
5. Figure 3: Average time (days) to first proven reoffence after support from Only Connect
6. Only Connect in their own words
“Only Connect aims to reduce reoffending for people leaving prison and for those on community sentences, and increase the opportunities and dignity of one of the most marginalised groups in society. Our vision is a connected society, where everyone has the means to make positive choices and live crime-free lives.
For those in prison, we start our programme in prison, about 10 weeks before release, with one-to-one mentoring support (keyworking). Our work continues in the community with one-to-one fortnightly sessions, aimed at supporting our members into good and sustainable jobs.
Our members use their time with us to reflect on the drivers and triggers behind their offences and the type of coping mechanisms that will provide motivation to avoid reoffending. During their one-to-one sessions, we provide practical support with obtaining ID documents, and producing an effective CV and disclosure letter. A striking number of prison leavers have been raised in poverty; we share our knowledge of the welfare system, so they know what they are entitled to, and we help them build a personal budget - especially how to handle debt after prison and court fines. Once the members feel ready, the keyworkers support them with job aspirations, life-work balance, and preparing excellent applications and interviews.
In addition, we deliver music courses in our premises. These courses increase our members’ confidence and employability by developing collaborative skills as they work together in writing and producing music; they also gain insights into the music industry, be creative and meet new friends.”
7. Response from Only Connect to the Justice Data Lab analysis
“We are grateful to the Justice Data Lab for their help in doing this analysis. We are a bit disappointed that the original large sample of 578 was reduced to only 249 people who could be analysed.
Since starting this study, we have reviewed our approach and introduced three changes which we hope will both increase engagement and improve outcomes. These improvements are:
• Running a short course called Love & Money at the start of our programme. This addresses both the issue of maintaining relationships in prison and how a couple handles money together.
• Improving the keyworking programme and tying it in with the Love & Money programme.
• Running a short course on employment close to release.
We hope to collect a new dataset and submit it to the JDL in the future.”
8. Results in detail
One analysis was conducted, controlling for offender demographics and criminal history and the following risks and needs: employment history, education, financial history, relationships, drug and alcohol use, mental health, thinking skills and attitudes towards offending.
- Regional analysis: treatment group matched to offenders in London and the South East using demographics, criminal history and individual risks and needs.
The sizes of the treatment and comparison groups for reoffending rate and frequency analyses are provided below. To create a comparison group that is as similar as possible to the treatment group, each person within the comparison group is given a weighting proportionate to how closely they match the characteristics of individuals in the treatment group. The calculated reoffending rate uses the weighted values for each person and therefore does not necessarily correspond to the unweighted figures.
| Treatment Group Size | Comparison Group Size | Reoffenders in treatment group | Reoffenders in comparison group (weighted number) |
|---|---|---|---|
| 249 | 31,254 | 67 | 7,503 ( 8,795 ) |
Three headline measures of one-year reoffending were analysed, as well as four additional measures (see results in Tables 1-7):
- Rate of reoffending
- Frequency of reoffending
- Time to first reoffence
- Rate of first reoffence by court outcome
- Frequency of reoffences by court outcome
- Rate of custodial sentencing for first reoffence
- Frequency of custodial sentencing
Tables 1-7 show the overall measures of reoffending. Rates are expressed as percentages and frequencies expressed per person. Tables 3 to 7 include reoffenders only.
8.1 Table 1: Proportion of men who committed a proven reoffence in a one-year period (reoffending rate) after support from Only Connect compared with a matched comparison group
| Number in treatment group | Number in comparison group | Treatment group rate (%) | Comparison group rate (%) | Estimated difference (% points) | Significant difference? | p-value |
|---|---|---|---|---|---|---|
| 249 | 31,254 | 27 | 28 | -7 to 4 | No | 0.66 |
8.2 Table 2: Number of proven reoffences committed in a one-year period (reoffending frequency - offences per person) by men who received support from Only Connect compared with a matched comparison group
| Number in treatment group | Number in comparison group | Treatment group frequency | Comparison group frequency | Estimated difference | Significant difference? | p-value |
|---|---|---|---|---|---|---|
| 249 | 31,254 | 0.64 | 0.73 | -0.29 to 0.12 | No | 0.40 |
8.3 Table 3: Average time (days) to first proven reoffence in a one-year period for men who received support from Only Connect, compared with a matched comparison group (reoffenders only)
| Number in treatment group | Number in comparison group | Treatment group time (days) | Comparison group time (days) | Estimated difference | Significant difference? | p-value |
|---|---|---|---|---|---|---|
| 67 | 7,503 | 184 | 166 | -6 to 43 | No | 0.14 |
8.4 Table 4: Proportion of men supported by Only Connect with first proven reoffence in a one-year period (reoffending rate) by court outcome, compared with similar non-participants (reoffenders only)
| Number in treatment group | Number in comparison group | Court outcome | Treatment group rate (%) | Comparison group rate (%) | Estimated difference (% points) | Significant difference? | p-value |
|---|---|---|---|---|---|---|---|
| 67 | 7,503 | Either way | 69 | 72 | -15 to 8 | No | 0.58 |
| Summary | 25 | 19 | -4 to 17 | No | 0.23 |
8.5 Table 5: Number of proven reoffences in a one-year period (reoffending frequency) by court outcome for men supported by Only Connect, compared with similar non-participants (reoffenders only)
| Number in treatment group | Number in comparison group | Court outcome | Treatment group frequency | Comparison group frequency | Estimated difference | Significant difference? | p-value |
|---|---|---|---|---|---|---|---|
| 67 | 7,503 | Either way | 1.45 | 1.68 | -0.58 to 0.12 | No | 0.19 |
| Summary | 0.76 | 0.68 | -0.24 to 0.39 | No | 0.63 |
8.6 Table 6: Proportion of men who received a custodial sentence for their first proven reoffence after support from Only Connect, compared with similar non-participants (reoffenders only)
| Number in treatment group | Number in comparison group | Treatment group rate (%) | Comparison group rate (%) | Estimated difference (% points) | Significant difference? | p-value |
|---|---|---|---|---|---|---|
| 67 | 7,503 | 51 | 46 | -8 to 17 | No | 0.46 |
8.7 Table 7: Number of custodial sentences received in a one-year period by men who received support from Only Connect, compared with similar non-participants (reoffenders only)
| Number in treatment group | Number in comparison group | Treatment group frequency | Comparison group frequency | Estimated difference | Significant difference? | p-value |
|---|---|---|---|---|---|---|
| 67 | 7,503 | 1.18 | 1.26 | -0.52 to 0.36 | No | 0.72 |
9. Profile of the treatment group
Only Connect offered one-to-one keyworking sessions to individuals. In custodial settings, these sessions lasted approximately an hour and were conducted weekly, typically for the last 8-10 weeks of the individual’s sentence. In the community, the keyworking was offered fortnightly until the individual disengaged or asked to stop. The sessions offered support on employment, finance, benefits and debt.
| Participants included in analysis (249 offenders) | Participants not included in analysis (277 offenders with available data) | |
|---|---|---|
| Sex | ||
| Male | 100% | 96% |
| Female | 0% | 4% |
| Ethnicity | ||
| White | 16% | 18% |
| Black | 69% | 68% |
| Asian | 11% | 11% |
| Other | 2% | 1% |
| Unknown | 1% | 1% |
| UK national | ||
| UK nationality | 89% | 87% |
| Foreign nationality | 8% | 10% |
| Unknown nationality | 3% | 3% |
| Index disposal | ||
| Community order | 6% | |
| Suspended sentence order | 6% | |
| Conditional discharge | 1% | |
| Fine | 3% | |
| Other | 0% | |
| Prison | 83% |
The individuals in the treatment group were aged 18 to 56 years at the beginning of their one-year period (average age 23).
Please note totals may not appear to equal the sum of the component parts due to rounding.
Information on index offences for the 277 participants not included in the analysis is not available, as they could not be linked to a suitable sentence.
For 52 people without any records in the reoffending database, no personal information is available.
Information on risk was available for 211 males in the reoffending analysis treatment group (85%), recorded near to the time of their original conviction. This information is not complete for all 211 males across all risks considered for this analysis, but where it is known for specific risks, some key findings are shown below.
- 89% had some or significant problems with problem solving
- 92% had some or significant problems with awareness of consequences
- 95% had evidence that their thinking and behaviour linked to offending
10. Matching the treatment and comparison groups
The analysis matched the treatment group to a comparison group. A large number of variables were identified and tested for inclusion in the regression models. The matching quality of each variable can be assessed with reference to the standardised differences in means between the matched treatment and comparison groups (see standardised differences annex). Over 95% of variables are categorised as green on JDL’s traffic light scale, indicating that the matching quality achieved on the observed variables was very good.
Further details of group characteristics and matching quality, including risks and needs recorded by the Offender Assessment System (OASys), can be found in the Excel annex accompanying this report.
This report is also supplemented by a general annex, which answers frequently asked questions about Justice Data Lab analyses and explains the caveats associated with them.
11. Additional information on the dataset
11.1 Index dates
The index date is the date at which the follow up period for measuring reoffending begins.
-
For males with custodial sentences, the index date is the date they are released from custody.
-
For males with a court order (such as a community sentence or a suspended sentence order), the index date is the date when an offender begins the court order.
-
For males with non-custodial sentences such as a fine, the index date is the date when the offender received the sentence.
11.2 Participants excluded from the analysis
Only Connect participants who were excluded from the analysis can largely be explained by individuals either not having a relevant adjudication result or not meeting the inclusion criteria for analysis.
Some individuals have participated in the Only Connect programme whilst on remand in prison, which means that they could have accessed the programme but were found not guilty of the offence. To be considered for analysis, the adjudication result must be guilty, as they need to have committed an initial offence to enable a reoffending rate to be measured. Individuals who have been found not guilty are therefore excluded from this analysis.
Some individuals have participated in the programme following their release from prison or after they have received a court order or non-custodial sentence. A maximum inclusion criterion of six months between the index date and intervention start date has been applied to these individuals to ensure the analysis captures any ‘treatment effects’. Any participants with intervention dates more than six months from the index date are therefore excluded from the analysis.
11.3 Other considerations
Part of the cohort within this publication overlaps with the COVID-19 pandemic including lockdowns and operational restrictions. It will therefore be affected by the continued recovery of the courts system. Particularly, continued delays in the processing of cases mean that increased numbers of reoffence convictions may fall outside of six-month waiting period and therefore not be counted in these statistics.
12. Number of people in the treatment and comparison groups
*Adjudication results must be guilty to be considered for analysis, as an individual must have committed an initial offence and have been convicted for it in order for the reoffending rate to be measured.
*Inclusion criteria such as setting a maximum of 6 months between index date and intervention start date and excluding females.
13. Further information
13.1 Official Statistics
Our statistical practice is regulated by the Office for Statistics Regulation (OSR).
OSR sets the standards of trustworthiness, quality and value in the Code of Practice for Statistics that all producers of official statistics should adhere to.
You are welcome to contact us directly with any comments about how we meet these standards.
Alternatively, you can contact OSR by emailing regulation@statistics.gov.uk or via the OSR website.
13.2 Contact
Press enquiries should be directed to the Ministry of Justice press office.
Tel: 020 3334 3536; Email newsdesk@justice.gov.uk
Other enquiries about the analysis should be directed to:
Justice Data Lab team
E-mail: justice.datalab@justice.gov.uk
© Crown copyright 2024
Produced by the Ministry of Justice
Alternative formats are available on request from justice.datalab@justice.gov.uk