18 Spring index
Updated 3 April 2024
Applies to England

© Crown copyright 2024
This publication is licensed under the terms of the Open Government Licence v3.0 except where otherwise stated. To view this licence, visit nationalarchives.gov.uk/doc/open-government-licence/version/3 or write to the Information Policy Team, The National Archives, Kew, London TW9 4DU, or email: psi@nationalarchives.gov.uk.
Where we have identified any third party copyright information you will need to obtain permission from the copyright holders concerned.
This publication is available at https://www.gov.uk/government/statistics/england-biodiversity-indicators/18-spring-index
Data last updated: November 2023
Latest data available: Spring 2022
Introduction
This is a context indicator and is not assessed; it is shown to highlight a biological response to climate change and a potential pressure on biological systems. It shows the impact of temperature change on the timing of biological events such as flowering or migration in the spring. The Spring Index is calculated from the annual mean observation date of the following 4 biological events: first flowering of hawthorn (Crataegus monogyna), first flowering of horse chestnut (Aesculus hippocastanum), first recorded flight of an orange-tip butterfly (Anthocharis cardamines), and first sighting of a swallow (Hirundo rustica).
Type of indicator
Pressure indicator
Assessment of Change
Assessment of change in the timing of spring events: No assessment – indicator provided for context only
Climate change impacts - Spring Index
Trend description for Figure 18.1
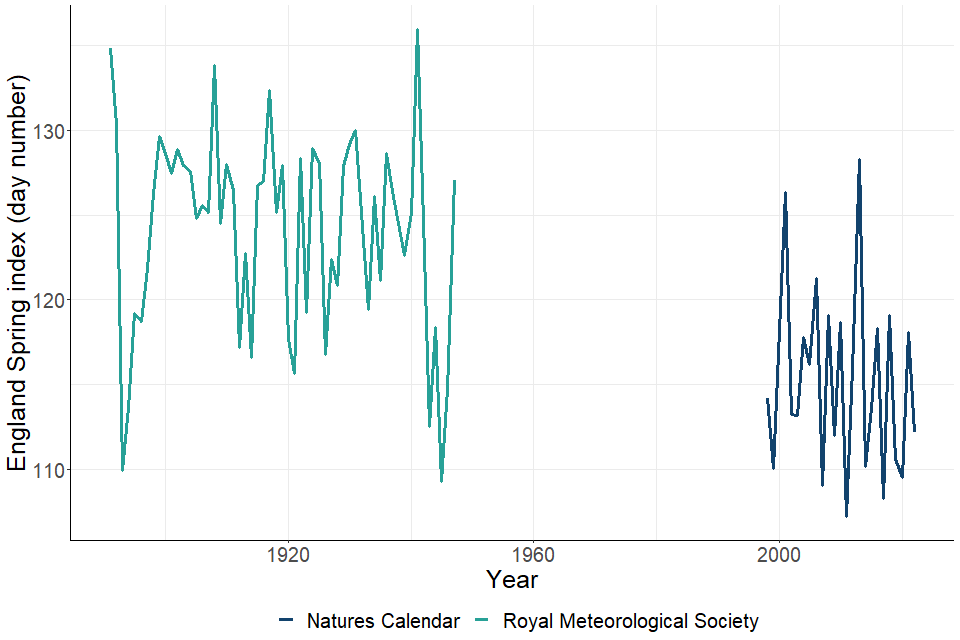
Since 1998, the annual mean observation dates have been 8.9 days in advance of the average dates in the first part of the 20th Century. The advancement of spring events is strongly linked to warmer temperatures in March and April and it advances more rapidly when the mean temperature equals or exceeds 7 degrees Celsius. The warmest April in the Central England Temperature series (1659 onwards) occurred in 2011 and resulted in an especially early spring that year (Figure 18.1).
Figure 18.1: Index of the timing of biological events in England, 1891 to 1947 and 1998 to 2022
Download the data for Figure 18.1 in ods format
Notes about Figure 18.1
- Number of days after 31 December (for example, day 121 = 1 May).
- Not directly comparable to previous versions of the indicator following a change in methodology in 2019.
- Source: 1891 to 1947 – Royal Meteorological Society, 1998 to 2022 – UK Phenology Network (Nature’s Calendar).
Further information
Relevance
Phenology is the study of the timing of recurring natural events in relation to climate, and such observations provide year-on-year information on how nature is responding to a changing climate. This indicator illustrates the stress that one aspect of climate change (spring warming) can place on biological systems. Differential responses among species may cause problems for life cycles (for example, pollinating insects emerging out of synchrony with flowers opening in spring), increasing vulnerability to extreme events such as late frosts, disruption of food webs, and changing the balance of competition between species.
The indicator shows progress with commitments in Biodiversity 2020: A strategy for England’s wildlife and ecosystem services to reduce pressures on biodiversity and to integrate biodiversity considerations into other sectors of decision making such as climate change adaptation (see Annex A of the aforementioned report).
The indicator is also relevant to the following global target in the Strategic Plan for Biodiversity 2011 to 2020:
Target 10: By 2015, the multiple anthropogenic pressures on coral reefs, and other vulnerable ecosystems impacted by climate change or ocean acidification are minimized, so as to maintain their integrity and functioning.
The UK and England Biodiversity Indicators are currently being assessed alongside the Environment Improvement Plan Targets, and the new Kunming-Montreal Global Biodiveristy Framework Targets, when this work has been completed the references to Biodiversity 2020 and the Aichi Global Biodiveristy Framework Targets will be updated.
Background
The global climate is changing. In 2023, the Intergovernmental Panel on Climate Change (IPCC) released their Sixth Assessment Report which stated that:
Human activities, principally through emissions of greenhouse gases, have unequivocally caused global warming, with global surface temperature reaching 1.1°C above 1850–1900 in 2011–2020.
Atmospheric greenhouse gas concentrations rose to record highs in 2021 (BAMS State of the Climate), and the eight warmest years in the 173-year instrumental record were 2015-2022 (World Meteorological Organization State of the Global Climate Report 2022). The years 2016 and 2020 are tied for the warmest year on record (NASA Global Climate Change).
The UK climate is also changing. The State of the UK Climate 2021 report summarises some notable changes in UK temperature:
- the most recent decade (2012-2021) was on average 0.2°C and 1.0°C warmer than the 1991-2020 and 1961-1990 30-year averages respectively
- the current century has included the ten warmest years, and yet none of the 10 coldest years, in the temperature series, from 1884
- the Central England Temperature (CET) series, from 1659, illustrates that to date, the current century has been warmer than any period of equivalent length in the previous three centuries
These changes are impacting on the distribution, condition and behaviour of wildlife. The Living with Environmental Change (now evolved into the Research & Innovation for our Dynamic Environment forum) project produced a series of report cards which detail the evidence for climate change and its impact on the environment. The terrestrial biodiversity climate change card evaluates the amount of, and strength of, evidence of climate change impact on terrestrial biodiversity. It complements the climate change impact report card produced by the Marine Climate Change Impacts Partnership.
The England Spring Index highlights a biological response to climate change and is calculated from the annual mean observation date of the following 4 biological events: first flowering of hawthorn (Crataegus monogyna), first flowering of horse chestnut (Aesculus hippocastanum), first recorded flight of an orange-tip butterfly (Anthocharis cardamines) and first sighting of a swallow (Hirundo rustica).
These 4 events were chosen for the following reasons:
- good England coverage
- well recognised and easily recorded species
- good historical data
- both early and later spring events are included
- the observations cover plants, a vertebrate, and an invertebrate
- a strong phenological response is observed
Until 2018 the overall index was compiled by calculating an annual mean across all sites where all 4 biological events were recorded. The figures published since 2015 are slightly different to those published previously as a result of data correction in the underpinning database. In order to include more data in the calculation, the method was changed in 2019 and the overall index was compiled by calculating an annual mean for each species using all available data and averaging these four means (see the Technical background document for further information). This new method of calculation has been applied to all previous years retrospectively.
The pre-1948 data were mostly collected by the Royal Meteorological Society (RMS). In 1998, the UK Centre for Ecology & Hydrology revived the UK Phenology Network (UKPN) in the UK, which was launched by the Woodland Trust as a web-based project in 2000. The UKPN has grown since its inception, and now records a series of events in both spring and autumn through the Nature’s Calendar project, which is currently funded by the People’s Postcode Lottery, Postcode Green Trust.
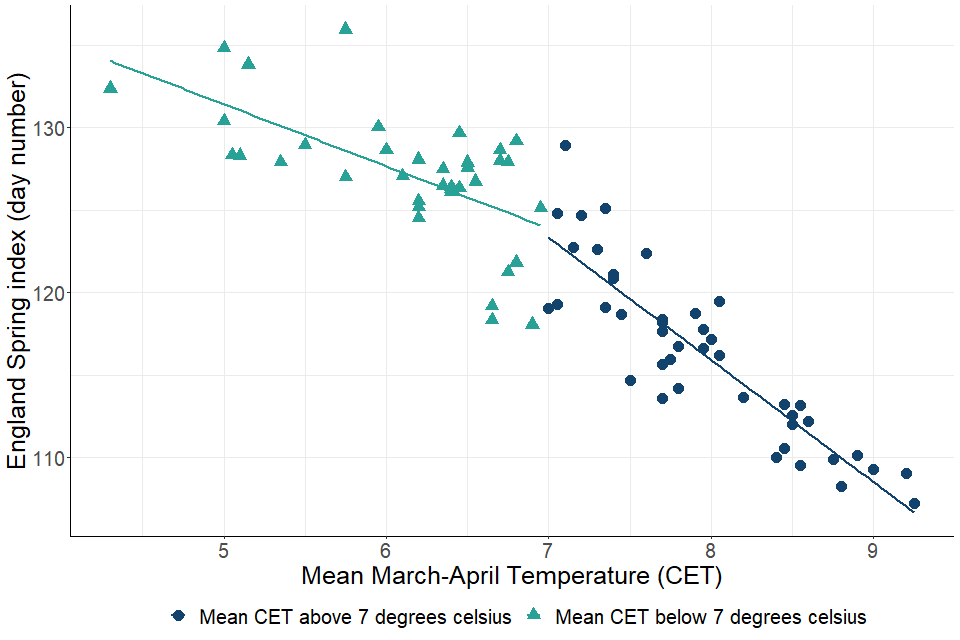
The average value of the Spring Index between 1998 and 2022 is 8.9 days earlier than the average value for 1891 to 1947. The index shows a strong relationship with mean temperature in March and April (Figure 18.2), and it advances more rapidly when the mean temperature equals or exceeds 7 degrees Celsius. The average advance in dates for the Spring Index is 3.8 days for every one degree Celsius below a mean March to April temperature of 7 degrees Celsius, and 7.4 days for every one degree Celsius above 7 degrees Celsius.
Figure 18.2: Relationship between Spring Index and Central England Temperature (CET), 1891 to 1947 and 1998 to 2022
Download the data for Figure 18.2 in ods format
Notes about Figure 18.2:
- Day number = number of days after 31 December (for example, day 121 = 1 May).
- CET = Central England Temperature series, in degrees Celsius.
- Source: 1891 to 1947 – Royal Meteorological Society, 1998 to 2022 – UK Phenology Network (Nature’s Calendar).
Web links for further information
- State of the UK Climate 2021
- IPCC Sixth Assessment Report
- NASA Global Climate Change
- WMO State of the Global Climate 2022
- BAMS State of the Climate In 2021
- Woodland Trust
- Nature’s Calendar
- Research & Innovation for our Dynamic Environment (RIDE) forum
- Biodiversity Climate Change Impacts Report Card 2015
- Marine Climate Change Impacts Report Card 2020
- Aichi Biodiversity Targets
- Kunming-Montreal Global Biodiversity Framework 2030 targets
- Biodiversity 2020: A strategy for England’s wildlife and ecosystem services
- Technical background document