6. Social cohesion - Community Life COVID-19 Re-contact Survey 2020
Published 8 December 2020
Applies to England

© Crown copyright 2020
This publication is licensed under the terms of the Open Government Licence v3.0 except where otherwise stated. To view this licence, visit nationalarchives.gov.uk/doc/open-government-licence/version/3 or write to the Information Policy Team, The National Archives, Kew, London TW9 4DU, or email: psi@nationalarchives.gov.uk.
Where we have identified any third party copyright information you will need to obtain permission from the copyright holders concerned.
This publication is available at https://www.gov.uk/government/statistics/community-life-covid-19-re-contact-survey-2020-main-report/6-social-cohesion-community-life-covid-19-re-contact-survey-2020
In the 2018-19 and 2019-20 Community Life Survey (referred to as wave 1) and Community Life Re-contact Survey (CLRS, referred to as wave 2) social cohesion is measured through social interactions, support networks and neighbourliness and how the pattern of these measures has changed since before the pandemic.[footnote 1]
This chapter examines both net and gross change in social cohesion measures between wave 1 and wave 2. Net change refers to the overall differences these measures at wave 1 and wave 2, while gross change refers to change at the level of the individual (see Glossary for further details).
6.1 How has frequency of contact with family and friends changed during the COVID-19 pandemic?
This section examines how often respondents communicated with family members and friends, excluding anyone they live with. It covers both net and gross changes between wave 1 (before the pandemic) and wave 2 (during the pandemic).
6.1.1 Net change in social interactions
In summary, the following net changes in social interactions were observed:
-
Almost half (48%) of wave 1 respondents reported that they met up in person with family or friends more than once a week. At wave 2, this proportion had fallen to around four in ten (38%). The percentage reporting that they ‘never’ met family and friends increased from 1% at wave 1 to 3% at wave 2.
-
However, the proportion of respondents using telephone, video or audio calls more than once a week to communicate with family or friends increased from 55% at wave 1 to 65% at wave 2. The proportion exchanging text messages or instant messages more than once a week increased from 73% at wave 1 to 80% at wave 2.
-
The proportion of respondents reporting that they were texting or instant messaging once a day or more increased from 51% at wave 1 to 59% at wave 2.
-
There was less change in longer-form written contact than the other types of contact. A quarter of wave 2 respondents (25%) reported that they emailed or wrote to family members or friends more than once a week, in line with the proportion at wave 1 (22%).
Figure 6.1: Frequency of different types of contact with family and friends (net change)
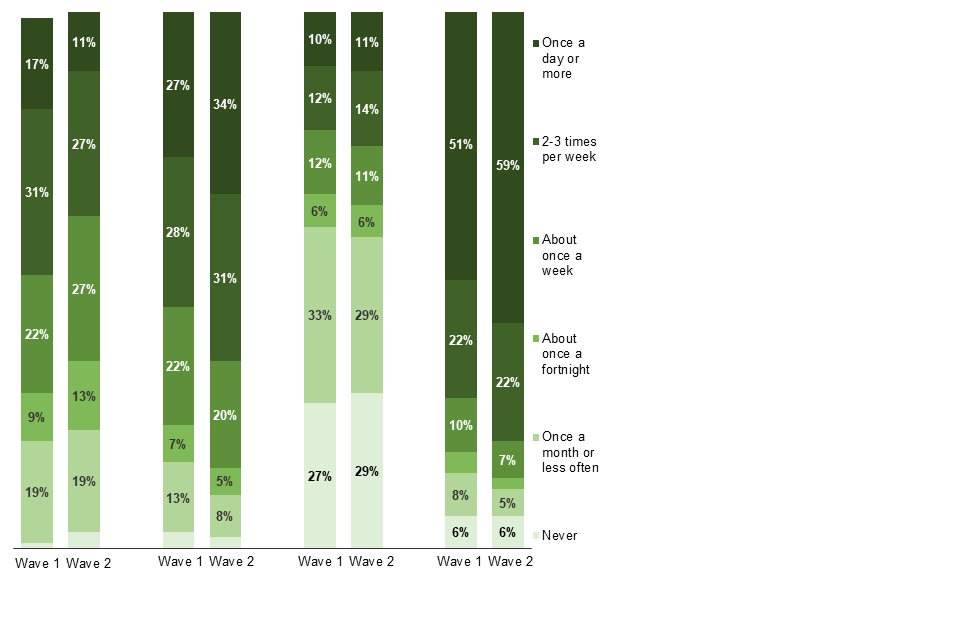
All respondents excluding don’t know and refused responses:
How often meet up in person with family members or friends – Wave 1 (2,810); Wave 2 (2,808); How often speak on the phone or video or audio call via the internet with family members or friends – Wave 1 (2,803); Wave 2 (2,810); How often email or write to family members or friends – Wave 1 (2,789); Wave 2 (2,806); How often exchange text messages or instant messages with family members or friends – Wave 1 (2,792); Wave 2 (2,807).
6.1.2 Gross change in social interactions
Examining gross change in social interactions provides an overall view of whether individuals were experiencing more or less frequent contact at wave 2 than they had at wave 1.
-
Almost four in ten (38%) reported that they had met up with friends and family in person less often at wave 2, while a quarter (27%) had met up more often.
-
Around four in ten respondents (43%) reported an increase in contact with friends or family by phone, video or audio call at wave 2, while around a quarter (23%) reported a decrease in such contact.
-
Overall, 34% reported no change in how often they emailed or wrote to family or friends at wave 2, 34% reported an increase and 32% reported a decrease in such contact.
-
Communication by text or instant messaging changed least of all contact methods, with slightly less than half (46%) of respondents reporting there had been no change in frequency, while a third (34%) reported more frequent texting or messaging at wave 2.
-
Around half of those aged 16-24 reported less frequent in-person contact (47%) at wave 2, a higher proportion than was seen amongst those aged 25+. However, there was an increase amongst this age group in the frequency of contact by phone, video or audio call (50%).
-
Around half of those who were unemployed or on unpaid leave (53%) reported an increase in contact by phone, video or audio call at wave 2. This was a higher proportion than was found amongst those who were economically inactive (41%).
-
Around four in ten respondents aged 55+ reported an increase in how often they exchanged text or instant messages with friends and family at wave 2 (39% for those aged 55-69 and 39% for those aged 70+). This was a higher proportion than was seen amongst those aged under 55.
Figure 6.2: Changes in frequency of different types of contact with family and friends between wave1 and wave 2 (gross change)
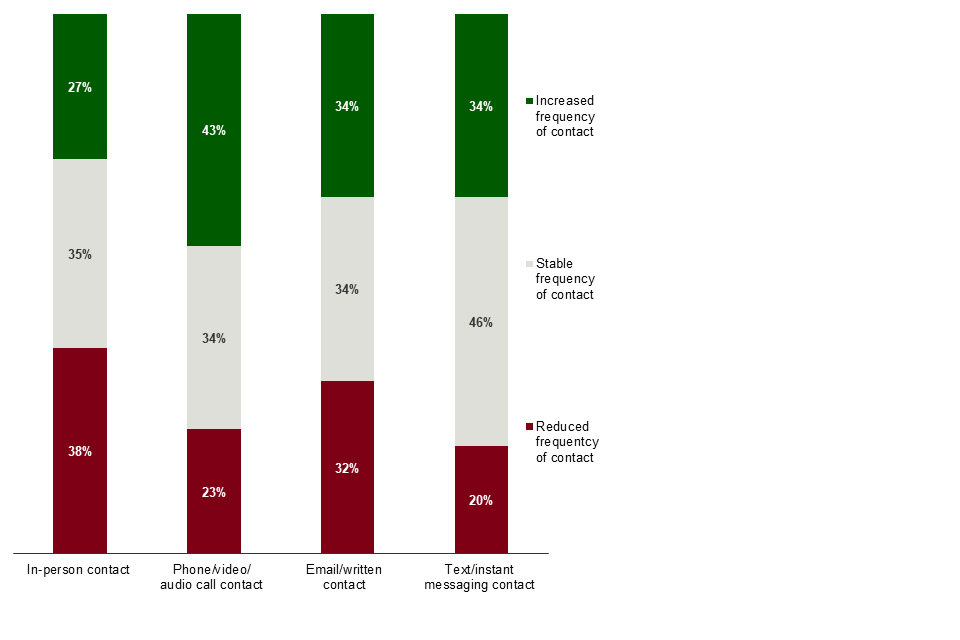
All respondents excluding don’t know and refused responses: in-person contact (2,806); phone/video/audio call contact (2,801); email/written contact (2,783); text/instant messaging contact (2,787).
6.2 How have perceptions of the availability of support and company changed during the COVID-19 outbreak?
6.2.1 Net change in availability of support and company
In summary, the following net changes were observed:
-
Overall, seven in ten (72%) wave 2 respondents definitely agreed that ‘if I needed help, there are people who would be there for me’ which is similar to the rate at wave 1 (70%). A further quarter of respondents at both waves tended to agree that this was the case (24% at wave 1 and 23% at wave 2) and only a small proportion disagreed (5% at wave 1 and 4% at wave 2).
-
A similar pattern was seen when respondents were asked how strongly they agreed or disagreed that ‘if I wanted company or to socialise, there are people I can call on’. Nine in ten agreed that this was the case at wave 1 (90% definitely agreed or tended to agree, while 57% definitely agreed) and there was a similar pattern at wave 2 (91% definitely agreed or tended to agree, while 60% definitely agreed).
6.2.2 Gross change in availability of support and company
Examining gross change in the perceived availability of support and company reveals that there was more change at an individual level than the relatively stable net change figures may suggest. Individual increases in agreement that support and company was available for some respondents were balanced against individual decreases in agreement among other respondents.
Focusing on the extent to which agreement or disagreement that ‘if I needed help, there are people who would be there for me’ had changed between wave 1 (before the pandemic) and wave 2 (during the pandemic):
-
72% of respondents at wave 2 gave the same response as at wave 1
-
Around one in six (16%) had become more likely to agree that this was the case
-
Around one in eight (12%) had become less likely to agree.
Examining the extent to which agreement or disagreement that ‘if I wanted company or to socialise, there are people I can call on’ had changed between wave 1 and wave 2:
-
Around two thirds of respondents (64%) at wave 2 gave the same response as at wave 1
-
One in five (20%) had become more likely to agree that this was the case
-
One in six (16%) had become less likely to agree.
Young people aged 16-24 saw more negative trends in their responses to these questions than those in all older age groups.
-
One in five (21%) 16-24-year olds had become less likely to agree that help was available if they needed it, compared to 8% of those aged 55-69 (the lowest level for any of the age groups).
-
Around a quarter (23%) of those aged 16-24 had become less likely to agree that company was available, compared to 14% of those aged 55-69 (also the lowest level for any age group). People living in more deprived areas also saw more negative trends in their responses to these questions than those in less deprived areas:
-
One in five (19%) respondents who lived in the 20% most deprived areas of England (LSOAs - see Glossary) had become less likely to agree that help was available if they needed it, a higher proportion than the 20% least deprived areas (9%).
-
Just over a fifth (22%) of those in the 20% most deprived areas (LSOAs) had become less likely to agree that company was available at wave 2, a higher proportion than the 20% least deprived areas (12%).
A fifth (22%) of ethnic minorities (excluding White minorities) had become less likely to agree that company was available at wave 2, a higher proportion than was found among those from a White background (15%).
Figure 6.3: Changes in agreement that help and company are available between wave 1 and wave 2 (gross change)
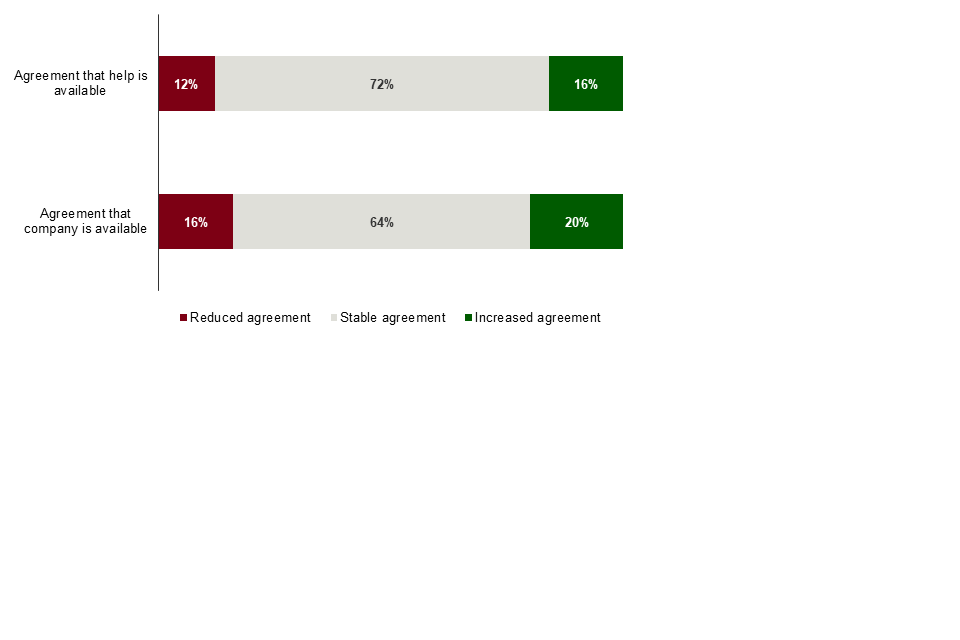
All respondents excluding don’t know and refused responses: agreement that help is available (2,808); agreement that company is available (2,800).
6.3 How has the frequency of neighbour conversations changed during the COVID-19 outbreak?
6.3.1 Net change in frequency of neighbour conversations
The proportion of respondents reporting that they chatted to their neighbours more than just to say hello, at least weekly, increased from 49% at wave 1 to 54% at wave 2.
However, the proportion reporting that they ‘never’ chatted to their neighbours remained static (12% at both waves).
Figure 6.4: Frequency of chats with neighbours (net change)
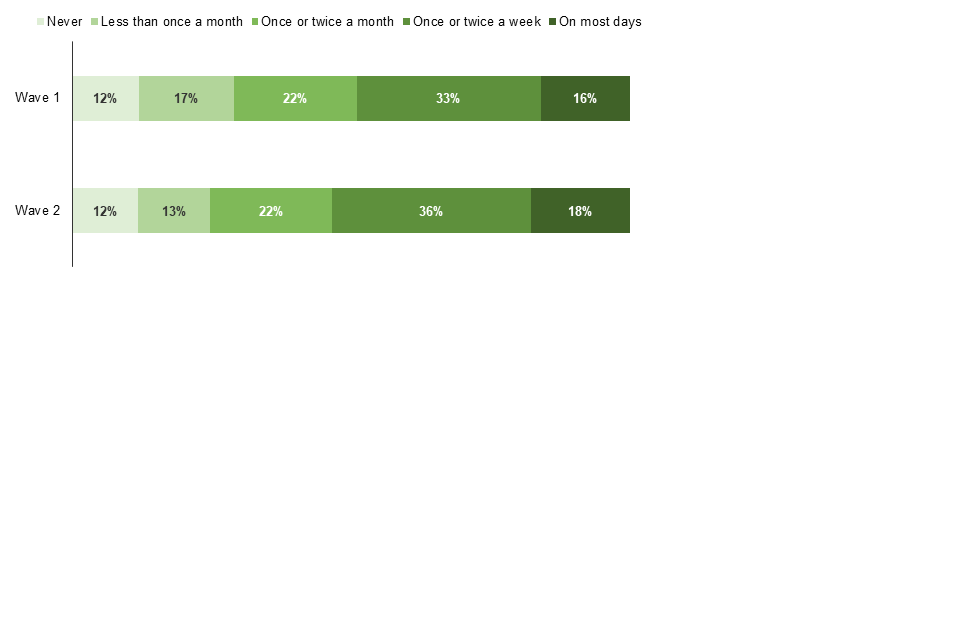
All respondents excluding don’t know and refused responses: Wave 1 (2,807); Wave 2 (2,809).
6.3.2 Gross change in frequency of neighbour conversations
Examining gross change in the frequency of neighbour conversations reveals that there was more change at an individual level than the net change figures may suggest. Individual increases in the frequency of conversations for some respondents were balanced against individual decreases in the frequency of conversations among other respondents.
-
Around one in twenty respondents reported that they had started chatting to their neighbours (6%) between waves 1 and 2.
-
The same proportion (6%) reported that they had stopped chatting to their neighbours altogether between waves 1 and 2.
-
A quarter (25%) reported an increase in the frequency of their conversations
-
Around one in six (17%) reported that they chatted less frequently with their neighbours at wave 2.
-
Around half (47%) indicated that there had been no change in the frequency of their conversations.
In terms of neighbour conversations, there was more movement among those aged 16-24 than among those from older groups, with around one in seven 16-24-year olds reporting that they had either started (15%) or stopped talking to their neighbours (15%).
A third of those aged 70+ (31%) reported that they had started chatting to neighbours more frequently, a higher proportion than was found among those aged 16-24 (13%).
One in eight (13%) ethnic minorities (excluding White minorities) had stopped talking to their neighbours at wave 2, a larger proportion than was found among those from a White background (4%).
Figure 6.5: Changes in frequency of chats with neighbours between wave 1 and wave 2 (gross change)
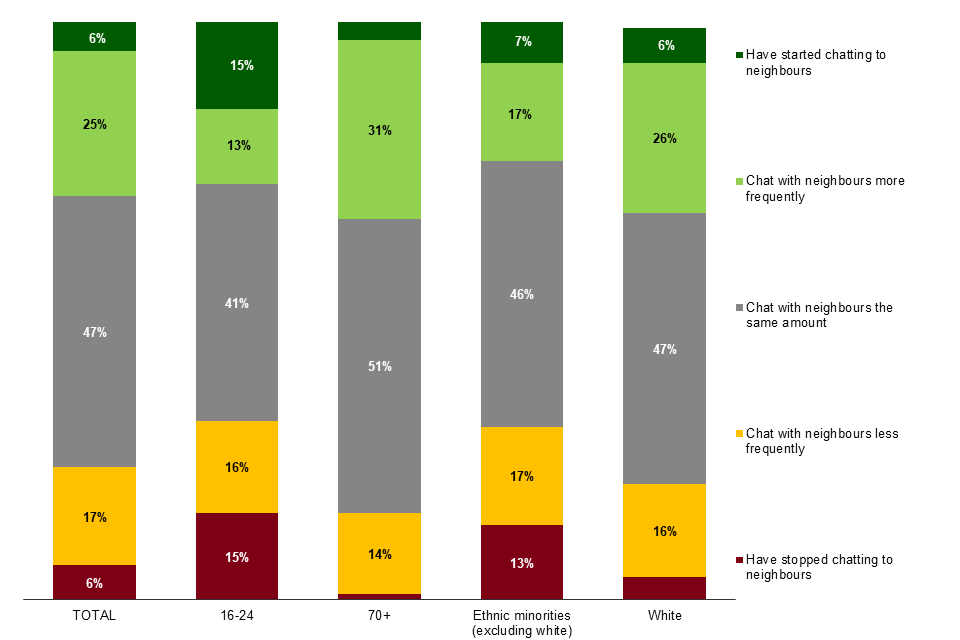
All respondents excluding don’t know and refused responses (2,804); 16-24 (194); 70+ (471); Ethnic minorities (excluding white) (307); White (2,457).
6.4 Have people become more or less comfortable about asking neighbours to pick up shopping for them during the COVID-19 pandemic?
Respondents were asked how comfortable or uncomfortable they would feel about asking their neighbour for help if they were ill and at home on their own and needed someone to collect a few shopping essentials.
6.4.1 Net change in comfort in asking a neighbour to pick up shopping
Overall, 56% said that they would feel either ‘very’ or ‘fairly’ comfortable asking for help with their shopping at wave 2, an increase from 48% at wave 1.
Conversely, the proportion of respondents reporting that they would feel ‘very uncomfortable’ in such a situation fell from 26% at wave 1 to 20% at wave 2.
Figure 6.6: Level of comfort if it was necessary to ask neighbour to collect shopping essentials (net change)
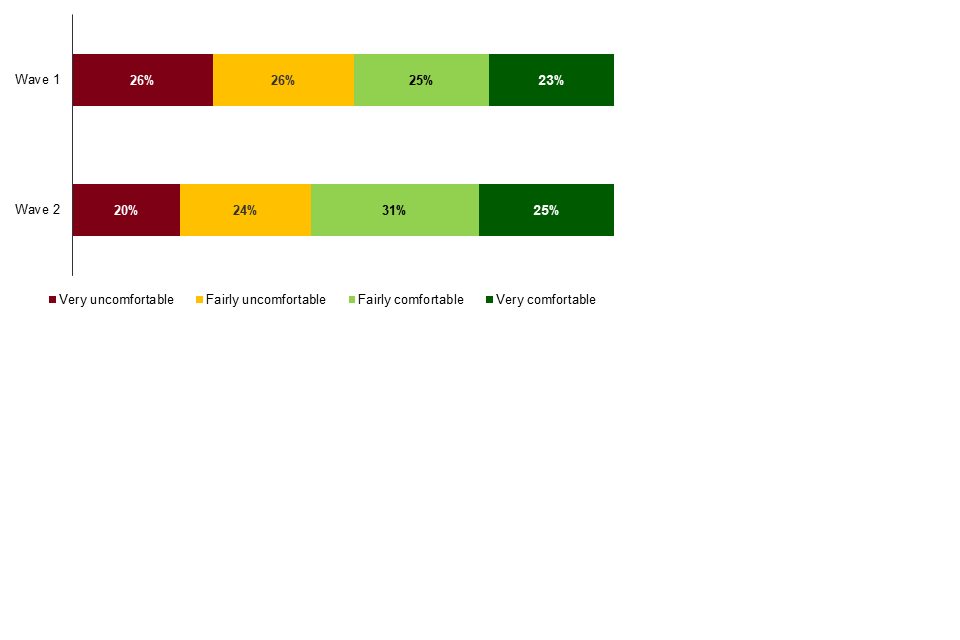
All respondents excluding don’t know and refused responses: Wave 1 (2,806); Wave 2 (2,801).
6.4.2 Gross change in comfort in asking a neighbour to pick up shopping for them
Examining gross change reveals more change at the individual level in how comfortable respondents felt asking a neighbour to pick up shopping for them than the net change shows. Increasing levels of comfort for some respondents were balanced against decreasing levels of comfort for others.
-
Around three in ten respondents (31%) had become more comfortable about asking their neighbours for help with their shopping at wave 2 than they had been at wave 1
-
Half (51%) reported no change in how they would feel about asking their neighbours for help with their shopping between waves 1 and 2
-
Around a fifth (18%) had become less comfortable about asking their neighbours for help with their shopping at wave 2 than they had been at wave 1
One quarter (24%) of ethnic minorities (excluding White minorities) had become less comfortable about asking for help at wave 2, a larger proportion than was found among those from a White background (17%).
Figure 6.7: Level of comfort if it was necessary to ask neighbour to collect shopping essentials (gross change)
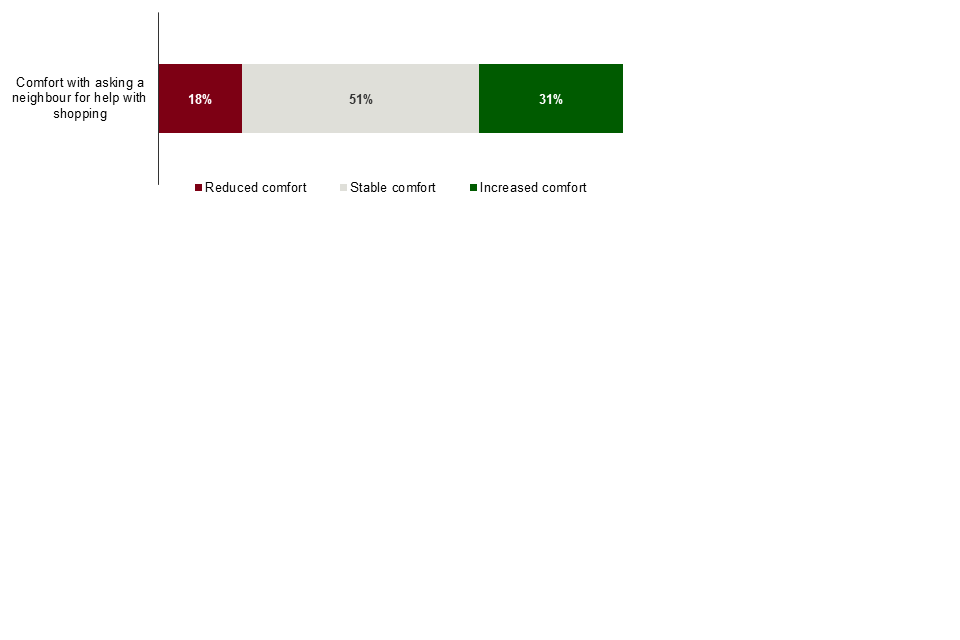
All respondents excluding don’t know and refused responses (2,795).
-
The CLRS also included questions on whether there is anyone that can be counted on to listen when respondents need to talk, the level of trust in other people who live in the neighbourhood, and whether people are doing more to help others since the start of the COVID-19 outbreak. However, the questions on these topics are not included in this report, as there is overlap with perceptions of availability of support, company, and levels of comfort which are already discussed in this chapter. Data relating to these questions is, however, available in the published data set. ↩